1h 2006 results - it.prysmiangroup.com · 2004a € 1,684m € 20.9m 27.3% 2005a € 1,879m €...
TRANSCRIPT

Draka’s first half-yearresults 2006

Summary
Building future growth
Financial Results 1H 2006
Results per Group
Financial position
Outlook 2006
First half-year results 2006 | 2
ProfileAgenda

Distribution in 1971
Summary
First half-year results 2006 | 3
Revenue growth 32.5%; volume growth of 9%, driven by Draka Cableteq and continued growth at Draka Comteq in the fibre market
EBIT excl. exceptionals more than tripled to € 39.1 million; Draka Cableteq’s results sharply up, Draka Comteq stable positive result
Operating working capital further reduced to 20.0% of revenues(1H 2005: 29.3%), despite higher raw material prices
Preference shares with nominal value of € 53.5 million extended forsix years. Shares reclassified so they qualify as shareholders equity
Outlook for 2006: continued volume growth on global cable marketanticipated. Draka expects operating result and net income (excluding non-recurring items) in 2H 2006 to at least equal 1H 2006
Distribution in 1971
First half-year results 2006 | 4
Building Future Growth
First half-year results 2006 | 5
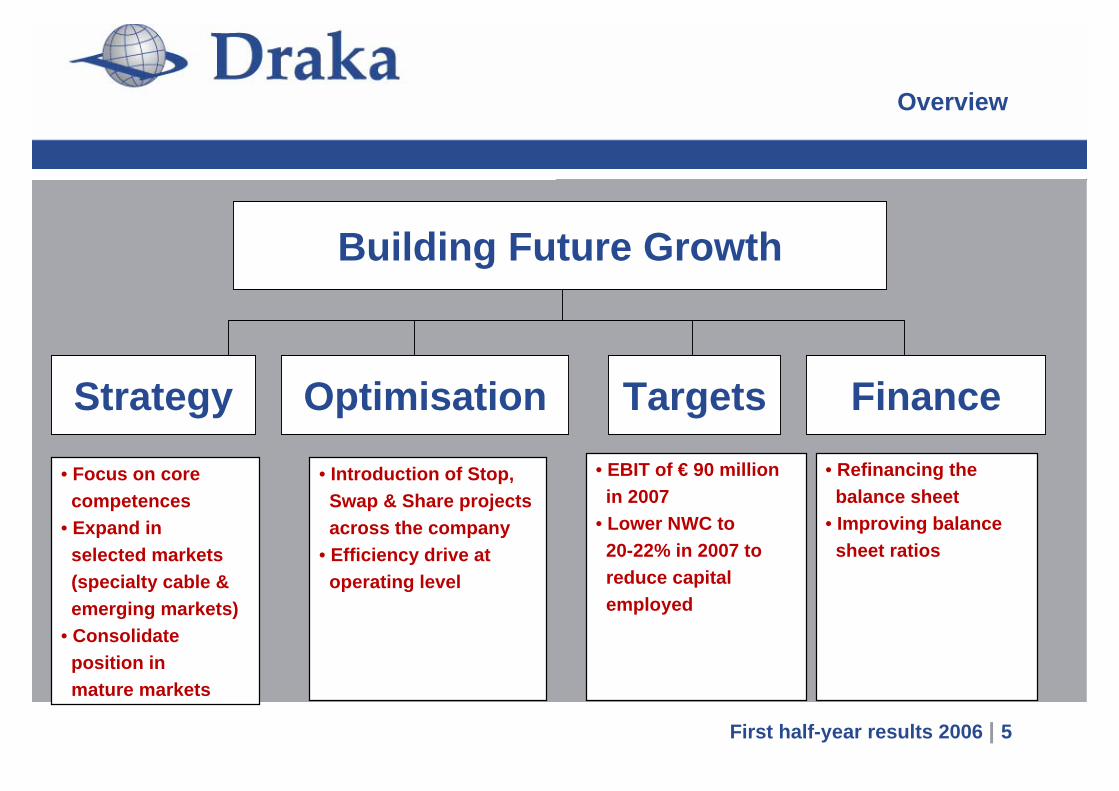
Building Future Growth
FinanceTargetsOptimisationStrategy
• Focus on corecompetences
• Expand inselected markets(specialty cable &emerging markets)
• Consolidateposition inmature markets
• Introduction of Stop,Swap & Share projectsacross the company
• Efficiency drive atoperating level
Overview
• EBIT of € 90 millionin 2007
• Lower NWC to20-22% in 2007 toreduce capitalemployed
• Refinancing thebalance sheet
• Improving balancesheet ratios

Distribution in 1971
First half-year results 2006 | 6
Building Future Growth: Twelve months later

Distribution in 1971
Facts &…
First half-year results 2006 | 7
StrategyAll insulated wire activities bought from International Wire Group, Inc. (USA).
Transport division strongly improves its position as world’s largest
independent cable manufacturer
Acquired stake of 29.9% in Oakwell Engineering Ltd. strengthening position
of Marine, Oil & Gas division in Far East
Organic growth: expanded position in China (Suzhou), opened new facilities
in Australia, Indonesia and Slovakia
Focus on core competences: divested three companies of which two non-
cable companies
Distribution in 1971
Facts &…
First half-year results 2006 | 8
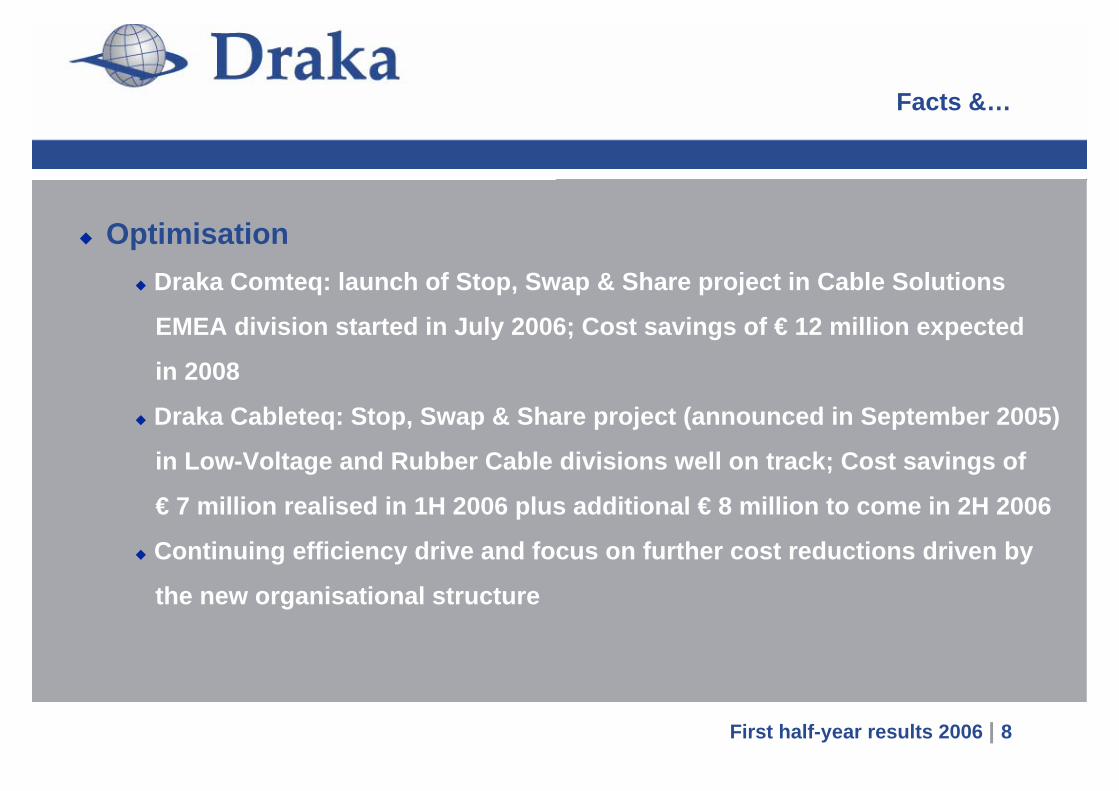
OptimisationDraka Comteq: launch of Stop, Swap & Share project in Cable Solutions
EMEA division started in July 2006; Cost savings of € 12 million expected
in 2008
Draka Cableteq: Stop, Swap & Share project (announced in September 2005)
in Low-Voltage and Rubber Cable divisions well on track; Cost savings of
€ 7 million realised in 1H 2006 plus additional € 8 million to come in 2H 2006
Continuing efficiency drive and focus on further cost reductions driven by
the new organisational structure

Distribution in 1971
…Figures
First half-year results 2006 | 9
Financial targets
RevenueOperating resultNWC as % of sales
2004A€ 1,684m€ 20.9m
27.3%
2005A€ 1,879m€ 37.6m
21.3%
2007Ec.€ 1,800m1
€ 90m~20-22%
2H 2005A€ 981m
€ 25.4m2
21.3%
1H 2006A€ 1,190m€ 39.1m2
20.0%
1 Based on copper prices of 30 August 2005 and portfolio of activities2 Excluding non-recurring items of € 23m negative in 2H 2005 and € 5m negative in 1H 2006

Distribution in 1971
…Figures
First half-year results 2006 | 10
20
x € m
10
304050
90
607080
EBIT 2H 20051
(Reported)
€ 25.4
Adjusted 2H 2005EBIT1
Cost savings1H 2006
(SSS)
Includes cost savingsof € 19m and efficiency
effect of € 3.5m in 2H 2005
1 Excluding non-recurring items of € 23m negative in 2H 2005
€ 28.8
EBIT adjusted forprice & volume effect
in 2H 2005(combined € 3.4m
negative)
Annualised 2005EBIT1
€ 57.6€ 7.0
€ 5.0
Efficiency effect1H 2006
€ 69.6
EBIT LTMexcl. price/volume
Target 2007
€ 90.0
Targets: Well on track to reach operating result of € 90 million in 2007 by internal measures
Gap € 20.4m;18 months to close

Distribution in 1971
…Figures
First half-year results 2006 | 11
FinanceFurther strengthening of balance sheet ratios by extending preference
shares with nominal value of € 53.5m for six years. Shares reclassified so
they qualify as shareholders’ equity (as from 15 August 2006)
Refinancing finalised in September 2005:
Successful issue of € 100 million 4% convertible bond
Buy back of € 48.6m of existing 5% convertible bond
Syndicated credit facility (€ 350 million) syndicated in the market

Distribution in 1971
First half-year results 2006 | 12
Financial results 1H 2006
Distribution in 1971
First half-year results 2006 | 13
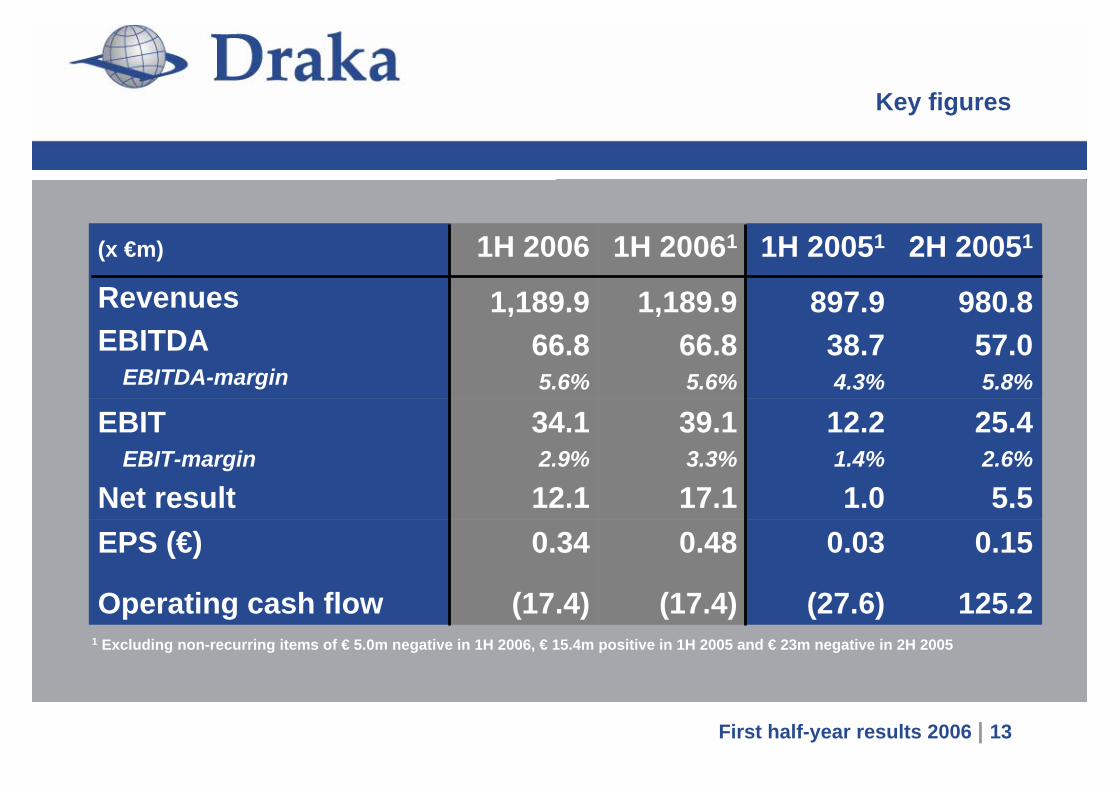
1 Excluding non-recurring items of € 5.0m negative in 1H 2006, € 15.4m positive in 1H 2005 and € 23m negative in 2H 2005
0.34
(17.4)
34.12.9%
12.1
1H 2006
1,189.966.85.6%
0.48
(17.4)
39.13.3%
17.1
1H 20061
1,189.966.85.6%
0.03
(27.6)
12.21.4%
1.0
1H 20051
897.938.74.3%
0.15
125.2
25.42.6%
5.5
2H 20051
980.857.05.8%
EPS (€)
Operating cash flow
EBITEBIT-margin
Net result
(x €m)
RevenuesEBITDA
EBITDA-margin
Key figures

First half-year results 2006 | 14
Financing cost
Explanation financing costs (cash & non cash)
+0.8+0.8Alcatel put9.49.4Interest costs
TotalNon cashCash(x €m)
20.11.918.2Total
4.64.6Preference dividend
1.81.31.3
1.8Convertible bond 2010 (€ 87m)
InterestIFRS (3%)
2.41.41.4
2.4Convertible bond 2007 (€ 91m)
InterestIFRS (3%)
Distribution in 1971
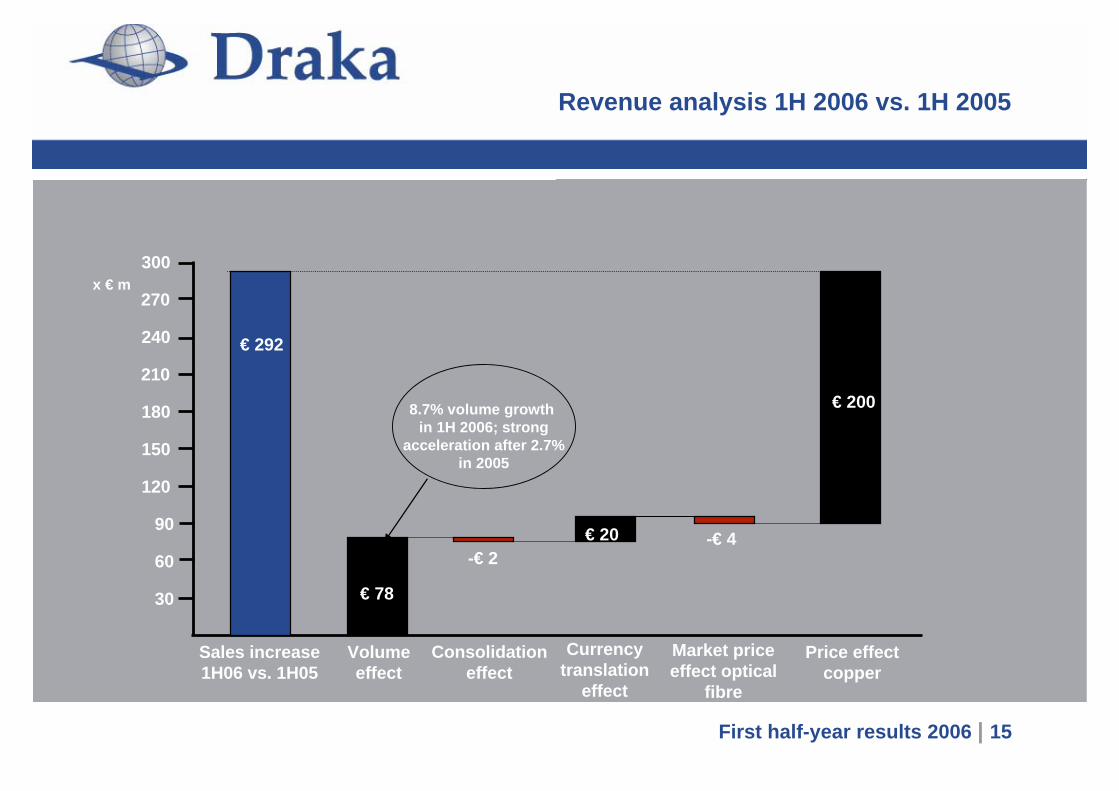
Revenue analysis 1H 2006 vs. 1H 2005
First half-year results 2006 | 15
Sales increase1H06 vs. 1H05
Consolidationeffect
Volumeeffect
Currencytranslation
effect
Market priceeffect optical
fibre
Price effectcopper
30
120
90
150
180
60
270
240
210
300
-€ 4€ 20
€ 200
€ 292
x € m
-€ 2
€ 78
8.7% volume growthin 1H 2006; strong
acceleration after 2.7%in 2005

Distribution in 1971
First half-year results 2006 | 16
Copper price development 2000-1H 2006
1,00
2,00
3,00
4,00
5,00
6,00
7,00
2000 2000 2000 2001 2001 2002 2002 2002 2003 2003 2004 2004 2005 2005 2005 2006
Euro
Average copper pricein 1H 2006: € 4.92
Copper price4 September: € 5.92
Average copper pricein 1H 2005: € 2.59
Increase of the averagecopper price: 89.7%

Distribution in 1971
EBIT analysis 1H 2006 vs. 1H 2005
First half-year results 2006 | 17
EBIT 1H 20051 Consolidationeffect & others
Volumeeffect
Cost savings Price effectOptical fibre
Price effectCopper cable
30
20
10
40
50
€ 25.2
€ 3.0
-€ 4.1-€ 9.2
1Excluding non-recurring items of € 5.0m negative in 1H 2006 and € 15.4m positive in 1H 2005
€ 12.2
EBIT 1H 20061
€ 39.1
x € m
60
70
€ 12.0
Divided by € 7m fromthe SSS project in
Draka Cableteq and € 5mof efficiency
improvements
Distribution in 1971
First half-year results 2006 | 18
Results per Group

Distribution in 1971
First half-year results 2006 | 19
Revenue growth 32.5%: accelerated volume growth (8.7%) & copper priceimpact (21.8%)
EBIT more than tripled, driven by cost savings and efficiency drive
1 Excluding non-recurring items of € 5.0m negative in 1H 2006, € 15.4 positive in 1H 2005 and € 23m negative in 2H 2005
(4.9)(7.6)(7.5)---Others
29.228.545.1715.1664.8915.2Draka Cableteq
Total
Draka Comteq
(x €m)
980.8
265.7
2H05
25.412.239.1897.91,189.6
1.1(8.7)1.5233.1274.4
2H0511H0511H0611H051H06
EBITRevenue
Revenue & EBIT

Distribution in 1971
Draka Cableteq
First half-year results 2006 | 20
Considerable organic revenue growth of 38.3% in 1H 2006
EBIT growth accelerated further to 58.2% in 1H 2006
Volume growth, better product mix and cost control contributed to improved results; Negative impact from higher raw material prices mitigated by reducing delay in passing on price increases to clients
x € m
200
1,250
1,000
600
400
800
1H 2005 2H 2005
Revenue
€ 915
EBIT1
1H 2005 2H 2005
€ 28.5
2.5
3.0
3.5
4.5
4.0
5.0%
4.1%4.3%
1 Excluding non-recurring items
38.3%Organic growth
x € m
10
20
30
40
50
60
€ 715€ 665
1H 2006 1H 2006
€ 29.2 € 45.1
4.9%

Distribution in 1971
Draka Cableteq – Main topics
First half-year results 2006 | 21
Market circumstances in low-voltage cable improved; Special-purpose cable segment maintained its healthy growth
Position in emerging markets and specialty cable segment expanded by the acquisition of insulated cable activities from IWG
All divisions contributed to the results, with the low-voltage cable activities achieving the most progress
Sharp increase in raw material prices had limited impact onmargins; lower impact was realised by increased focus on passing on price increases to customers
Successful completion of the first step of the Stop, Swap & Share project. Achieved cost savings € 7 million in 1H 2006, additional € 8 million expected in 2H 2006

Distribution in 1971
Draka Comteq
First half-year results 2006 | 22
Organic growth recorded of 16.8%
Draka Comteq reports a stable positive result of € 1.5 million
Volume growth and ongoing cost reductions contributed to the underlying results; lower average selling prices and higher raw material prices continued to depress results
x € m
50
300
250
150
100
200
1H 2005 2H 2005
Revenue
€ 274
EBIT1
1H 2005 2H 2005
€ (8.7)
-3.0
-2.0
-1.0
2.0
1.0
%
0.4%
(3.7)%
1 Excluding non-recurring items
16.8%
Organic growth x € m
-10
-5
5
10
€ 266€ 233
1H 20061H 2006
€ 1.1 € 1.5
0.5%0

Distribution in 1971
Draka Comteq – Main topics
First half-year results 2006 | 23
Communication cable market experienced strong growth in single mode fibre segment (20%) and healthy performance in data communication cable (4.5%)
Draka Comteq maintained its leadership position in Europe and China and gained further market share in the US
Stop, Swap & Share programme announced (29 June 2006) in Cable Solutions EMEA division. Implementation is on schedule. Provision of € 25 million is formed of which € 5.0 million (impairment) is taken in 1H 2006. Annual cost savings, estimatedat c.€ 12 million, will be realised in full in 2008
New manufacturing facility in Presov (Slovakia) opened in order to meet growing demand for copper data communication products

Distribution in 1971
First half-year results 2006 | 24
Financial position

Distribution in 1971
Main topics
First half-year results 2006 | 25
Cash flow from operating activities improved to € (17) million from€ (28) million driven by more than tripling of operating result and smaller seasonal increase in operating working capital
Operating working capital further reduced to 20.0% of revenue(2004: 29.4%), despite 90% increase in average copper price
Shareholder’s equity increased by € 53.5 million on 15 August 2006 due to change in conditions of preference shares (A); term is six years and dividend is 7.11%
Net interest-bearing debt (excl. preference shares, incl. subordinated convertible bonds at nominal value) showed modest increase of € 43 million

Distribution in 1971
First half-year results 2006 | 26
1 Excluding non-recurring items of € 5m negative in 1H 2006, € 15.4m positive in 1H 2005 and € 7.1m negative in FY 2005
6
(17)(9)
(14)(40)
46
3928
(65)(19)
1H 2006
1
(28)(9)
8(29)
30
1227
(27)(40)
1H 2005
(19)Net cash flow
98(9)
(20)69
(88)
Operating cash flowDividendCF from InvestmentsFree cash flowCF from Financing
385855
(53)
EBIT1
DepreciationWorking capitalOthers (interest, tax, provisions)
FY 2005(x €m)
Cash flow statement
Distribution in 1971
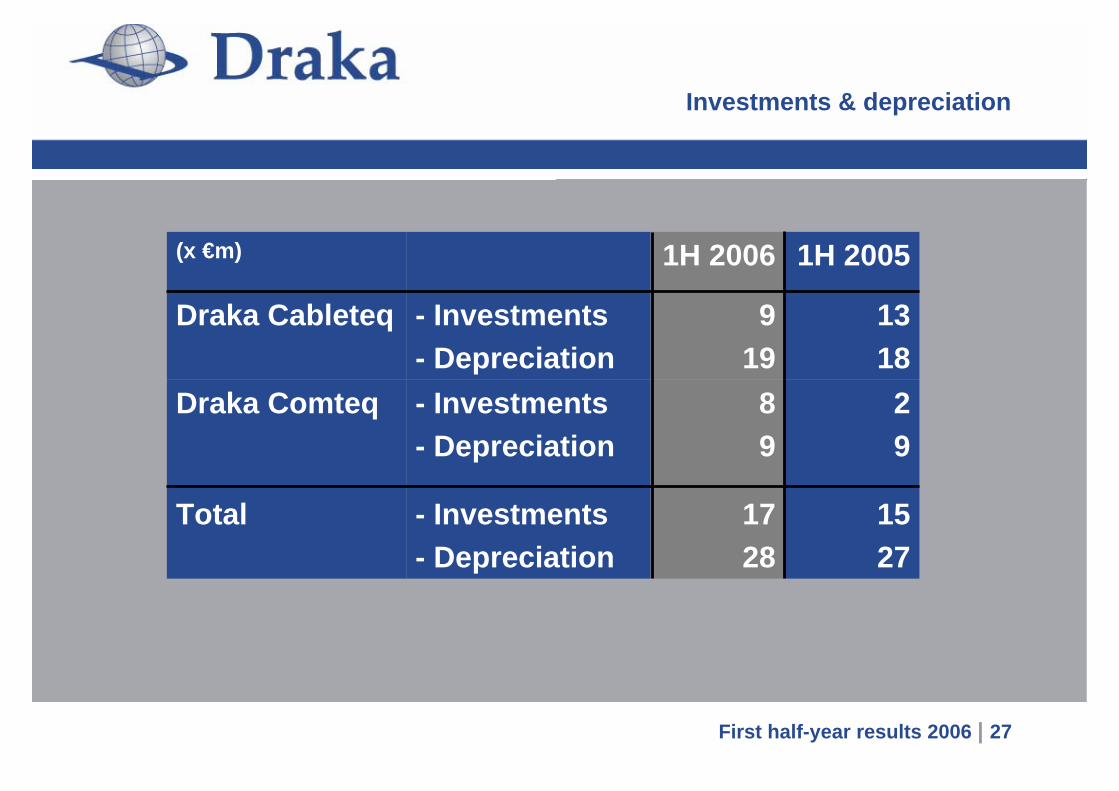
Investments & depreciation
First half-year results 2006 | 27
Draka Comteq
Total
Draka Cableteq
(x €m)
29
1527
89
1728
- Investments- Depreciation
- Investments- Depreciation
1318
919
- Investments- Depreciation
1H 20051H 2006

Distribution in 1971
Balance sheet ratios
First half-year results 2006 | 28
Solvency & guarantee capital decreased, while net gearing increased;all fully explained by financing (seasonal) increase operating working capital
0%5%
10%15%20%25%30%35%40%45%
FY 2004 1H 2005 FY 2005 1H 2006
Solvency Guarantee capital
0%20%40%60%80%
100%120%140%
FY 2004 1H 2005 FY 2005 1H 2006
Net gearing

Distribution in 1971
First half-year results 2006 | 29
435400465 449 418 527547 404
32,1%31,0% 31,5%
28,0%
29,4%
20,0%21,3%
27,3%
28,4%
0
100
200
300
400
500
600
1H 2002 FY 2002 1H 2003 FY 2003 1H 2004* FY 2004* 1H 2005* FY 2005* 1H 2006*15%
17%
19%
21%
23%
25%
27%
29%
31%
33%
NWC NWC as % of revenues (RH-scale)
Operating working capital
* Adjusted to IFRS
404
x €m
• Inventory reduced from 75 days in June 2005 to 69 days in June 2006• Payment period with customers shortened from 82 days in June 2005 to 77 days in June 2006• Payment period with suppliers increased from 50 days in June 2005 to 73 days in June 2006

Distribution in 1971
First half-year results 2006 | 30
20,4
101,3
21,0
59,7
-10,7
-27,6
-2,8
-17,4
125,2
618
557
393
624
454
690
562
329286
-40
-20
0
20
40
60
80
100
120
140
1H 2002 2H 2002 1H 2003 2H 2003 1H 2004* 2H 2004* 1H 2005* 2H 2005* 1H 2006*
250
300
350
400
450
500
550
600
650
700
750
Operating cash flow Net debt (RH-scale)
Operating cash flow & Net interest-bearing debt
x €mx €m
*Adjusted to IFRSNet debt: all figures excluding preference shares incl. convertible bonds at nominal value
Distribution in 1971
First half-year results 2006 | 31
Outlook for 2006

Distribution in 1971
Draka Cableteq
First half-year results 2006 | 32
Positive market conditions in Western-Europe anticipated tocontinue; Asia and US expected to outperform European marketdemand
Continued volume growth expected, albeit at a lower pace thanin 1H 2006; growth anticipated to be driven by both specialtysegment and low-voltage segment
Continued management focus to address volatile raw materialprices
Succesful completion of first step Stop, Swap & Share project; additional cost savings of € 8 million expected in 2H 2006
Distribution in 1971
Draka Comteq
First half-year results 2006 | 33
Further growth in demand for communication cable expected; ongoing good performance in fibre market and small recovery in copper telecom compared to 1H 2006
Market for single mode fibre expected to grow by c.10-15% in 2H 2006 driven by US and Asian markets
Sustained pressure on selling prices
Important first steps in implementation of Stop, Swap & Share project within Draka Comteq’s Cable Solutions EMEA division

Distribution in 1971
Draka Group
First half-year results 2006 | 34
Draka expects that, barring unforeseen circumstances, its operating result and net income (excl. non-recurring items) in 2H 2006 will at least equal 1H 2006 figures.
Objectives for 2006 in accordance with Draka’s strategic focus:
Further strengthening of marketing organisations with emphasis on special-purpose
cable segment with the aim of stimulating organic growth
Continuation of policy to strengthen Draka’s organisation in general
Ongoing investment in R&D: emphasis on product innovation
Continuation of programmes aimed at greater focus at production facilities
Stabilising operating working capital ratio at level (20-22%)
Achievement of optimum free cash flow. Investments expected of c.€ 45 million,
around 80% of depreciation

Distribution in 1971
First half- year results 2006 | 35
Invitation for Draka’s factory visit 2006
When: Tuesday, 31 October
Where: Draka’s Low Voltage Cable activities (Emmen, Holland)
Who: Analysts, journalists and institutional investors
What time: 11.00h-16.00h

Distribution in 1971
First half- year results 2006 | 36
Q & A