1997 evaluation utilities pennsylvania public utility ... · in spite of the fact that the...
TRANSCRIPT


1997 Utility Consumer Activities Report and
Evaluation
Electric, Gas, Water & Telephone Utilities
Pennsylvania Public Utility Commission

The Pennsylvania Public Utility Commission
(Left to right) Commissioner David W. Rolka, Vice Chairman Robert K. Bloom, Commissioner Nora Mead Brownell, Chairman John M. Quain and Commissioner Aaron Wilson, Jr.
Table of Contents
Letter of Introduction 1. Consumer Contacts to the BCS ...................................................... 1 Charts and Tables Consumer Rating of the BCS’ Service .............................................. 3 Total Volume of Consumer Complaints and Payment Arrangement Requests to the BCS in 1997 .............................. 4 1996-1997 Consumer Complaints By Industry ................................. 5 1996-1997 Payment Arrangement Requests By Industry .................. 7 1997 Contacts to the Competition Hotline ........................................ 10 2. Performance Measures ...................................................................................... 12 Consumer Complaint Rate ............................................................................... 12 Justified Consumer Complaint Rate ................................................................ 12 Response Time to Consumer Complaints ............................................ 13 Payment Arrangement Request Rate ............................................................... 14 Justified Payment Arrangement Request Rate ................................................ 14 Response Time to Payment Arrangement requests ......................................... 15 Infraction Rate ................................................................................................. 15 Termination Rate ............................................................................................. 16 3. Electric Industry ................................................................................................. 18 Consumer Complaints Consumer Complaint Categories - 1997 Major Electric Utilities ...... 19 1997 Consumer Complaint Rates/Justified Consumer
Complaint Rates for Major Electric Utilities ............................ 20 Justified Consumer Complaint Rates for Major Electric
Utilities 1996-1997 ..................................................................... 21 1996-1997 Response Time to Consumer Complaints:
Major Electric Utilities ............................................................... 22 Payment Arrangement Requests
1997 Payment Arrangement Request Rates/Justified Payment Arrangement Request Rates for Major Electric Utilities .................................................................. 23 1996-1997 Justified Payment Arrangement Request Rates for Major Electric Utilities ......................................................................... 24 Response Time to 1996-1997 Payment Arrangement Requests
Major Electric Utilities .............................................................. 25

Termination of Service Residential Service Terminations/Termination Rates:
Major Electric Utilities ................................................................... 26 Compliance ................................................................................................... PUC Infraction Rates: Major Electric Utilities .................................. 28 4. Gas Industry .... ................................................................................................... 29 Consumer Complaints Consumer Complaint Categories - 1997 Major Gas Utilities .......... 30 1997 Consumer Complaint Rates/Justified Consumer Complaint Rates for Major Gas Utilities .................................................... 31 Justified Consumer Complaint Rates for Major Gas Utilities 1996-1997 .................................................................... 32 1996-1997 Response Time to Consumer Complaints: Major Gas Utilities .................................................................... 33 Payment Arrangement Requests 1997 Payment Arrangement Request Rates/Justified Payment Arrangement Request Rates for Major Gas Utilities .................. 34 1996-1997 Justified Payment Arrangement Request Rates for Major Electric Utilities ....................................................................... 35
1996-1997 Response Time to Payment Arrangement Requests: Major Gas Utilities .................................................................. 36
Termination of Service Residential Service Terminations/Termination Rates: Major Gas Utilities .................................................................. 37
Compliance PUC Infraction Rates: Major Gas Utilities ........................................... 38 5. Water Industry . ................................................................................................... 39 Consumer Complaints Consumer Complaint Categories - 1997: Major Water Utilities ........ 42 1997 Consumer Complaint Rates/Justified Consumer
Complaint Rates for Major Water Utilities .......................................... 43 Justified Consumer Complaint Rates for Major Water
Utilities 1996-1997 ............................................................................... 44 1996-1997 Response Time to Consumer Complaints: Major Water Utilities ................................................................. 45

Payment Arrangement Requests 1997 Payment Arrangement Request Rates/Justified Payment Arrangement Request Rates for Major Water Utilities ............... 46 1996-1997 Justified Payment Arrangement Request Rates for Major Water Utilities ........................................................................... 47
1996-1997 Response Time to Payment Arrangement Requests: Major Water Utilities .................................................................. 48
Compliance PUC Infraction Rates: Major Water Utilities ....................................... 49 6. Telephone Industry ............................................................................................. 50 Consumer Complaints Consumer Complaint Categories - 1997 Major
Telephone Utilities ...................................................................... 51 1997 Consumer Complaint Rates/Justified Consumer Complaint Rates for Major Telephone Utilities .......................................... 52 Justified Consumer Complaint Rates for Major Telephone
Utilities 1996-1997 ..................................................................... 53 1996-1997 Response Time to Consumer Complaints: Major Telephone Utilities ......................................................... 54 Payment Arrangement Requests 1997 Payment Arrangement Request Rates/Justified Payment Arrangement Request Rates for Major Telephone Utilities ...... 56
1997 Response Time to Payment Arrangement Requests: Major Telephone Utilities ......................................................... 57
Termination of Service Residential Service Terminations/Termination Rates: Major Telephone Utilities ......................................................... 58
Compliance PUC Infraction Rates: Major Telephone Utilities ................................ 60 7. Utility Universal Service and Energy Conservation Programs ................................................................................ 61 Electric, Gas & Water Programs Customer Assistance Programs (CAPs) ............................................... 62 Dollar Share .......................................................................................... 65 A Helping Hand .................................................................................... 65 Low-Income Rate ................................................................................. 66 CARES Programs ................................................................................. 66 Low Income Usage Reduction Programs (LIURP) .............................. 69 Utility Hardship Fund Programs ........................................................... 70

Telephone Universal Service Programs Link-Up America .................................................................................. 74 Lifeline Service .................................................................................... 74 Bell’s Lifeline & Universal Telephone Assistance Program (UTAP) ............................................................................... 75 8. Other Consumer Activities of the Commission ............................................. 76 Office of Communications/Consumer Education............................................ 76 The PUC Consumer Advisory Council ........................................................... 80 Pennsylvania Relay Service Advisory Board .................................................. 83 9. Quality of Service Benchmarking ................................................................... 88 Glossary of Terms . ................................................................................................... 90 Appendices A. Classification of Complaints 1. Electric, Gas & Water ............................................................................... 95 2. Telephone ...... ........................................................................................... 97 B. Consumer Complaint Categories: 1997 Table 1 - Major Electric................................................................................... 99 Table 2 - Major Gas ......................................................................................... 100 Table 3 - Major Water ..................................................................................... 101 Table 4 - Major Telephone .............................................................................. 102 C. 1996-1997 Residential Consumer Complaint Statistics Table 1 - Major Electric................................................................................... 103 Table 2 - Major Gas ......................................................................................... 104 Table 3 - Major Water ..................................................................................... 105 Table 4 - Major Telephone .............................................................................. 106 D. 1996-1997 Response Time: Consumer Complaints ......................................... 107 E. 1996-1997 Residential Payment Arrangement Request Statistics Table 1 - Major Electric................................................................................... 108 Table 2 - Major Gas ......................................................................................... 109 Table 3 - Major Water ..................................................................................... 110 Table 4 - Major Telephone .............................................................................. 111 F. 1996-1997 Response Time: BCS Payment Arrangement Requests ................. 112

G. 1996-1997 Infraction Statistics Table 1 - Major Electric................................................................................... 113 Table 2 - Major Gas ......................................................................................... 114 Table 3 - Major Water ..................................................................................... 115 Table 4 - Major Telephone .............................................................................. 116 H. 1997 CAP Participant Payment Rate .................................................................. 117 I. Customer Assistance Programs: 1997 Evaluations .......................................... 118 J. CARES Programs Table 1 - Major Electric Utilities ..................................................................... 121 Table 2 - Major Gas Utilities ........................................................................... 122 K. LIURP Spending .... ........................................................................................... 123 L. LIURP Production Levels .................................................................................. 124 M. Utility Hardship Funds ....................................................................................... 125 N. PUC Consumer Advisory Council Members ..................................................... 126 O. Pennsylvania Relay Service Advisory Board Members ..................................... 127 P-1. County Distribution of Consumer Complaints (Electric and Telephone) ................................................................................. 128 P-2. County Distribution of Payment Arrangement Requests (Electric and Telephone) ................................................................................. 129 P-3. Pennsylvania Counties: Households, Income, and Poverty ............................... 130 Consumer Access to the PUC....................................................Inside Back Cover

To Our Report Readers: The Commission is pleased to present the 1997 Utility Consumer Activities Report and Evaluation: Electric, Gas, Water and Telephone Utilities that was prepared by the Bureau of Consumer Services (BCS). You may remember that last year, in recognition of Pennsylvania’s emerging competitive environment for utilities, we revamped the report format to adapt to and accommodate the changes that will accompany competition. We promised that readers would see more changes in future reports. This year, for the first time in nine years, we have presented information about the electric, gas, water and telephone industries into one comprehensive report. From 1989 through 1997, we produced two separate reports: one focusing on the electric, gas and water industries and one focusing on the telephone industry. Those of you who are familiar with the reports from previous years will notice that we have made some changes to accommodate the above revision. In Chapter 2 you will find an explanation of the measures the BCS uses to judge the performance of the major electric, gas, water and telephone companies. Chapter 3 focuses exclusively on the electric industry; Chapter 4 focuses on the gas industry and Chapters 5 and 6 detail findings of the water industry and the telephone industry, respectively. The remaining chapters present information and discussion that include all of the industries. We believe that this year’s report continues to meet the BCS’ goals: to satisfy the statutory reporting requirements of 66 Pa. Code §308 and to communicate to the Commission, the public and to utility management how utilities under the Commission’s jurisdiction performed in 1997. We would like to point out that although the location of the various performance measures changed from last year’s report, the presentation did not. As with last year’s report, this report graphically represents performance through the presentation of industry tables. Thus, the report should continue to be a valuable resource to consumers in that it will allow them to review their local utility’s customer service performance for 1996 and 1997. The Bureau of Consumer Services believes that top utility management will again value the year-to-year comparison of their utility’s statistics as well as the comparisons between their utility and other utilities within their industry. Our intention is to use this same format in the future to incorporate the inclusion of the new entrants that will be providing utility service to Pennsylvania’s consumers. Less than half of the consumer complaints brought to the attention of the BCS were mishandled by the utility. In other words, in spite of the fact that the utility had properly followed the Commission’s procedures and rules in handling the consumer’s complaint, the customer appealed to the Commission. In these instances, the Commission has upheld the utility’s actions.

A new addition to this year’s report is a discussion of consumer contacts to the Commission’s Competition Hotline. The Commission established the center in May 1997 to answer consumers’ questions about competition. You will find this discussion on page 9 of the report. Much of the discussion and data in this report are based solely on consumer contacts to the BCS and as such, may or may not represent broad statistical trends. The level of activity for a particular utility or geographical area may be influenced by a number of factors such as increased marketing, media visibility, demographics, weather and regional activity. Appendix P provides a review of certain consumer contacts to the BCS by geographic area. This information is valuable because it illustrates the areas in Pennsylvania that are responsible for generating the most consumer complaints about electric and telephone utilities. We used the electric and telephone industries because the Commission has jurisdiction over the vast majority of the electric service and all telephone service in each county. Regulated gas and water service are not available in each county. Appendix P also includes Pennsylvania demographic data by county which indicates areas of poverty and low median incomes. Pennsylvania consumers continue to face unprecedented changes within the utility arena. The Commission is committed to assuring that these transformations are in the public interest. Because the data in this report stems almost exclusively from the evaluation of consumer contacts to the Commission, the data has certain shortcomings. The Commission has plans to address these shortcomings in the future. We recently developed regulations at 52 Pa. Code Chapter 54.151-156 that require quality of service reporting from the electric distribution companies (EDCs). The first EDC reports are due to the Commission in 1999. This reporting is designed to capture a more comprehensive picture of the quality of service consumers receive from their EDCs. The EDCs are to report their telephone access rates and other statistics that pertain to various aspects of customer service performance. The regulations require the Commission to produce and make public a report on EDC performance, using the data the EDCs provide to the Commission. We may incorporate the EDC supplied data into this report beginning in the year 2000. We hope you find this year’s report informative and invite your suggestions and comments. Sincerely, John M. Quain, Chairman Mitch Miller, BCS Director Pennsylvania Public Utility Commission

1. Consumer Contacts to the BCS
The Bureau of Consumer Services (BCS) was mandated under Act 216 of 1976 to provide responsive, efficient and accountable management of consumer contacts. Its responsibilities were clarified under Act 114 of 1986 in regard to reporting and deciding customer complaints. In order to fulfill its mandates, the Bureau began investigating utility consumer complaints and writing decisions on service termination cases in April 1977. Since then the Bureau has investigated 502,730 cases (informal complaints) and has received an additional 326,435 opinions and requests for information (inquiries). The Bureau received 51,791 utility customer contacts that required review in 1997. It is important to note that more than half of these customer complaints had been appropriately handled by the subject utilities before the customers brought them to the Bureau. In spite of the fact that the utilities had properly followed the Public Utility Commission’s procedures and rules in handling the complaints, the customers still appealed to the Public Utility Commission. In these instances, the Commission has upheld the utility’s actions.
The Staff of the Bureau of Consumer Services

2
Case Handling
The handling of utility complaint cases is the foundation for a number of Bureau programs. The case handling process provides an avenue through which consumers can gain redress for errors and responses to inquiries. However, customers are required by Commission regulations to attempt to resolve problems directly with their utilities prior to filing a complaint or requesting a payment arrangement with the Commission. Although exceptions are permitted under extenuating circumstances, the BCS generally handles those cases in which the utility and customer could not find a mutually satisfactory resolution to the problem. Once a customer contacts the Bureau of Consumer Services with a complaint or payment arrangement request (PAR), the Bureau notifies the utility that a complaint or PAR has been filed. (The vast majority of consumers contact the BCS by telephone using the Bureau’s toll free numbers. In 1997, more than 91% of informal complaints were filed by telephone.) The utility sends the BCS all records concerning the complaint including records of its contacts with the customer regarding the complaint. The BCS investigator reviews the records, renders a decision and closes the case. The BCS research unit then examines the case and, among other things, classifies the complaint into one of six major problem areas as well as one of nearly 200 specific problem categories. This case information is entered into the Consumer Services Information System data base. The analysis from case information is used by the BCS to generate reports to the Commission, utilities, legislators and the public. The reports may present information regarding utility performance, industry trends, investigations, new policy issues and the impact of utility or Commission policy.
Consumer Feedback Survey
In order to monitor its own service to consumers, the Bureau of Consumer Services surveys those customers who have contacted the Bureau with a utility-related problem or payment arrangement request. The purpose of the survey is to collect information from the consumer’s perspective about the quality of the Bureau’s complaint handling service. The BCS mails a written survey form to a sample of consumers who have been served by the BCS field services staff. The results of the survey for fiscal year 1997-1998 show that 87% of consumers reported that they would contact the PUC again if they were to have another problem with a utility that they could not settle by talking with the company. Over 85% rated the service they received from the PUC as “good” or “excellent”.
3
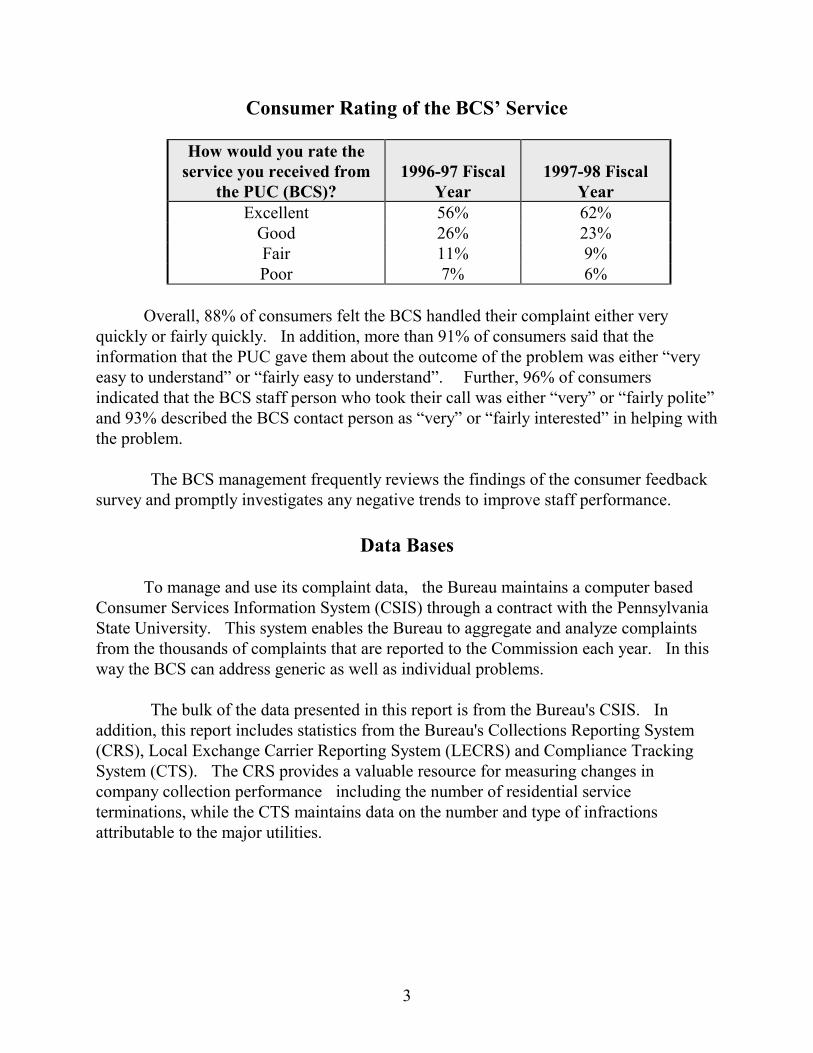
Consumer Rating of the BCS’ Service
How would you rate the service you received from
the PUC (BCS)?
1996-97 Fiscal
Year
1997-98 Fiscal
Year Excellent 56% 62%
Good 26% 23% Fair 11% 9% Poor 7% 6%
Overall, 88% of consumers felt the BCS handled their complaint either very quickly or fairly quickly. In addition, more than 91% of consumers said that the information that the PUC gave them about the outcome of the problem was either “very easy to understand” or “fairly easy to understand”. Further, 96% of consumers indicated that the BCS staff person who took their call was either “very” or “fairly polite” and 93% described the BCS contact person as “very” or “fairly interested” in helping with the problem. The BCS management frequently reviews the findings of the consumer feedback survey and promptly investigates any negative trends to improve staff performance.
Data Bases
To manage and use its complaint data, the Bureau maintains a computer based Consumer Services Information System (CSIS) through a contract with the Pennsylvania State University. This system enables the Bureau to aggregate and analyze complaints from the thousands of complaints that are reported to the Commission each year. In this way the BCS can address generic as well as individual problems.
The bulk of the data presented in this report is from the Bureau's CSIS. In
addition, this report includes statistics from the Bureau's Collections Reporting System (CRS), Local Exchange Carrier Reporting System (LECRS) and Compliance Tracking System (CTS). The CRS provides a valuable resource for measuring changes in company collection performance including the number of residential service terminations, while the CTS maintains data on the number and type of infractions attributable to the major utilities.

4
Distinctions Between Cases A number of cases were segregated from the analyses that appear later in this
report because they did not fairly represent company behavior. One treatment of the data involved the removal of complaints about problems over which the Commission has no jurisdiction, information requests that did not require investigation and most cases where the customers indicated that they had not contacted the company prior to complaining to the Commission. Commercial customer contacts were also excluded from the data base. Although the Bureau's regulatory authority is largely confined to residential accounts, the Bureau handled 1,753 cases from commercial customers in 1997. Of these cases, 537 were related to termination of electric, gas or water service and 53 were related to loss of telephone service. Due to its limited jurisdiction, the Bureau does not issue decisions regarding commercial disputes. Rather, the Bureau gives the customer information regarding the company's position or attempts to mediate a mutually acceptable agreement regarding the disputed matter. All 1997 cases that involved commercial accounts were deleted from the analysis in this report. The table below illustrates that the vast majority of cases handled by the BCS in 1997 involved residential utility service.
Total Volume of Consumer Complaints and
Payment Arrangement Requests to the BCS in 1997
Consumer Complaints Payment Arrangement Requests
Industry Residential Commercial Residential Commercial Electric 2,044 210 25,086 448 Gas 1,052 75 12,053 80 Telephone 2,619 848 5,060 53 Water 623 29 1,481 9 Other 16 1 4 0 TOTAL 6,354 1,163 43,684 590
Generally, customer contacts to the Bureau fall into three basic categories:
1) consumer complaints; 2) requests for payment arrangements; and 3) inquiries. The Bureau classifies contacts regarding complaints about utilities’ actions related to billing, service delivery, repairs, etc., as consumer complaints and contacts involving payment negotiations for unpaid utility service as payment arrangement requests. Consumer complaints and payment arrangement requests are often collectively referred to as informal complaints. Inquiries include information requests and opinions from consumers, most of which do not require investigation on the part of the Bureau.

5
Consumer Complaints Most of the consumer complaints regarding the electric, gas, water, sewer and steam heat industries deal with matters covered under 52 Pa. Code, Chapter 56, the Standards and Billing Practices for Residential Utility Service. For the telephone industry, most of the cases found in the consumer complaint category deal with matters covered under 52 Pa. Code Chapter 64, the “Standards and Billing Practices for Residential Telephone Service” and 52 Pa. Chapter 63, the “Quality of Service Standards for Telephone.” For the most part, consumer complaints represent customer appeals to the Commission resulting from the inability of the utility and the customer to reach a mutually satisfactory resolution to a dispute.
Consumer Complaints By Industry
1996-1997
0
500
1,000
1,500
2,000
2,500
3,000
Electric Gas Water Telephone
1997 1996
The Bureau investigated 7,517 consumer complaints in 1997. Overall, the volume of consumer complaints to the Bureau increased by 13% from 1996 to 1997. Consumer complaints about the Chapter 56-covered industries (electric, gas, water, sewer and steam heat) decreased by 1% from 1996 to 1997. Meanwhile, consumer complaints about the telephone industry increased significantly, by 36%. This increase was primarily due to the growth in competition among telecommunications providers. For example, as a result of increased competition among toll service providers, more customers complained about having their toll service provider switched without their permission (slamming). In 1997, electric and gas utilities accounted for 30% and 15 %, respectively of all consumer complaints investigated by the Bureau. Water utilities accounted for 9% of consumer complaints and the telephone utilities were the subject of 46% of all consumer complaints.

6
Justified Consumer Complaints Once a BCS investigator finishes the investigation of a consumer’s complaint and makes a decision regarding the complaint, the BCS reviews the utility’s records to determine if the utility took appropriate action when handling the customer’s contact and uses these records to determine the outcome of the case. There are three possible case outcome classifications: justified, inconclusive and unjustified. This approach focuses strictly on the regulatory aspect of the complaint and evaluates utilities negatively only where, in the judgment of the BCS, appropriate complaint handling procedures were not followed or the regulations have been violated. Specifically, a case is considered “justified” in the appeal to the BCS if it is found that, prior to the BCS intervention, the company did not comply with PUC orders, regulations, reports, Secretarial Letters, tariffs, etc. “Unjustified” complaints are those cases in which the company demonstrates that correct procedures were followed prior to the BCS intervention. “Inconclusive” complaints are those in which incomplete records, equivocal findings or uncertain regulatory interpretations make it difficult to determine whether or not the customer was justified in the appeal to the Commission.
Classification of Consumer Complaints After a BCS investigator closes a case from a utility customer, the BCS research unit reviews the information on the case and translates it into a format so that it can be added to the Bureau’s information system (CSIS). One part of this process is that the research staff categorizes each complaint into a specific problem category and enters it into the computerized system. The BCS data system then aggregates the data from all complaints to produce meaningful reports for analysis by the Bureau, the Commission or for utilities. The BCS has categorized the 1997 residential consumer complaints into 13 categories for each of the electric, gas, water and telephone utilities. Tables showing the percent of complaints in each category in 1997 appear in each industry chapter. The percentages shown in the tables are for all the cases that consumers filed with BCS, not just cases determined to be justified in coming to the Bureau. The Bureau analyzes the categories that generate complaints or problems for customers, even if the utility records indicate that the utility followed PUC procedures and guidelines in handling the complaint. The BCS often discusses its findings with individual utilities who can use the information to review their complaint-handling procedures in categories that seem to produce large numbers of consumer complaints to the Commission. The four tables in Appendix B show the actual number of cases that fell into each category in 1997.
7
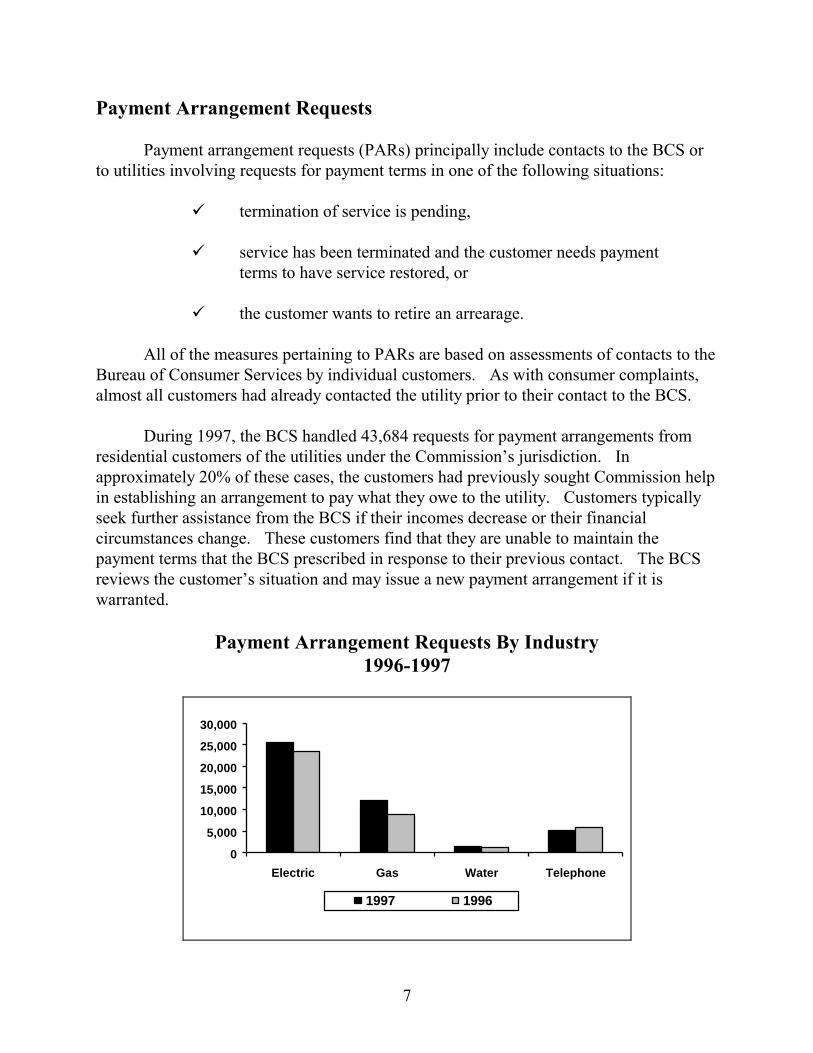
Payment Arrangement Requests
Payment arrangement requests (PARs) principally include contacts to the BCS or to utilities involving requests for payment terms in one of the following situations: ✓ termination of service is pending, ✓ service has been terminated and the customer needs payment terms to have service restored, or ✓ the customer wants to retire an arrearage. All of the measures pertaining to PARs are based on assessments of contacts to the Bureau of Consumer Services by individual customers. As with consumer complaints, almost all customers had already contacted the utility prior to their contact to the BCS. During 1997, the BCS handled 43,684 requests for payment arrangements from residential customers of the utilities under the Commission’s jurisdiction. In approximately 20% of these cases, the customers had previously sought Commission help in establishing an arrangement to pay what they owe to the utility. Customers typically seek further assistance from the BCS if their incomes decrease or their financial circumstances change. These customers find that they are unable to maintain the payment terms that the BCS prescribed in response to their previous contact. The BCS reviews the customer’s situation and may issue a new payment arrangement if it is warranted.
Payment Arrangement Requests By Industry 1996-1997
0
5,000
10,000
15,000
20,000
25,000
30,000
Electric Gas Water Telephone
1997 1996

8
Payment arrangement requests for the Chapter 56-covered utilities increased 17%, from 33,559 in 1996 to 39,161 in 1997. For the telephone industry, the volume of payment arrangement requests decreased by 12%, there were 5,823 requests in 1996 compared to 5,113 in 1997. As in past years, the majority of requests for payment arrangements in 1997 involved electric or gas companies. Fifty-eight percent of the PARs (25,534 cases) were from electric customers and 27% (12,133 cases) were from gas customers. Meanwhile, 12% of the PARs (5,113 cases) involved telephone service and 3% (1,490 cases) stemmed from customers of various water utilities. Inquiries and Opinions
During 1997, the Bureau of Consumer Services received 27,661 customer contacts that, for the most part required no follow-up investigation beyond the initial contact. The Bureau classified these contacts as “inquiries”. The 1997 number of inquiries includes contacts to the Competition Hotline. Further discussion of the Competition Hotline appears on the next page. In large part, the inquiries in 1997 involved requests for information that the BCS staff handled at the time of the initial contact, referrals to utility companies for initial action and referrals to other agencies. The Bureau also classifies certain requests for payment arrangements which the BCS cannot fulfill as inquiries. For example, the Bureau does not issue payment decisions on requests to restore or avoid suspension/ termination of toll or nonbasic telephone service. These requests are classified as inquiries. Similarly, if a customer has recently been through the BCS payment arrangement process and calls again with a new request regarding the same issue, the Bureau does not open a new payment arrangement case and the customer’s contact is classified as an inquiry. As in past years, the Bureau shifted some contacts that originated as consumer complaints and payment arrangement requests into the inquiry category because it was not appropriate to count these contacts as informal complaints. Examples of these contacts include informal complaints that were found to be duplicates, informal complaints filed against the wrong company, informal complaints that the BCS handled in spite of the fact that the customers had not previously contacted their companies about their problems and cases that the investigators verbally dismissed. In all, these cases accounted for approximately 3% of inquiries in 1997. For the past number of years, the Bureau of Consumer Services classified and reported inquiries by categories based on either the consumer’s reason for contact or the Bureau’s response to the contact. In May 1997, the Bureau upgraded its information system and, among other things, changed the way in which it categorizes inquiries. The
9
Bureau now records the customer’s reason for contact as well as the action the BCS staff person took in response to the contact. The BCS is now able to expand its list of reasons for contact as customers’ reasons grow and change. By May 1998, the list included almost 60 reasons for contact from consumers. Possible actions by the BCS intake staff include recording the consumer’s opinion, giving information to the consumer, referring the consumer to a utility company, and referring the consumer to an agency or organization outside the PUC. If the contact requires further investigation, the intake staff refers the contact to a Bureau investigator and thus the contact becomes an informal complaint. Because the BCS changed its method of categorizing contacts in the middle of 1997, inquiries from the first four and a half months are categorized in the old way and contacts after May 19, 1997 are categorized using the new method. For this reason, it is not possible to report the categories of all 1997 inquiries in tabular form as prior reports have done. The onset of competition in the electric industry greatly impacted the number of inquiries -- 67% of the inquiries in 1997 related to competition. The next section discusses consumer contacts to the Bureau of Consumer Services about competition issues.
Calls to the PUC’s Competition Hotline In May 1997, the Public Utility Commission opened a toll free telephone hotline to answer consumers’ questions about competition in the utility environment. The hotline is part of the Bureau of Consumer Services. As expected, most of the calls in 1997 were related to the restructuring of the electric industry. Beginning in late August, the BCS began collecting data regarding the calls to the Competition Hotline. From the last week in August until the end of the year, Commission staff responded to more than 18,000 calls about competition issues. The vast majority of the calls came from consumers who called about various issues associated with the pilot programs of the electric distribution companies (EDCs). Consumers called about a variety of concerns as the EDC pilot programs progressed through various stages. The table that follows provides information regarding the reasons consumers called the Competition Hotline in 1997.

10
Contacts to the Competition Hotline 1997
Reason for Contact Number of Contacts Percent
Competition in general 5,604 30% Selecting a supplier 5,306 28% Enrollment information 5,131 28% Request for competition brochures 1,391 7% Slamming 277 2% Terms & conditions of supplier contracts 223 1% Contact with supplier 217 1% Delay in pilot savings 125 1% Stranded costs 121 1% Changing a supplier 61 <1% Renewable resources (conservation) 48 <1% Dropped from pilot 31 <1% Contacts from suppliers 31 <1% Status of applications/licensing 27 <1% Status of restructuring 26 <1% Confusing bill 15 <1% Other 11 <1% Total 18,645 100%
In most instances, the BCS classified the contacts to the hotline as inquiries because they required no investigation or follow-up. The BCS staff person was able to take care of the consumer’s request or question at the initial contact. However, as the pilot programs began operating, some consumer contacts required further investigation and possibly action to resolve the consumers’ concerns. In these cases the BCS more appropriately classified the contacts as consumer complaints and added a new complaint category for competition issues to its information system. For example, consumer complaints about being assigned to an electric generation supply company without the consumer’s consent or knowledge (slamming) will be in this new category. The BCS recognizes that the purpose of the EDC pilot programs is to uncover and solve problems associated with the transition to customer choice. The pilot phase will allow problems to be resolved before large numbers of electric customers are eligible to choose their electric generation supply company. Thus, the BCS believes that it would be unfair to include competition complaints with consumer complaints about other issues when it calculates the performance measures used to evaluate and compare companies within an industry. Therefore, the BCS eliminated the 14 competition-related complaints from the data set used to prepare the tables in the industry-specific chapters that follow. Appendix A-1 explains the types of competition complaints that the BCS handles.

11
Informal Compliance Process & Infractions
The Bureau's primary compliance effort remains its informal compliance process. This process gives each utility specific examples of its infractions of Chapter 56 and 64. The utilities can use the information to pinpoint and voluntarily correct deficiencies in their customer service operations. The informal compliance process uses consumer complaints to identify, document, and notify utilities of apparent deficiencies. The process begins by the BCS notifying a utility of an alleged infraction. A utility that receives notification of an allegation has an opportunity to affirm or deny the information. If the information about the allegation is accurate, the utility indicates the cause of the problem (i.e., employee error, procedures, a computer program, etc.). In addition, the utility informs the BCS of the date and action it took to correct this problem.
Corrective actions may entail modifying a computer program; revising the text of a
notice, bill, letter or company procedures; or providing additional staff training to ensure the proper use of a procedure. If the utility states that the information is inaccurate, the utility provides specific details and supporting data to disprove the allegation. The BCS always provides a final determination to the utility regarding the alleged infraction. For example, if the utility provides supporting data indicating that the information about the allegation is inaccurate, the BCS after reviewing all the information, would inform the utility that, in this instance, the facts do not reflect an infraction of the regulations. On the other hand, if the company agrees that the information forming the basis of the allegation is accurate and indicates the cause of the problem to be other than an employee error, or if the BCS does not find that the data supports the utility’s position that the information is inaccurate, the BCS would inform the company that the facts reflect an infraction of a particular section of the regulations. The notification process allows utilities to receive written clarifications of Chapter 56 or 64 provisions and Commission and BCS policies.
The significance of infractions identified by the informal compliance process is frequently emphasized by the fact that some represent systematic errors that are widespread and affect many utility customers. Since the BCS receives only a small portion of the complaints that customers have with their utility companies, limited opportunities exist to identify such errors. Therefore, the informal compliance process is specifically designed to help utilities identify systematic errors. One example of a systematic error is a termination notice with text that does not comply with the requirements of Chapter 56. Each recipient of the notice is affected by this error. When such an error is discovered, the BCS encourages utilities to investigate the scope of the problem and take corrective action. Some utilities have developed their own information systems to identify problems by reviewing complaints before they come to the Commission's attention. The BCS encourages utilities to continue this activity and share their findings with Bureau staff.

12
2. Performance Measures
For the most part, the Bureau of Consumer Services uses the complaints it receives from customers of the major electric, gas, water and telephone utilities to assess utilities’ complaint handling performance. In nearly every case, the customer had already contacted the company about the problem prior to contacting the BCS. The BCS reviews the utility’s record as to how the utility handled the complaint when the customer contacted the company. The review includes several classifications and assessments that form the basis of all the performance measures presented in this and the next four chapters, with the exception of the number of terminations and termination rate. The termination statistics for the electric and gas companies are drawn from reports required by Chapter 56.231(8) while telephone termination statistics are drawn from reports required by Chapter 64.201(7). The sections that follow explain the various measures that the BCS employs to assess utility performance.
Consumer Complaint Rate
The calculation of consumer complaint rate (consumer complaints per one thousand residential customers) permits the reader to make comparisons among utilities of various sizes. The BCS has found that high consumer complaint rates and extreme changes in consumer complaint rates from one year to the next are often indicative of patterns and trends that it should investigate. However, many of the complaints in the consumer complaint rate are not “justified”. The “justified consumer complaint rate” (justified consumer complaints per one thousand residential customers) is a truer indication of a utility’s complaint handling performance.
Justified Consumer Complaint Rate The Bureau of Consumer Services uses case evaluation to identify whether or not correct procedures were followed by the utility in responding to the customer’s complaint prior to the intervention of the Bureau. In other words, case evaluation is used to determine whether a case is “justified.” A customer’s case is considered “justified” if it is found that, prior to BCS intervention, the company did not comply with PUC orders or policies, regulations, reports, Secretarial Letters or tariffs in reaching its final position. In the judgment of the BCS, a case that is “justified” is a clear indication that the company did not handle a dispute properly or effectively, or in handling the dispute, the company violated a rule, regulation or law. There are two additional complaint resolution categories. “Unjustified” complaints are those cases in which the company
13
demonstrates that correct procedures were followed prior to BCS intervention. “Inconclusive” complaints are those in which insufficient records or equivocal findings make it difficult to determine whether or not the customer was justified in the appeal to the Bureau. The majority of cases fall into either the “justified” or “unjustified” category. The performance measure called “justified consumer complaint rate” reflects both volume of complaints and percent of consumer complaints found justified. Justified consumer complaint rate is the number of justified consumer complaints for each 1,000 residential customers. By using this ratio, the reader can use the “justified” rate to compare utilities’ performance within an industry and across time. The BCS perceives the justified consumer complaint rate to be a bottom line measure of performance that evaluates how effectively a company handles complaints from its customers. The Bureau of Consumer Services monitors the complaint rates and justified rates of the major utilities, paying particular attention to the number of justified complaints that customers file with the Commission. Justified complaints indicate that the subject utilities did not follow the PUC’s rules, procedures or regulations when they dealt with their customers. Justified complaints may indicate areas where the BCS should discuss complaint-handling procedures with a utility so that its customers receive fair and equitable treatment when they deal with the utility. When the BCS encounters company case handling performance (justified consumer complaint rate) that is significantly worse than average, there is reason to suspect that many customers who contact the utility are at risk of improper dispute handling by the utility. As part of the monitoring process, the BCS compares the “justified” rates of individual utilities and industries over time and investigates significant changes when they occur. In the chapters that follow, the BCS compares the consumer complaint rates and the justified consumer complaint rates of the major utilities within the electric, gas, water and telephone industries.
Response Time to Consumer Complaints Once a customer contacts the BCS with a complaint about a utility, the Bureau notifies the utility. The utility then sends the BCS records of its contact with the customer regarding the complaint. Response time is the time span in days from the date of the Bureau of Consumer Services’ first contact with the utility regarding a complaint, to the date on which the utility provides the BCS with all of the information needed to resolve the complaint. Response time quantifies the speed of a utility’s response to BCS informal complaints. In the following chapters and in Appendix D, response time is presented as the average number of days that each utility took to supply the BCS with complete complaint information.

14
Payment Arrangement Request Rate
The Bureau of Consumer Services normally intervenes at the customer’s request only after direct payment negotiations between the customer and the company have failed. The volume of payment arrangement requests (PARs) from a utility’s customers may fluctuate from year to year or even from month to month depending upon the utility’s collection strategy as well as economic factors. The calculation of the payment arrangement request rate (payment arrangement requests per 1,000 residential customers) permits the reader to make comparisons among utilities with differing numbers of residential customers. Nevertheless, unusually high or low rates and sizable changes in rates from one year to the next may reflect changes in company policies or bill collection philosophies, as stated earlier, or they may be indicative of problems. The BCS views such variations as potential areas for investigation. Clearly, improved access to the Bureau of Consumer Services has impacted the number of consumers who are able to contact the BCS about payment arrangements. In addition, as utilities have become more aggressive in seeking to collect outstanding bills, the number of PARs to the BCS continues to increase. Many of the payment arrangement requests in the PAR rates are not “justified”. The “justified payment arrangement request rate” (justified payment arrangement requests per one thousand residential customers) is a truer indication of a utility’s payment negotiation performance.
Justified Payment Arrangement Request Rate
Just as with consumer complaints, once a customer contacts the Bureau with a payment arrangement request, the Bureau notifies the utility. The company sends a report to the BCS that details the customer payments, usage and payment negotiation history. A BCS investigator considers the customer’s record and makes a decision regarding the amortization of the amount owed and notifies the company and the customer of the decision. The BCS research unit reviews the record to determine if the utility negotiated properly with the customer and uses this record to determine the outcome of the case. There are three possible case outcome classifications: “justified”, “inconclusive” and “unjustified”. This approach evaluates companies negatively only where, in the judgment of the BCS, appropriate payment negotiation procedures were not followed or where the regulations have been violated. Specifically, a case is considered “justified” in the appeal to BCS if it is found that, prior to BCS intervention, the company did not comply with PUC regulations, reports, Secretarial Letters, tariffs, or guidelines. “Unjustified” payment arrangement requests are those in which the company demonstrates that correct procedures were followed prior to BCS intervention. “Inconclusive” PARs are those in which incomplete records or equivocal accounts make it difficult to determine whether or not the customer was justified in the appeal to the Bureau.

15
Changes in company policy can influence not only the volume of PARs to the Commission but also the effectiveness of a utility’s payment negotiations. The Bureau uses the “justified payment arrangement request rate” to measure a utility’s performance at handling payment arrangement requests from customers. The justified payment arrangement request rate is the ratio of the number of justified PARs for each 1,000 residential customers. The Bureau of Consumer Services monitors the justified PAR rates of the major utilities. For example, the BCS compares the “justified” rates of individual utilities and industries over time and investigates significant changes when they occur. In the chapters that follow, the BCS compares the PAR rates and the justified PAR rates of the major utilities within the electric, gas, water and telephone industries. Because the BCS receives a very large volume of requests for payment terms, it reviews a random sample of cases for the companies with the largest number of PARs. For these companies, justified payment arrangement request rate and response time are based on a subset of the cases that came to the BCS.
Response Time to Payment Arrangement Requests
Once a customer contacts the BCS with a payment arrangement request, the Bureau notifies the utility. The utility then sends the BCS records that include the customer’s payment history, the amount owed, prior payment arrangements, and the results of the most recent payment negotiation with the customer. Response time is the time span in days from the date of the Bureau of Consumer Services’ first contact with the utility regarding a payment arrangement request to the date on which the utility provides the BCS with all of the information it needs to issue payment terms, resolve any other issues raised by the customer and determine whether or not the customer was justified in seeking a payment arrangement through the BCS. Response time quantifies the speed of a utility’s response to BCS payment arrangement requests. In the following chapters and in Appendix F, response time is presented as the average number of days that each utility took to supply the BCS with the necessary information. The Commission is currently working on a project to transfer data electronically from utilities to the BCS. When this project is successfully completed, utility response time may decrease.
Infraction Rate
During 1997, the BCS continued its informal compliance notification process to improve utility compliance with applicable statutes and regulations relating to the treatment of residential accounts. In order to compare utilities of various sizes within an industry, the Bureau has calculated a measure called “infraction rate”. The infraction rate is the number of informally verified infractions for each 1,000 residential customers.

16
Although the BCS has reported a compliance rate for the major telephone companies since 1989, it introduced “infraction rates” for the electric, gas and water utilities in last year’s report on 1996 activity.
Several considerations are important to keep in mind when viewing the infraction rate charts in the chapters that follow. First, the data does not consider the causes of the individual infractions. Secondly, some infractions may be more serious than others because of their systemic nature, and therefore may show ongoing or repetitive occurrences. Still other infractions may be more serious because they involve threats to the health and safety of utility customers.
The value of the infraction rate is to depict industry trends over time. The trend for 1997 is calculated using the BCS’ Compliance Tracking System’s (CTS) data as of June 1998. The 1997 trends may change if the total number of infractions increases. This would occur if new infractions are discovered from customer complaints that originated in 1997 but were still under investigation by the Bureau when the data was retrieved from the CTS. Often, the total number of infractions for the year will be greater than the number cited in this report. The Bureau will update the number of infractions found on 1997 cases in the report on 1998 complaint activity. Infraction rates for each major electric, gas, water and telephone company are shown for 1995, 1996 and 1997 in the chapters that follow. Appendix G shows additional 1995-1997 infraction statistics.
Termination Rate
Payment over time through a mutually acceptable payment arrangement is one possible outcome when a customer owes an outstanding balance to a utility company. Termination of the utility service is another. The Bureau of Consumer Services views termination of utility service as a utility’s last resort when customers fail to meet their payment obligations. The calculation of termination rate allows the reader to compare the termination activity of utilities with differing numbers of residential customers. Termination rate is the number of service terminations for each 1,000 residential customers. Any significant increase in termination rate would indicate a trend or pattern that the Commission may need to investigate. Water utilities do not report service termination statistics to the Commission; thus the water industry chapter does not include termination rate information.
BCS Performance Measures & Industry Chapters The industry chapters that follow present charts that depict the performance of each of the major electric, gas, water and telephone utilities. Each chapter includes

17
charts that show the consumer complaint rate and the justified consumer complaint rate of each major utility. Also included in the industry chapters are charts that show the 1997 payment arrangement request rates and the justified payment arrangement request rates for each of the major utilities. The charts also show the average of the rates of the major utilities within the industry for each of these measures. In addition, each industry chapter presents charts and tables that show infraction rates for the major utilities, response time to both consumer complaints and payment arrangement requests, and termination rates for the major electric, gas, and telephone utilities. It is important to note that the industry chapters present only data from those utilities that have more than 100,000 residential customers. In the Water Industry Chapter, data for the 11 Class A water utilities that have less than 100,000 residential customers are presented together as a whole. The Bureau has found that the inclusion of scores for the smaller utilities can skew the average of industry scores in ways that do not fairly represent industry performance. For this reason, the BCS has excluded the statistics involving smaller utilities when it calculated the 1997 averages of industry scores. In the future, the Commission may undertake a project in which it calculates and reports performance measure statistics for the smaller utilities.

18
3. Electric Industry
In 1997, the Commission had jurisdiction over 17 electric utilities. However, the majority of the consumer complaints and payment arrangement requests involving the electric industry were from residential customers of the six largest electric utility companies: Allegheny Power, Duquesne Light Company, GPU Energy, PECO Energy, Pennsylvania Power Company and PP&L, Inc. This chapter will focus exclusively on those six utilities. Most of the complaints and payment arrangement requests dealt with matters covered under 52 PA Code, Chapter 56, the Standards and Billing Practices for Residential Utility Service. For the most part, these consumer complaints and payment arrangement requests represent customer appeals to the Commission resulting from the inability of the company and the customer to reach a mutually satisfactory resolution to a dispute or payment negotiation. The tables and charts on the pages that follow depict the performance of each of the six largest electric utilities in 1997. The tables in the appendices include UGI-Electric, a major electric utility with fewer then 100,000 residential customers. The Bureau investigated complaints in 1997 that were generated as a result of the electric pilot programs that allowed participants to choose an electric generation supply company. However, as mentioned in the first chapter, the BCS removed these complaints from the data base it used to prepare the tables and charts in this report. Appendices B through G present the actual statistics that the Bureau used to produce the charts in this chapter.
Consumer Complaints
During 1997, the BCS handled a total of 2,254 consumer complaints from customers of the various electric utilities; 2,044 of the complaints were filed by residential customers. Of those residential complaints, 93% (1,892) were from customers of the six largest electric utilities. Consumer Complaint Categories
After a BCS investigator closes a consumer complaint, the BCS research unit reviews the complaint, categorizes it into a specific problem category and enters it into the Bureau’s computerized information system. The BCS data system then aggregates the data from all complaints. The following table shows the percentage of 1997 complaints from residential customers of the six largest electric utilities in each of the 13 categories used by the BCS research unit to categorize consumer complaints about electric, gas and water utilities. Appendix C, Table 1 provides the actual number of cases that fell into each category in 1997.
19
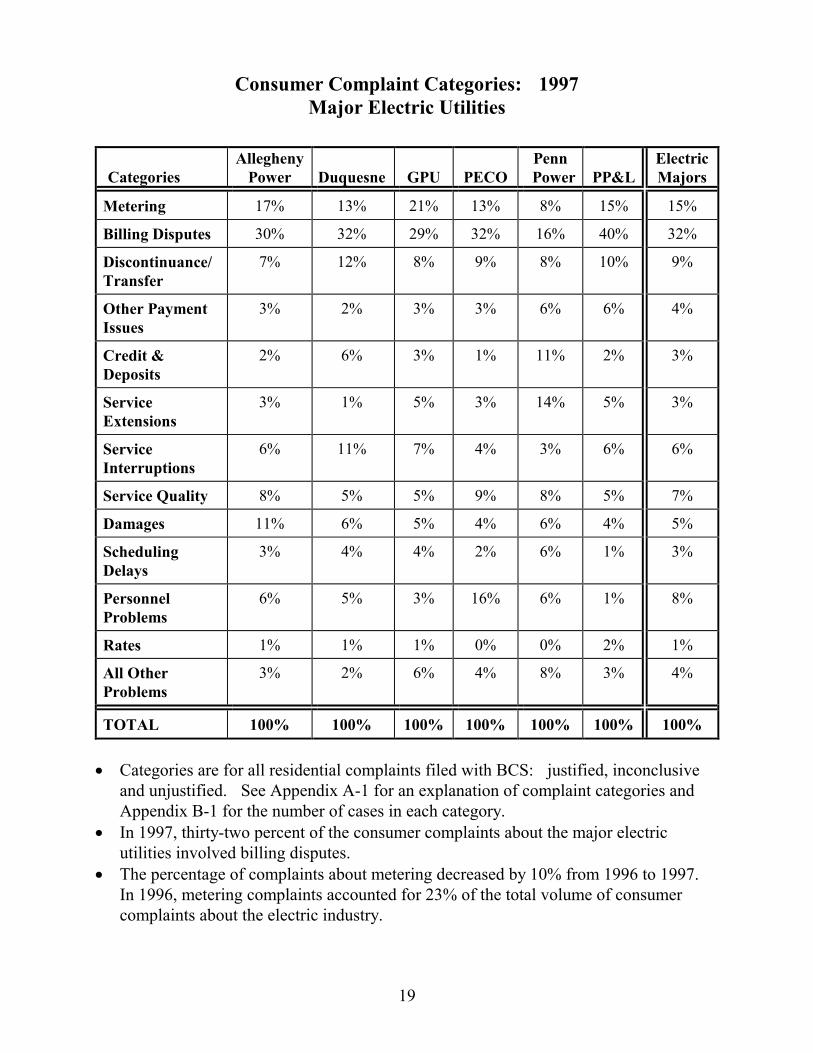
Consumer Complaint Categories: 1997 Major Electric Utilities
Categories Allegheny
Power
Duquesne
GPU
PECO Penn
Power
PP&L Electric Majors
Metering 17% 13% 21% 13% 8% 15% 15%
Billing Disputes 30% 32% 29% 32% 16% 40% 32%
Discontinuance/ Transfer
7% 12% 8% 9% 8% 10% 9%
Other Payment Issues
3% 2% 3% 3% 6% 6% 4%
Credit & Deposits
2% 6% 3% 1% 11% 2% 3%
Service Extensions
3% 1% 5% 3% 14% 5% 3%
Service Interruptions
6% 11% 7% 4% 3% 6% 6%
Service Quality 8% 5% 5% 9% 8% 5% 7%
Damages 11% 6% 5% 4% 6% 4% 5%
Scheduling Delays
3% 4% 4% 2% 6% 1% 3%
Personnel Problems
6% 5% 3% 16% 6% 1% 8%
Rates 1% 1% 1% 0% 0% 2% 1%
All Other Problems
3% 2% 6% 4% 8% 3% 4%
TOTAL 100% 100% 100% 100% 100% 100% 100% • Categories are for all residential complaints filed with BCS: justified, inconclusive
and unjustified. See Appendix A-1 for an explanation of complaint categories and Appendix B-1 for the number of cases in each category.
• In 1997, thirty-two percent of the consumer complaints about the major electric utilities involved billing disputes.
• The percentage of complaints about metering decreased by 10% from 1996 to 1997. In 1996, metering complaints accounted for 23% of the total volume of consumer complaints about the electric industry.

20
1997 Residential Consumer Complaint Rates/ Justified Consumer Complaint Rates
Major Electric Utilities
0.30
0.48
0.39
0.53
0.34
0.44
0.05 0.05 0.06
0.16 0.17 0.18
0.00
0.10
0.20
0.30
0.40
0.50
0.60
PP&L Penn
Power
Duquesne Allegheny
Power
GPU PECO
Consumer Complaint RateJustified Consumer Complaint Rate
Average of Justified Consumer
Complaint Rates = 0.11
Average of Consumer Complaint
Rates = 0.42
• The justified consumer complaint rate equals the number of justified consumer complaints for each 1,000 residential customers. The consumer complaint rate equals the number of consumer complaints for each 1,000 residential customers.
• For the major electric utilities, the average of the consumer complaint rates is more than three
times greater than the average of the justified consumer complaint rates. • Appendix C, Table 1 presents the number of consumer complaints and justified consumer
complaints for each major electric utility in 1997.

21
1996-1997 Justified Residential Consumer Complaint Rates Major Electric Utilities
0.05
0.16 0.17
0.12
0.34
0.05 0.06
0.18
0.02
0.13
0.090.10
0.00
0.05
0.10
0.15
0.20
0.25
0.30
0.35
Penn
Power
PP&L Duquesne Allegheny
Power
GPU PECO
1997 1996
Average of 1997 Rates = 0.11
(1996 Average = 0.13)
• The justified consumer complaint rate equals the number of justified consumer complaints for each 1,000 residential customers.
• The average of the justified consumer complaint rates for the major electric utilities
decreased from 1996 to 1997. The justified rates for three of the six major electric utilities shown in the chart decreased from 1996 to 1997.
• GPU’s 1997 justified residmntial consumer complaint rate is compared with a
combination of the 1996 rates of Met-Ed and Penelec. • Appendix C, Table 1 presents the number of justified consumer complaints for each
major electric utility in 1996 and 1997.

22
1996-1997 Response Time to BCS Residential Consumer Complaints
Major Electric Utilities
30.8
12.3
6.4
22.1
25.7
21.6
20.6
11.3
3.2
24.0
24.20
19.3
0 5 10 15 20 25 30 35
GPU
PECO
Allegheny Power
Duquesne
PP&L
Penn Power
Number of Days
1997 1996
Average of 1997 Response
Times = 19.5 days
(1996 Average = 18.0 days)
• The average response time increased by 1.5 days from 1996 to 1997. In 1996 the average response time increased by 4.7 days from 1995. In 1997, the average response time to consumer complaints increased for four of the six major electric utilities.
• The chart compares 1997 response time for GPU with a combination of the 1996
response times of Met-Ed and Penelec. • Appendix D shows the 1996 and 1997 response times to consumer complaints for
each of the major electric utilities as well as for the major gas, water and telephone utilities.

23
Payment Arrangement Requests
In 1997, the Bureau of Consumer Services handled 25,534 payment arrangement requests (PARs) from customers of the electric industry; 25,086 were from residential customers. Ninety-nine percent (24,923) of the residential PARs were from customers of the six largest electric utilities. For the companies with the largest volume of requests, the Bureau research unit reviewed a representative sample of PARs for case outcome and response time. In 1997, the BCS reviewed a sample of the PARs for each of the six largest electric utilities: Allegheny Power, Duquesne, GPU, PECO, Penn Power and PP&L. Thus, the calculations for justified payment arrangement request rate and response time that appear in the pages that follow are based on a subset of cases that the BCS received from customers of these utilities. The BCS believes that the size of the samples gives an adequate indication of the performance of these companies. Appendix E, Table 1 provides additional statistics regarding the payment arrangement requests from residential customers of the major electric utilities.
1997 Residential Payment Arrangement Request Rates/ Justified Payment Arrangement Request Rates
Major Electric Utilities
4.57
3.004.23
5.54
14.48
7.59
2.241.37
0.960.630.550.38
0.0
2.0
4.0
6.0
8.0
10.0
12.0
14.0
16.0
PP&L* PECO* Allegheny GPU* Duquesne* Penn Power*
PAR Rate Justified PAR Rate
Average of Justified PAR Rates = 1.02
Average of PAR Rates = 6.57
Power*
* JPAR Rates based on a probability sample of cases. • The justified payment arrangement request rate equals the number of justified
payment arrangement requests for each 1,000 residential customers. The payment arrangement request rate equals the number of payment arrangement requests for each 1,000 residential customers.

24
• On average, there were more than six payment arrangement requests to the BCS for each 1,000 residential customers of the major electric utilities in 1997.
• Appendix E, Table 1 presents the number of payment arrangement requests and
justified payment arrangement requests for each major electric utility in 1997.
1996-1997 Justified Residential Payment Arrangement Request Rates
Major Electric Utilities
0.550.63
0.96
1.37
2.24
0.410.38
1.61
0.95
0.44
0.00
0.50
1.00
1.50
2.00
2.50
PP&L* PECO* Allegheny GPU* Duquesne* Penn Power*
Average of 1997 Rates = 1.02
(1996 Average = 0.69)
*Based on a probability sample of cases.
• The justified payment arrangement request rate equals the number of justified
payment arrangement requests for each 1,000 residential customers. • The average of the justified PAR rates for the six major electric distribution
companies increased by 45% from 1996 to 1997. The justified PAR rates for five of the six major electric distribution companies increased from 1996 to 1997.
• The chart compares the GPU 1997 justified PAR rate with a combination of the 1996
rates of Met-Ed and Penelec. • Appendix E, Table 1 presents the number of justified payment arrangement requests
for each major electric utility in 1996 and 1997.

25
1996-1997 Response Time to BCS Residential Payment Arrangement Requests
Major Electric Utilities
21.8
14.1
0.8
22.4
10.2
13.2
10.4
0.9
20.80
6.8
8.0
5.0
0 5 10 15 20 25
GPU*
PECO*
Allegheny Power*
Duquesne*
PP&L*
Penn Power*
Number of Days
1997 1996
Average of 1997 Response
Times = 12.1 Days
(1996 Average = 9.6 Days)
*Based on a probability sample of cases
• The average response time for the six major electric utilities increased by 2.5 days from 1996 to 1997.
• The chart compares the 1997 response time for GPU with a combination of the 1996
response times for Met-Ed and Penelec. • Appendix F shows the 1996 and 1997 response times to payment arrangement
requests for each of the major electric utilities as well as for the major gas and water utilities. Appendix F also shows the 1997 response times for the major telephone utilities.
26
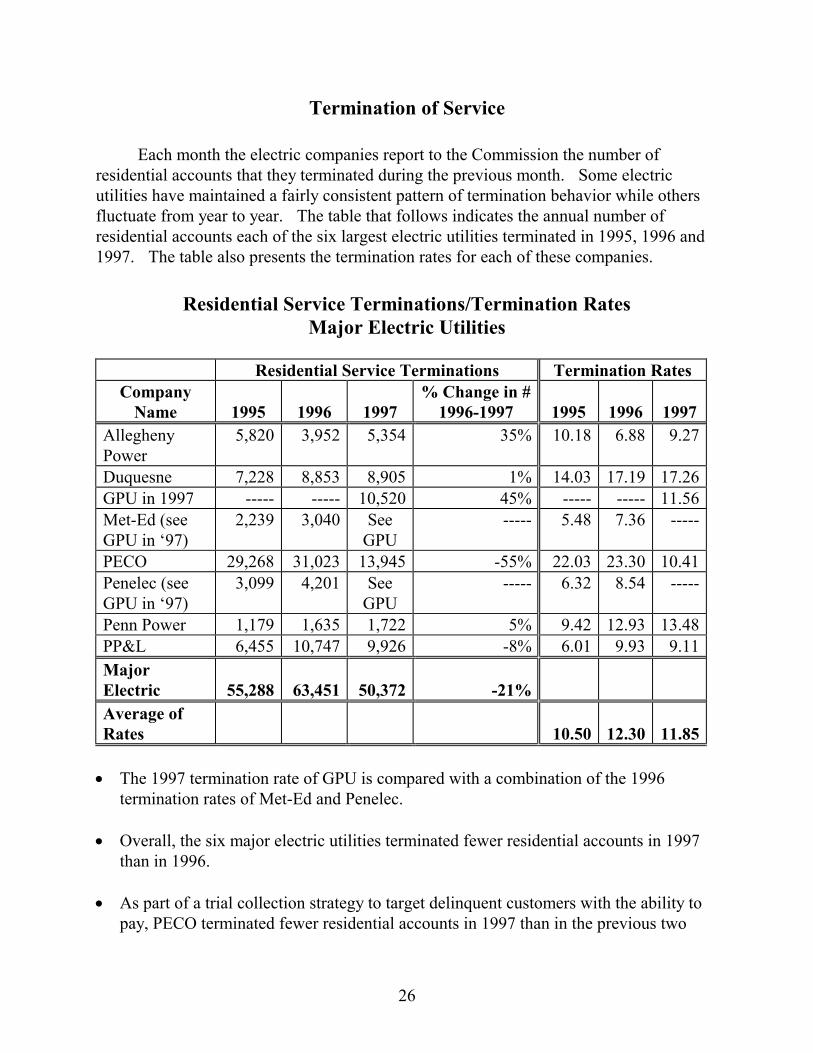
Termination of Service
Each month the electric companies report to the Commission the number of residential accounts that they terminated during the previous month. Some electric utilities have maintained a fairly consistent pattern of termination behavior while others fluctuate from year to year. The table that follows indicates the annual number of residential accounts each of the six largest electric utilities terminated in 1995, 1996 and 1997. The table also presents the termination rates for each of these companies.
Residential Service Terminations/Termination Rates Major Electric Utilities
Residential Service Terminations Termination Rates
Company Name
1995
1996
1997
% Change in # 1996-1997
1995
1996
1997
Allegheny Power
5,820 3,952 5,354 35% 10.18 6.88 9.27
Duquesne 7,228 8,853 8,905 1% 14.03 17.19 17.26 GPU in 1997 ----- ----- 10,520 45% ----- ----- 11.56 Met-Ed (see GPU in ‘97)
2,239 3,040 See GPU
----- 5.48 7.36 -----
PECO 29,268 31,023 13,945 -55% 22.03 23.30 10.41 Penelec (see GPU in ‘97)
3,099 4,201 See GPU
----- 6.32 8.54 -----
Penn Power 1,179 1,635 1,722 5% 9.42 12.93 13.48 PP&L 6,455 10,747 9,926 -8% 6.01 9.93 9.11 Major Electric
55,288
63,451
50,372
-21%
Average of Rates
10.50
12.30
11.85
• The 1997 termination rate of GPU is compared with a combination of the 1996
termination rates of Met-Ed and Penelec. • Overall, the six major electric utilities terminated fewer residential accounts in 1997
than in 1996. • As part of a trial collection strategy to target delinquent customers with the ability to
pay, PECO terminated fewer residential accounts in 1997 than in the previous two

27
years. In 1998, PECO continues to explore collection strategies in order to improve their collection performance.
Compliance
The use of “infraction rate” in this report is intended to help the Commission monitor the duty of electric distribution companies at 66 Pa. C.S. §2807(d) to, at a minimum, maintain customer services under retail competition at the same level of quality. In subsequent activity reports, the calculation of “infraction rate” for the electric generation suppliers, the new entrants into electric retail competition, will also help the Commission, pursuant to 66 Pa. C.S. §2809(e), monitor and regulate the service of electric generation suppliers. Electric generation suppliers are required at 66 Pa. C.S. §2809(e) and (f) to both comply with Chapter 56 and to implement practices which prevent deterioration of the present quality of service provided by the electric distribution companies. During 1995, 1996 and 1997, the Bureau determined that the six major electric utilities together logged 2,396 infractions of regulations. The chart that follows and the infraction statistics in Appendix G, Table 1 are drawn from the informal complaints that residential consumers filed with the BCS from 1995 through 1997.
28
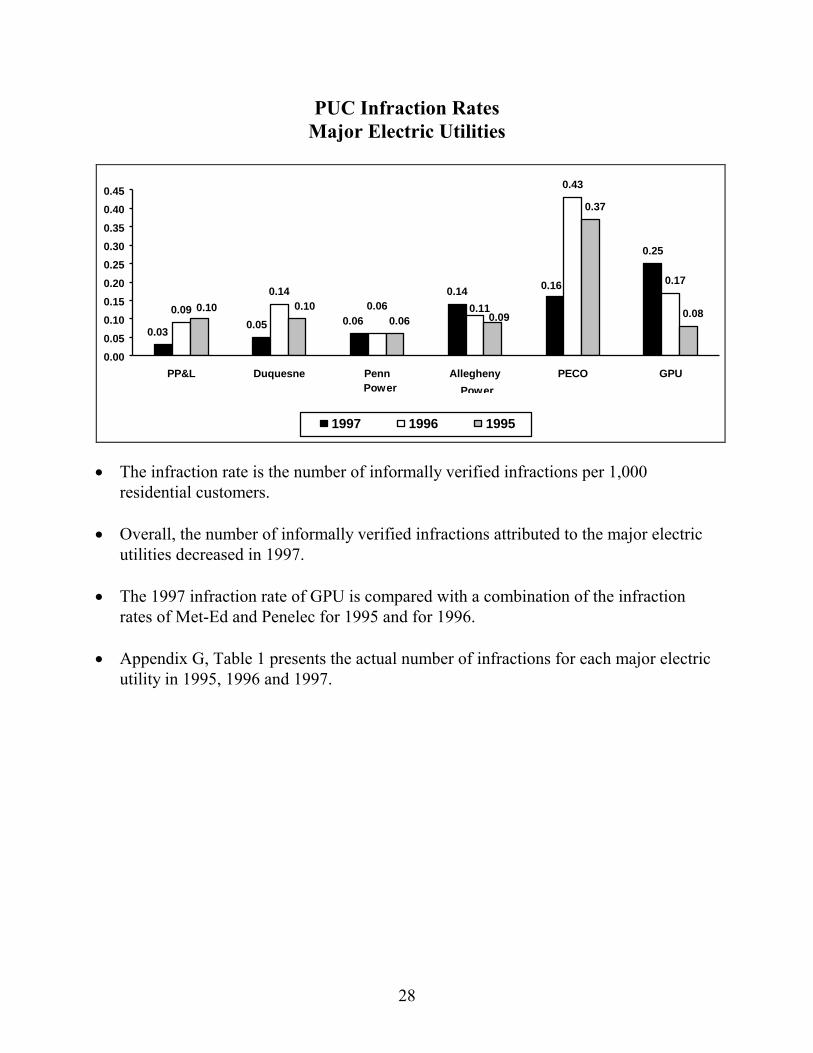
PUC Infraction Rates Major Electric Utilities
0.14
0.25
0.09
0.14
0.43
0.16
0.060.03
0.05
0.17
0.110.060.08
0.37
0.090.06
0.100.10
0.00
0.05
0.10
0.15
0.20
0.25
0.30
0.35
0.40
0.45
PP&L Duquesne Penn Allegheny PECO GPU
1997 1996 1995
Power Power
• The infraction rate is the number of informally verified infractions per 1,000
residential customers. • Overall, the number of informally verified infractions attributed to the major electric
utilities decreased in 1997. • The 1997 infraction rate of GPU is compared with a combination of the infraction
rates of Met-Ed and Penelec for 1995 and for 1996. • Appendix G, Table 1 presents the actual number of infractions for each major electric
utility in 1995, 1996 and 1997.

29
4. Gas Industry
In 1997, the Commission had jurisdiction over 38 gas utilities. However, the majority of the consumer complaints and payment arrangement requests involving the gas industry came from residential customers of the six major gas utilities: Columbia Gas of Pennsylvania, Equitable Gas, National Fuel Gas Distribution Corporation, PG Energy, Peoples Gas and UGI Utilities-Gas Division. This chapter will focus exclusively on those six utilities. As with the electric industry, most of the complaints and payment arrangement requests dealt with matters covered under 52 PA Code, Chapter 56, the Standards and Billing Practices for Residential Utility Service. These consumer complaints and payment arrangement requests, for the most part, represent customer appeals to the Commission resulting from the inability of the company and the customer to reach a mutually satisfactory resolution to a dispute or payment negotiation. The tables and charts on the pages that follow depict the performance of each of the six major gas utilities in 1997. Appendices B through G present the actual statistics that the Bureau used to produce the charts in this chapter.
Consumer Complaints
During 1997, the BCS handled a total of 1,127 consumer complaints from customers of the various gas companies; 1,052 of the complaints were filed by residential customers. Of those residential complaints, 92% (968) were from customers of the six major gas companies.
Consumer Complaint Categories
After a BCS investigator closes a consumer complaint, the BCS research unit reviews the complaint, categorizes it into a specific problem category and enters it into the Bureau’s computerized information system. The BCS data system then aggregates the data from all complaints. The following table shows the percentage of 1997 complaints from residential customers of the six major gas utilities in each of the 13 categories used by the BCS research unit to categorize consumer complaints about electric, gas and water utilities. The percentages shown in the table are for all the cases that residential customers of the major gas utilities filed with BCS, not just cases determined to be justified in coming to the Bureau. Appendix C, Table 2 provides the actual number of cases that fell into each category in 1997.

30
Consumer Complaint Categories: 1997 Major Gas Utilities
Categories
Columbia
Equitable
NFG PG
Energy
Peoples UGI-Gas
Gas Majors
Metering 36% 19% 12% 17% 31% 22% 25%
Billing Disputes 16% 30% 32% 31% 25% 31% 26%
Discontinuance/ Transfer
6% 9% 19% 4% 12% 16% 11%
Other Payment Issues
4% 11% 5% 0% 3% 5% 5%
Credit & Deposits 1% 6% 3% 0% 3% 9% 4%
Service Extensions 4% 1% 3% 17% 3% 5% 4%
Service Interruptions 2% 1% 0% 0% 0% 0% 1%
Service Quality 4% 4% 8% 8% 2% 2% 4%
Damages 4% 1% 4% 4% 1% 2% 2%
Scheduling Delays 2% 0% 1% 0% 3% 1% 1%
Personnel Problems 7% 7% 4% 9% 5% 4% 6%
Rates 6% 8% 6% 8% 9% 1% 7%
All Other Problems 8% 3% 3% 2% 3% 2% 4%
TOTAL 100% 100% 100% 100% 100% 100% 100%
• Categories are for all residential complaints filed with BCS: justified, inconclusive and
unjustified. See Appendix A-1 for an explanation of complaint categories and Appendix B-2 for the number of cases in each category.
• More than 50% of the complaints about the major gas utilities in 1997 involved either
metering issues or billing disputes. • Rate complaints about the major gas utilities increased significantly from 1996 to 1997. In
1996, only 1% of consumer complaints related to rates.
31
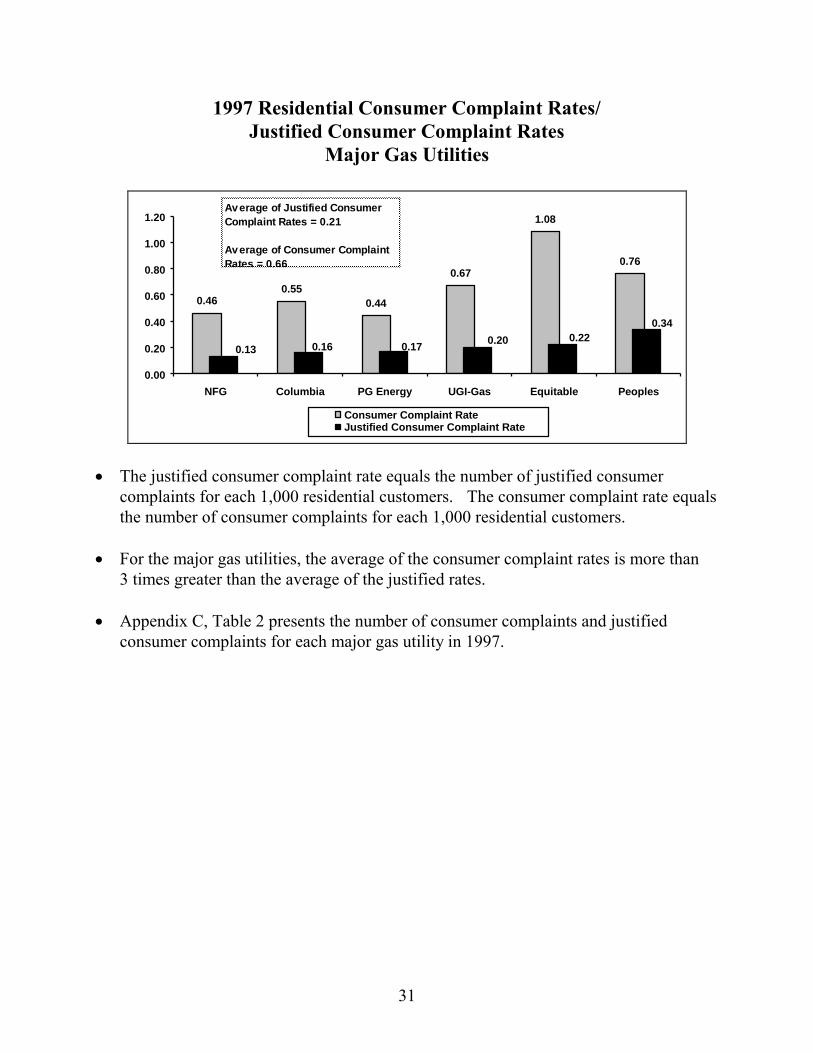
1997 Residential Consumer Complaint Rates/ Justified Consumer Complaint Rates
Major Gas Utilities
0.460.55
0.44
0.67
1.08
0.76
0.34
0.220.200.170.160.13
0.00
0.20
0.40
0.60
0.80
1.00
1.20
NFG Columbia PG Energy UGI-Gas Equitable Peoples
Consumer Complaint RateJustified Consumer Complaint Rate
Average of Justified Consumer
Complaint Rates = 0.21
Average of Consumer Complaint
Rates = 0.66
• The justified consumer complaint rate equals the number of justified consumer
complaints for each 1,000 residential customers. The consumer complaint rate equals the number of consumer complaints for each 1,000 residential customers.
• For the major gas utilities, the average of the consumer complaint rates is more than
3 times greater than the average of the justified rates. • Appendix C, Table 2 presents the number of consumer complaints and justified
consumer complaints for each major gas utility in 1997.
32
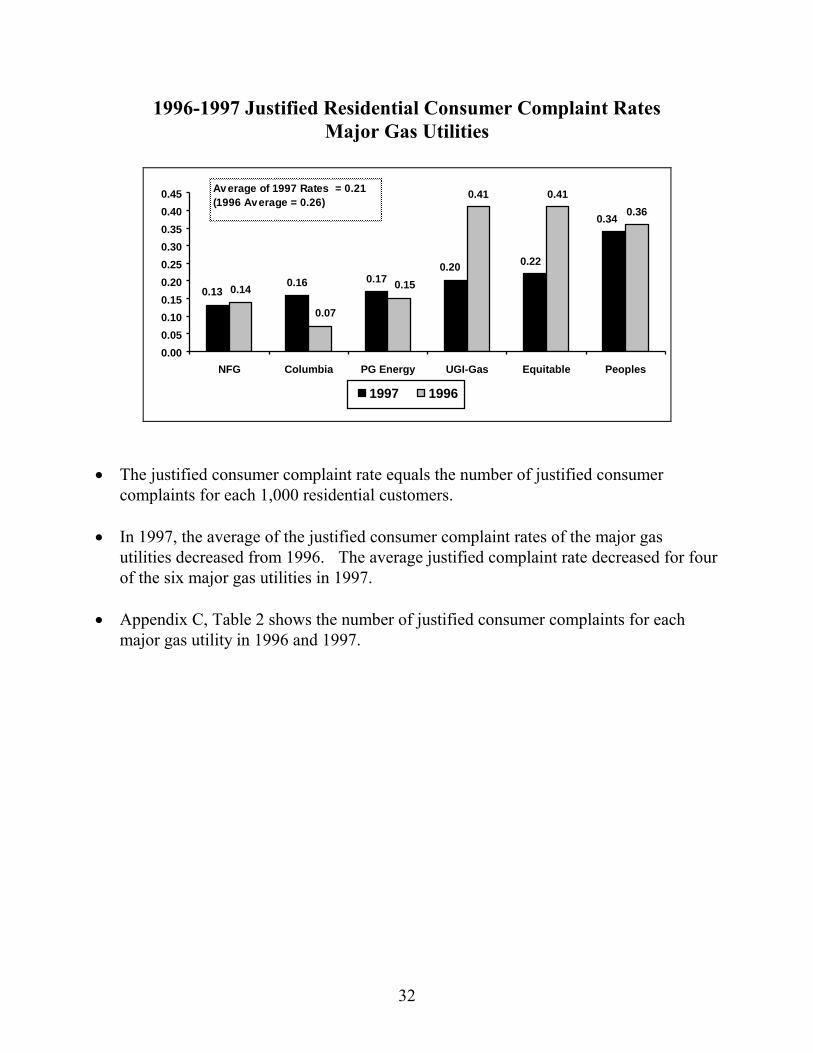
1996-1997 Justified Residential Consumer Complaint Rates Major Gas Utilities
0.16 0.170.14
0.41 0.41
0.360.34
0.220.20
0.130.15
0.07
0.00
0.05
0.10
0.15
0.20
0.25
0.30
0.35
0.40
0.45
NFG Columbia PG Energy UGI-Gas Equitable Peoples
1997 1996
Average of 1997 Rates = 0.21
(1996 Average = 0.26)
• The justified consumer complaint rate equals the number of justified consumer
complaints for each 1,000 residential customers. • In 1997, the average of the justified consumer complaint rates of the major gas
utilities decreased from 1996. The average justified complaint rate decreased for four of the six major gas utilities in 1997.
• Appendix C, Table 2 shows the number of justified consumer complaints for each
major gas utility in 1996 and 1997.

33
1996-1997 Response Time to BCS Residential Consumer Complaints
Major Gas Utilities
25.1
12.6
24.7
16.4
18.4
10.6
14.4
18.40
10.2
6.5
5.5
5.9
0 5 10 15 20 25 30
Columbia
Equitable
Peoples
UGI-Gas
NFG
PG Energy
Number of Days
1997 1996
Average of 1997 Response
Times = 13.4 Days
(1996 Average = 14.8 Days)
• The average response time for the major gas utilities decreased by 1.4 days from 1996
to 1997. All but one major gas utility decreased response time to consumer complaints in 1997, compared to 1996.
• Appendix D shows the 1996 and 1997 response times to consumer complaints for
each of the major gas utilities as well as for the major electric, water and telephone utilities.

34
Payment Arrangement Requests
In 1997, the Bureau of Consumer Services handled 12,133 payment arrangement requests (PARs) from customers of the gas industry; 12,053 were from residential customers. Ninety-seven percent (11,645) of the residential PARs were from customers of the six major gas utilities. As in past years, for the companies with the largest volume of requests, the Bureau research unit reviewed a representative sample of PARs for case outcome and response time. In 1997, the BCS reviewed a sample of the PARs for the following gas utilities: Columbia, Equitable, NFG, Peoples, and UGI-Gas. Thus, the calculations for justified payment arrangement request rate and response time that appear in the pages that follow are based on a subset of cases that the BCS received from customers of these utilities. The BCS believes that the size of the samples gives an adequate indication of the performance of these companies. Appendix E, Table 2 provides additional statistics regarding the payment arrangement requests from residential customers of the major gas utilities.
1997 Residential Payment Arrangement Request Rates/ Justified Payment Arrangement Request Rates
Major Gas Utilities
2.09
9.29
4.555.65
17.48
8.13
3.091.901.81
1.100.21
0.56
0.0
2.0
4.0
6.0
8.0
10.0
12.0
14.0
16.0
18.0
PG Energy Peoples* Columbia* NFG* Equitable* UGI-Gas*
PAR Rate Justified PAR Rate
Average of Justified PAR
Rates = 1.45
Average of PAR Rates = 7.86
* JPAR rates based on a probability sample of cases.
• The justified payment arrangement request rate equals the number of justified payment arrangement requests for each 1,000 residential customers. The payment arrangement request rate equals the number of payment arrangement requests for each 1,000 residential customers.

35
• In 1997, the average of the PAR rates for the major gas utilities is 40% higher than it was in 1996.
• Appendix E, Table 2 presents the number of payment arrangement requests and
justified payment arrangement requests for each major gas utility in 1997.
1996-1997 Justified Residential
Payment Arrangement Request Rates Major Gas Utilities
0.21
0.56
1.81
3.09
0.21
0.870.57
1.03
1.55
2.011.90
1.10
0.0
0.5
1.0
1.5
2.0
2.5
3.0
3.5
PG Energy Peoples* Columbia* NFG* Equitable* UGI-Gas*
1997 1996
Average of 1997 Rates = 1.45
(1996 Average = 1.04)
* Based on a probability sample of cases.
• The justified payment arrangement request rate equals the number of justified
payment arrangement requests for each 1,000 residential customers. • The average of the justified PAR rates for the six major gas utilities increased by 39%
for the six major gas utilities. On average, there were almost 1.5 justified payment arrangement requests for each 1,000 residential customers of these companies in 1997.
• Appendix E, Table 2 presents the number of justified payment arrangement requests
for each major gas utility in 1996 and 1997.

36
1996-1997 Response Time to BCS Residential Payment Arrangement Requests
Major Gas Utilities
21.1
4.7
6.1
5.4
4.5
11.1
8.7
5.3
3.1
3.0
4.6
2.0
0 5 10 15 20 25
Equitable*
Columbia*
NFG*
UGI-Gas*
Peoples*
PG Energy
Number of Days
1997 1996
Average of 1997 Response
Times = 6.0 Days
(1996 Average = 7.3 Days)
* Based on a probability sample of cases
• From 1996 to 1997, the average response time to BCS payment arrangement requests decreased by 1.3 days.
• Four of the six major gas utilities had shorter response times to BCS payment
arrangement requests in 1997 than in 1996. • Appendix F shows the 1996 and 1997 response times to payment arrangement
requests for each of the major gas utilities as well as for the major electric and water utilities. Appendix F also shows the 1997 response times to PARs for the major telephone utilities.

37
Termination of Service
Each month, the gas utilities report to the Commission the number of residential accounts that they terminated during the previous month. Some utilities have maintained a fairly consistent pattern of termination behavior, while others fluctuate from year to year. The table that follows indicates the annual number of residential accounts each of the six largest gas utilities terminated in 1995, 1996 and 1997. The table also presents the termination rates for each of these companies.
Residential Service Terminations/Termination Rates Major Gas Utilities
Residential Service Terminations Termination Rates Company Name
1995
1996
1997
% Change in # 1996-1997
1995
1996
1997
Columbia 3,841 4,976 5,490 10% 11.70 15.06 16.76 Equitable 2,988 3,323 3,361 1% 13.05 14.51 14.70 NFG 3,231 3,927 5,500 40% 16.70 20.18 28.23 Peoples 3,931 3,217 4,513 40% 12.57 10.21 14.26 PG Energy 2,266 2,175 2,960 36% 17.71 16.78 22.47 UGI-Gas 4,135 5,274 6,474 23% 18.88 23.72 28.58 Major Gas 20,392 22,892 28,298 24% Average of Rates
15.10
16.74
20.83
• Each of the major gas utilities terminated more residential accounts in 1997 than they
did in 1996.

38
Compliance
The Bureau’s primary compliance effort is its informal compliance process. This process provides utilities with specific examples of apparent problems that may reflect infractions of Chapter 56 regulations. Often, through the informal notification process, the BCS provides utilities with written clarifications or explanations of Chapter 56 provisions and Bureau policies. During 1995, 1996 and 1997, the Bureau determined that the six major gas utilities together logged 1,071 infractions of regulations. The chart that follows and the infraction statistics in Appendix G, Table 2 are drawn from the informal complaints that residential consumers filed with the BCS from 1995 through 1997.
PUC Infraction Rates
Major Gas Utilities
0.18
0.65
0.35
0.53
0.21
0.35
0.160.16
0.130.110.10
0.150.15
0.31 0.32
0.160.12
0.26
0.00
0.10
0.20
0.30
0.40
0.50
0.60
0.70
NFG Equitable PG Energy Columbia UGI-Gas Peoples
1997 1996 1995
• The infraction rate is the number of informally verified infractions per 1,000
residential customers. • Overall, infraction rates decreased for the major gas utilities in 1997. • Infraction rates decreased for four of the six major gas utilities in 1997. • Appendix G, Table 2 presents the actual number of infractions for each major gas
utility in 1995, 1996 and 1997.

39
5. Water Industry In 1997, the Commission had jurisdiction over 207 water utilities, including approximately 45 municipal water companies. The Commission categorizes the non-municipal water utilities into one of four classifications: A, B, C and Short Form. These four classifications are based on the amount of the utility’s annual revenues. The non-municipal water utilities with the largest annual revenues are classified as Class A water utilities. Class A water companies must have annual revenues of $750,000 or more for three years in a row. In 1997 there were 13 Class A water companies that served the vast majority of residential water customers. In 1997, the number of residential customers for these companies ranged from 1,815 residential customers (Audubon Water) to 492,306 residential customers (Pennsylvania-American Water Company). In 1997, the Class A water companies included Audubon Water Company, Citizens Utilities Water - PA, Columbia Water Company, Consumers PA Water, Company - Susquehanna Division, Consumers PA Water - Shenango Division, Consumers Water Company - Roaring Creek Division, Manufacturer’s Water Company (no residential customers), National Utilities, Inc., Newtown Artesian Water Company, Pennsylvania-American Water Company, Philadelphia Suburban Water Company, United Water of Pennsylvania, Inc. and York Water Company. The tables and charts in this chapter present statistics for the two largest water companies -- Pennsylvania-American Water Company and Philadelphia Suburban Water Company -- and for the other “Class A” companies as a whole. The other classes of water companies have lower annual revenues and typically, fewer residential customers. Class B water companies have annual revenues between $100,001 and $749,999. In 1996, the latest year for which this information is available, the number of residential customers for the Class B companies ranged from 159 to 2,229 residential customers (in 1998, there are 28 Class B companies). Class C water companies have annual revenues between $5,001 and $100,000. The number of residential customers for the Class C companies ranged from 19 to 86,354 residential customers in 1996 (in 1998, there are 105 Class C companies). The 14 companies classified as SF (short form) in 1998 have annual revenues of less than $5,000. Data from 1996 show that the number of residential customers for the Class SF companies ranged from 18 to 67 residential customers. The municipal water companies are companies owned by municipalities that serve customers outside their boundaries. The Commission’s jurisdiction is limited to service and customers outside the municipalities. The Commission does not keep records of the number of residential customers each municipal company serves. Overall, in 1996, the

40
total number of customers served by the municipals that were outside the boundaries of a particular municipality ranged from 3 to 3,507 customers. As would be expected, the majority of the residential consumer complaints and payment arrangement requests to the BCS involving water utilities came from customers of the water utilities with the largest number of residential customers, the Class A water utilities. Most of the complaints and payment arrangement requests from water customers dealt with matters covered under 52 PA Code, Chapter 56, the Standards and Billing Practices for Residential Utility Service. These consumer complaints and payment arrangement requests, for the most part, represent customer appeals to the Commission resulting from the inability of the company and the customer to reach a mutually satisfactory resolution to a dispute or payment negotiation. The table and charts on the pages that follow depict the performance of the Class A water utilities in 1997. Appendices B through G present the actual statistics that the Bureau used to produce the charts in this chapter.
Consumer Complaints During 1997, the BCS handled a total of 652 consumer complaints from customers of the various water companies; 623 of the complaints were filed by residential customers. Of those residential complaints, 79% (494) were from customers of the Class A companies. The remaining 21% of the residential consumer complaints were from customers of 47 smaller water companies. In spite of the fact that the vast majority of consumer complaints involved the Class A water utilities in 1997, the Commission devoted a significant amount of attention to the smaller water utilities. Often the amount of time that the BCS spends on a few complaints from customers of a smaller company far exceeds the amount of time it spends dealing with the larger number of complaints filed against one of the larger companies. This is because larger companies typically have the resources to respond appropriately to complaints and payment arrangement requests as compared to smaller water companies with limited resources.
41
Consumer Complaint Categories
After a BCS investigator closes a consumer complaint, the BCS research unit reviews the complaint, categorizes it into a specific problem category and enters it into the Bureau’s computerized information system. The BCS data system then aggregates the data from all complaints. The following table shows the percentage of 1997 complaints from residential customers of the Class A water utilities in each of the 13 categories used by the BCS research unit to categorize consumer complaints about electric, gas and water utilities. The percentages shown in the table are for all the cases that residential customers of these water utilities filed with BCS, not just cases determined to be justified in coming to the Bureau. Appendix C, Table 3 provides the actual number of cases that fell into each category in 1997.

42
Consumer Complaint Categories: 1997 Major Water Utilities
Categories
PA-American
Philadelphia Suburban
Other “Class A” Water
All “Class A” Water
Metering 12% 23% 8% 13%
Billing Disputes 40% 50% 6% 31%
Discontinuance/ Transfer 3% 9% 2% 4%
Other Payment Issues 2% 0% 0% 1%
Credit & Deposits 1% 3% 3% 2%
Service Extensions 8% 1% 17% 10%
Service Interruptions 1% 0% 3% 2%
Service Quality 11% 4% 52% 21%
Damages 7% 1% 2% 4%
Scheduling Delays 1% 1% 2% 2%
Personnel Problems 7% 4% 2% 5%
Rates 2% 0% 1% 1%
All Other Problems 5% 4% 2% 4%
TOTAL 100% 100% 100% 100% • Categories are for all residential complaints filed with the BCS: justified,
inconclusive and unjustified. See Appendix A-1 for an explanation of the various complaint categories and Appendix B-3 for the number of cases in each category.
• More than half of the consumer complaints about the Class A water utilities involved either billing disputes or service quality issues.
• The percentage of complaints about metering decreased from 1996 to 1997. In
1996, seventeen percent of the complaints about the Class A water utilities involved metering. The percentage of complaints about service quality also decreased, while billing disputes accounted for a greater percentage of the complaints in 1997 than in 1996.

43
1997 Residential Consumer Complaint Rates/ Justified Consumer Complaint Rates
Major Water Utilities
0.28
0.53
0.93
0.60
0.160.09
0.00
0.10
0.20
0.30
0.40
0.50
0.60
0.70
0.80
0.90
1.00
Phila. Suburban PA-American Other Class A
Co's
Consumer Complaint RatesJustified Consumer Complaint Rates
Average of Consumer
Complaint Rates = 0.58
Average of Justified Consumer
Complaint Rates = 0.28
• The justified payment arrangement request rate equals the number of justified
payment arrangement requests for each 1,000 residential customers. The payment arrangement request rate equals the number of payment arrangement requests for each 1,000 residential customers.
• The average of the consumer complaint rates is more than 2 times greater than the
average of the justified rates for the Class A water companies. • Appendix C, Table 3 presents the actual number of consumer complaints and justified
consumer complaints for Philadelphia Suburban, PA-American and the other Class A companies in 1997.

44
1996-1997 Justified Residential Consumer Complaint Rates
Major Water Utilities
0.09
0.160.12
0.33
0.60
0.10
0.00
0.10
0.20
0.30
0.40
0.50
0.60
Phila. Suburban PA-American Other Class A Co's.
1997 1996
Average of 1997 Rates = 0.28
(1996 Average = 0.18)
• The justified consumer complaint rate equals the number of justified consumer
complaints for each 1,000 residential customers. • The average of the justified consumer complaint rates for the “Class A” water utilities
increased by more than 50% from 1996 to 1997. • Appendix C, Table 3 shows the number of justified consumer complaints for
Philadelphia Suburban, PA-American and the other Class A water companies in 1996 and 1997.
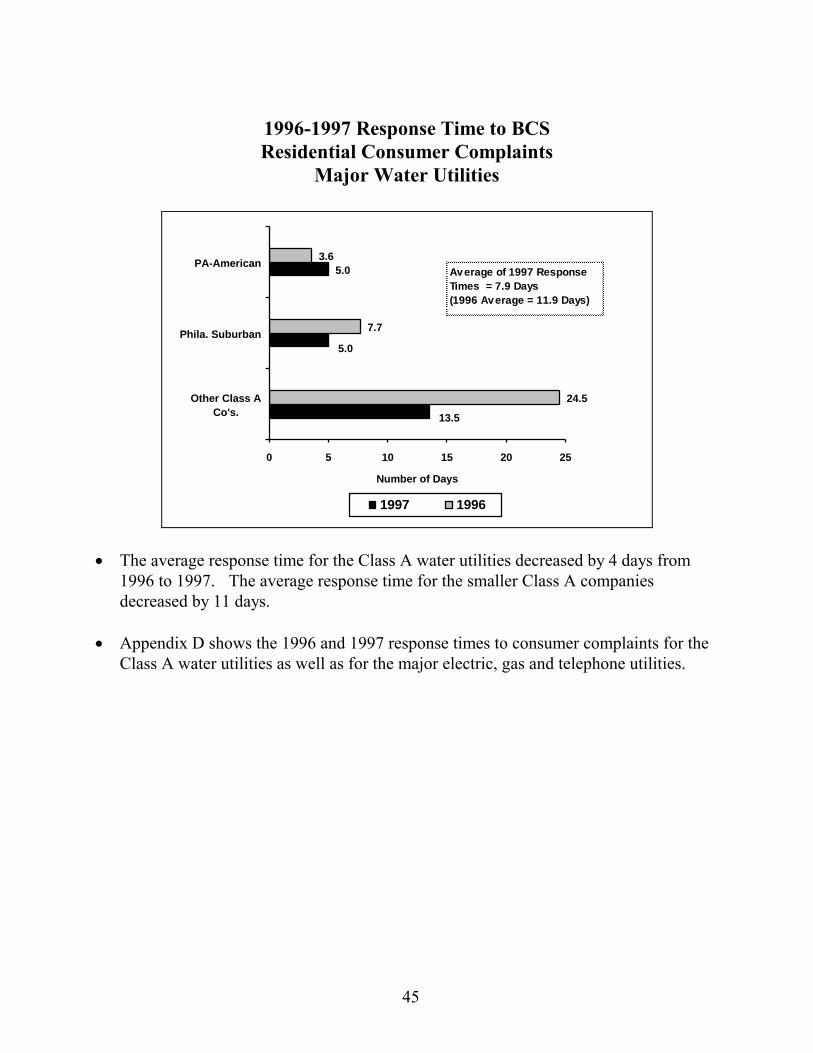
45
1996-1997 Response Time to BCS Residential Consumer Complaints
Major Water Utilities
5.0
24.5
7.7
3.6
13.5
5.0
0 5 10 15 20 25
Other Class A
Co's.
Phila. Suburban
PA-American
Number of Days
1997 1996
Average of 1997 Response
Times = 7.9 Days
(1996 Average = 11.9 Days)
• The average response time for the Class A water utilities decreased by 4 days from
1996 to 1997. The average response time for the smaller Class A companies decreased by 11 days.
• Appendix D shows the 1996 and 1997 response times to consumer complaints for the
Class A water utilities as well as for the major electric, gas and telephone utilities.

46
Payment Arrangement Requests
In 1997, the Bureau of Consumer Services handled 1,490 payment arrangement requests (PARs) from customers of the water industry; 1,481 were from residential customers. Ninety-eight percent (1,452) of the residential PARs were from customers of the 13 Class A water utilities. As in past years, for the companies with the largest volume of requests, the Bureau research unit reviewed a representative sample of PARs for case outcome and response time. In 1997, the BCS reviewed a sample of the PARs for Pennsylvania-American Water Company. Thus, the calculations for justified payment arrangement request rate and response time that appear in the pages that follow are based on a subset of cases that the BCS received from customers of PA-American. The BCS believes that the size of the sample gives an adequate indication of the performance of this company. Appendix E, Table 3 provides additional statistics regarding the payment arrangement requests from residential customers of the Class A water utilities.
1997 Residential Payment Arrangement Request Rates/
Justified Payment Arrangement Request Rates Major Water Utilities
1.33
0.48
2.24
0.380.230.15
0.00
0.50
1.00
1.50
2.00
2.50
PA-American Phila. Sub. Other Class A
PAR Rate Justified PAR Rate
Average of Justified PAR
Rates = 0.26
Average of PAR Rates = 1.35
• The justified payment arrangement request rate equals the number of justified payment arrangement requests for each 1,000 residential customers. The payment arrangement request rate equals the number of payment arrangement requests for each 1,000 residential customers.
• On average, for the Class A water utilities, there were 1.35 payment arrangement
requests for each 1,000 residential customers in 1997.

47
• Appendix E, Table 3 presents the number of payment arrangement requests and justified payment arrangement requests for PA-American, Philadelphia Suburban and the other Class A water companies in 1997.
1996-1997 Justified Residential Payment Arrangement Request Rates
Major Water Utilities
0.15
0.23
0.38
0.130.14
0.23
0.00
0.05
0.10
0.15
0.20
0.25
0.30
0.35
0.40
PA-American* Phila. Sub. Other Class A
1997 1996
Average of 1997 Rates = 0.26
(1996 Average = 0.17)
* Based on a probability sample of cases.
• The justified payment arrangement request rate equals the number of justified payment arrangement requests for each 1,000 residential customers.
• From 1996 to 1997, the average of the justified PAR rates increased by 53% for the
Class A water utilities. • Appendix E, Table 3 presents the number of justified payment arrangement requests
for PA-American, Philadelphia Suburban and the other Class A water companies in 1996 and 1997.

48
1996-1997 Response Time to BCS Residential Payment Arrangement Requests
Major Water Utilities
15.3
3.8
2.0
22.4
4.9
2.2
0 5 10 15 20 25
Other Class A Water
Co's
Phila. Suburban
PA-American*
Number of Days
1997 1996
Average of 1997 Response
Times = 7.0 Days
(1996 Average = 9.8 Days)
* Based on a probability sample of cases.
• The average of the 1997 response times to payment arrangement requests for the Class A water companies decreased by 2.8 days from 1996. Response time decreased for the two largest companies and for the combination of the other Class A companies as well.
• Appendix F shows the 1996 and 1997 response times to payment arrangement
requests for the Class A water utilities as well as for the major electric and gas utilities. Appendix F also shows the 1997 response times to PARs for the major telephone utilities.

49
Compliance
The Bureau’s primary compliance effort is its informal compliance process. This process provides utilities with specific examples of apparent problems that may reflect infractions of Chapter 56 regulations. Often, through the informal notification process, the BCS provides utilities with written clarifications or explanations of Chapter 56 provisions and Bureau policies. During 1995, 1996 and 1997, the Bureau informally verified 444 infractions of regulations for the Class A water utilities. The chart that follows and the infraction statistics in Appendix G, Table 3 are drawn from the informal complaints that residential consumers filed with the BCS from 1995 through 1997.
PUC Infraction Rates Major Water Utilities
0.14
0.17
0.34
0.23
0.090.09
0.32
0.20
0.09
0.00
0.05
0.10
0.15
0.20
0.25
0.30
0.35
PA-American Phila. Sub. Other Class A
1997 1996 1995
• The infraction rate is the number of informally verified infractions per 1,000
residential customers. • The number of informally verified infractions and the infraction rates for the Class A
water companies decreased from 1996 to 1997. • Appendix G, Table 3 presents the actual number of infractions for PA-American,
Philadelphia Suburban and the other Class A water companies in 1995, 1996 and 1997.
50
6. Telephone Industry Given the growing competitive telecommunications market, the BCS may handle
cases against or inquiries about many different types of telecommunication service providers such as local telephone utilities, resellers, access providers, operator services, competitive local exchange carriers including billing services for telecommunication providers. As a result of this growth there were over 500 such providers doing business in Pennsylvania. Of this group of telecommunications providers, 37 were local telephone utilities. Thirty-two of the local telephone utilities are nonmajor utilities each serving less than 50,000 residential customers. The remaining five local telephone utilities are major utilities, each with over 100,000 residential customers. Collectively, the major telephone utilities serve over 4.9 million residential accounts. This chapter will focus exclusively on the five major telephone utilities: ALLTEL Pennsylvania, Inc. (ALLTEL), Bell Atlantic-Pennsylvania, Inc. (Bell), Commonwealth Telephone Company (Commonwealth), GTE North Incorporated (GTE) and United Telephone Company of Pennsylvania (United) d/b/a Sprint.
Consumer Complaints
As previously stated, the Bureau may handle consumer complaints regarding many different types of telecommunication providers. In 1997, the Bureau handled 3,467 complaints from residential and commercial customers. Of these complaints, 1,549 were about problems with other telecommunications providers. However, the problems consumers encounter with other entities generally start as an informal complaint filed against either a local company or a long distance company. During 1997, the Bureau handled 1,918 consumer complaints from residential and commercial customers about problems they had with local telephone utilities. Within this universe of cases, 1,542 were residential consumer complaints against the five major telephone utilities.
Consumer Complaint Categories Most of the cases found in the consumer complaint categories deal with matters covered under 52 Pa. Code Chapter 64 and 52 Pa. Chapter 63. The consumer complaint categories present the percentage of consumer complaints found in each of the 13 complaint categories for all major telephone utilities and the telephone industry The Bureau classifies all consumer complaints first into one of six major problem areas then expands them into one of 13 distinct problem categories for the telephone industry.
Consumer Complaint Categories: 1997
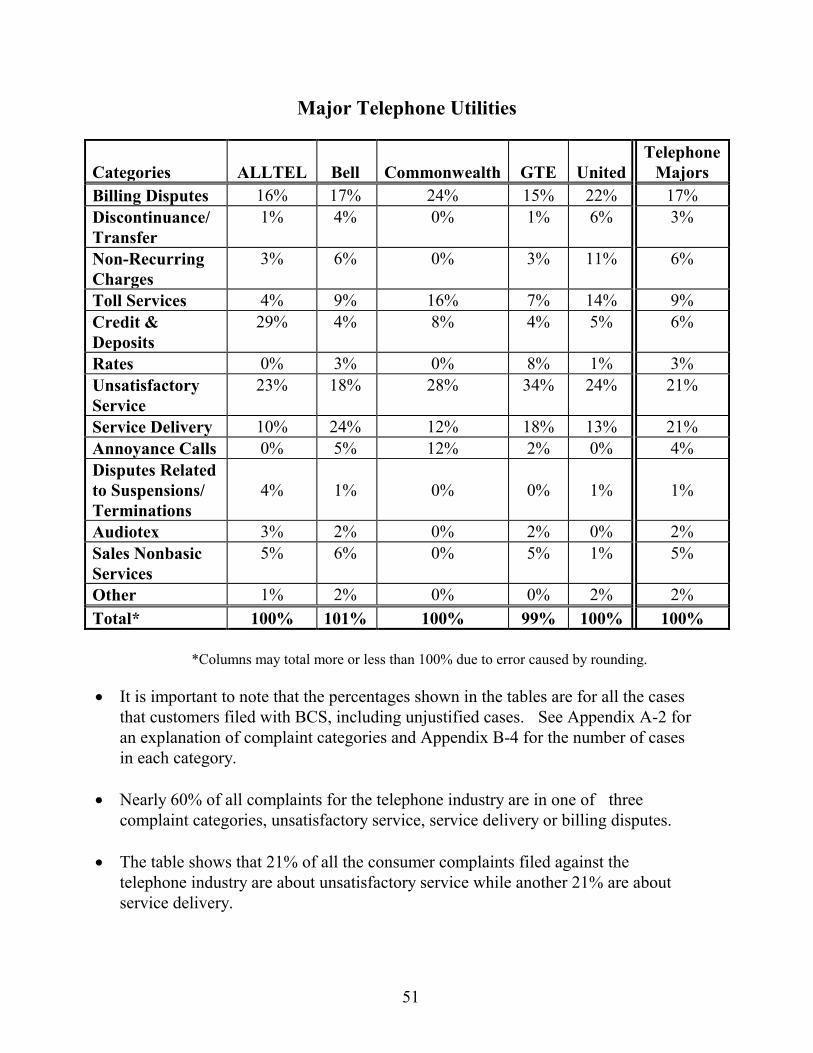
51
Major Telephone Utilities Categories
ALLTEL
Bell
Commonwealth
GTE
United
Telephone Majors
Billing Disputes 16% 17% 24% 15% 22% 17% Discontinuance/Transfer
1% 4% 0% 1% 6% 3%
Non-Recurring Charges
3% 6% 0% 3% 11% 6%
Toll Services 4% 9% 16% 7% 14% 9% Credit & Deposits
29% 4% 8% 4% 5% 6%
Rates 0% 3% 0% 8% 1% 3% Unsatisfactory Service
23% 18% 28% 34% 24% 21%
Service Delivery 10% 24% 12% 18% 13% 21% Annoyance Calls 0% 5% 12% 2% 0% 4% Disputes Related to Suspensions/ Terminations
4%
1%
0%
0%
1%
1%
Audiotex 3% 2% 0% 2% 0% 2% Sales Nonbasic Services
5% 6% 0% 5% 1% 5%
Other 1% 2% 0% 0% 2% 2% Total* 100% 101% 100% 99% 100% 100% *Columns may total more or less than 100% due to error caused by rounding. • It is important to note that the percentages shown in the tables are for all the cases
that customers filed with BCS, including unjustified cases. See Appendix A-2 for an explanation of complaint categories and Appendix B-4 for the number of cases in each category.
• Nearly 60% of all complaints for the telephone industry are in one of three
complaint categories, unsatisfactory service, service delivery or billing disputes. • The table shows that 21% of all the consumer complaints filed against the
telephone industry are about unsatisfactory service while another 21% are about service delivery.

52
• Billing disputes account for 17% of the total number of consumer complaints. With the exception of toll services (9%), the remaining complaint categories each account for 6% or less of total complaints about the telephone industry.
1997 Residential Consumer Complaint Rates/
Justified Consumer Complaint Rates Major Telephone Utilities
• The justified consumer complaint rate equals the number of justified consumer
complaints for each 1,000 residential customers. The consumer complaint rate equals the number of consumer complaints for each 1,000 residential customers.
• The Bureau received fewer complaints from customers about the telephone industry
in 1997. As a result of this decrease in complaints, the telephone industry average for consumer complaint rate decreased from 1996 to 1997.
• Generally, the justified consumer complaint rate is less than the consumer complaint rate. For 1997, the industry average for consumer complaint rate is almost twice the justified consumer complaint rate.
• Appendix C, Table 4 shows the number of consumer complaints and justified
consumer complaints for each major telephone utility in 1997.
0.16
0.47
0.340.31
0.34
0.28
0.210.17
0.120.08
0.00
0.05
0.10
0.15
0.20
0.25
0.30
0.35
0.40
0.45
0.50
Commonwealth United Bell GTE ALLTEL
Consumer Complaint Rate Justified Consumer Complaint Rate
Average of Justified Consumer Complaint Rates = .17
Average of Consumer Complaint Rates = .32

53
1996-1997 Justified Residential Consumer Complaint Rates Major Telephone Utilities
0.12
0.17
0.21
0.28
0.110.09
0.26
0.18
0.08
0.18
0.00
0.05
0.10
0.15
0.20
0.25
0.30
Commonwealth United Bell GTE ALLTEL
1997 1996
Average of 1997 Rates = .17
(1996 Average of Rates = .16)
• The justified consumer complaint rate equals the number of justified consumer complaints for each 1,000 residential customers.
• Most major telephone utilities' overall effectiveness at handling consumer
complaints improved from 1996 to 1997. The telephone industry’s justified rate remained relatively stable in 1997.
• Appendix C, Table 4 shows the number of justified consumer complaints for each
major telephone utility in 1996 and 1997.

54
1996-1997 Response Time to BCS Residential Consumer Complaints
Major Telephone Utilities
26.5
9.6
4.3
3.9
20.6
18.8
7.7
9.5
4.9
19.00
0.0 5.0 10.0 15.0 20.0 25.0 30.0
GTE
Bell
United
Commonwealth
ALLTEL
1997 1996
Number of Days
Average of 1997 Response
Times = 12.7 days
(1996 Average = 12.3 days)
• See Appendix D shows the 1996 and 1997 response times to consumer
complaints for each of the major telephone utilities as well as for the major electric, gas and water utilities.

55
Payment Arrangement Requests
Telephone service falls into three categories: basic, nonbasic and toll service. However, the Bureau does not handle customer requests for payment arrangements that involve toll or nonbasic services. For the telephone industry, payment arrangement requests are principally contacts to the Bureau or to utilities involving a request for payment terms for basic service. Most payment arrangement requests are cases relating to the cessation of telephone service and are registered during the suspension phase. Under Chapter 64, a customer contact in response to a suspension notice is a dispute (as the term is defined in §64.2) only if the contact includes a disagreement with respect to the application of a provision of Chapter 64. Where telephone cases involving telephone service suspension are concerned, failure to negotiate a payment arrangement does not in itself mean that a dispute exists. Consequently, in this report, telephone cases that involve payment arrangement requests have been separated from telephone cases that also involve a dispute. During 1997, the Bureau handled 5,070 from residential and commercial customers of local telephone utilities. Of these cases, 4,987 payment arrangement requests were from customers of the five major telephone utilities: ALLTEL, Bell, Commonwealth, GTE and United.
A combination of factors came into play for 1996 payment arrangement requests that resulted in the Bureau being unable to fairly assess major telephone utilities’ effectiveness at handling such requests. The factors included the separation of payment arrangement requests from consumer complaints, a computer programming conversion and a relatively low volume of payment arrangement requests for some companies. As a result of these factors the report will not contain 1996 justified payment arrangement request rates or response time figures for major telephone utilities. However, this report does contain information about the volume of payment arrangement requests for both 1996 and 1997 (see Appendix E - Table 4) for major telephone utilities. The 1997 payment arrangement request figures for justified payment arrangement request rate and response time are available for major telephone utilities and are presented in the tables that follow. As previously mentioned, the Bureau has used sampling over the years to evaluate the large volume of cases it receives from the largest major utilities. Given the large volume of payment arrangement requests from Bell, the Bureau evaluated a representative sample of the company’s payment arrangement requests to determine justified rate and response time. Even so, the BCS believes that the size of the sample gives an adequate indication of the company’s performance.

56
1997 Residential Payment Arrangement Request Rates/ Justified Payment Arrangement Request Rates
Major Telephone Utilities
* JPAR rate based on a probability sample of cases.
• The justified payment arrangement request rate equals the number of justified
payment arrangement requests for each 1,000 residential customers. The payment arrangement request rate equals the number of payment arrangement requests for each 1,000 residential customers.
• Most customers in 1997 had already contacted their utility prior to contacting the BCS
regarding a payment arrangement request. Fewer customers sought the Commission’s assistance in making payment arrangements with their local telephone utilities from 1996 to 1997.
• The payment arrangement request rate for the major telephone utilities is nearly three
and half times the justified payment arrangement request rate. • Appendix E, Table 4 presents the number of payment arrangement requests and
justified payment arrangement requests for each major telephone utility in 1997.
0.200.10
0.18
0.55
1.25
0.35
0.140.100.040.03
0.00
0.20
0.40
0.60
0.80
1.00
1.20
1.40
United Commonwealth GTE ALLTEL Bell*
PAR Rate Justified PAR Rate
Average of Justified PAR Rates = .13
Average of PAR Rates = .46
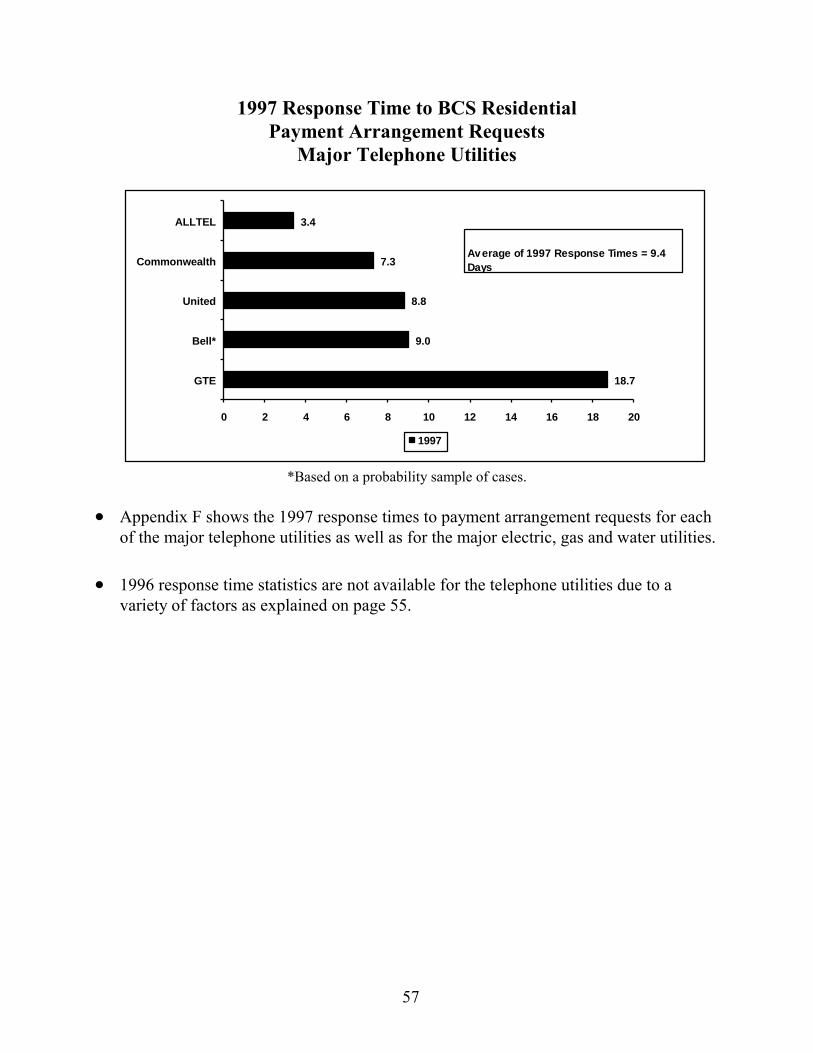
57
1997 Response Time to BCS Residential Payment Arrangement Requests
Major Telephone Utilities
18.7
8.8
7.3
3.4
9.0
0 2 4 6 8 10 12 14 16 18 20
GTE
Bell*
United
Commonwealth
ALLTEL
1997
Average of 1997 Response Times = 9.4
Days
*Based on a probability sample of cases.
• Appendix F shows the 1997 response times to payment arrangement requests for each of the major telephone utilities as well as for the major electric, gas and water utilities.
• 1996 response time statistics are not available for the telephone utilities due to a
variety of factors as explained on page 55.

58
Termination of Service
In Chapter 64, suspension is defined as a temporary cessation of service without the consent of the customer. Termination of service, according to Chapter 64, is the permanent cessation of service after a suspension without the consent of the customer. Most payment arrangement requests are cases relating to the cessation of telephone service and are registered during the suspension phase. Many customers who have their basic service suspended are able to make payment arrangements and avoid termination. Those who are not able to avoid termination cease to be customers once the termination of basic service takes place. For the telephone industry, termination rate is based on the number of basic service terminations per one thousand residential customers. Shifts in terminations can signal potential problems with customers maintaining basic telephone service and the impact of universal service programs for telephone.
Residential Service Terminations/Termination Rates
Major Telephone Utilities Residential Service Terminations Termination Rates
Company
Name
1995
1996
1997
% Change in #
1996-1997
1995
1996
1997 ALLTEL 3,096 3,780 3,564 -6% 18.49 22.28 20.50 Bell 118,596 114,336 158,892 39% 32.07 30.51 41.92 Commonwealth 2,628 3,048 3,420 12% 15.19 17.32 17.38 GTE1 --- --- 70,572 --- --- --- 150.91 United 5,652 5,448 5,292 -3% 21.13 20.07 19.22 Major Telephone
129,9722
126,6122
241,740
35%2
Average of Rates
21.722
22.552
49.99
1Prior to 1997, GTE relied on one data source that counted only the number customers that were terminated and final
billed; any customer that was terminated and paid their outstanding balance prior to being final billed was not counted.
2Does not include GTE. • Overall, major telephone utilities reported more basic service terminations in 1997
than in 1996.

59
Compliance
The Bureau's primary compliance effort is its informal compliance process. This process provides utilities with specific examples of apparent problems that may reflect infractions of Chapter 64 regulations. Often, through the informal notification process, the BCS provides utilities with written clarifications or explanations of Chapter 64 provisions and Bureau policies. During 1995, 1996 and 1997, the Bureau determined that the five major local telephone utilities under the PUC's jurisdiction together logged 5,117 informally verified infractions of the Chapter 64 standards and billing practices. The informal compliance process is specifically designed to identify systematic errors. Utilities can then investigate the scope of the problem and take corrective action.
The following data come from the informal complaints filed with the PUC by residential customers during 1995, 1996 and 1997. The informally verified infraction statistics for the five major telephone utilities are presented by company and year in Appendix G. It is important to keep in mind that the figures presented in this table are viewed by the BCS along with other information that is case specific. The value of the aggregate figures is to depict apparent trends over time and point out extreme deviations. The data used for this section was retrieved from the BCS' Compliance Tracking System as of June 1998.

60
PUC Infraction Rate Major Telephone Utilities
0.24
0.39
0.76
0.31 0.33
0.230.17
0.69
0.37
0.17
1.14
0.23
0.30
0.210.21
0.00
0.20
0.40
0.60
0.80
1.00
1.20
Commonwealth Bell United ALLTEL GTE
1997 1996 1995
• The infraction rate is the number of informally verified infractions per 1,000 residential customers.
• Overall, the number of informally verified infractions reported by BCS for
the five major local exchange carriers declined 15% from 1996 to 1997. • Overall, compliance performance improved from 1996 to 1997 based on the
number of informally verified infractions. • Appendix G, Table 4 presents the actual number of infractions for each major
telephone utility in 1995, 1996 and 1997.

61
7. Universal Service and Energy Conservation Programs The Public Utility Commission has a long history of involvement in universal service and energy conservation programs for utility customers that help consumers obtain and keep service and conserve energy. In the sections that follow, readers will find highlights of the many programs that the PUC has supported and encouraged, not only in 1997 but in prior years as well.
Electric, Gas and Water Programs The Public Utility Commission has given the Bureau of Consumer Services the responsibility for monitoring and evaluating the universal service and energy conservation programs of the electric, gas and water companies. The Commission has mandated “universal service” programs for the electric distribution companies and for all telephone companies offering residential service. However, in this report, the BCS uses the term “universal service” to describe programs in all four industries that offer assistance to low income customers to help them maintain their utility service. The Bureau’s goal in monitoring these programs is to increase the effectiveness of utility collections while protecting the public’s health and safety. The Electricity Generation Customer Choice and Competition Act (Act) that was signed by Governor Ridge on December 3, 1996 imposes a mandate for universal service and energy conservation policies, programs and protections. The Act includes many
provisions designed to ensure that electric service is universally available in Pennsylvania
as it makes the transition to a competitive generation market. As a result, the Commission and the Bureau of Consumer Services have devoted a great deal of time and attention in 1997 to developing guidelines for these important programs. On July 10, 1997, the Commission approved the Final Order that established Guidelines for Universal Service and Energy Conservation Programs for the electric distribution companies (EDCs). The Guidelines are the Commission views regarding how individual utilities should address these issues in their restructuring proceedings. The Commission also prepared a rulemaking that was approved by the Independent Regulatory Review Commission in June 1998. This new regulation establishes standard reporting requirements for universal service programs. The data collected as a result of the reporting requirements will assist the Commission in ensuring that universal service programs are appropriately funded and available as required by the Act.

62
The following sections briefly discuss the status of universal service programs in the electric, gas and water industries during 1997. The programs include Customer Assistance Programs, the Low Income Usage Reduction Programs, Utility Hardship Fund Programs, Customer Assistance and Referral Evaluation Services programs, and other programs to assist low income customers. Customer Assistance Programs On July 25, 1992, the Commission adopted a Policy Statement on Customer Assistance Programs (CAPs). The Policy Statement establishes a model CAP designed to be a more cost-effective approach for dealing with issues of customer inability to pay than traditional collection methods. Based on experience and new circumstances under the Act, the Commission recognized that some changes to CAPs were necessary. The Commission’s Guidelines now operate in conjunction with the CAP Policy Statement. The Guidelines include two significant changes: 1) payment level ranges are higher and 2) the electric utilities should use net CAP costs when determining a CAP budget. Net costs consider the avoided costs of traditional collections. Traditional collections include uncollectible expense, payment agreements and similar costs. The Guidelines also prescribe a method to determine collection costs. CAPs provide an alternative to traditional collection methods for low income, payment troubled utility customers. Generally, customers enrolled in a CAP agree to make monthly payments to the utility based on household size and gross income. These regular monthly payments, which may be for an amount that is less than the current bill for utility service, are made in exchange for continued provision of the service. Besides regular monthly payments, customers need to comply with certain responsibilities and restrictions to remain eligible for continued participation. This section presents a progress report on the implementation of the Commission's CAP policy statement by the major electric and gas utilities in Pennsylvania. This section also includes a summary of the results of a process evaluation for Duquesne and an impact evaluation for Allegheny Power.
CAP Progress Report
In 1997, all of the major electric and gas utilities except Penn Power and
UGI-Electric had operational CAPs. As a result of the final restructuring orders, each major electric utility will have a CAP beginning in 1999.
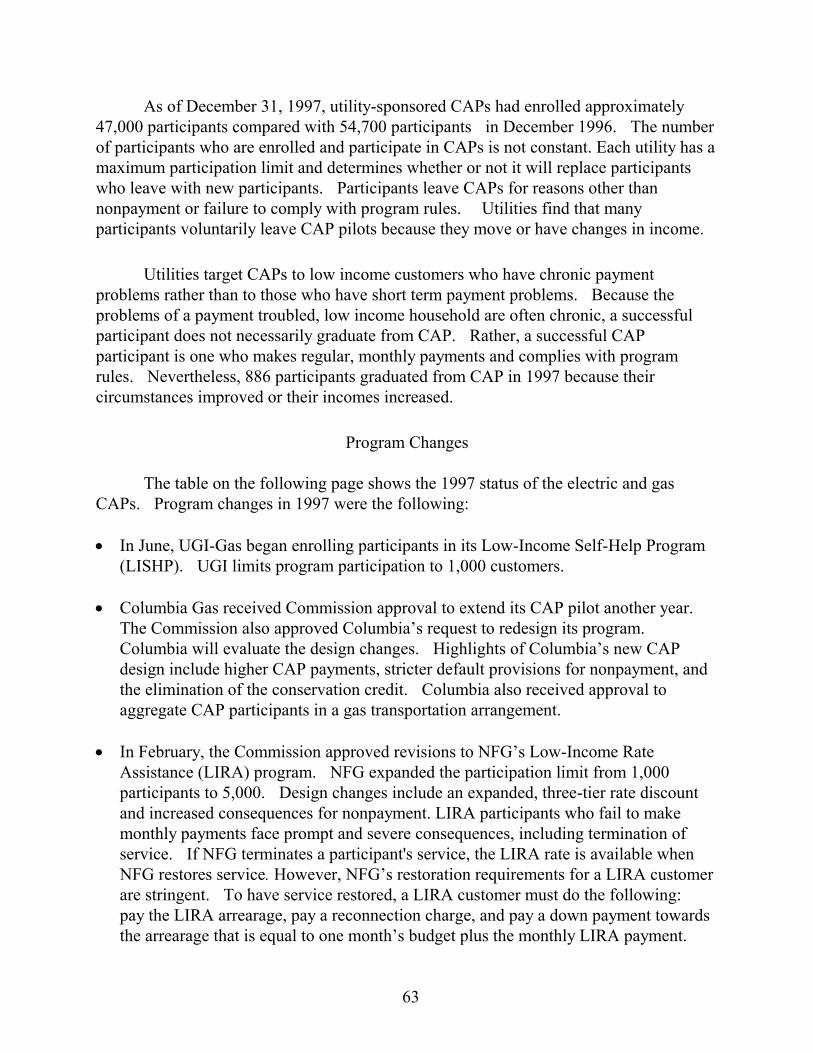
63
As of December 31, 1997, utility-sponsored CAPs had enrolled approximately 47,000 participants compared with 54,700 participants in December 1996. The number of participants who are enrolled and participate in CAPs is not constant. Each utility has a maximum participation limit and determines whether or not it will replace participants who leave with new participants. Participants leave CAPs for reasons other than nonpayment or failure to comply with program rules. Utilities find that many participants voluntarily leave CAP pilots because they move or have changes in income.
Utilities target CAPs to low income customers who have chronic payment problems rather than to those who have short term payment problems. Because the problems of a payment troubled, low income household are often chronic, a successful participant does not necessarily graduate from CAP. Rather, a successful CAP participant is one who makes regular, monthly payments and complies with program rules. Nevertheless, 886 participants graduated from CAP in 1997 because their circumstances improved or their incomes increased.
Program Changes
The table on the following page shows the 1997 status of the electric and gas CAPs. Program changes in 1997 were the following: • In June, UGI-Gas began enrolling participants in its Low-Income Self-Help Program
(LISHP). UGI limits program participation to 1,000 customers.
• Columbia Gas received Commission approval to extend its CAP pilot another year. The Commission also approved Columbia’s request to redesign its program. Columbia will evaluate the design changes. Highlights of Columbia’s new CAP design include higher CAP payments, stricter default provisions for nonpayment, and the elimination of the conservation credit. Columbia also received approval to aggregate CAP participants in a gas transportation arrangement.
• In February, the Commission approved revisions to NFG’s Low-Income Rate
Assistance (LIRA) program. NFG expanded the participation limit from 1,000 participants to 5,000. Design changes include an expanded, three-tier rate discount and increased consequences for nonpayment. LIRA participants who fail to make monthly payments face prompt and severe consequences, including termination of service. If NFG terminates a participant's service, the LIRA rate is available when NFG restores service. However, NFG’s restoration requirements for a LIRA customer are stringent. To have service restored, a LIRA customer must do the following: pay the LIRA arrearage, pay a reconnection charge, and pay a down payment towards the arrearage that is equal to one month’s budget plus the monthly LIRA payment.
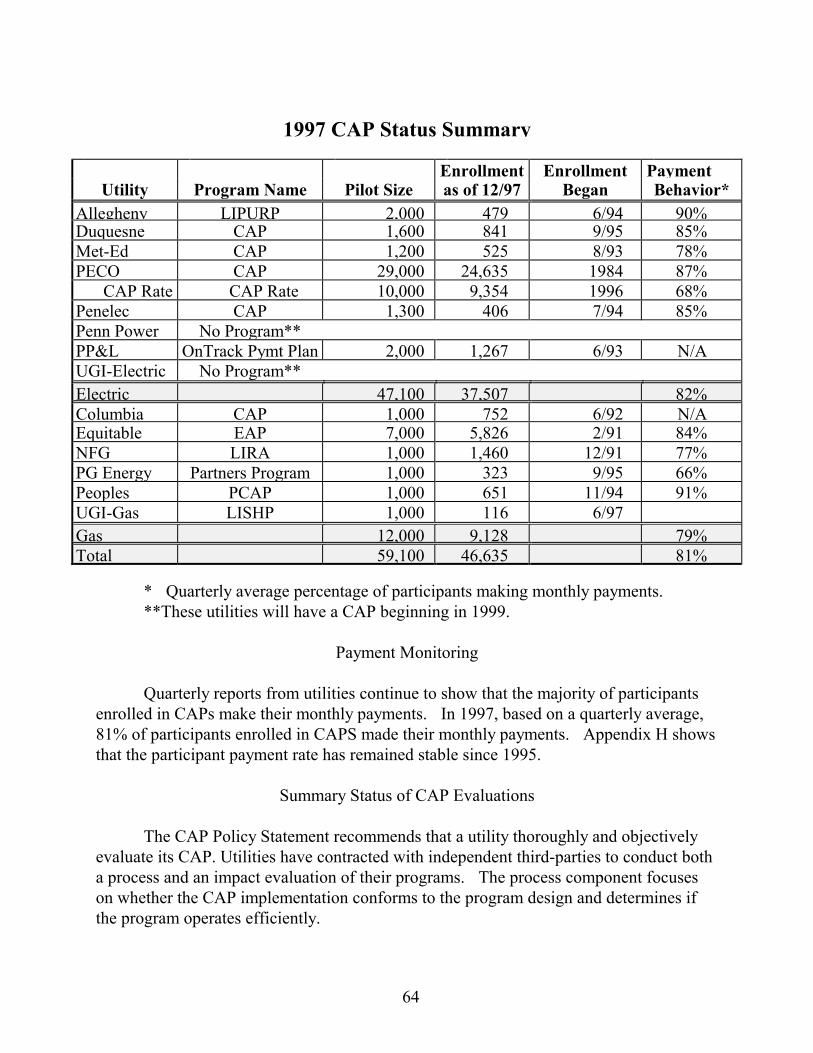
64
1997 CAP Status Summary
Enrollment Enrollment Payment
Utility Program Name Pilot Size as of 12/97 Began Behavior* Allegheny Pwr
LIPURP 2,000 479 6/94 90% Duquesne CAP 1,600 841 9/95 85% Met-Ed CAP 1,200 525 8/93 78% PECO CAP 29,000 24,635 1984 87% CAP Rate CAP Rate 10,000 9,354 1996 68% Penelec CAP 1,300 406 7/94 85% Penn Power No Program** PP&L OnTrack Pymt Plan
2,000 1,267 6/93 N/A UGI-Electric No Program** Electric 47,100
37,507 82%
Columbia CAP 1,000 752 6/92 N/A Equitable EAP 7,000 5,826 2/91 84% NFG LIRA 1,000 1,460 12/91 77% PG Energy Partners Program 1,000 323 9/95 66% Peoples PCAP 1,000 651 11/94 91% UGI-Gas LISHP 1,000 116 6/97 Gas 12,000 9,128 79% Total 59,100 46,635 81%
* Quarterly average percentage of participants making monthly payments. **These utilities will have a CAP beginning in 1999.
Payment Monitoring Quarterly reports from utilities continue to show that the majority of participants enrolled in CAPs make their monthly payments. In 1997, based on a quarterly average, 81% of participants enrolled in CAPS made their monthly payments. Appendix H shows that the participant payment rate has remained stable since 1995.
Summary Status of CAP Evaluations
The CAP Policy Statement recommends that a utility thoroughly and objectively evaluate its CAP. Utilities have contracted with independent third-parties to conduct both a process and an impact evaluation of their programs. The process component focuses on whether the CAP implementation conforms to the program design and determines if the program operates efficiently.

65
Impact evaluations focus on the degree to which a program achieves the continuation of utility service to CAP participants at reasonable cost levels. The evaluation should include an analysis of the costs and benefits of traditional collection methods versus the costs and benefits of handling low income customers whose expenses exceed their incomes through a CAP. The comparative analysis is to include: 1) payment history, 2) energy assistance participation, 3) energy consumption, 4) administrative costs and 5) actual collection costs. In 1997, Duquesne submitted the results of its process evaluation and Allegheny Power submitted the results of its impact evaluation. The findings from both evaluations were favorable and are highlighted in Appendix I. Dollar Share
The Dollar Share program is the result of an order adopted by the Commission on June 16, 1994. The order approved the application of Met-Ed for participation in the proposed lease of certain present reserve capacity of fiber optic cable and related facilities to MCI Telecommunication Corporation (MCI). As part of this application, Met-Ed filed a revised compliance plan to apply the revenues from the lease agreement to fund the Dollar Share. Met-Ed’s lease with MCI expired October 1997. However, Met-Ed will continue to fund Dollar Share at the previous annual funding level of $70,000. Dollar Share is an arrearage forgiveness program directed toward customers who are payment troubled but ineligible for the company’s customer assistance program. The program matches dollar-for-dollar the monthly bill payments of qualifying customers. This matching grant, applied after a customer makes a monthly payment, eventually eliminate a customer’s arrearage. In 1997, Met-Ed forgave $400,000 in arrearages for 952 Dollar Share customers. In 1997, a total of 1,498 customers were enrolled in Dollar Share. During 1997, Met-Ed dismissed a total of 705 customers for making late payments. A total of 429 participants graduated from Dollar Share. Graduates are those customers who have successfully made payments that resulted in Met-Ed forgiving their total arrearages. In 1997, based on a quarterly average, 73% of participants enrolled in Dollar Share made their monthly payments.
A Helping Hand In 1994, The Philadelphia Suburban Water Company (PSW) requested and received Commission approval to implement a pilot program that combined several of the elements of universal service programs with those of conservation programs. In 1996,

66
PSW made A Helping Hand a permanent part of its collection strategy. The program offers a water usage audit and includes an arrearage forgiveness component. PSW targets A Helping Hand to low income customers who are payment troubled and have high water bills. The company seeks donations from the community to assist with the arrearage forgiveness component. Community agencies administer the program. Each household enrolled in A Helping Hand receives a water usage audit and water conservation improvements as necessary. The water audit includes conservation education and PSW will pay up to $100 for minor plumbing repairs. As an incentive to encourage regular bill payment, PSW forgives a percentage of the participant’s arrearage if the participant makes regular monthly payments toward the arrearage. In 1997, Philadelphia Suburban expanded A Helping Hand to all four counties in its service territory, Bucks, Chester, Delaware, and Montgomery. At the end of 1997, PSW had enrolled 235 participants in the program. Low-Income Rate In 1997, the Pennsylvania American Water Company (PA-American) requested Commission approval to establish a Low-Income Rate. The Commission issued an order dated October 2, 1997, that approved PA-American’s request. By the end of 1997, PA-American had enrolled 2,638 customers in the program. PA-American projects that it will enroll approximately 5,000 customers in the program. PA-American targets the program to customers whose incomes are below 110% of the federal poverty guidelines. Customers agree to make monthly payments in exchange for a 15% discount on the service charge. A customer who misses more than two payments in a six-month period loses their eligibility in the program. Customers who are ineligible because of nonpayment remain so for one year. CARES Programs In May 1985, the Commission issued a Secretarial letter encouraging the major electric and gas utilities to establish a Customer Assistance and Referral Evaluation Services (CARES) program. The purpose of a CARES program is to provide a cost-effective service that helps selected, payment troubled customers maximize their ability to pay utility bills. A utility CARES representative works with customers on a personal basis to help them secure energy assistance funds. By securing these funds, customers with special needs can maintain safe and adequate utility service. Besides directly providing assistance to needy customers, CARES representatives also perform the task of strengthening and maintaining a network of community organizations and government agencies that can provide services to the program clients.

67
Fourteen electric and gas companies have CARES programs that reflect the guidelines in the Commission's Secretarial letter. Utilities report that CARES programs serve households whose average annual incomes are below $10,000. These households generally receive their incomes from Social Security, pensions and wages. Utilities report that CARES customers are often elderly customers. Special features from the various CARES programs are highlighted below.
• PP&L Customer Programs Directors (CPDs) administer the PP&L CARES program. The CPDs have the discretion to apply CARES credits to customers who have extraordinary hardships. The CPDs applied $62,183 CARES credits that provided additional assistance to 325 CARES customers.
• Equitable continues to use monies from a Gulf-Tetco settlement to maintain a fund
to assist customers to repair or replace gas lines. In 1997, eighty-seven families received $68,354 in grants.
• In 1997, NFG made significant changes to its CARES program. NFG requested
and received Commission approval to increase the size of its Low-Income Rate Assistance Program (LIRA) from 1,000 to 5,000 customers. NFG transferred 90% of customers who had been in CARES to its LIRA program. NFG now targets its CARES enrollment to customers who have short-term financial hardships and limits a customer’s enrollment in CARES to four months. If the customer’s hardship does not improve within this time frame, NFG may refer the customer to LIRA.
The table below shows the number of CARES participants for each of the utilities that sponsors a CARES program. The number of participants enrolled in a CARES program is not necessarily indicative of the quality of the program - case management coupled with strengthening and maintaining a community network are keys to an effective program. Utilities point out that the decreases in funding for LIHEAP and welfare reform have impacted their CARES programs. As a result of these changes, CARES representatives must find new sources of assistance to help CARES customers.

68
1996-1997 CARES Participants
# of CARES Participants
Short Term Assistance Recipients
Utility 1996 1997 1996 1997 Allegheny 377 324 1,254 Duquesne+ 1,237 3,340 GPU 787 492 Penn Power 92 88 PP&L 450 224 PECO* N/A N/A 220 UGI-Electric N/A N/A 374 312 Columbia 394 172 800 1,221 Equitable 160 359 NFG 346 14 PG Energy 69 53 Peoples 809 834 1,984 2,525 TW Phillips 5 10 UGI-Gas 98 182 Total 4,824 5,920 3,158 5,532
+Includes both long-term and short-term assistance. *PECO’s program started in the latter half of 1997.
Quantifying the advantages of CARES is often difficult; a CARES program generally helps address health and safety concerns relating to utility service by providing important benefits. In 1997, Allegheny Power, Duquesne, PECO, Penn Power and every major gas utility attempted to quantify CARES benefits by tracking “direct dollars”. "Direct Dollars" refers to money applied directly to a CARES customer's account. For 1997, the CARES participants in the programs of these utilities received more than $10 million in direct dollars (energy assistance payments). The tables in Appendix J show the design elements of each utility’s CARES program. For more information about CAPs, Dollar Share, A Helping Hand, Low-Income Rate or CARES, readers may contact Janice K. Hummel of the PUC’s Bureau of Consumer Services at (717) 783-9088.
69
Low Income Usage Reduction Program The Pennsylvania Low Income Usage Reduction Program (LIURP) is a statewide, utility-sponsored, residential usage reduction program, mandated by Pennsylvania Public Utility Commission regulations. Overall, the 15 major electric and gas companies that are required to participate in LIURP have spent $138.1 million from 1988 through 1997 by providing weatherization/usage reduction treatments to 128,755 low income households. While the initial regulations mandated the program from 1988 to 1992, revised regulations extended LIURP for an additional five years through January 1998. The regulations were revised again on January 31, 1998 and extended without a sunset provision. The primary goals of LIURP are to assist low income residential customers to conserve energy and reduce their energy bills. If these goals are met, LIURP should serve as an effective means to improve the LIURP recipients’ ability to pay their energy bills. LIURP is targeted toward customers with annual incomes at or below 150% of the federal poverty level. Beginning in 1998, companies are permitted to spend up to 20% of their annual LIURP budgets on customers with incomes between 150% and 200% of the federal poverty level. Priority is placed on the highest energy users which offer the greatest opportunities for bill reductions. When feasible, customers with payment problems (arrearages) are targeted. The program is available to both home owners and renters. All housing types are serviced, including single family homes, mobile homes, and small and large multi-family residences. The 1995 program year is the latest year for which post-installation annual usage data is available. Overall, the 15 major electric and gas companies spent $14,442,027 on LIURP in 1995. These companies provided usage reduction services to 14,475 low income households in 1995. LIURP was successful in achieving its goals by producing benefits in the areas of demand side management, bill reduction, arrearage reduction and avoided collection costs. The list of LIURP benefits includes many other benefits for both utilities and their customers. Noteworthy among the program benefits is arrearage reduction. The analysis of payment troubled LIURP recipients in recent years has shown that their arrearages were increasing in the year prior to the customers’ receipt of LIURP services. However, in the year following these treatments, arrearages declined. Overall, the total annual program arrearage reductions have been between $1 million and $2 million. The BCS believes that this result is directly attributable to two factors: 1) bill reductions and 2) the development of a partnership between the customer and the utility as a result of the provision of LIURP services. The energy savings and bill reductions for 1995 are presented in the following table:

70
1995 Energy Savings and Bill Reduction
Job Type
1995 Average Energy Savings
Estimated Annual Bill Reduction
Electric Heating 9.8% $178 Electric Water Heating 6.8% $106 Electric Baseload 9.8% $126 Gas Heating 19.4% $298
Appendices K and L show the spending and production levels of each participating utility from 1995 to 1997 and include the total spending and production amounts since LIURP began in 1988. For more information about LIURP, readers may contact David Mick of the PUC’s Bureau of Consumer Services at (717) 783-3232. Utility Hardship Fund Programs Utility company hardship funds were created to provide cash assistance to utility customers who “fall through the cracks” of other financial programs or to those who still have a critical need for assistance after other resources have been exhausted. The funds make payments directly to companies on behalf of eligible customers. Contributions from shareholders, utility employees and customers are the primary sources of funding for these programs. Monies from formal complaint settlements, overcharge settlements, off-system sales, special solicitations of business corporations and natural gas purchase arrangements with Citizens Energy Corporation expand the funding for these assistance programs. Each fall, the Bureau of Consumer Services surveys the companies with hardship funds. The information in this section is derived from the information that the companies supplied in response to the most recent survey. The Pennsylvania Electric Company and Metropolitan Edison Company were the first utilities to begin hardship fund programs. With encouragement from the Public Utility Commission, many other major companies began supporting hardship funds. In 1985, the Commission issued a Secretarial letter to all major utilities urging them to develop and support a utility company hardship fund. By 1986 each major electric and gas company sponsored a utility hardship fund in its service territory. (Appendix M lists the name of the hardship fund(s) each major utility supports). The Commission issued another Secretarial letter in November 1992 that recommended specific guidelines for utility hardship funds.

71
Contributions For the electric industry the average ratepayer/employee contribution in the 1996-97 program year was $.36 per residential customer. For the gas industry, the average contribution was $.35 per residential customer. Total contributions from ratepayers/employees decreased for the second year in a row. In 1995-96 contributions totaled $2,272,349. Meanwhile contributions from shareholders increased for the 1996-97 program year. Contributions from shareholders equaled $2,919,133 in 1995-1996. For the 1996-97 program year, on average, shareholders of the electric utilities contributed .06% of residential revenues to their utility’s hardship fund. For the gas utilities, the average was also .06% of residential revenues. Shareholders contribute to utility hardship funds in three ways: grants for administration of the programs, outright grants to the funds, and grants that match the contributions of ratepayers. Relative comparisons of shareholder contributions are based on the total dollars of shareholder contributions in 1996-1997 divided by the company’s residential revenues for 1997. The following table shows the amount of contributions from each company’s shareholders and from employees and ratepayers for the 1996-1997 program year.
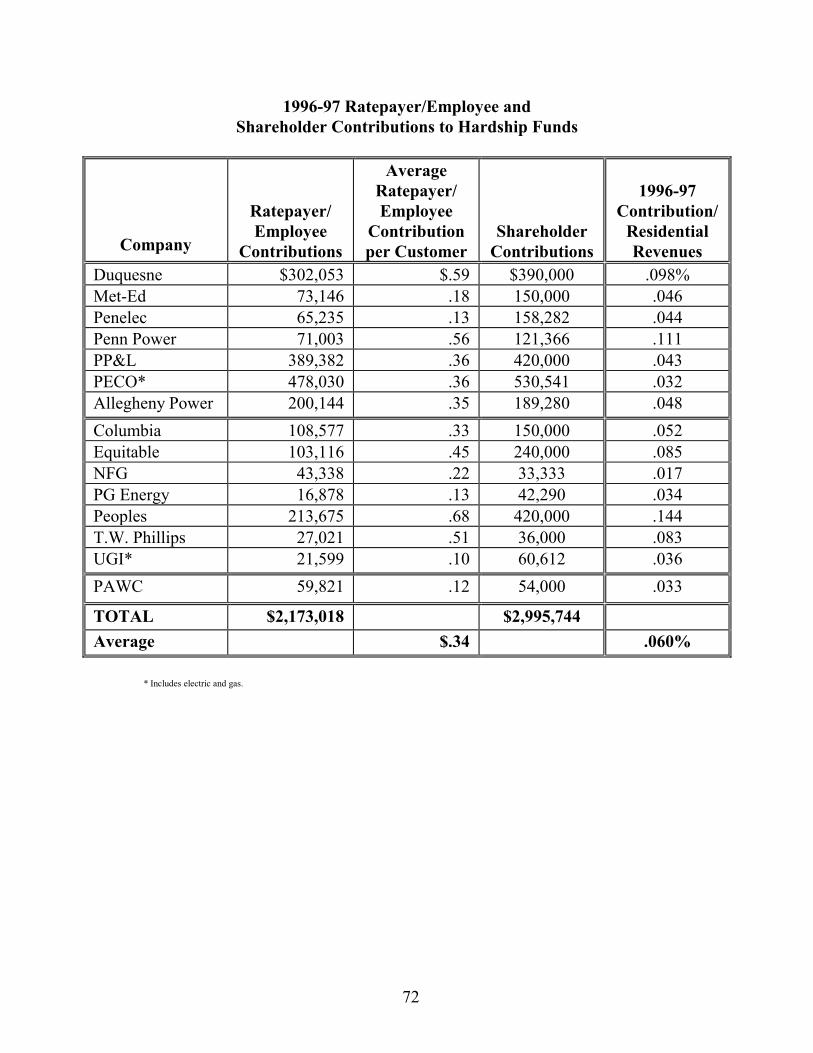
72
1996-97 Ratepayer/Employee and Shareholder Contributions to Hardship Funds
Company
Ratepayer/ Employee
Contributions
Average Ratepayer/ Employee
Contribution per Customer
Shareholder Contributions
1996-97
Contribution/ Residential Revenues
Duquesne $302,053 $.59 $390,000 .098% Met-Ed 73,146 .18 150,000 .046 Penelec 65,235 .13 158,282 .044 Penn Power 71,003 .56 121,366 .111 PP&L 389,382 .36 420,000 .043 PECO* 478,030 .36 530,541 .032 Allegheny Power 200,144 .35 189,280 .048 Columbia 108,577 .33 150,000 .052 Equitable 103,116 .45 240,000 .085 NFG 43,338 .22 33,333 .017 PG Energy 16,878 .13 42,290 .034 Peoples 213,675 .68 420,000 .144 T.W. Phillips 27,021 .51 36,000 .083 UGI* 21,599 .10 60,612 .036 PAWC 59,821 .12 54,000 .033
TOTAL $2,173,018 $2,995,744 Average $.34 .060% * Includes electric and gas.
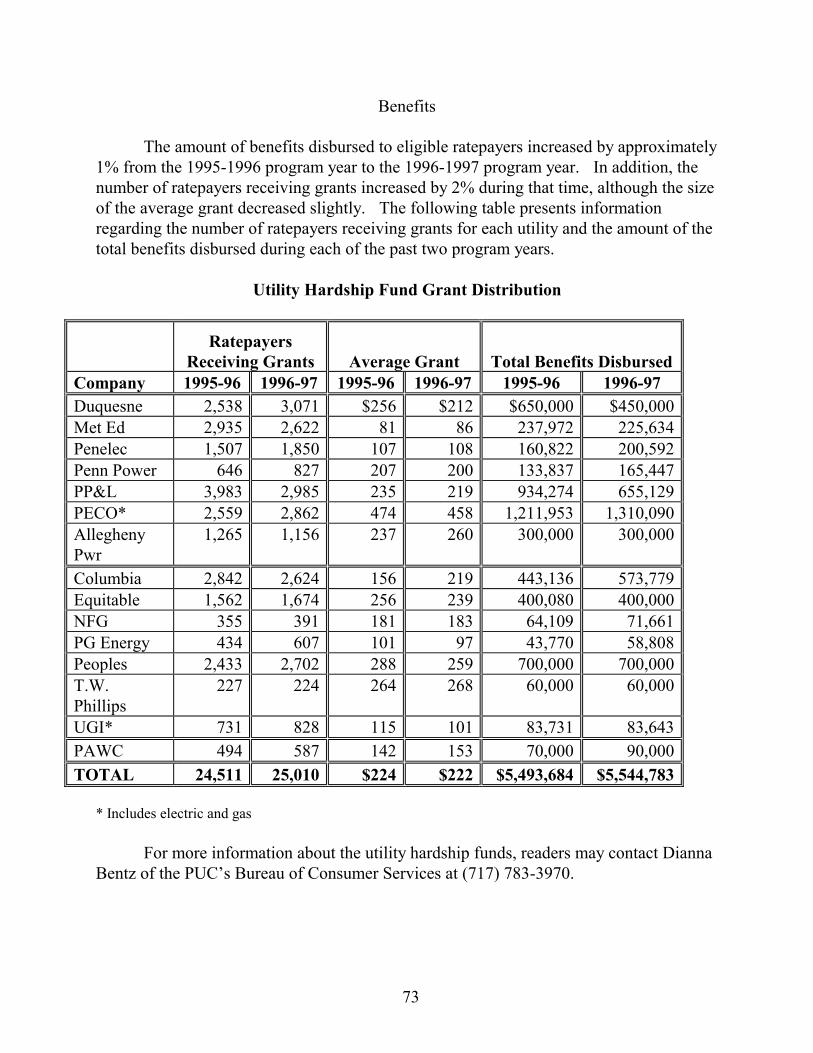
73
Benefits
The amount of benefits disbursed to eligible ratepayers increased by approximately 1% from the 1995-1996 program year to the 1996-1997 program year. In addition, the number of ratepayers receiving grants increased by 2% during that time, although the size of the average grant decreased slightly. The following table presents information regarding the number of ratepayers receiving grants for each utility and the amount of the total benefits disbursed during each of the past two program years. Utility Hardship Fund Grant Distribution
Ratepayers
Receiving Grants
Average Grant
Total Benefits Disbursed Company 1995-96 1996-97 1995-96 1996-97 1995-96 1996-97 Duquesne 2,538 3,071 $256 $212 $650,000 $450,000 Met Ed 2,935 2,622 81 86 237,972 225,634 Penelec 1,507 1,850 107 108 160,822 200,592 Penn Power 646 827 207 200 133,837 165,447 PP&L 3,983 2,985 235 219 934,274 655,129 PECO* 2,559 2,862 474 458 1,211,953 1,310,090 Allegheny Pwr
1,265 1,156 237 260 300,000 300,000
Columbia 2,842 2,624 156 219 443,136 573,779 Equitable 1,562 1,674 256 239 400,080 400,000 NFG 355 391 181 183 64,109 71,661 PG Energy 434 607 101 97 43,770 58,808 Peoples 2,433 2,702 288 259 700,000 700,000 T.W. Phillips
227 224 264 268 60,000 60,000
UGI* 731 828 115 101 83,731 83,643 PAWC 494 587 142 153 70,000 90,000 TOTAL 24,511 25,010 $224 $222 $5,493,684 $5,544,783
* Includes electric and gas For more information about the utility hardship funds, readers may contact Dianna Bentz of the PUC’s Bureau of Consumer Services at (717) 783-3970.

74
Telephone Universal Service Programs

75
Telephone Universal Service Programs
As part of its ongoing responsibilities, the Bureau also monitors the universal service programs of local telephone utilities. In 1989, the Commission approved the implementation of Pennsylvania’s first universal service program for telephone utilities, Link-Up America. For the telephone industry, universal service programs include Link-Up America, Lifeline Service and the Universal Telephone Assistance Program (UTAP). At the end of 1996, the Commission directed all telecommunication providers of local service to file lifeline service plans. In the Federal Communications Commission’s (FCC) May 1997 Universal Service Order, the FCC stated that all eligible telecommunications carriers should be required to provide lifeline service to qualified low income customers regardless of whether states provide matching funds. On July 31, 1997 the Commission mandated that all telephone utilities offering residential service file Lifeline service plans by September 30, 1997. By December 1997, the Commission approved Lifeline service plans for 44 telephone utilities with the expectation that these programs would be implemented statewide beginning January 1998. The discussion below describes the universal service programs for telephone utilities. Link-Up America During 1997, 36 local telephone utilities, including the five major local telephone utilities, participated in the Link-Up program. Link-Up helps make telephone service more affordable for low income customers who apply for new telephone service or who transfer telephone service. Link-Up provides qualified customers with a 50% discount, up to $30, on line connection charges for one residential telephone line. The program targets those customers who have incomes at or below 150% of the federal poverty guidelines, who receive Supplemental Security Income or who participate in certain Pennsylvania Department of Welfare assistance programs. Also, telephone utilities may require lifeline applicants to apply for Link-Up if they do not have phone service Lifeline Service Until January 1998, Bell was the only telephone utility to offer low income customers Lifeline service. In 1997, the Commission mandated that all telephone utilities providing residential service provide Lifeline service. With the Commission’s approval of 43 new Lifeline service programs plus the approval of Bell’s Lifeline program, Lifeline was implemented statewide effective January 1, 1998. Lifeline service is designed to help low income customers maintain basic telephone service by providing a monthly credit for basic service. Lifeline targets those customers who have incomes at or below 100% of the federal poverty guidelines, who receive Supplemental Security
76
Income or who participate in certain Pennsylvania Department of Welfare programs. For most local telephone utilities (with the exception of Bell and several other companies) Lifeline service includes a $5.25 credit toward their basic monthly phone charges with the option of choosing one-party residence unlimited service or local measured service (if it is available). Since the purpose of lifeline service is to help customers maintain basic service, Lifeline customers are not allowed to subscribe to call waiting or other optional services. Bell’s Lifeline & Universal Telephone Assistance Program (UTAP) Unlike the other telephone utilities, Bell implemented its Lifeline Service and Universal Telephone Assistance Program (UTAP) through a settlement agreement that was approved by the Commission in 1995. The company began implementing Lifeline and UTAP in February 1996 and completed implementation of both programs throughout its service territory in April 1996. Bell is the only company that offers an assistance program that helps existing Lifeline customers and qualified Lifeline applicants to restore basic service. Bell has a contract with the Salvation Army to administer UTAP. During 1997, the UTAP distributed $1,478,987 in financial assistance to Lifeline customers. In September 1997, Bell filed two revisions to the company’s Lifeline Service that the Commission approved in November. Bell implemented the changes in January 1998. These revisions expanded service options and increased the monthly benefit for Lifeline participants. As a result, Lifeline Service customers are able to choose either the local area standard usage option or the local area unlimited usage option. In addition, their monthly service credit increased from $5.00 to $9.00. Statewide Lifeline program statistics are not available for 1997 since most telephone utilities did not offer Lifeline Service until January 1998. However, the preliminary data shows that from January until the end of April 1998, over 19,000 customers received Lifeline Service. As of April 30, 1998 over 8,000 telephone customers were still enrolled in the program.
For more information about the telephone universal service programs may contact Lenora Best of the PUC’s Bureau of Consumer Services at (717) 783-9090.
77
8. Other Consumer Activities of the Commission The Pennsylvania Public Utility Commission serves consumers in a variety of ways. The informal complaint handling services of the Bureau of Consumer Services and the establishment and monitoring of universal service programs are just some of the consumer activities in which the Commission engages. The Commission also has a separate unit dedicated to educating consumers about utility-related issues. The unit’s goal is to help utility customers make good consumer decisions. The Commission, through its Office of Communications, is strongly committed to help customers understand their rights and make the most of competitive alternatives. As utility industries change, the PUC believes it must actively assist customers to make the connections between those changes and the effects they will have on customers’ daily lives. In addition to its consumer education program, the Commission sponsors a Consumer Advisory Council that studies and develops issues of concern to utility consumers. The Commission also supports the Pennsylvania Relay Service Advisory Board that provides guidance to the Commission regarding matters affecting telecommunications relay service in Pennsylvania. This chapter briefly discusses the Commission’s consumer education program, the Consumer Advisory Council and the Pennsylvania Relay Service Advisory Board and provides highlights of their 1997 activities.
Office of Communications -- Consumer Education
In July 1997, the Commission reorganized the Office of Communications to increase consumer education activities. As a result, the PUC Press Office and the Consumer Education staff began working together to develop and disseminate information on utility issues critical to Pennsylvania’s utility consumers. The Commission’s consumer education program has five interrelated, operational goals: Consumer Information: Disseminating consumer information about regulatory
matters, current utility issues and competition. Outreach and Leadership Training: Establishing the Commission’s presence and
increasing its visibility as a consumer education agent. Regulatory Review: Developing and monitoring utility company performance in
consumer education.
78
Feedback: Obtaining information from the utility industry and consumers about consumer education needs and the success of existing programs.
Coordinated Resources: Responding to legislative requests for assistance and sharing consumer education materials with legislative offices, community organizations and state and local agencies.
Consumer Information The consumer education staff increased traditional consumer information efforts during 1997 while maintaining many of its traditional brochure and pamphlet distribution efforts. Electric competition and the electric pilot program were responsible for much of this increase in activity, although the staff also focused attention on other industries under the Commission’s jurisdiction. The staff developed two electric pilot brochures, “Helping you choose what’s right for you”, an overview of the pilot program; and “Everything you need to know before you choose”, a shopping guide. More than 60,000 copies of both the overview and the shopping guide were sent to individual consumers. The staff also designed a worksheet that pilot participants could use to calculate pilot program savings. The worksheet included questions consumers should ask electric generation suppliers when shopping for electric generation supply. Consumer Education distributed copies of this document to 250,000 consumers. The staff also developed a list of licensed suppliers serving the residential market in the pilot program and shopping credit calculation sheets by service territory. The Commission sent these materials to all 221,853 participants in the pilot program to help them determine their usage and savings. Consumer education staff continued the distribution of the Consumer Update Series 1-9; Saving Water Around the House; Telephone Handbook for Consumers; A Look inside the PUC; Consumer’s Guide to Utility Rate Cases; Caller ID; Guide to Lower Your Utility Bills: An Energy Efficiency Guide for Your Home; Glossary of Electric Competition Terms and the Commissioners’ biographies in 1997. More than 40,000 copies of these brochures were distributed. In addition to encouraging consumers to reduce their energy costs through competition, the consumer education staff has promoted the use of energy conservation to reduce energy bills. The Press Office produced 184 press releases during the year: 64 of these releases involved electric competition issues, 28 addressed telecommunications topics, 18 addressed natural gas topics and 15 pertained to water matters. Both the Press Office and the consumer education staff provided information for posting on the Commission’s Internet website (http://puc.paonline.com) during 1997. Outreach and Leadership Training

79
Consumer education staff traveled throughout Pennsylvania to help educate community and consumer leaders and individual consumers about the Commission and the utilities it regulates. The staff notified consumers, businesses, townships, schools and others of public input hearings statewide to enable these interested parties to participate in the hearings. Staff members participated in numerous senior citizen, community, government and legislative sponsored fairs and conducted numerous outreach seminars, workshops and utility fairs. In addition, staff conducted utility seminars for the Philadelphia Housing Authority, the Department of Human Services, the Philadelphia Cluster Parents Academy Group, retiree forums and 48 utility seminars for church or religious organizations. Some highlights of 1997 outreach activities are listed below: Harrisburg staff organized, promoted and conducted 62 workshops held in Bedford,
Cameron, Centre, Clearfield, Crawford, Erie, Lackawanna, Luzerne, Mercer and Monroe Counties. The outreach staff reached over 3,600 senior and low income customers.
Philadelphia staff planned, coordinated and presented 35 fairs and workshops in Philadelphia, Bucks, Montgomery, Delaware, Chester, Lehigh and Northampton counties.
Utility fairs were held in Allentown, Erie, Harrisburg, Meadville, Philadelphia, Pittsburgh, Reading, Uniontown, Wilkes-Barre, Scranton and York. More than 6,000 consumers attended the fairs.
(Left to right) Shari Williams; Grace Cunningham; Maureen Mulligan, Consumer Education Manager, Leonard Goins; Verna Edmonds and Maria Hanley. In September 1997, the consumer education staff assisted in a legislative training seminar for 120 legislators and their staffs. The staff distributed camera-ready copies of

80
the two pilot brochures to the House and Senate printing offices. An estimated 500,000 copies of the brochures were distributed on a local level to legislative district offices, local libraries and other locations. Staff also distributed copies of a training handbook to legislative staff for use as a reference source on electric competition and the pilot programs. Regulatory Review Consumer education staff completed plain language reviews on a wide variety of utility company notices and newspaper advertisements. As part of its review, the staff makes recommendations to utilities regarding the language, content and layout of the materials so they are accurate and readily understood by residential customers. The staff uses the Commission’s plain language guidelines as a basis for its recommendations. Notices concerning utility rate changes, bill messages, billing changes, plain language summaries of the reasons for requested rate increases, new billing charges, and announcements of public hearings are examples of company materials the staff reviews. In 1997, staff reviewed a number of utility bills and customer notices, as well as numerous items and publications targeted to consumers that related to the electric pilot program. In 1997, the consumer education staff began its ongoing participation in numerous Commission rulemakings and orders such as pilot implementation, licensing, customer information, consumer education, metering and universal service. Staff prepared consumer education guidelines for each electric company’s restructuring plan to ensure that the EDC’s implement these important procedures. Feedback Consumer education staff evaluated the utility fairs that were held in cities across the state. Fair-planning committee members and attendees completed evaluations which the consumer education staff used to develop recommendations for future fairs and events. The staff solicited informal feedback from consumer leaders and the PUC’s Consumer Advisory Council (CAC) on the Commission’s education efforts. The staff used the feedback to develop appropriate education methods for various consumer groups and geographic areas throughout Pennsylvania. Coordinated Resources

81
Through the efforts of the Consumer Advisory Council (CAC), the consumer education staff developed a network of resources through other state agencies and community based organizations to help in disseminating the consumer education messages of the Commission. The consumer education staff coordinated efforts with other state and local agencies to provide information on utility issues. Other agencies involved with energy, consumer issues, and consumer protection developed consumer seminars where the PUC actively participated. In 1997, the consumer education staff began to actively participate on two committees that the Commission established to oversee broad policy issues relating to the pilot program. The staff continues to serve on both committees in 1998. Toll Free Number The toll free telephone number for reaching the PUC’s consumer education office is 1-800-PUC-8685. For more information about the Commission’s consumer education activities, readers may contact Maria Hanley of the PUC’s Office of Communications by telephone at (717)787-3559 or by e-mail at [email protected].
The PUC Consumer Advisory Council The purpose of the Consumer Advisory Council (CAC) is to represent the public in advising the Commissioners on matters relating to the protection of consumer interests which are under the jurisdiction of the Commission, or which, in the opinion of the Council, should be brought under the jurisdiction of the Commission. The Council acts as a source of information and advice for the Commissioners. Interactions between the Council and the Commissioners occur through periodic meetings with the Commissioners and in writing via minutes of meetings and formal motions. Council meetings are generally held on the fourth Tuesday of the month in PUC Executive Chambers in Harrisburg starting at 10:00 a.m. and are open to the public. Agenda Items The Council considers matters which arise from consumer inquiry or request, Commissioner inquiry or request, or the proceedings, deliberations or motions of the Council itself. The Council solicits matters for review from these sources and establishes an agenda for action. In considering matters within its jurisdiction, the Council, or members of the Council acting under direction of the Council, may conduct investigations and solicit and receive comments from interested parties and the general public. Public

82
Utility Commission staff are made available to brief the Council on relevant matters and provide necessary support for the Council to complete its agenda. The monthly meeting agenda is available prior to each meeting from the PUC Press Office (717) 787-5722. Qualifications and Appointment of Council Members
The following elected officials may each appoint one representative to the PUC Consumer Advisory Council: the Governor, the Lieutenant Governor, the Republican and Democratic Chairpersons of the Senate Consumer Protection and Professional Licensure Committee, and the Republican and Democratic Chairpersons of the House Consumer Affairs Committee. The Commission appoints additional “At-Large” representatives, as appropriate, to ensure that the group reflects a reasonable geographic representation of the Commonwealth, including low income individuals, members of minority groups and various classes of consumers. A person may not serve as a member of the Council if the individual occupies an official relation to a public utility or holds or is a candidate for a paid appointive or elective office of the Commonwealth. Members of the Council serve a two year term, and may be reappointed thereafter without limit. Officers of the Council serve for two year terms. A Chairperson may not act for more than two consecutive terms. Standing (left to right): James S. Schneider; Cynthia Datig; Carl Kahl; Dr. Daniel Paul; Andrea Fitting; William Farally. Sitting (left to right): Charles MacDonald; Valeria Bullock (Vice-Chair); Katherine Newell (Chair); Alan Jennings
83
A new, two-year Council term started in July 1997 with some new members. Katherine Newell served as Chairman and Valeria Bullock served as Vice Chairman. The CAC met eleven times in 1997. Summary of Activities In 1997, the Council focused on the areas of electric competition and restructuring; proposed gas industry restructuring; consumer education and universal service issues. • The Council submitted comments to the Commission on January 31, 1997 in response
to the Tentative Order RE: Electric Utility Restructuring Filings Made Pursuant to 66 Pa. C.S. §2806(e) (M-00960890). The Council asked for uniform, generic rules and regulations which would apply for all electric restructuring filings to address issues such as consumer education, universal service, service quality, and consumer protections. In this filing the Council reiterated its continued strong support for maintaining important consumer protection standards in the restructured electric industry and the need to develop strong and effective marketing rules.
• The Council closely monitored implementation of the universal service provisions of the Electricity Generation Customer Choice and Competition Act. On July 7, 1997 the Council transmitted a letter to the Commission emphasizing the importance of universal service programs and their maintenance in the restructured electric industry.
• With the start of the electric competition pilot program enrollment process in September 1997, the Council devoted considerable time to monitoring pilot activity. The Council served as an important source of information concerning consumer experiences with the pilot process and advised the Commission on addressing the many issues involved. CAC Chair Katherine Newell participated in the Commission’s press conference announcing the start of the pilots.
• As always, the Council took an intense interest in the Commission’s consumer education activities. In addition to receiving briefings on the Commission’s efforts, the Council actively participated in the planning and implementation of the consumer education program. The Council also received regular reports on the activities of the PUC’s new competition information hotline.
• The restructured electric industry can provide additional opportunities for consumer fraud and abuse. These are matters over which the Commission shares jurisdiction with Pennsylvania’s Office of Attorney General (OAG). The Council examined the interaction of the Commission and the OAG to help ensure that policies and procedures were in place to help protect consumers from possible fraudulent activities.

84
• The Council closely monitored the implementation of the universal service provisions of the federal Telecommunications Act of 1996. These provisions include discounted internet access fees for schools and libraries and a system of subsidies that keep phone service affordable for consumers in all areas. The Council received briefings on these implementation issues from both the Commission and the Office of Consumer Advocate.
• The area code changes in the 412, 610, 215 and 717 areas were examined by the Council. The Council urged the Commission to implement these changes in the least disruptive manner possible for consumers. The Council also asked that the Commission continue to pursue other remedies at the federal level that will hopefully minimize the need for future area code changes.
Readers may contact Dan Mumford of the Bureau of Consumer Services at (717) 783-1957 for more information about the PUC’s Consumer Advisory Council. Information on the Council and its activities, including “Minutes” from recent meetings, is also available on the PUC’s website at http://puc.paonline.com under “Consumer Information and Education.” A listing of the names and addresses of Council members appears in Appendix N.
Pennsylvania Relay Service Advisory Board The Commission established the Pennsylvania Relay Service Advisory Board (PRSAB) on May 24, 1990, with its order to establish a statewide Telecommunications Relay Service (TRS)1. The purpose of the PRSAB is to review the success of TRS and identify improvements that should be implemented. The PRSAB functions primarily as a TRS consumer group by providing feedback and guidance to the TRS provider regarding communication assistant training, problem solving and service enhancements. The PRSAB meets four times a year to advise the TRS provider on service issues and to discuss policy issues related to TRS. At each meeting, the TRS provider gives the Board a status report of its activities which include training, technological upgrades and outreach activities.
1 TRS is a telecommunications service that allows people with hearing and/or speech disabilities to communicate with others by phone. TRS centers are staffed with communications assistants who relay conversation verbatim between people who use text telephone (TTY) or telebraille and people who use standard phones. Pennsylvania’s TRS center is located in Wayne, Pennsylvania and is operated by AT&T of Pennsylvania. The total volume of calls through the Pennsylvania TRS increased 4% from 1996 to 1997. AT&T reported that it handled 1,611,921 relay calls in 1997.
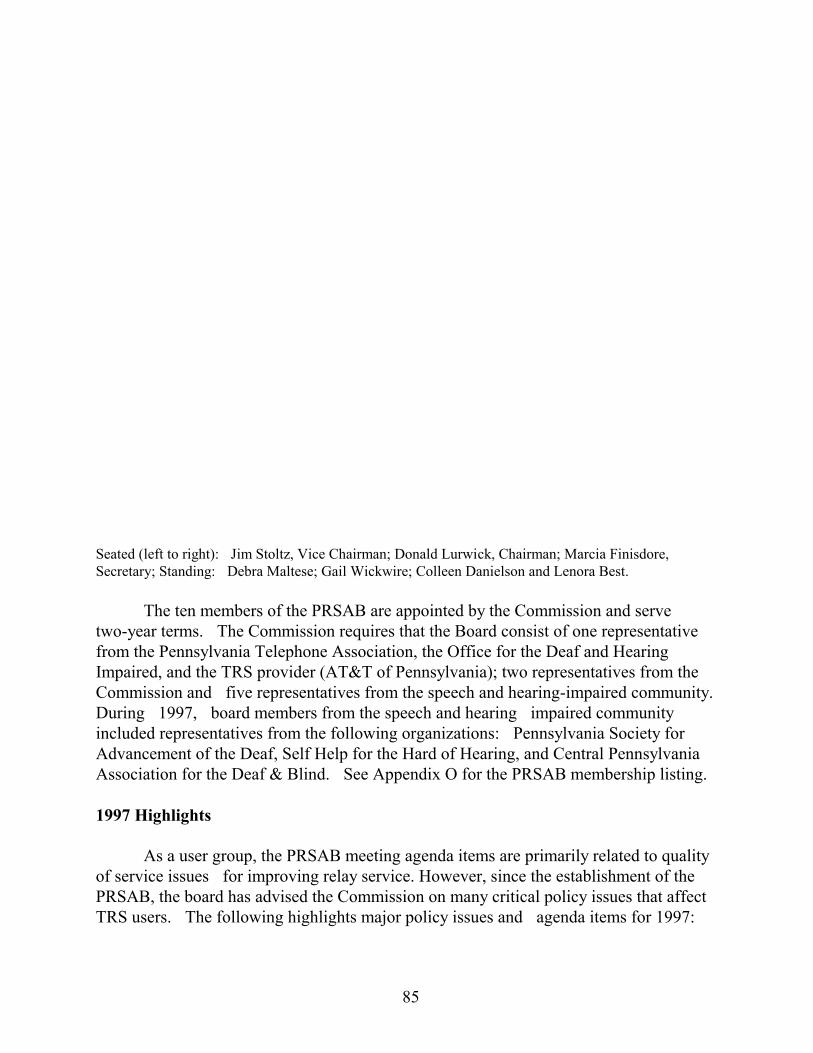
85
Seated (left to right): Jim Stoltz, Vice Chairman; Donald Lurwick, Chairman; Marcia Finisdore, Secretary; Standing: Debra Maltese; Gail Wickwire; Colleen Danielson and Lenora Best. The ten members of the PRSAB are appointed by the Commission and serve two-year terms. The Commission requires that the Board consist of one representative from the Pennsylvania Telephone Association, the Office for the Deaf and Hearing Impaired, and the TRS provider (AT&T of Pennsylvania); two representatives from the Commission and five representatives from the speech and hearing-impaired community. During 1997, board members from the speech and hearing impaired community included representatives from the following organizations: Pennsylvania Society for Advancement of the Deaf, Self Help for the Hard of Hearing, and Central Pennsylvania Association for the Deaf & Blind. See Appendix O for the PRSAB membership listing. 1997 Highlights As a user group, the PRSAB meeting agenda items are primarily related to quality of service issues for improving relay service. However, since the establishment of the PRSAB, the board has advised the Commission on many critical policy issues that affect TRS users. The following highlights major policy issues and agenda items for 1997:

86
Quality of Service Much of this discussion in 1997 focused on improving the performance of the TRS communication assistants (CAs). The Board recommended that assistants receive additional training in certain aspects of customer service as well as technical training on TRS equipment. In addition, the Board discussed the need for procedures to dial toll free numbers in Pennsylvania when out-of-state CAs handle a call.
Service Enhancements During 1997 the PRSAB discussed the service enhancements that would improve TRS. Specifically, the Board examined the pros and cons of adding “turbo code” as a feature of TRS. According to AT&T, “turbo code is an enhanced form of Baudot, the communications method used by TTYs that allows TTY conversation to occur at a more natural pace.” Given the limited available information on turbo code, the Board tabled discussions about recommending turbo code in 1997 until more research could be done on the benefits and costs of this service enhancement.
TTY Pay Phones The PRSAB continued to focus on the inaccessibility of TRS from certain public pay TTY phones located at Pennsylvania Turnpike plazas. In 1996, the Board worked with the Commission and the pay phone provider to resolve this problem. However, the Board discovered in 1997 that the TTY chosen by the provider needed to be changed to fully meet the user’s needs. In addition, the Board worked with Amtrak to get more public pay TTY phones in the company’s 30th Street Train Station in Philadelphia .
TTY Distribution Program A major policy issue that continued to be of interest to the PRSAB was the implementation of the Telecommunications Device Distribution Program (TDDP). This program provides communications equipment such as TTYs and other related equipment to qualified persons with speech or hearing disabilities. The Board closely monitored the program and was interested in its progress. At its December meeting the Board was given a status report, dated November 27, 1997, that indicated that over 400 pieces of equipment had been distributed.
711 Gateway During 1997, the Federal Communication Commission (FCC) issued for comment a Notice of Proposed Rulemaking on the feasibility of implementing 711 for TRS access. Of primary interest to the PRSAB was the development of 711 as a

87
gateway that would allow TRS users to access multiple TRS providers. The Board discussed the potential benefits of 711 and its application to Pennsylvania TRS users.
Accessibility To Toll Free Numbers Several members of the PRSAB indicated that they had encountered problems when they used TRS to call certain toll free numbers. AT&T advised the PRSAB that certain toll free numbers cannot be used with the TRS. This problem is due to the toll free number not being accessible outside a designated calling area. Toll free numbers that do not include the Wayne, Pennsylvania exchanges will not allow the TRS to complete the call. If a toll free number is statewide then the TRS should not have a problem processing the call.
Utility Access For Customers With Speech Or Hearing Disabilities Survey The PRSAB discussed potential access problems with reaching a utility’s customer service and repair center because the utility’s toll free numbers can be reached through the TRS center. In response to this problem, the Bureau of Consumer Services advised utilities about this accessibility issue and conducted an informational survey of 52 electric, gas, water and telephone utilities to determine how many utilities may be affected by this problem. The survey focused on three areas: 1) whether the toll free number included the Wayne, PA exchanges, 2) provisions for accessibility and 3) availability of customer materials that advise customers to use TRS. Generally, utilities indicated that they have provisions to provide access to customers with speech or hearing disabilities. However, 30% of the utilities’ toll free numbers do not include the Wayne, PA exchange. Another 30% do not have customer materials that advise customers that they may use TRS to contact them. The PRSAB viewed these results as an opportunity for AT&T to do outreach to utilities about TRS. AT&T sent out TRS brochures to each of the utilities surveyed and offered them a free presentation about the service.
AT&T National Relay Center In New Castle, PA In July 1997, AT&T opened and began operating the AT&T National Relay Center in New Castle, Pennsylvania. This is a high-tech facility that uses state-of-the-art technology to provide relay service throughout the United States. AT&T invited the PRSAB to hold its September 1997 meeting at the new center and to tour the new facility. On October 13, 1997, Governor Tom Ridge officially opened the center in a special ribbon cutting ceremony that was attended by state and local business leaders. With the opening of the New Castle Center, the company can process more Pennsylvania calls as well as calls from all over the United States.

88
For more information about the Pennsylvania Relay Service Advisory Board contact Louise Fink Smith, PUC Liaison and Legal Advisor at (717) 787-8866. To learn more about TRS, contact Colleen Danielson, AT&T Outreach Manager, by using the TRS at 1-800-654-5988, then (908) 231-6104-TTY.

89
9. Quality of Service Benchmarking
Historically, the annual report prepared by the BCS for electric, gas and water utilities has presented information based in large part on customer contacts to the PUC’s Bureau of Consumer Services. This has been and still is the case for consumer complaint, payment arrangement and compliance information. As such, the discussion may or may not represent broad statistical trends. The Commission recognizes that this approach has certain shortcomings. For example, most customer contacts to utilities do not result in contacts to the PUC and thus, the BCS and the Commission have had no opportunity to evaluate the quality of the majority of customer contacts with their utilities. The measures that the Bureau of Consumer Services has traditionally used focus on only a portion of the customer service performance of utilities.
In order to capture a more accurate and complete picture of the quality of customer service experienced by customers of utility companies, this report will evolve over the next several years to include additional measures. The development of the report will coincide with the Commission’s efforts to develop quality of service measurement and reporting on the part of utilities and other energy providers as appropriate. The Commission took steps in this direction in 1997. The Electricity Generation Customer Choice and Competition Act is clear in its intent that the electric utilities are to maintain, at a minimum, the current levels of customer service to customers. In response, the Commission adopted a Tentative Order in March to solicit comments on a variety of potential quality of service measures. This order solicited comments on a variety of potential quality of service measures, asked EDCs to describe current performance monitoring practices and performance standards and supply the Commission with historic performance. All the EDCs and numerous other parties submitted comments. In December, the Commission issued a Proposed Rulemaking Order that proposed reporting requirements for quality of service benchmarks and standards. The purpose of the rulemaking is to establish a means by which the Commission can develop uniform measurement and reporting to assure that the quality of customer service of the EDCs is maintained.

90
Future Plans In March 1998, the Commission issued a Secretarial letter to all EDCs. In this letter, the Commission requested that EDCs report data on various quality of service measures until proposed regulations take effect. In April 1998, the Commission adopted a Final Rulemaking Order that established reporting requirements for the EDCs regarding various measures of customer service performance. The measures include telephone access to the EDC, billing performance, meter reading performance, response to customer disputes, customer survey results, and informal complaints to the Bureau of Consumer Services. The Independent Regulatory Review Commission approved the rulemaking in June 1998. The Commission will analyze the data submissions of the EDCs in response to the Tentative Order, the Secretarial Letter and the Reporting Requirements. After the Commission has received a year or two of reporting from the EDCs on uniform measurements, the Commission will consider setting standards for performance. These standards could be company specific or present a wide band of acceptance for an industry standard. The setting of standards will be the subject of a future proceeding. Section 2809(e) states that “in regulating the service of electric generation suppliers (EGSs), the Commission shall impose requirements necessary to ensure that the present quality of service provided by electric utilities does not deteriorate....”. In our view, electric suppliers will be providing some aspects of service that are parallel to those provided by the EDCs. Thus the Commission has plans to institute proceedings to require the EGSs to report appropriate data regarding customer service performance.

90
Glossary of Terms
Consumer Complaint Rate - The number of consumer complaints per 1,000 residential customers. Consumer Complaints - Cases to the Bureau of Consumer Services involving billing, service, rates and other issues not related to requests for payment terms. Customer Assistance Program (CAPs) - Alternative collection programs set up between a utility company and a customer that allow low income, payment troubled customers to pay utility bills that are based on household size and gross household income. CAP participants agree to make regular monthly payments, which are usually less than the current bill, in exchange for continued utility service. Electric Distribution Company (EDC) - Owner of the power lines and equipment necessary to deliver purchased electricity to the customer. Electric Generation Supplier (EGS) - A person or corporation, generator, broker, marketer, aggregator or other entity, that sells electricity, using the transmission or distribution facilities of an electric distribution company (EDC). Hardship Funds - Utility-sponsored funds that provide cash assistance to low income utility customers to help them pay their utility bills. Infraction: A misapplication or infringement of a Commission regulation, particularly the standards and billing practices for residential utility service. Infraction Rate - The number of informally verified infractions per 1,000 residential customers (includes infractions drawn from both consumer complaints and payment arrangement requests). Inquiries - Consumer contacts to the Bureau of Consumer Services that, for the most part, require no follow-up investigation beyond the initial contact. Justified Consumer Complaint Rate -The number of justified consumer complaints per 1,000 residential customers. Justified Payment Arrangement Request Rate - The number of justified payment arrangement requests per 1,000 residential customers.

91
Payment Arrangement Request Rate - The number of payment arrangement requests per 1,000 residential customers. Payment Arrangement Requests - Consumer requests for payment arrangements principally include contacts to the PUC’s Bureau of Consumer Services involving a request for payment terms in one of the following situations: suspension/termination of service is pending; service has been suspended/terminated and the customer needs payment terms to have service restored; or the customer wants to retire an arrearage. Problem Categories - A breakdown of residential consumer complaints by specific problem categories such as billing, credit and deposits, service quality, rates, etc. Response Time in Days - Response time is the time span in days from the date of the Bureau’s first contact with the company regarding a consumer complaint and/or request for payment arrangements to the date on which the company provides the Bureau with all of the information needed to resolve the case and determine whether or not the customer was justified in seeking a payment arrangement through the BCS. Response time quantifies the speed of a utility’s response (“responsiveness”) in resolving BCS cases. In this report, response time is presented as a mean number of days for each company. Termination Rate - The number of residential customers whose service was terminated per 1,000 residential customers.

92

93
Appendices

94
95
Appendix A-1
Classification of Consumer Complaints Electric, Gas & Water
Metering: Billing complaints directly related to the reading of or the failure to read the customer’s meter and the accuracy of the meter readings (company reading, customer supplied reading, misreading). Billing Disputes: Complaints about bills from the utility: high bills, inaccurate bills or balances, installation charges, customer charges, service charges, repair charges, late payment charges, frequency of bills and the misapplication of payment on bills. Discontinuance/Transfer: Complaints related to the responsibility for or the amount of bills after discontinuance or transfer of service: the customer requested discontinuance of service and the company failed to finalize the account as requested or the company transferred a balance to a new or existing account from the account of another person or location. Other Payment Issues: Complaints about the amount of budget bills or the transfer of a customer’s debt to a collection agency. Credit & Deposits: Complaints about a company’s requirements to provide service: applicant must pay another person’s bill, applicant must complete an application, applicant must provide identification, or applicant must pay a security deposit. This category also includes complaints about the amount of or the amortization of a deposit, the payment of interest on a deposit or the failure of a company to return a deposit to the customer. Service Extensions: Complaints about line extensions or installation of service: the responsibility for line extensions, the cost and payment for line extensions, inspection requirements, delay in installation, connection or disconnection of service, and denial of service extensions. Service Interruptions: Complaints about service interruptions: the frequency of service interruptions, the duration of interruptions or the lack of prior notice regarding interruptions. Service Quality: Complaints about a utility’s product: The quality of the product is poor (water quality, voltage, pressure), the company’s equipment is

96
unsatisfactory or unsafe, the company fails to act on a complaint about safety, the company plans to abandon service, the company does not offer needed service, the company wants to change location of equipment or the company providing service is not certified by the PUC (defactos). Damages: Complaints about a company’s lack of payment or lack of restored property related to damages to equipment, appliances or property due to service outages, company construction or repair, and improperly delivered or transferred service. Scheduling Delays: Complaints about problems with a company’s scheduling: delays in scheduling or repairing service or relocating poles, failures to keep scheduled meetings or appointments, and lack of accessibility to customers. Personnel Problems: Complaints about performance by company personnel: a company representative did not finish job correctly, a meter reader entered a customer’s home to read the meter without knocking, company personnel will not perform a requested service, business office personnel treated the customer rudely, and overall mismanagement of a utility. This category also includes any complaints about sales such as appliance sales by the utility. Rates: General or specific complaints about a utility’s rates: general or specific rates are too high, the company’s rates are being used to recover advertising costs, or the customer is being billed on the incorrect rate. Competition: Complaints about issues that are directly related to competition: enrollment/eligibility, application and licensing, supplier selection, changing/switching suppliers which includes slamming, advertising and sales, billing, contracts, and credit and deposits. This category also includes any complaints about more general competition issues such as consumer education, pilot programs and restructuring. Other: All other complaints that do not fit into the above categories including but not limited to complaints about termination procedures when there is no need for payment arrangements and complaints about delivered service from the utility.

97
Appendix A-2
Classification of Consumer Complaints Telephone
Billing Disputes: Complaints about bills from the utility; high bills, inaccurate bills or balances, installation charges, customer charges, service charges, repair charges, late payment charges, frequency of bills and the misapplication of payment on bills. Discontinuance/Transfer: Complaints related to responsibility for or the amount of bills after discontinuance or transfer of service; company failure to finalize the account as requested or the company transferred a balance to a new or existing account from the account of another person or location. Non Recurring Charges: Complaints about one time charges for installation of basic and/or nonbasic services. Toll Services: Complaints about charges for local toll and/or long distance toll services. Credit & Deposits: Complaints about a company’s requirements to provide service: applicant payment of another person’s bill, completion of an application, provision of identification, or payment of a security deposit. This category also includes complaints about the amount of or the amortization of a deposit, the payment of interest on a deposit or the failure of a company to return a deposit to the customer. Rates: General or specific complaints about a utility’s rates; general or specific rates are too high; or the customer is being billed on the incorrect rate. Unsatisfactory Service: Complaints about poor service quality or poor service: this includes problems with the assignment of phone numbers, incorrect information in phone directories, lack of directories, equal access to toll network and service interruptions and outages. Service Delivery: Complaints about delays in service installations or disconnections of service and failures to keep scheduled appointments. This also includes the lack of facilities to provide service, unauthorized transfer of service, unavailability of special services and the rudeness of business office personnel.
98
Annoyance Calls: Complaints about the company’s failure to resolve problems related to receiving unsolicited sales calls or harassing calls. This includes the company’s failure to change the phone number, initiate an investigation and problems with auto dialers and fax machines. Disputes Related to Suspension/Termination: Complaints about suspension or termination procedures when there is no need for a payment arrangement. Audiotex: Complaints about the company’s failure to resolve billing problems related to special phone entertainment or information services. Sales Nonbasic Services: Complaints related to the sale of nonbasic services. This includes that availability of certain services and
Other: Complaints about matters such as Extended Area of Service and the expansion of local calling areas, excessive rates from operator services that provide phone service to hospitals, hotels, etc., excessive coin phone rates, etc.

99
Appendix B - Table 1
Consumer Complaint Categories*: 1997 Major Electric Utilities
Categories**
Allegheny Power
Duquesne
GPU
PECO
Penn Power
PP&L
UGI-Elec.
Electric Majors
Metering 36 24 60 65 3 39 1 228 Billing Disputes 64 62 81 167 6 105 5 490 Discontinuance/ Transfer
15 22 21 49 3 28 3 141
Other Payment Issues
6 4 8 17 2 16 0 53
Credit & Deposits
5 11 7 5 4 6 0 38
Service Extensions
7 2 13 13 5 12 2 54
Service Interruptions
12 20 19 21 1 16 0 89
Service Quality 16 9 14 47 3 12 0 101 Damages 23 12 15 19 2 10 0 81 Scheduling Delays
6 8 10 9 2 3 0 38
Personnel Problems
13 10 7 81 2 3 2 118
Rates 2 1 3 2 0 4 0 12 All Other Problems
7 4 16 23 3 7 1 61
TOTAL 212 189 274 518 36 261 14 1,504 * Categories are for residential complaints evaluated by BCS as of June 2, 1998. The case outcome may have been justified, inconclusive or unjustified **An explanation of the various complaint categories appears in Appendix A-1.

100
Appendix B - Table 2
Consumer Complaint Categories*: 1997 Major Gas Utilities
Categories** Columbia Equitable NFG PG Energy Peoples UGI-Gas Gas Majors Metering 56 40 10 9 62 29 206 Billing Disputes 25 64 25 17 50 41 222 Discontinuance/ Transfer
9 20 15 2 24 21 91
Other Payment Issues 6 23 4 0 6 6 45 Credit & Deposits 2 13 2 0 5 11 33 Service Extensions 7 3 2 9 5 6 32 Service Interruptions 3 3 0 0 0 0 6 Service Quality 7 8 6 4 4 3 32 Damages 7 3 3 2 3 2 20 Scheduling Delays 3 1 1 0 5 1 11 Personnel Problems 11 16 3 5 9 5 49 Rates 9 18 5 4 18 1 55 All Other Problems 12 7 2 1 5 3 30 TOTAL 157 219 78 53 196 129 832
* Categories are for residential complaints evaluated by BCS as of June 2, 1998. The case outcome may have been justified, inconclusive or unjustified. **An explanation of the various complaint categories appears in Appendix A-1.
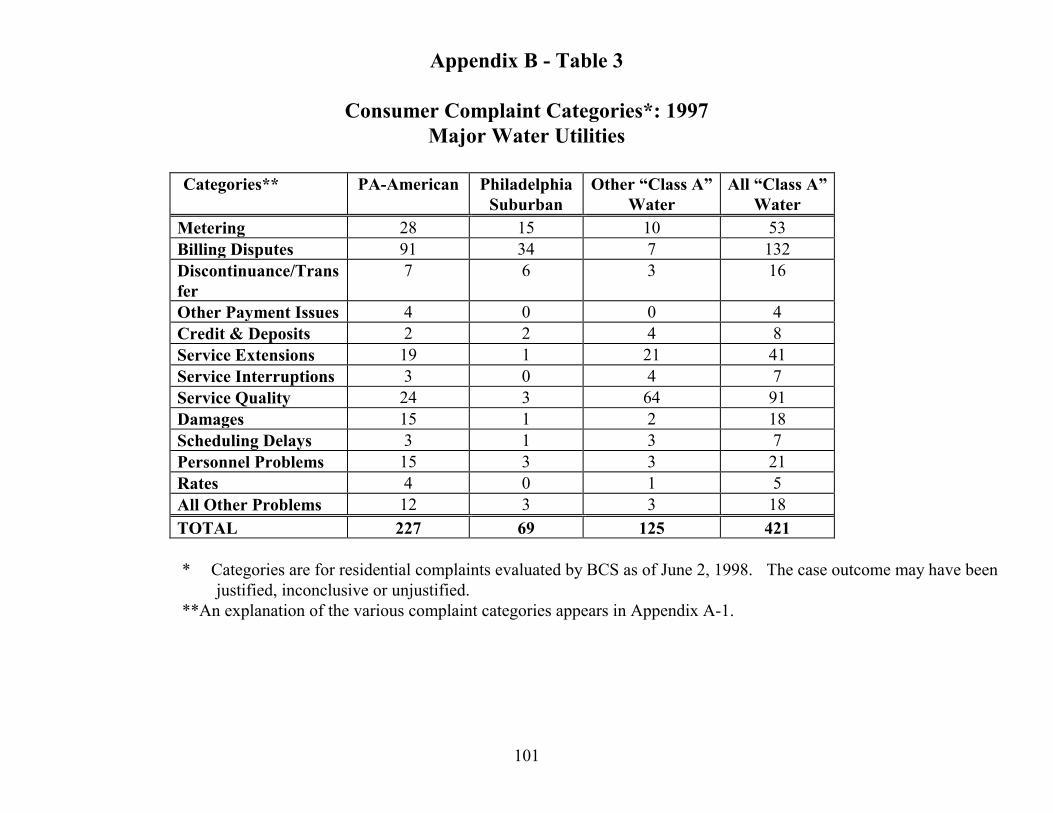
101
Appendix B - Table 3
Consumer Complaint Categories*: 1997 Major Water Utilities
Categories** PA-American Philadelphia
Suburban Other “Class A”
Water All “Class A”
Water Metering 28 15 10 53 Billing Disputes 91 34 7 132 Discontinuance/Transfer
7 6 3 16
Other Payment Issues 4 0 0 4 Credit & Deposits 2 2 4 8 Service Extensions 19 1 21 41 Service Interruptions 3 0 4 7 Service Quality 24 3 64 91 Damages 15 1 2 18 Scheduling Delays 3 1 3 7 Personnel Problems 15 3 3 21 Rates 4 0 1 5 All Other Problems 12 3 3 18 TOTAL 227 69 125 421
* Categories are for residential complaints evaluated by BCS as of June 2, 1998. The case outcome may have been justified, inconclusive or unjustified. **An explanation of the various complaint categories appears in Appendix A-1.

102
Appendix B-Table 4 Consumer Complaint Categories*: 1997
Major Telephone Utilities
Categories**
ALLTEL
Bell
Commonwealth
GTE
United
Telephone Majors
Billing Disputes 12 154 6 21 19 212 Discontinuance/Transfer 1 35 0 1 5 42 Non -Recurring charges 2 58 0 4 10 74 Toll Services 3 86 4 10 12 115 Credit & Deposits 21 38 2 6 4 71 Rates 0 25 0 11 1 37 Unsatisfactory Service 17 169 7 47 21 261 Service Delivery 7 217 3 24 11 262 Annoyance Calls 0 45 3 3 0 51 Disputes Related to Suspensions/Terminations
3 7 0 0 1 11
Audiotex 2 17 0 3 0 22 Sales Nonbasic Services 4 51 0 7 1 63 Other 1 19 0 0 2 22
TOTAL 73 921 25 137 87 1,243 * Categories are for all complaints evaluated by BCS as of June 2, 1998. The case outcome may have been justified, inconclusive or unjustified. **An explanation of the various complaint categories appears in Appendix A-2.

103
Appendix C - Table 1
1996-1997 Residential Consumer Complaint Statistics Major Electric Utilities
Residential Consumer
Complaints to BCS
Consumer Complaint
Rates1
Justified Consumer Complaints Numbers2 and Rates3
Company Name
1997 Residential Customers
1996
1997
% Change
in #
1996
1997
1996
1997 Allegheny Power 577,560 197 252 28% 0.34 0.44 50 0.09 93 0.16 Duquesne 515,848 280 236 -16% 0.54 0.48 64 0.12 31 0.06 GPU 909,893 -- 344 2%4 -- 0.39 -- -- 157 0.17 Met Ed (see GPU in 1997)
-- 138 -- -- 0.33 -- 47 0.11 -- --
PECO 1,339,668 886 695 -22% 0.67 0.53 456 0.34 244 0.18 Penelec (see GPU in 1997)
-- 199 -- -- 0.40 -- 67 0.14 -- --
Penn Power 127,769 34 39 15% 0.27 0.34 2 0.02 7 0.05 PP&L 1,089,822 391 326 -17% 0.36 0.30 112 0.10 56 0.05 UGI-Electric 53,480 20 16 -20% 0.37 0.32 8 0.15 8 0.15 Major Electric 4,614,040 2,145 1,908 -11% 808 596 Average of Rates 0.425 0.425 0.135 0.115
1Consumer Complaint Rate = Consumer Complaints per 1,000 Residential Customers. The case outcome may have been justified, inconclusive or unjustified. 2Estimated based on the number of cases on CSIS as of June 2, 1998 3Justified Consumer Complaint Rate = Justified Consumer Complaints per 1,000 Residential Customers 41997 GPU volume compared with the total of Met-Ed’s 1996 volume and Penelec’s 1996 volume 5Does not include UGI-Electric

104
Appendix C - Table 2
1996-1997 Residential Consumer Complaint Statistics Major Gas Utilities
Residential Consumer
Complaints to BCS
Consumer Complaint
Rates1
Justified Consumer Complaints
Numbers2 and Rates3 Company Name
1997 Residential Customers
1996
1997
% Change
in #
1996
1997
1996
1997 Columbia 327,662 115 181 57% 0.35 0.55 22 0.07 52 0.16 Equitable 228,630 271 246 -9% 1.18 1.08 95 0.41 51 0.22 NFG 194,804 93 89 -4% 0.48 0.46 27 0.14 26 0.13 Peoples 316,544 255 242 -5% 0.81 0.76 114 0.36 109 0.34 PG Energy 131,751 61 58 -5% 0.47 0.44 20 0.15 23 0.17 UGI-Gas 226,529 201 152 -24% 0.90 0.67 91 0.41 45 0.20 Major Gas 1,425,920 996 968 -3% 369 306 Average of Rates 0.70 0.66 0.26 0.21
1Consumer Complaint Rate = Consumer Complaints per 1,000 Residential Customers. The case outcome may have been justified, inconclusive or unjustified. 2Estimated based on the number of cases on CSIS as of June 2, 1998 3Justified Consumer Complaint Rate = Justified Consumer Complaints per 1,000 Residential Customers
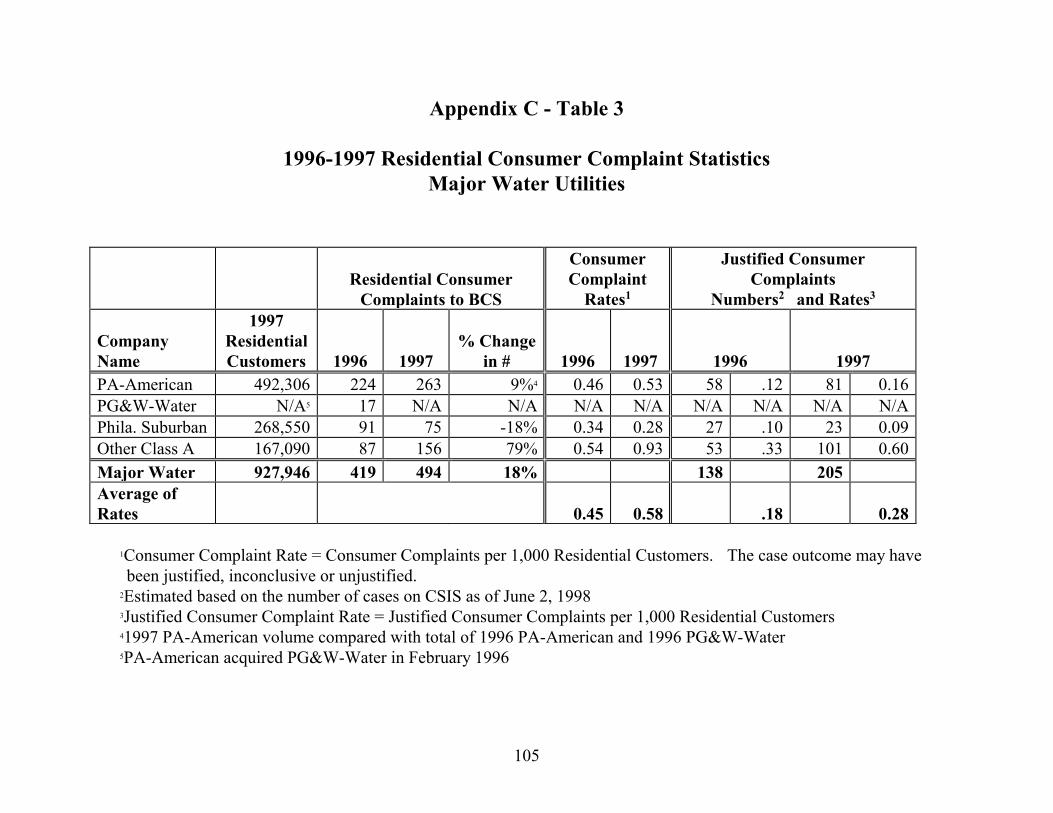
105
Appendix C - Table 3
1996-1997 Residential Consumer Complaint Statistics Major Water Utilities
Residential Consumer
Complaints to BCS
Consumer Complaint
Rates1
Justified Consumer Complaints
Numbers2 and Rates3 Company Name
1997 Residential Customers
1996
1997
% Change
in #
1996
1997
1996
1997 PA-American 492,306 224 263 9%4 0.46 0.53 58 .12 81 0.16 PG&W-Water N/A5 17 N/A N/A N/A N/A N/A N/A N/A N/A Phila. Suburban 268,550 91 75 -18% 0.34 0.28 27 .10 23 0.09 Other Class A 167,090 87 156 79% 0.54 0.93 53 .33 101 0.60 Major Water 927,946 419 494 18% 138 205 Average of Rates
0.45
0.58
.18
0.28
1Consumer Complaint Rate = Consumer Complaints per 1,000 Residential Customers. The case outcome may have been justified, inconclusive or unjustified. 2Estimated based on the number of cases on CSIS as of June 2, 1998 3Justified Consumer Complaint Rate = Justified Consumer Complaints per 1,000 Residential Customers 41997 PA-American volume compared with total of 1996 PA-American and 1996 PG&W-Water 5PA-American acquired PG&W-Water in February 1996

106
Appendix C-Table 4
1996-1997 Residential Consumer Complaints/Consumer Complaint Rate Major Telephone Utilities
Residential Consumer Complaints to BCS
Consumer Complaint
Rates1
Justified Consumer Complaints Numbers2 and Rates3
Company Name
1997 Residential Customers
1996
1997
% Change
in #
1996
1997
1996
1997 ALLTEL 173,861 73 81 11% .43 .47 31 .18 48 .28 Bell 3,790,020 1,239 1178 -5% .33 .31 686 .18 642 .17 Commonwealth 196,779 30 31 3% .17 .16 19 .11 16 .08 GTE 467,641 190 159 -16% .42 .34 121 .26 100 .21 United 275,323 90 93 3% .33 .34 24 .09 34 .12 Major Telephone 4,903,624 1,622 1,542 -5% 881 840 Average of Rates .34 .32 .16 .17
1Consumer Complaint Rate = Consumer Complaints per 1,000 Residential Customers. The case outcome may have been justified, inconclusive or unjustified. 2Estimated based on the number of cases on CSIS as of June 2, 1998 3Justified Consumer Complaint Rate = Justified Consumer Complaints per 1,000 Residential Customers

107
Appendix D
1996-1997 Response time: BCS Consumer Complaints
Company
Average Time in Days 1996 1997
Change in Days 1996 to 1997
Allegheny Power 21.6 24.0 2.4 Duquesne 20.6 19.3 -1.3 GPU N/A 30.8 8.71 Met-Ed 20.5 N/A N/A PECO 25.7 24.2 -1.5 Penelec 23.3 N/A N/A Penn Power 3.2 6.4 3.2 PP&L 11.3 12.3 1.0 UGI-Electric 16.4 17.2 0.8 Major Electric2 18.03 19.53 1.5 Columbia 12.6 25.1 12.5 Equitable 24.7 18.4 -6.3 NFG 10.6 6.5 -4.1 Peoples 16.4 14.4 -2.0 PG Energy 5.9 5.5 -0.4 UGI-Gas 18.4 10.2 -8.2 Major Gas2 14.8 13.4 -1.4 PA-American 3.6 5.0 1.4 Phila. Suburban 7.7 5.0 -2.7 Other Class A 24.5 13.5 -11.0 Major Water2 11.9 7.9 -4.0 ALLTEL 4.9 3.9 -1.0 Bell 18.8 19.0 0.2 Commonwealth 9.5 4.3 -5.2 GTE 20.6 26.5 5.9 United 7.7 9.6 1.9 Major Telephone2 12.3 12.7 .04
11997 GPU response time compared with 1996 combined response times for Met-Ed and Penelec
2Average of response times 3Does not include UGI-Electric

108
Appendix E - Table 1
1996-1997 Residential Payment Arrangement Request Statistics Major Electric Utilities
Residential
Payment Arrangement Requests (PARs) to BCS
Payment Arrangement
Request Rates1
Justified Payment Arrangement Requests Numbers2 and Rates3
Company Name
1997 Residential Customers
1996
1997
% Change
in #
1996
1997
1996
1997
Allegheny Power 577,560 2,102 2,445 16% 3.66 4.23 345 0.60* 365 0.63* Duquesne 515,848 7,759 7,471 -4% 15.06 14.48 489 0.95* 709 1.37* GPU 909,893 N/A 5,037 109%4 n/1 5.54 N/A N/A 872 0.96* Met-Ed (GPU in ‘97)
N/A 1.400 - - 3.39 - 226 0.55 - -
PECO 1,339,668 2,590 4,023 55% 1.94 3.00 437 0.33* 742 0.55* Penelec (GPU in ‘97)
N/A 1,005 - - 2.04 - 172 0.35 - -
Penn Power 127,769 1,005 970 -3% 7.95 7.59 204 1.61 286 2.24* PP&L 1,089,822 7,124 4,977 -30% 6.58 4.57 449 0.41* 415 0.38* UGI-Electric 53,480 134 160 19% 2.50 2.99 51 0.95 54 1.01 Major Electric 4,614,040 23,119 25,083 8% 2,373 3,443 Average of Rates 5.805 6.575 0.695 1.025
1Payment Arrangement Request Rate = Payment Arrangement Requests per 1,000 Residential Customers. Case outcome may have been justified, inconclusive or unjustified. 2Estimated based on a probability sample of cases and/or the number of cases on CSIS as of June 2, 1998 3Justified Payment Arrangement Request Rate = Justified Payment Arrangement Requests per 1,000 Residential Customers 4GPU volume compared with the total of Met-Ed’s 1996 volume and Penelec’s 1996 volume 5Does not include UGI-Electric * Based on a probability sample of cases

109
Appendix E - Table 2
1996-1997 Residential Payment Arrangement Request Statistics Major Gas Utilities
Residential Payment Arrangement Requests
(PARs) to BCS
Payment
Arrangement Request Rates1
Justified Payment
Arrangement Requests Numbers2 and Rates3
Company Name
1997 Residential Customers
1996
1997
% Change
in #
1996
1997
1996
1997
Columbia 327,662 840 1,492 78% 2.54 4.55 189 0.57 360 1.10* Equitable 228,630 2,572 3,997 55% 11.23 17.48 354 1.55* 434 1.90* NFG 194,804 717 1,100 53% 3.68 5.65 201 1.03 352 1.81* Peoples 316,544 2,766 2,940 6% 8.78 9.29 273 0.87* 178 0.56* PG Energy 131,751 235 275 17% 1.81 2.09 27 0.21 28 0.21* UGI-Gas 226,529 1,258 1,841 46% 5.66 8.13 446 2.01 701 3.09* Major Gas 1,425,920 8,388 11,645 39% 1,490 2,053 Average of Rates 5.62 7.86 1.04 1.45
1Payment Arrangement Request Rate = Payment Arrangement Requests per 1,000 Residential Customers. Case outcome may have been justified, inconclusive or unjustified. 2Estimated based on a probability sample of cases and/or the number of cases on CSIS as of June 2, 1998 3Justified Payment Arrangement Request Rate = Justified Payment Arrangement Requests per 1,000 Residential Customers *Based on a probability sample of cases
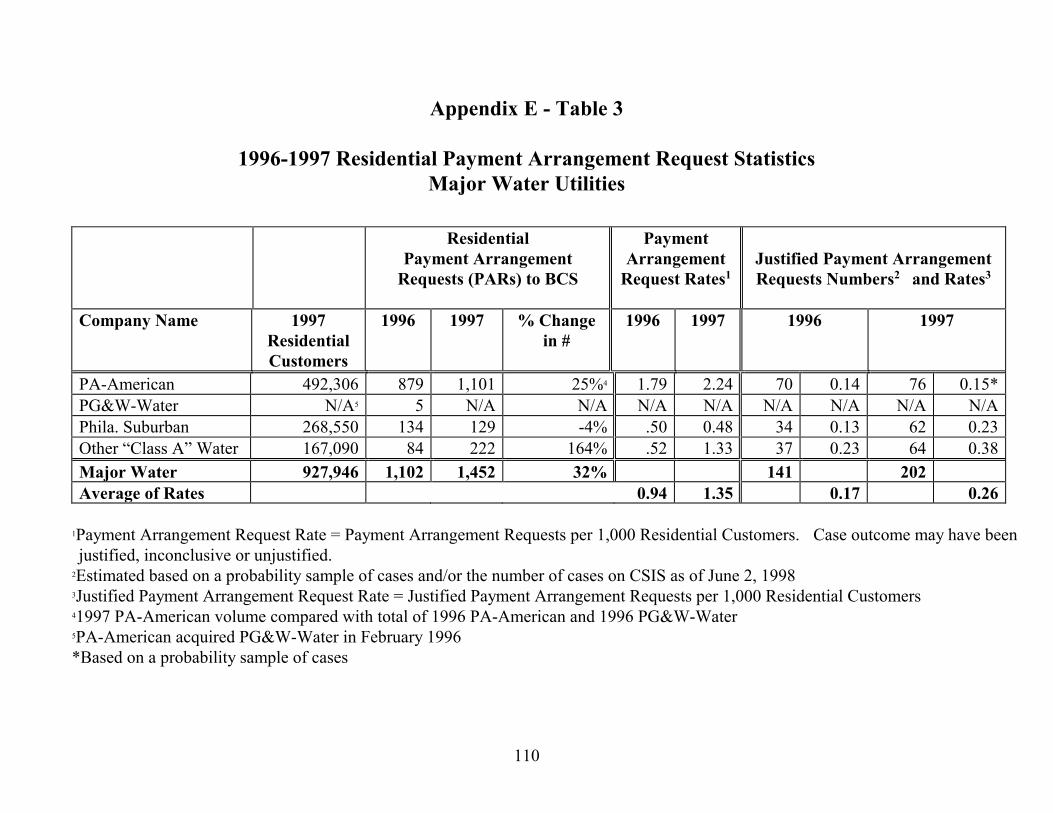
110
Appendix E - Table 3
1996-1997 Residential Payment Arrangement Request Statistics Major Water Utilities
Residential
Payment Arrangement Requests (PARs) to BCS
Payment Arrangement
Request Rates1
Justified Payment Arrangement Requests Numbers2 and Rates3
Company Name 1997 Residential Customers
1996 1997 % Change in #
1996 1997 1996 1997
PA-American 492,306 879 1,101 25%4 1.79 2.24 70 0.14 76 0.15* PG&W-Water N/A5 5 N/A N/A N/A N/A N/A N/A N/A N/A Phila. Suburban 268,550 134 129 -4% .50 0.48 34 0.13 62 0.23 Other “Class A” Water 167,090 84 222 164% .52 1.33 37 0.23 64 0.38 Major Water 927,946 1,102 1,452 32% 141 202 Average of Rates 0.94 1.35 0.17 0.26
1Payment Arrangement Request Rate = Payment Arrangement Requests per 1,000 Residential Customers. Case outcome may have been justified, inconclusive or unjustified. 2Estimated based on a probability sample of cases and/or the number of cases on CSIS as of June 2, 1998 3Justified Payment Arrangement Request Rate = Justified Payment Arrangement Requests per 1,000 Residential Customers 41997 PA-American volume compared with total of 1996 PA-American and 1996 PG&W-Water 5PA-American acquired PG&W-Water in February 1996 *Based on a probability sample of cases

111
Appendix E - Table 4 1996-1997 Residential Payment Arrangement Request Statistics
Telephone Utilities
Residential Payment Arrangement
Requests (PARs) to BCS
Payment Arrangement
Request Rates1
Justified Payment Arrangement Requests Numbers2 and Rates3
Company Name
1997 Residential Customers
1996
1997
% Change
in #
1996
1997
1996
1997**
ALLTEL 173,861 54 96 20% .32 .55 N/A N/A 25 .14 Bell 3,790,020 5,462 4,734 12% 1.46 1.25 N/A N/A 1,340 .35 Commonwealth 196,779 20 20 5% .11 .10 N/A N/A 8 .04 GTE 467,641 88 82 -19% .19 .18 N/A N/A 46 .10 United 275,323 77 55 0% .28 .20 N/A N/A 9 .03 Major Telephone
4,903,624
5,701
4,987
11%
1,428
Average of Rates
.47
.46
.13
1Payment Arrangement Request Rate = Payment Arrangement Requests per 1,000 Residential Customers. Case outcome may have been justified, inconclusive or unjustified. 2Estimated based on the number of cases on CSIS as of June 2, 1998 3Justified Payment Arrangement Request Rate = Justified Payment Arrangement Requests per 1,000 Residential Customers *Based on a probability sample of cases **Justified Payment Arrangement Request data is not available for 1996. See Chapter 6 for explanation

112
Appendix F
1996-1997 Response Time: BCS Payment Arrangement Requests
Company Average Time in Days 1996
1997
Change in Days 1996 to 1997
Allegheny Power 10.2* 14.1* 3.9 Duquesne 13.2* 8.0* -5.2 GPU N/A 21.8* 16.81 Met-Ed (see GPU in ‘97) 5.6 N/A N/A PECO 22.4* 20.8* -1.6 Penelec (see GPU in ‘97) 4.2 N/A N/A Penn Power 0.9 0.8* -.1 PP&L 10.4* 6.8* -3.6 UGI-Electric 6.0 5.4 -.6 Major Electric2 9.63 12.13 2.5 Columbia 4.7 8.7* 4.0 Equitable 21.1* 11.1* -10.0 NFG 6.1 5.3* -.8 Peoples 4.5* 3.1* -1.4 PG Energy 2.0 3.0 1.0 UGI-Gas 5.4 4.6* -0.8 Major Gas2 7.3 6.0 -1.3 PA-American 2.2 2.0* -0.2 Philadelphia Suburban 4.9 3.8 -1.1 Other Class A 22.4 15.3 -7.1 Major Water2 9.8 7.0 -2.8 ALLTEL NA4 3.4 NA Bell NA4 9.0* NA Commonwealth NA4 7.3 NA GTE NA4 18.7 NA United NA4 8.8 NA Major Telephone2 NA4 9.4 NA
* Based on a probability sample of cases 11997 GPU response time compared with combined 1996 response times for Met-Ed and Penelec 2Average of Response Times
3Does not include UGI-Electric

113
4 Not available for 1996. See Chapter 6 for explanation.

114
Appendix G - Table 1
1995-1997 Infraction Statistics Major Electric Utilities
Infractions Infraction Rates1
Company
1997 Residential Customers
1995
1996
1997
% Change in
1996-1997
1995
1996
1997 Allegheny Power 577,560 52 65 80 23% 0.09 0.11 0.14 Duquesne 515,848 54 72 24 -67% 0.10 0.14 0.05 GPU 909,893 ----- ----- 228 51%2 ----- ----- 0.25 Met-Ed (see GPU in 1997)
N/A
53
69
-----
-----
0.13
0.17
-----
PECO 1,339,668 492 573 217 -62% 0.37 0.43 0.16 Penelec (see GPU in 1997)
N/A
19
82
-----
-----
0.04
0.17
-----
Penn Power 127,769 8 8 8 0% 0.06 0.06 0.06 PP&L 1,089,822 106 98 33 -66% 0.10 0.09 0.03 UGI-Electric 53,480 23 20 12 -40% 0.43 0.37 0.22 Major Electric 4,614,040 807 987 602 -39%
1Infraction Rate = Number of Infractions per 1,000 Residential Customers 21997 infractions of GPU compared with the combined total of 1996 infractions of Met-Ed and Penelec

115
Appendix G - Table 2
1995-1997 Infraction Statistics Major Gas Utilities
Infractions Infraction Rates1
Company
1997 Residential Customers
1995
1996
1997
% Change in
1996-1997
1995
1996
1997 Columbia 327,662 53 51 51 -0% 0.16 0.15 0.16 Equitable 228,630 121 72 26 -64% 0.53 0.31 0.11 NFG 194,804 23 36 19 -47% 0.12 0.18 0.10 Peoples 316,544 82 110 112 2% 0.26 0.35 0.35 PG Energy 131,751 27 19 17 -11% 0.21 0.15 0.13 UGI-Gas 226,529 71 144 37 -74% 0.32 0.65 0.16 Major Gas 1,425,920 377 432 262 -39%
1Infraction Rate = Number of Infractions per 1,000 Residential Customers.

116
Appendix G - Table 3
1995-1997 Infraction Statistics Major Water Utilities
Infractions Infraction Rates1
Company
1997 Residential Customers
1995
1996
1997
% Change in
1996-1997
1995
1996
1997 PA-American 492,306 32 67 45 -33% 0.09 0.14 0.09 PG&W-Water N/A 34 N/A1 N/A N/A 0.28 N/A N/A Phila. Suburban 268,550 51 44 25 -43% 0.20 0.17 0.09 Other “Class A” 167,090 51 56 39 -30% 0.32 0.34 0.23 Major Water 927,9462 168 167 109 -35%
1Infraction Rate = Number of Infractions per 1,000 Residential Customers. 2PA-American acquired PG&W-Water in February 1996.

117
Appendix G - Table 4 1995-1997 Infraction Statistics
Major Telephone Utilities
Infractions Infraction Rates1
Company Name 1997
Residential Customers
1995
1996
1997
% Change in 1996-1997 #
1995
1996
1997 ALLTEL 173,861 28 29 67 131% 0.17 0.17 0.39 Bell 3,790,020 1,372 1,248 904 -27% 0.37 0.33 0.24 Commonwealth 196,779 37 54 45 -17% 0.21 0.31 0.23 GTE 467,641 518 316 357 13% 1.14 0.69 0.76 United 275,323 57 63 82 30% 0.21 0.23 0.30 Major Telephone 4,903,624 2,012 1,710 1,455 -15% 0.42 0.35 0.30
1Infraction Rate = Number of Infractions per 1,000 Residential Customers

118
Appendix H
1997 CAP Participant Payment Rate
Utility 1995 1996 1997
Allegheny 81% 89% 90% Duquesne N/A 89% 85% Met-Ed 84% 82% 78% PECO-CAP 71% 77% 87% CAP Rate 70% 68% Penelec 77% 81% 85% Penn Power No Program PP&L N/A N/A N/A UGI-Electric No Program Columbia N/A N/A N/A Equitable 85% 87% 84% NFG 82% 80% 77% PG Energy N/A 69% 66% Peoples 91% 85% 91% UGI-Gas Program began 7/97 Quarterly Ave 81% 81% 81% *Participant payment rate is defined as the total number of CAP bills issued in a quarter divided by the total number of full, on-time CAP payments in a quarter.
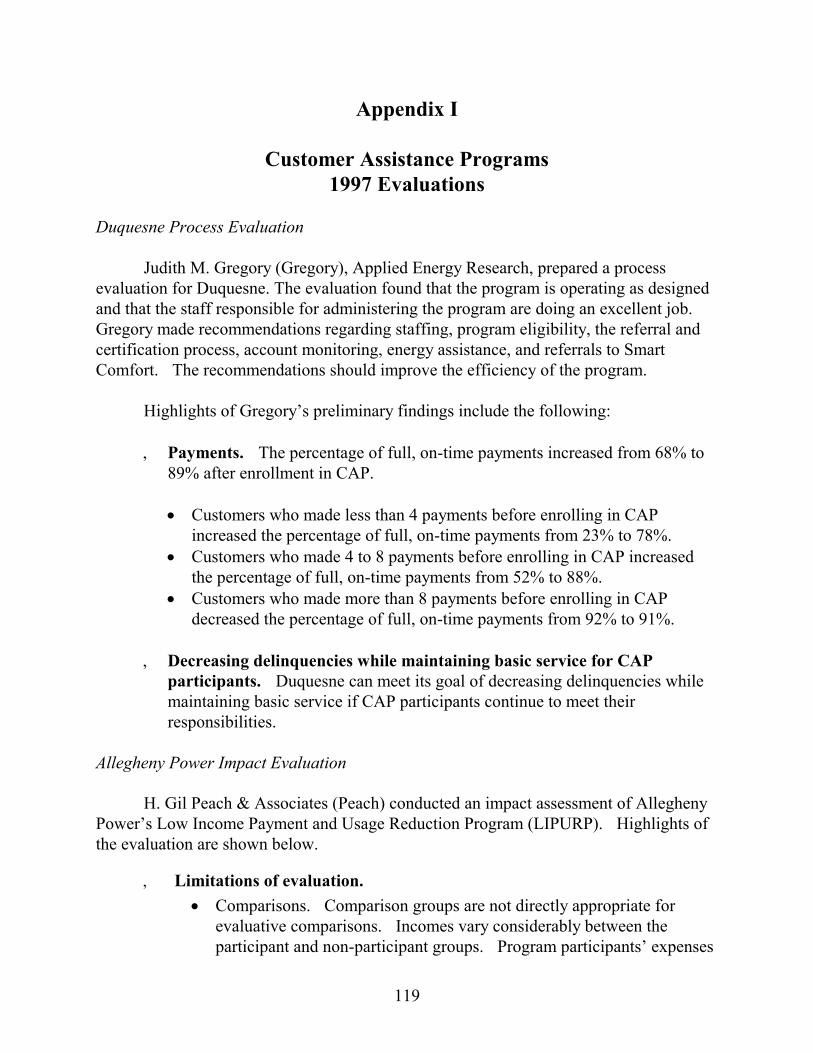
119
Appendix I
Customer Assistance Programs 1997 Evaluations
Duquesne Process Evaluation Judith M. Gregory (Gregory), Applied Energy Research, prepared a process evaluation for Duquesne. The evaluation found that the program is operating as designed and that the staff responsible for administering the program are doing an excellent job. Gregory made recommendations regarding staffing, program eligibility, the referral and certification process, account monitoring, energy assistance, and referrals to Smart Comfort. The recommendations should improve the efficiency of the program. Highlights of Gregory’s preliminary findings include the following:
Payments. The percentage of full, on-time payments increased from 68% to 89% after enrollment in CAP.
• Customers who made less than 4 payments before enrolling in CAP
increased the percentage of full, on-time payments from 23% to 78%. • Customers who made 4 to 8 payments before enrolling in CAP increased
the percentage of full, on-time payments from 52% to 88%. • Customers who made more than 8 payments before enrolling in CAP
decreased the percentage of full, on-time payments from 92% to 91%. Decreasing delinquencies while maintaining basic service for CAP
participants. Duquesne can meet its goal of decreasing delinquencies while maintaining basic service if CAP participants continue to meet their responsibilities.
Allegheny Power Impact Evaluation
H. Gil Peach & Associates (Peach) conducted an impact assessment of Allegheny Power’s Low Income Payment and Usage Reduction Program (LIPURP). Highlights of the evaluation are shown below.
Limitations of evaluation. • Comparisons. Comparison groups are not directly appropriate for
evaluative comparisons. Incomes vary considerably between the participant and non-participant groups. Program participants’ expenses

120
exceed their incomes (negative ability to pay) while most non-participants do not have a negative ability to pay situation. Finally, LIPURP removes the most payment-troubled customers from the comparison group and enrolls them in the program.
• Possible “Floor” effects. Allegheny Power’s residential rates are the
lowest in the state. Allegheny Power’s rates compare to the CAP rates for Duquesne and PECO. Cases near the bottom or top of a statistical distribution may show some unusual qualities (floor and ceiling effects).
Basic findings. • Net cost per LIPURP participant is $376 per year. • Payments are affordable. In a year, only about 16% of participants
default for nonpayment. • Participants pay the variable cost of energy and contribute to fixed costs. • LIPURP restores regular payment patterns. • Participants maintain the same level of energy assistance grants. Non-
participants’ grant levels decreased. • Participants reduce their rate of arrearage growth. • Participants do not increase energy usage. • Administrative costs are higher for LIPURP than traditional collection
costs. Limitations on data may be responsible for producing this finding as further explained below. Automatic certification and/or recertification costs could reduce administration costs.
Conclusions and Recommendations. Peach concludes that “On balance, LIPURP is a well designed, and well run pilot that accomplishes its basic design objectives. It should be continued.” Allegheny Power could reduce program costs by increasing the size of payments. However, percentage increases should be small. A discounted tariff could provide assistance and reduce costs. Allegheny Power should consider adding a new payment level for water heating customers. Peach also concludes that significant administrative savings are possible. Peach does not believe that its comparison of LIPURP with the costs of traditional collections shows the true costs of collecting residential customer debt using traditional methods. Allegheny Power did not have the data for Peach to determine the true costs of traditional collections. Peach prefers to determine collection costs by using actual budget categories that include support services, overhead, productivity factors, personnel costs, and collection costs. Because this information was not available, Peach counted collection events and identified costs for these events. Peach believes that without the

121
preferred data, the true collection costs are undercounted and thus the comparison between traditional collections and LIPURP is flawed. Peach also concludes that the program could potentially realize significant savings by adopting automated certification and/or recertification procedures.

122
Appendix J - Table 1 CARES Programs Electric Utilities
Design Elements
Utility
Full-Time Utility or Contracted Staff
Positions Assigned to CARES
Eligibility
Payment
Arrangements
Home Visits
Participation
Limit Allegheny Power 3 Residential Customer Relations
Specialists 1. Special needs* 2. Arrearage < $750
1. Flexible payment arrangements
Yes None
Duquesne 2 outreach workers (Goodwill Industry of Pittsburgh)
1. Terminated or 2. Special needs*
1. Budget Plus 2. Current Plus
Yes None
GPU Energy 6 Customer Relations Representatives
1. Age 60 years or older or; 2. Disabled or; 3. Seriously ill or; 4. Change in payment history or; 5. Arrearage < $800
1. Budget Plus Yes None
PECO Energy Customer Consultants have absorbed the CARES responsibilities. The Program Coordinator handles special cases.
1. Special needs* 1. Budget Plus Yes None
Penn Power 1 Director - contract staff 1 Field Representative - contract staff
1. Temporary Special needs.* 1. Flexible payment arrangements.
Yes None
PP&L 6 CARES Representatives 1. Special needs* 1. Flexible payment arrangements.
Yes None
UGI-Electric 1 Residential Supervisor 2 Residential Customer Consultants (5% of time spent on CARES activities)
1. Special needs* No Yes None
* Special needs includes medical problems, personal crisis or loss of income.

123
Appendix L - Table 2 CARES Programs
Gas Utilities
Design Elements
Utility
Full-Time Utility or contracted Staff
Positions Assigned to CARES
Eligibility
Payment
Arrangements
Home Visits
Participation
Limit Columbia 4 Customer Program Consultants 1. Special needs*
2. Short term crisis (18 months)
1. Budget Plus 2. Less than current bill (short term)
Yes None
Equitable 1 Manager 3 Special Program Administrators 1 Special Needs Representative 3 Consumer Services Reps
1. Special needs* OR 2. Age 60 years or older 3. Income = 150% of poverty and payment troubled
1. Budget Plus. 2. Enrollment in Energy Assistance Program
Yes None
NFG 2 Supervisors 4 Representatives 1 Part-time Representative
1. Special needs* 2. Negative ability to pay 3. Temporary financial hardships.
1. Budget Plus 2. Less than current bill
Yes None
Peoples 2 CARES Representatives
1. Special needs* 2. Income = 200% of poverty
1. Limited payment arrangements
Yes None
PG Energy 1 Part-time Community Relations Coordinator 3 Part-time Community Relations Representatives
1. Special needs* OR 2. Age 60 years or older
1. Budget Plus Yes None
TW Phillips 1 Part-time consultant 6 Customer Service Representatives
1. Special needs* 1. Budget Plus Yes None
UGI-Gas 3 Customer Outreach 4 Community Relations Coordinators
1. Special needs* 2. Negative ability to pay
1. Budget Plus Yes None
* Special needs includes medical problems, personal crisis or loss of income.

124
Appendix K
LIURP SPENDING 1995 1996 1997 Ten Year Total Allegheny Power $1,103,101 $812,439 $568,966 $8,847,030 Duquesne $644,928 $778,460 $742,033 $6,854,256 Met-Ed $1,411,201 $772,065 $1,353,009 $12,103,061 Penelec $1,081,240 $652,372 $861,646 $9,109,833 Penn Power $149,900 $162,500 $153,800 $1,488,307 PP&L $3,038,948 $2,990,666 $3,057,730 $30,119,972 PECO* $2,500,000 $3,300,000 $3,119,853 $31,729,853 UGI-Electric $110,695 $102,726 $62,787 $697,442 Electric-Total $10,040,013 $9,571,228 $9,919,824 $100,949,754 Columbia $1,228,323 $1,324,439 $1,206,201 $9,654,488 Equitable $622,468 $644,062 $649,122 $5,717,841 NFG $951,839 $898,757 $996,681 $5,946,313 Peoples $643,089 $678,224 $674,852 $6,644,661 PG Energy $313,804 $305,302 $293,182 $2,887,207 TW Phillips $177,196 $183,559 $252,179 $1,592,182 UGI-Gas $465,295 $554,340 $470,167 $4,678,208 Gas-Total $4,402,014 $4,588,683 $4,542,384 $37,120,900 Overall Total $14,442,027 $14,159,911 $14,462,208 $138,070,654
* Combined electric and gas

125
Appendix L
LIURP Production Levels
Heating Jobs Water Heating Jobs Baseload Jobs
1995
1996
1997
10 Yr. Total
1995
1996
1997
10 Yr. Total
1995
1996
1997
6 Yr. Total
Cumulative 10 Yr. Total
Allegheny Power 450 203 297 5,763 803 295 314 8,878 25 1 3 306 14,947 Duquesne 4 73 4 1,964 114 8 8 976 487 624 1,011 3,391 6,331 Met-Ed 341 302 405 5,957 590 296 315 4,639 96 62 233 599 11,195 Penelec 436 344 240 4,330 1,317 809 685 10,815 396 39 79 775 15,920 Penn Power 17 33 27 532 138 91 127 1,638 54 18 50 194 2,364 PP&L 1,815 1,849 1,965 20,203 263 249 202 5,181 738 543 427 2,104 27,488 PECO* 747 740 769 13,019 270 1,236 0 7,644 4,001 6,504 4,693 16,478 37,141 UGI-Electric 24 37 5 234 0 0 0 12 43 29 13 124 370 Electric-Total 3,834 3,581 3,712 52,002 3,495 2,984 1,651 39,783 5,840 7,860 6,509 23,971 115,756 Columbia 350 375 298 2,803 2,803 Equitable 164 181 194 1,473 1,473 NFG 228 232 244 2,004 2,004 Peoples 224 222 225 2,514 2,514 PG Energy 159 143 138 1,693 1,693 TW Phillips 45 41 42 675 675 UGI-Gas 132 221 179 1,837 1,837 Gas-Total 1,306 1,415 1,320 12,999 12,999 Overall Total 5,140 4,996 5,032 65,001 3,495 2,984 1,651 39,783 5,840 7,860 6,509 23,971 128,755
* Combined electric and gas
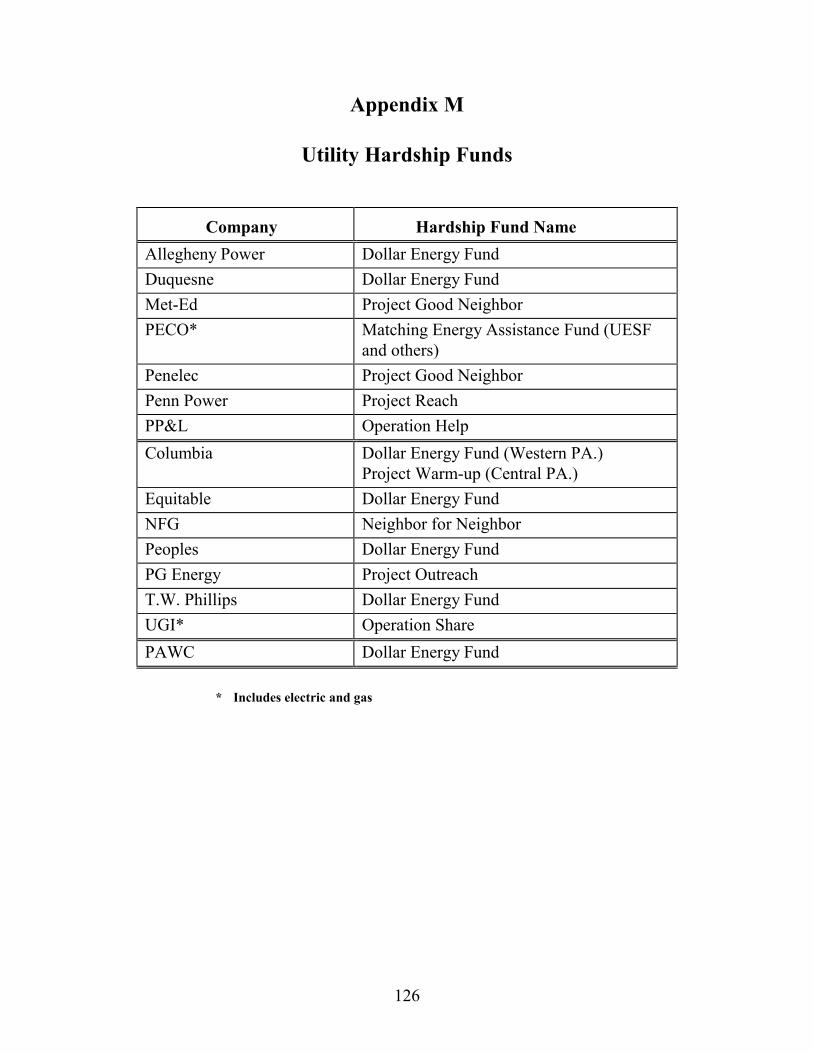
126
Appendix M
Utility Hardship Funds
Company
Hardship Fund Name
Allegheny Power Dollar Energy Fund Duquesne Dollar Energy Fund Met-Ed Project Good Neighbor PECO* Matching Energy Assistance Fund (UESF
and others) Penelec Project Good Neighbor Penn Power Project Reach PP&L Operation Help Columbia Dollar Energy Fund (Western PA.)
Project Warm-up (Central PA.) Equitable Dollar Energy Fund NFG Neighbor for Neighbor Peoples Dollar Energy Fund PG Energy Project Outreach T.W. Phillips Dollar Energy Fund UGI* Operation Share PAWC Dollar Energy Fund
* Includes electric and gas

127
Appendix N 1995-97 PUC Consumer Advisory Council
Ms. Valeria C. Bullock, Energy Project Coordinator Community Legal Services, Inc. 1424 Chestnut Street Philadelphia, PA 19102 Ms. Cynthia J. Datig Executive Director Dollar Energy Fund Box 42329 Pittsburgh, PA 15203-0329
Ms. J. D. Dunbar, Chief Executive Officer Penna. Rural Leadership Program Pennsylvania State University 6 Armsby Building University Park, Pa. 16802-5602 Mr. William Farally Sheet Metal Workers International Association Chief International Representative 1750 New York Ave. NW Washington, DC 20006-5386 Ms. Andrea Fitting Fitting-Kolbrener 7 Wood Street, 5th Floor Pittsburgh, PA 15222 Mr. Alan Jennings Community Action Committee of the Lehigh Valley 520 East Broad Street Bethlehem, PA 18018 Mr. Carl Kahl 320 Walker Grove Road Somerset, PA 15501
Mr. Elliott G. Lengel 138 Uber Road Mercer, PA 16137 Mr. Dennis C. Manown RD#1, Box 536 Belle Vernon, Pa. 15012 Mr. Charles McDonald 7 Berbro Road Upper Darby, Pa. 19082 Mr. Andrew McElwaine The Heinz Endowments 30 CNG Tower 625 Liberty Avenue Pittsburgh, PA 15222 Ms. Katherine A. Newell, Esq. 935 Crestmont Road Bryn Mawr, PA 19010 Dr. Daniel M. Paul Box 75A RD#2 Ashland, PA 17921 Mr. James S. Schneider Manager, Corporate Energy Affairs RR Donnelley & Sons Company 1375 Harrisburg Pike Lancaster, PA 17601 Mr. Julio J. Tio Apartment 806 322 N. Second Street Harrisburg, PA 17101

128
Appendix O
1996-1997 Pennsylvania Relay Service Advisory Board
Mr. Donald R. Lurwick, Chairman PA Society for Advancement of the Deaf P.O. Box 27055 Philadelphia, PA 19118-0055 Ms. Marcia Finisdore, Secretary Self-Help for Hard of Hearing 1105 Wooded Way Media, PA 19063-2291 Mr. Lawrence J. Brick PA Society for Advancement of the Deaf 3017 Midvale Avenue Philadelphia, PA 19129-1027 Mr. Douglas Hardy Central PA Association for the Deaf & Blind Box 34 Summerdale, PA 17093-0034 Ms. Colleen Danielson Outreach Manager A.T. & T. PA Relay Center 745-Route 202/206, Rm. 2A17 Bridgewater, NJ 08807
Mr. Jim Stoltz, Vice Chairman Self-Help for Hard of Hearing 540 Squire Place Pittsburgh, PA 15237 Ms. Gail Wickwire PA Public Utility Commission P.O. Box 3265 Harrisburg, PA 17105-3265 Mr. Steve Samara Pennsylvania Telephone Association 30 North Third Street, Suite 300 Harrisburg, PA 17108-5253 Ms. Debra Maltese, Director Office for the Deaf & Hard of Hearing 1308 Labor & Industry Building Seventh & Forster Streets Harrisburg, PA 17120 Ms. Lenora Best Bureau of Consumer Services PA Public Utility Commission P.O. Box 3265 Harrisburg, PA 17105-3265
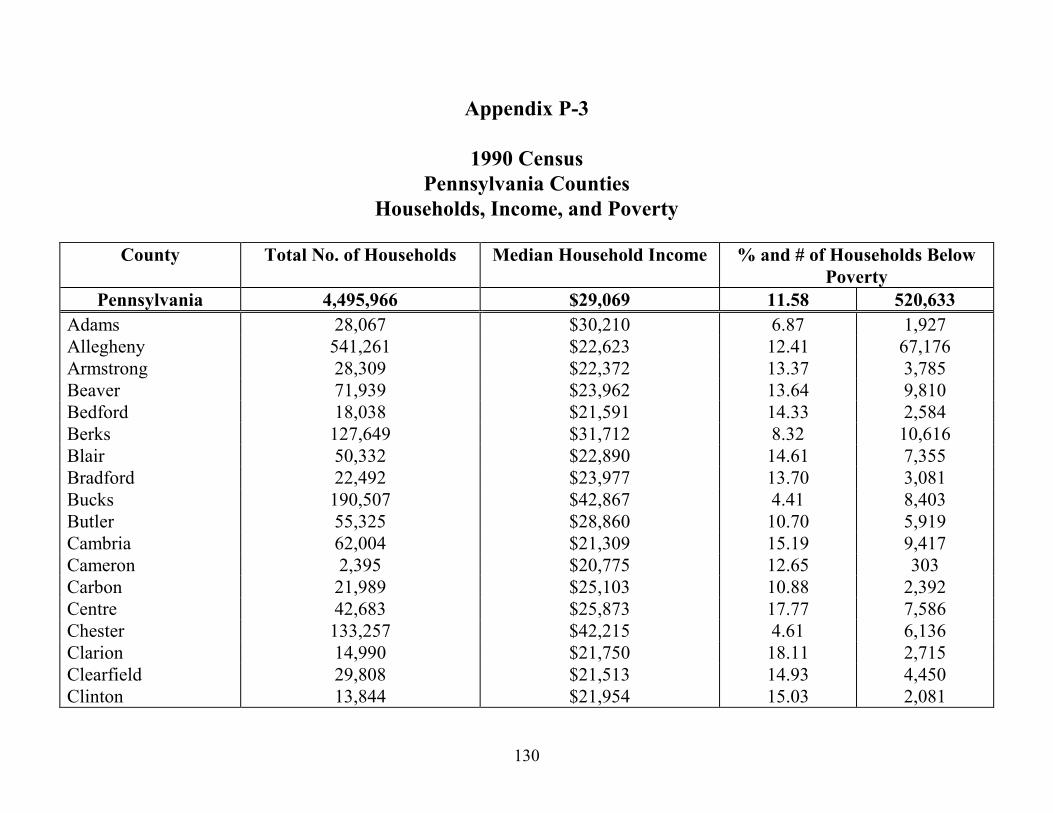
130
Appendix P-3
1990 Census Pennsylvania Counties
Households, Income, and Poverty
County Total No. of Households Median Household Income % and # of Households Below Poverty
Pennsylvania 4,495,966 $29,069 11.58 520,633 Adams 28,067 $30,210 6.87 1,927 Allegheny 541,261 $22,623 12.41 67,176 Armstrong 28,309 $22,372 13.37 3,785 Beaver 71,939 $23,962 13.64 9,810 Bedford 18,038 $21,591 14.33 2,584 Berks 127,649 $31,712 8.32 10,616 Blair 50,332 $22,890 14.61 7,355 Bradford 22,492 $23,977 13.70 3,081 Bucks 190,507 $42,867 4.41 8,403 Butler 55,325 $28,860 10.70 5,919 Cambria 62,004 $21,309 15.19 9,417 Cameron 2,395 $20,775 12.65 303 Carbon 21,989 $25,103 10.88 2,392 Centre 42,683 $25,873 17.77 7,586 Chester 133,257 $42,215 4.61 6,136 Clarion 14,990 $21,750 18.11 2,715 Clearfield 29,808 $21,513 14.93 4,450 Clinton 13,844 $21,954 15.03 2,081

131
County Total No. of Households Median Household Income % and # of Households Below Poverty
Pennsylvania 4,495,966 $29,069 11.58 520,633 Columbia 23,478 $23,984 11.23 2,636 Crawford 32,185 $22,749 14.98 4,822 Cumberland 73,452 $34,119 5.80 4,258 Dauphin 95,264 $30,593 10.35 9,857 Delaware 201,374 $36,901 7.51 15,121 Elk 13,131 $24,392 11.77 1,545 Erie 101,564 $26,331 12.94 13,139 Fayette 56,110 $18,939 21.05 11,811 Forest 1,908 $19,309 13.21 252 Franklin 45,675 $28,566 8.56 3,911 Fulton 5,139 $23,421 14.03 721 Greene 14,624 $19,704 21.59 3,157 Huntingdon 15,527 $23,058 14.38 2,232 Indiana 31,710 $22,454 18.53 5,875 Jefferson 17,608 $21,727 14.93 2,628 Juniata 7,598 $25,328 10.70 813 Lackawanna 84,528 $24,339 12.41 10,487 Lancaster 150,956 $33,013 7.37 11,132 Lawrence 36,350 $22,142 14.01 5,094 Lebanon 42,688 $29,443 7.64 3,260 Lehigh 112,887 $32,268 7.67 8,658 Luzerne 128,483 $23,343 12.77 16,413 Lycoming 44,949 $25,254 12.09 5,436 McKean 17,837 $23,021 15.04 2,682 Mercer 45,591 $24,133 13.17 6,002 Mifflin 17,697 $22,667 14.01 2,480

132
County Total No. of Households Median Household Income % and # of Households Below
Poverty Pennsylvania 4,495,966 $29,069 11.58 520,633
Monroe 34,206 $32,572 7.47 2,556 Montgomery 254,995 $43,204 4.24 10,804 Montour 6,543 $27,210 8.05 527 Northampton 90,955 $32,416 7.72 7,023 Northumberland 38,736 $21,941 13.29 5,148 Perry 14,949 $29,692 7.83 1,170 Philadelphia 603,075 $23,941 19.51 117,683 Pike 10,536 $30,265 7.33 772 Potter 6,246 $21,380 15.98 998 Schuylkill 60,773 $22,640 12.84 7,804 Snyder 12,764 $26,097 10.58 1,350 Somerset 29,574 $21,524 15.06 4,455 Sullivan 2,280 $20,112 17.24 393 Susquehanna 14,898 $24,269 13.24 1,973 Tioga 14,974 $22,542 14.37 2,151 Union 11,689 $27,552 9.30 1,087 Venango 22,408 $22,463 14.17 3,176 Warren 17,244 $26,021 9.71 1,675 Washington 78,533 $25,251 13.83 10,859 Wayne 14,638 $24,761 11.67 1,708 Westmoreland 144,080 $25,307 12.02 17,318 Wyoming 10,002 $27,038 12.17 1,217 York 128,666 $32,322 6.70 8,620
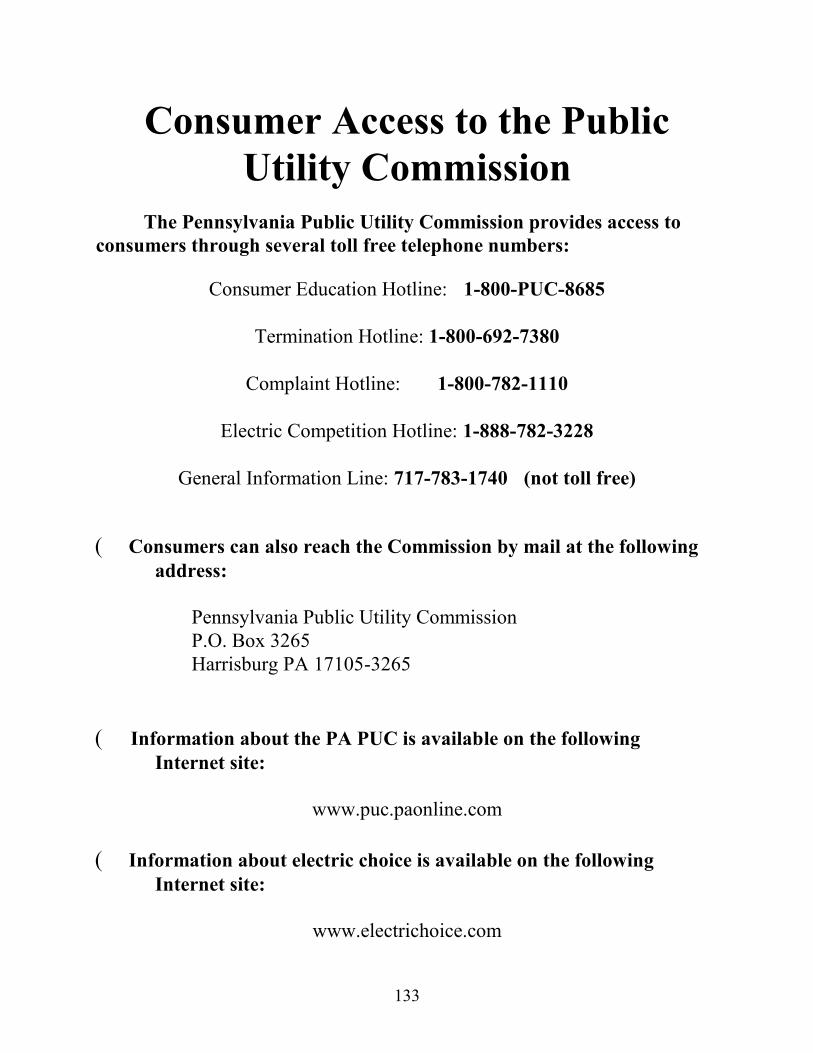
133
Consumer Access to the Public Utility Commission
The Pennsylvania Public Utility Commission provides access to consumers through several toll free telephone numbers:
Consumer Education Hotline: 1-800-PUC-8685
Termination Hotline: 1-800-692-7380
Complaint Hotline: 1-800-782-1110
Electric Competition Hotline: 1-888-782-3228
General Information Line: 717-783-1740 (not toll free) Consumers can also reach the Commission by mail at the following address: Pennsylvania Public Utility Commission P.O. Box 3265 Harrisburg PA 17105-3265 Information about the PA PUC is available on the following Internet site:
www.puc.paonline.com
Information about electric choice is available on the following Internet site:
www.electrichoice.com