1990 highway cost allocation study - missouri
TRANSCRIPT


\
HIGHWAY COST ALLOCATION
STUDY
Prepared By
MISSOURI HIGHWAY AND TRANSPORTATION DEPARTMENT Division of Planning
November 1991
In Cooperation With
U.S. DEPARTMENT OF TRANSPORTATION Federal Highway Administration
The opinions, findings and conclusions expressed in this publication are not necessarily those of the Federal Highway Administration.

/
PREFACE
The state hi~hway system in Missouri operates on a "pay as you go" basis. All state funds for constructiOn, maintenance and administration of the system are derived solely from fees assessed on the ownership and/ or operation of vehicles within the state. Revenue from such fees is supplemented by federal funds which are similarly derived.
This study is limited to the state highway system and follows the traditional concept that ~he highway user is the beneficiary and is therefore responsible for the cost. Several other state agencies receive a portion of state highway revenues for reimbursement of highway-related costs. By constitutional provision, cities and counties also receive a portion of the state collected revenues for use on roads and streets under their jurisdiction. Although local jurisdictions receive some road funds from property taxation unrelated to vehicle operation or ownership, none of these funds accrue to the state system.
Previous studies have estimated the cost responsibility assignable to the various vehicle registration classes and the revenues generated by them. This study is an update of the 1984 cost allocation study conducted by the Division of Planning. The enactment of Proposition A in 1987 included new tax structures which had significant effects on the allocation of cost responsibility.
The study does not reflect or address highway needs. It uses available data to determine the estimated vehicle cost responsibility and payment for fiscal year 1990, which was assumed to represent an average condition since the passage of Proposition A. -
REPORT SUMMARY
In 1990, the state system of highways included 32,285 roadway miles. Of this, 1,178 miles were interstate, 6,806 miles were primary and 24,301 miles were supplementary highways. This represents an increase of 39 miles since 1985.
Since the 1984 study, annual travel on this system increased 22.9 percent to 36.0 billion vehicle miles. Vehicle registrations, excluding motorcycles, have grown from 3.605 million to 3.859 million, a 7.0 percent increase. Passenger car travel has increased from 20.1 billion vehicle miles annually to 24.1. Light truck travel likewise has increased from 6.3 billion vehicle miles annually to 8.4. The heaviest trucks (over 60,010) registered for beyond local are now traveling an estimated 2.7 billion vehicle miles annually, an increase of 20.1 percent.
THIS STUDY IS NOT A NEEDS STUDY. It is intended solely to determine the proper allocation of costs and payments to vehicles in the various vehicle registration classes.
The total state user obligation for cost of the state highway system during 1990 was $571 million. State funds used directly by the Missouri Highway and Transportation Department amounted to $448 million of which $179 million was allocated for the construction program, $198 million for maintenance and $71 million for administration, O.AS.I. and fringe benefits. -
State funds transferred to other agencies for costs of highway related services and other obligations mandated by law account for another $123 million.
The total 1990 annual cost attributed to the state system of highways and services of supporting agencies was $824 million which includes use of all federal funds available for highways. This cost is judged to be the direct responsibility of the users (motor vehicle owners and/or operators) who derive direct benefit from the highway system.
Income from fuel tax, registration and other fees and miscellaneous receipts were $571 million in 1990.
The results show overpayment with respect to responsibility for passenger cars and underpayment by most beyond local trucks registered above 18,000 pounds. Comparisons of responsibility and payments for local trucks reveal a variation in overpayment and underpayment among the weight groups.

)
I
INTRODUCI'ION
Over five million Missourians are joined by many non-resident users to take advantage of more than 32,000 miles of state-maintained highways ·for business and pleasure. Although this system represents only 27 percent of the total road and street mileage in Missouri, it cames 72 percent of the travel.
Municipal, county and township systems augment the state highway system which makes possible a road network providing virtually door-to-door travel throughout Missouri.
There were 3.9 million vehicles registered in Missouri in 1990. Passenger cars represent 71 percent of the total with trucks and buses accounting for the remaming 29 percent. Motorcycles are not a direct part of this data but over 67,000 were registered in 1990.
This study seeks to determine the distribution of costs associated with improving, maintaining and administering the state highway system between the various vehicle classifications.
HOW IS THE SYSTEM SUPPORTED?
. The predominant sources of state revenue for the state highway system -are the motor vehicle fuel tax (eleven cents per gallon), motor vehicle registration fees and onehalf the sales tax on motor vehicles.
The funds mentioned are all generated from fees on the highway user - that is, motor vehicle owners and/or operators.
Portions of these funds are allocated to other jurisdictions as provided by law. This study is confined only to those funds available for use on the state highway system.
WHAT ARE THE STUDY BOUNDARIES?
This study considered fiscal year 1990 state highway system revenue and use by the various registratiOn classes. . . .
The following evaluations have been developed:
Allocation of user costs by registration class;
Comparison of user costs to user generated revenue.
WHAT IS CQNSIDERED IN ALLOCATING COST RESPONSIBILITY?
While the provision of a state highway system for the mobility of the state's residents is beneficial to the economic well-being of the state and affects the lives of all its citizens, the cost of operating the system has traditionally been considered to be a direct obligation of th.e highway user. Allocati~n of .cost to ~he use~, who dire~ly benefits from the sys~em, considers such factors as vehicle siZe, vehtcle weight, and mlles traveled by the variOus vehicle registration classes and the relationship between the costs and the factors associated with each class.

HOW WAS THE DATA OBTAINED?
The state maintains records of system mileage, vehicle classification and miles traveled by the various classes of vehicles. Data from automatic vehicle classification and wei~h in motion equipment and visual observation are used to gather data on commercial veh1cle operating weights, vehicle types and registration groups.
files. Construction, maintenance and administrative costs are contained in department

II
VEHICLE AND SYSTEM CHARACI'ERISTICS
This portion of the report analyzes financial data for fiscal year 1990 and average annual travel for calendar year 1990. This data provided the basis for-the allocation of costs and payments for the study.
WHAT ARE THE TRENDS IN VEHICLE REGISTRATION?
Since 1985, vehicle registration in Missouri has increased 7.0 percent. Passenger car registration has increased by slightly less than three percent and truck registration by more than 22 percent. Table I shows the 1990 registrations by class.
Trucks registered as "local" are restricted to a 25-mile radius from the municipality of registration. Farm trucks are exempted from this restriction when hauling the owner's property. The number of trucks registered as local remains fairly stable but represents a decreasing percentage of total truck registration. Trucks registered as "beyond local" are authorized to operate an}'!Vhere within the state.
In recent years, a growing trend toward the use of pickup trucks and vans for personal transportation has somewhat reduced the total percentage of passenger cars.
Throughout the state system, passenger cars represented 71 percent of the v.ehicles with panel-pickup trucks representing 18 percent. Heavier trucks make up the balance of 11 percent. Vehicle registrations by class are shown in Table I.
HOW FAR DO THEY TRAVEL?
Vehicle miles of travel for 1990 are shown in Table II and percentages are shown in Table III. Annual travel per vehicle on the state system was estimated for each registration class. Estimates are based on 1990 vehicle classification counts and registration data.
Average annual vehicle miles per unit on the state system for 1990 were estimated at 8,770 for passenger cars and 10,870 for trucks. However, avera&es can be misleadin~. For example, truck travel increases dramatically as the registered weight increases. This 1s indicated in Table II which shows average travel for vehicles in each registered weight group. ·
HOW LARGE IS THE SYSTEM AND HOW IS IT USED?
Total milea~e of the state highway system in 1990 was 32,285 miles. This is only 39 miles greater than m 1985. ·
This mileage represents only 27 percent of the total road and street mileage in Missouri, yet it carries 72 percent of the vehicle miles traveled. Eighty-three percent of travel for trucks registered over 60,010 pounds is on the state system with 63 percent of that travel being on the interstate system.
Total annual vehicle travel on the state system in 1985 was approximately 29.2 billion vehicle miles. Travel in 1990 was 36.0 billion, an increase of 23.3 percent.

1'3'30
VEHICLE REGISTRATIONS
Passenger Cars 2,751,678
Truck Gross BEYOND R~gistered Weight LOCAL LOCAL ----------------- ------- -------
6,0001 or less 84,532 601,864
6,001 - 12,000 4'3,'371 215,416
12,001 ~- 18,000 12,764 20,'365
18,001 - 24,000 14,'330 13,66'3
24,001 - 30,000 10,273 8,624
30,001 - 36,000 4,6'3'3 3,3'33
36,001 - 42,000 2,78'3 1,_74'3
42,001 - 48,000 5,23'3 2,363
48,001 - 54,000 7,740 3,304
54,001 - 60,~10 1, 623 341
60, 011 - 66, 000 1, 8'33 734
66,001 - 72,000 624
Over 72,000 3,640
66,001 - 73,280 --- 1, 788
73,281 - 78,000 --- 45~
Over 78,000 --- 22,478
SUBTOTAL Trucks 200,717 8'37,147

1'3'30
ESTIMATED ANNUAL VEHICLE MILES OF TRAVEL STATE SYSTEM
Local Trucks ----------------------
( 1, 000, 000)
INTERSTATE PRIMARY SUPPLEMENTARY TOTAL rruck Gr·oss ------------------- -------------------- ------~------------ ---------~---------Registered Weight RURAL URBAN RURAL URBAN RURAL URBAN RURAL URBAN TOTAL ----------------- ------- ------- ------- ------- ------- ------- ------- ------- -------6,000tl or less 76 13a 143 42 '35 77 314 257 571
6,001 - 12,000 56 102 106 31 70 57 232 1'30 422
12,001 - 1a,000 13 15 24 4 16 7 53 26 7'3
1a,001 - 24,000 15 17 2a 5 19 a 62 30 92
24,001 - 30,000 10 12 1'3 4 13 6 .42 '='~· ....... 64
30,001 -. 36,000 5 5 9 2 6 3 20 10 30
36,001 - 42,000 a 3 6 1 3 1 17 "' 22 ..J
42,001 - 4a,000 15 6 11 1 5 2 31 9 40
4a,001 - 54,000 24 '3 1n 2 a 3 50 14 64
5't, 001 - 60,010 a 3 4 - 1 - 13 3 16
60,011 - 66,000 10 4 6 1 ':i .... - 18 5 23
66,001 - 72,000 5 2 3 - 1 - 9 2 11
Over 72,000 30 13 18 2 C" 1 53 16 6'3 ..J

·J 1990
ESTIMATED ANNUAL VEHICLE MILES OF TRAVEL STATE SYSTEM
Passenger Cars and Beyond Local Trucks --------------------------------------
<1, 000, 000)
INTERSTATE PRIMARY SUPPLEMENTARY TOTAL ------------------ ------------------ ------------------ ------------------RURAL UnBAN RURAL URBAN RUnAL UflDAN RURAL URBAN TOTAL ------ ------ ------ ------ ------ ------ ------ ------ -------
lasseroger Cars 3, 211 5,834 6,060 1, 768 4,003 3,259 13,274 10,861 24,135
·ruck Gt'•Jss legistered Weight -----------------61 0008 C•r 1 ess 662 1,202 1, 24'3 364 c~ . ., '-.J 672 2, 736 2,238 4,'374
6,001 - 12,000 247 449 467 136 308 251 1,022 036 1,858
12,001 - 18,000 3'3 45 72 14 50 22 161 81 242
18,001 - 24,000 26 30 48 9 33 14 107 53 160
~4, 001 - 30, 000 34 38 62 11 43 18 139 67 206
30,001 - 36,000 16 18 29 5 20 9 65· 32 '37
36,001 - 42,000 18 7 14 ? .... 6 2 3C 11 49
~2,001 - 48,000 28 11 21 3 '3 3 58 17 75
~8,001 - 54,000 49 19 37 5 16 6 102 30 132
54,001 - 60,010 8 3 5 - 1 - 14 3 17
S01 011 - 661 000 24 11 14 1 4 1 42 13 55
56,001 - 73,280 69 30 41 3 1 1 3 121 36 157
73,281 - 78,000 19 9 11 1 3 1 33 11 44
Ovet· 78,000 967 425 569 49 157 36 1, 693 510 2,203

\
1'3'30
PERCENT OF TRAVEL ON THE STATE SYSTEM
Local Trucks ----------------------
INTERSTATE PJHMARY SUPPLEI~ENTARY Truck Gross ------------------- ------------------- -------------------Registered Weight RURAL UP-BAN RURAL UP-DAN RURAL UP-BAN ----------------- ------- ------- ------- ------- ------- -------
6,0001 or less 13.3 24.2 25.0 7.4 16.6 13.5
6,001 - 12,000 13.3 24.2 25. 1 7.3 16.6 13.5
12,001 - 18,000 16.5 1'3.0 30. 1 5. 1 20.3 8.'3
18,001 - 24,000 16.3 10.5 30.4 5.4 20. 7 a. 7
24,001 - 30,000 15.6 18.8 29. 7 6.3 20.3 '3.4
30,001 - 36,000 16. 7 16. 7 30.0 6. 7 20.0 10.0
36,001 - 42,000 36.4 13.6 27.3 4.5 13.6 4.5
42,001 - 48,000 37.5 15.0 27.5 2.5 12.5 5.0
48,001 - 54,000 37.5 15. 1 28. 1 3. 1 12.5 4. 7
54,001 - 60,010 50.0 18.8 25.0 - 6.3
60,011 - 66,000 43.5 17.4 26. 1 4.3 8. 7
66,001 - 72,000 45.5 18.2 27.3 - 9. 1
Over 72,000 43.5 18.8 26. 1 2.9 7.2 1.4
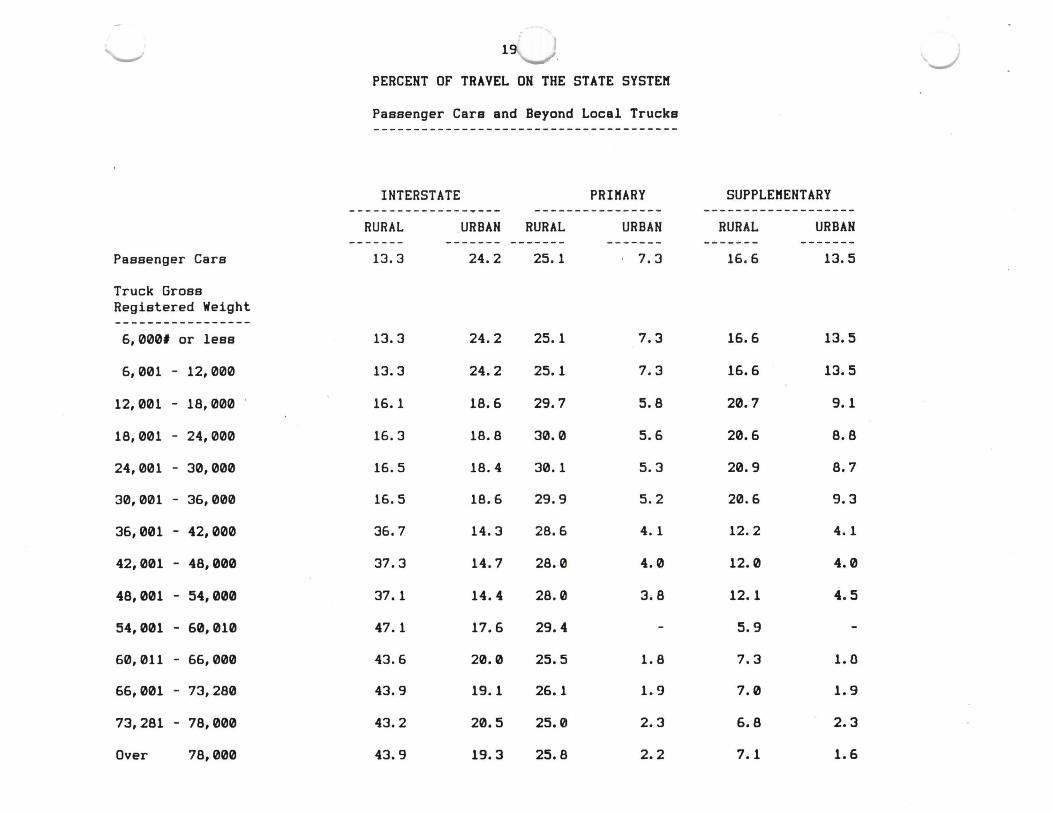
PERCENT OF TRAVEL ON THE STATE SYSTEM
Passenger Cars and Beyond Local Trucks
INTERSTATE PRIMARY SUPPLEMENTARY ----------- -- ------ ---------------- --------- -- --------
RURAL URBAN RURAL URBAN RURAL URBAN ------ - ------- --- ---- ------- ------- -------
Passenger Cars 13.3 24.2 25.1 7.3 16. 6 13.5
Truck Gross Registered Weight -----------------6,0001 or less 13.3 24.2 25.1 7. 3 16.6 13.5
6,001 - 12,000 13.3 24.2 25.1 7.3 16.6 13.5
12,001 - 18,000 16.1 18.6 29.7 5.8 20.7 9.1
18,001 - 24,000 16.3 18.8 30.0 5.6 20.6 8.8
24,001 - 30,000 16.5 18.4 30.1 5.3 20.9 8.7
30,001 - 36,000 16.5 18.6 29.9 5.2 20.6 9.3
36,001 - 42,000 36.7 14.3 28.6 4. 1 12.2 4.1
42,001 - 48,000 37.3 14.7 28.0 4.0 12.0 4.0
48,001 - 54,000 37.1 14.4 28.0 3.8 12.1 4.5
54,001 - 60,010 47.1 17.6 29.4 - 5.9
60, 011 - 66, 000 43.6 20.0 25.5 1.8 7.3 1.0
66,001 - 73,280 43.9 19.1 26.1 1.9 7.0 1.9
73,281 - 78,000 43.2 20.5 25.0 2.3 6.8 2.3
Over 78,000 43.9 19.3 25.8 2.2 7.1 1.6

·· . Only 3.6 percent of the sxstem mileage is designated as interstate, yet it carries 39.4 percent of the total vehicle rrules of travel. The primary system is 21.1 percent of the system mileage and it carries approximately 32.2 percent of the total travel. The supplementary system, which is the largest at 75.3 percent of the systems mileage, carries 31 percent of the total travel.
Percentages of travel for the different classes of vehicles were 'determined from automatic vehicle classification counts, weigh in motion and visual observations at various locations on the highway system. This data is processed to develop the travel patterns of the motoring public.
WHAT WILL IT COST?
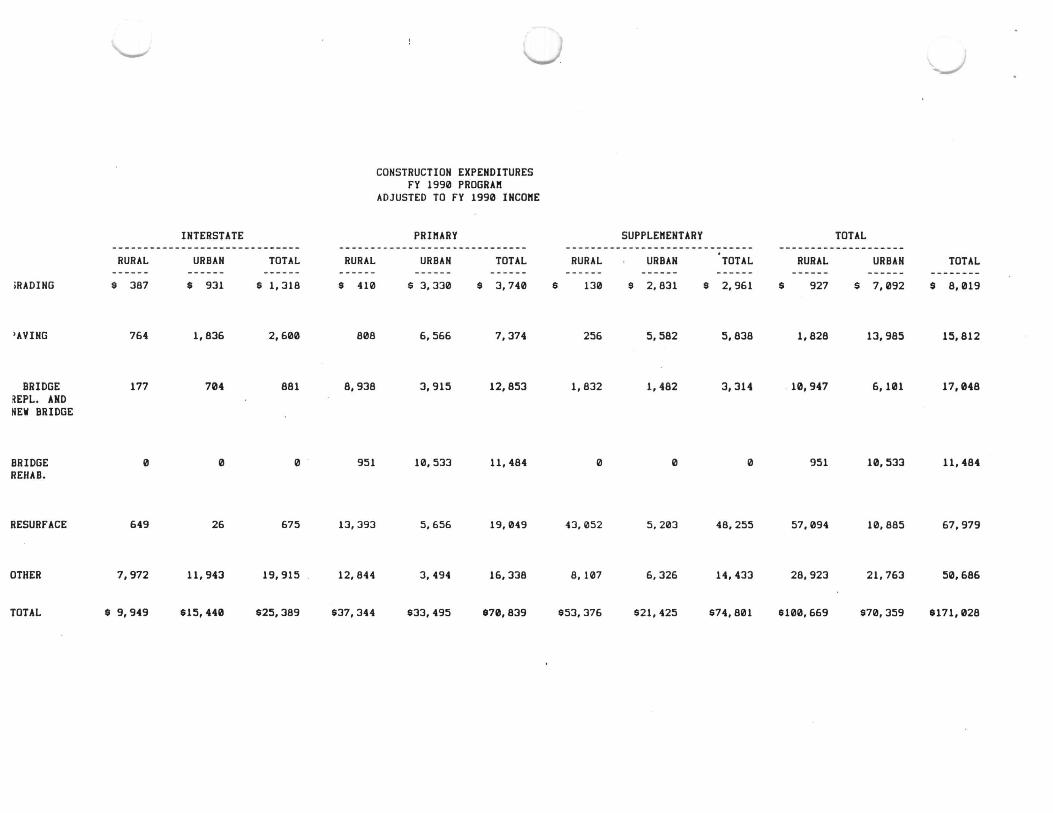
The 1990 state cost of operating the state highway system was $448 million or 78 percent of the total cost. The 29 percent of this cost allocated to the construction program mcludes the necessary match for all federal funds and the expenditure of all state funds which came to the department. Federal funds amounted to $253 million in 1990. Some of these funds are earmarked for special purposes. Over 5,450 miles of the state highway system are not on the federal md system; therefore, federal funds are not available for those miles except for a few limited areas such as the off system bridge program.
Income in excess of expenditures were assigned to construction items on a prorated basis. Maintenance of the system required 45 percent of this cost with another 13 percent going to administration.
The breakdown of construction costs by system is shown in Table IV.
Thirty-one percent of state revenue goes to other agencies for such things as law enforcement on tne state highway system, the cost of revenue collection, the cost of miscellaneous highway-related functions of other state agencies and other costs mandated by law.
These indirect costs, in millions, are distributed as follows:
Highway Patrol Department of Revenue Public Service Commission Office of Administration State Auditor Other State Agencies OASI
TOTAL
$77.2 28.5 2.4 2.0 0.5 3.0
...2...1 $122.7
iRADIHG
'AVING
BRIDGE ~EPL. AND ~EW BRIDGE
BRIDGE REHAB.
RESURFACE
OTHER
TOTAL
INTERSTATE ------------------------------
RURAL URBAN TOTAL
$ 387 $ 931 $ 1,318
764 1,836 2,600
177 704 881
0 0 0
649 26 675
7,972 11,943 19,915
$ 9,949 615,440 625,389
CONSTRUCTION EXPENDITURES FY 1990 PROGRAH
ADJUSTED TO rY 1990 INCOHE
PRIHARY ------------------------------
RURAL URBAN TOTAL
$ 410 $ 3,330 $ 3,740
808 6,566 7,374
8,938 3,915 12,853
951 10,533 11,484
13,393 5,656 19,049
12,844 3,494 16,338
$37,344 $33,495 $70,839
SUPPLEHENTARY TOTAL ------------------------------ -------------- ------
RURAL URBAN TOTAL RURAL URBAN TOTAL --------
6 130 $ 2,831 $ 2,961 $ 927 $ 7,092 $ 8,019
256 5,582 5,838 1,828 13,985 15,812
1,832 1,482 3,314 ' 10,947 6,101 17,048
0 0 0 951 10,533 11, 484
43,052 5,203 48,255 57,094 10,885 67,979
8, 107 6,326 14,433 28,923 21,763 50,686
$53,376 $21,425 674,801 $100,669 $70,359 $171,028

III
ALLOCATION OF COST RESPONSIBILITIES
WHAT IS THE PREMISE?
The premise of the study is that the user, as a direct beneficiary of the system, is responsible for SU{'POrt of the system. Responsibility is defined as the cost generated in the form_ of construction, maintenance and administrative costs attributable to users in each registration class.
WHAT ARE THE ASSUMPTIONS?
The method is related directly to certain assumptions. The assumptions are supported by design or test data which have in some instances been modified by logical compromise to accommodate differences within the registration classes.
The basic assumptions are:
1. The state system facilities benefit the user exclusively.
2. Those costs having no relation to weight or usage factors are a uniform responsibility of all vehicles.
3. Some costs are not related to weight or frequency of axle applications. The only criterion for responsibility for these costs is vehicle miles of travel.
4. Tho~e costs which are identifiable as being directly incurred to accommodate any class or classes of vehicles are considered to be the sole responsibility of that class or those classes of vehicles so identified.
5. As the weight which a vehicle applies to the roadway surface increases, the pavement or bridge structure required to support the vehicle must be stronger and is therefore more expensive to construct.
6. Those vehicles which apply greater or more frequent axle loads to the roadway surface cause deterior_ation of the pavement or bridge structure at a greater rate than do vehicles which apply smaller or less frequent axle loads to. the roadway surface. ·
The total cost of operating the state highway system amounts to $824 million annually. This includes federal-aid funding of $253 million available for use on the state system. Since this study is limited to state fees and taxes (payments), only $571 million is allocated to the various vehicle classes.

IV
COST RESPONSIBILITIES OF TilE USER
WHAT IS THE STUDY PURPOSE?
This study seeks to determine that share of the cost which is the proper responsibility of vehicles in each of the registration classes.
The 1990 state cost to be borne by users of the state system was $571 million annually. This is financed from licenses and taxes assessed on the operation of an estimated 3.9 million vehicles. While this represents an average cost per vehicle of $147, an average figure obviously does not properly reflect the relative cost responsibility of the various vehicle classes.
The method of analysis considers the makeup of the costs and how vehicles in each registration class contribute to that cost through usage and relative impact on the highway structure.
For example, certain basic costs of a bridge or a pavement are appropriately shared by all classes of vehicles. The costs required to proVIde additional strength for heavier vehicles are incremented in a manner compatible with the effect of the various registration classes and are shared by those classes which require the added strength until the cost for the final increment is assigned only to the heaviest vehicles.
Other costs such as traffic signals, lane striping or deicing treatment of pavements and bridges are shared by all vehicles solely on the basis of usage, since these costs are not dependent on vehi<;:le size or weight.
Still other costs are related to the frequency and degree of load application. A typical example is resurfacing to restore a smooth riding surface. These costs are allocated taking into consideration the axle loadings applied by vehicles in each of the registration classes for that portion of resurfacing in excess of a practical minimum.
Some administrative costs are unaffected by vehicle size, weight or usage and are therefore allocated solely on the basis of numbers in each registration class. A typical case is the cost of license issuance.
In the investigation of the effects of each class of vehicle, it is necessary to consider axle configuration. This is because a load supported on individual axles with a relatively short wheelbase is just as damaging as a much heavier load distributed over tandem axles with a long wheelbase. This is illustrated in F~gure 1.
From these elements, a composite responsibility is developed for each class of vehicle registered in Missouri.
Table V shows the responsibility assigned to each registration class on a per vehicle basis.

Passenger Cars
1'390
ESTIMATED VEHICLE RESPONSIBILITY STATE SYSTEM
111
Truck Gross Registered Weight Local ----------------------------- -------6,0001 or less 87
6,001 - 12,000 112
12,001 - 18,000 146
18,001 - 24,000 240
24,001 - 30,000 320
30,001 - 36,000 208 '
36,001 - 42,000 281
42,001 - 48,000 26'3
48,001 - 54,000 318
54,001 - 60,010 260
60,011 - 66,000 527
66,001 - 72,000 66'3
Over 72,000 798
66,001 - 73,280 ---73,281 - 78,000 ---Over 78,000 ---
Beyond Local -------
106
115
276
454
1, 226
'315
946
1, 116
1, 537
1, 320
2,917
3,244
3,667
4,033

TRAVEL BY REGISTRATION CLASS
Average vehicle miles traveled and re~istration fees vary between local and beyond local and for each registration class. Thus dtfferences exist in both cost responsibility and revenue generation.
Various data sources are considered in developing the estimated miles of travel per vehicle. Present day methods of data sampling and projection available to the transportation analyst help to develop information with reasonably high statistical confidence.
Comparison of vehicle-miles of travel produces no particularly startling results. Trucks in the largest weight groups travel the farthest. This is to be expected because the transcontinental freight haulers are included in these groups. If we examine data for vehicles registered above 60,010 pounds, we find that trucks registered in this group represent less than three percent of the total truck registration, yet they account for 21.8 percent of the annual truck vehicle-miles of travel. In the broader picture, these trucks compose less than one percent of total vehicle registrations but travel over 6.9 percent of the total vehicle-miles per year.

,
HOW MUCH REVENUE?
v
REVENUE
Total state revenues for 1990 were $571 million. This was supplemented by $253 million of federal funds.
WHAT ARE REVENUE SOURCES?
State revenues are largely derived from license fees and fuel taxes. A significant amount also comes from miscellaneous fees, such as a portion of the sales tax on motor vehicles.
REGISTRATION FEES
Registration (or licensing) fees for _Passenger cars are established by "taxable horsepower". Trucks are registered in 16 weight groups or "classifications". These groups are further split between local and beyond local. Vehicles registered for "local" use are limited to travel within 25 miles of the municipality of registry. Farm vehicles hauling the owner's property are excepted from this restriction. There are no travel restrictions on vehicles possessmg "beyond local" registration.
Revenue from registration fees paid by the 3.9 million vehicles amounted to $173.9 million in 1990. Fees from 344,600 trailers generated an additional $2.25 million.
MOTOR FUEL TAX
The state collects eleven cents per gallon for motor fuel sold for highway use in Missouri. By constitutional provisions, 15 percent of the collected tax is distributed to cities with over 100 population and 10 percent to counties. The remaining 75 percent is allocated to the operation of the state highway system.
Fuel consumption for highway use amounted to 3.25 billion gallons which produced $266 million for the state highway system in 1990. .
Because of increasingly fuel-efficient motor vehicles, trends in fuel consumption have not paralleled the trends in vehicle miles traveled as they did a few years ago. Between 1985 and 1990 state system travel increased at an annual rate of 4.75 percent while fuel consumption increased at a 2.0 percent rate.
MISCELLANEOUS REVENUE
This is a catchall label for fees which generate state highway revenues but are not directly attributable to specific vehicles as are registration fees, nor to all vehicles as are fuel taxes. Nevertheless, they are user fees which generate a significant level of funding.
)
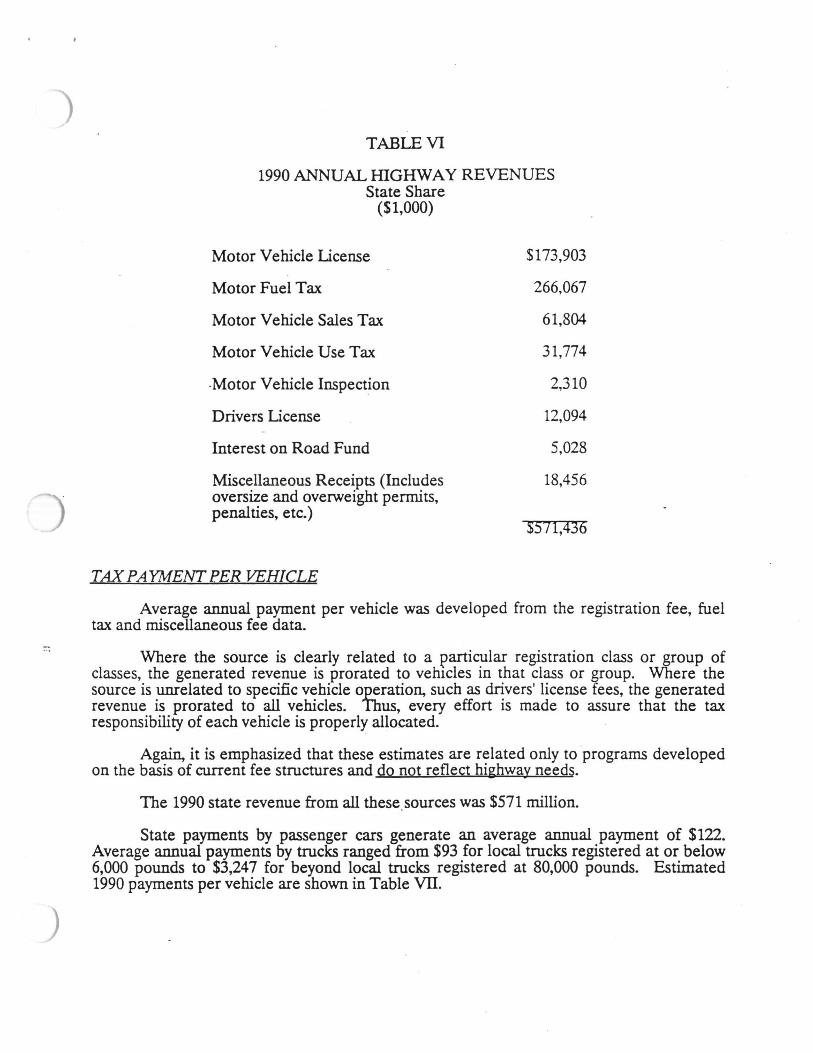
TABLE VI
1990 ANNUAL IDGHWA Y REVENUES State Share
($1,000)
Motor Vehicle License $173,903
Motor Fuel Tax 266,067
Motor Vehicle Sales Tax 61,804
Motor Vehicle Use Tax 31,774
-Motor Vehicle Inspection 2,310
Drivers License 12,094
Interest on Road Fund 5,028
Miscellaneous Receipts (Includes 18,456 oversize and overweight permits, penalties, etc.)
$571,436
TAX PAYMENT PER VEHICLE
Average annual payment per vehicle was developed from the registration fee, fuel tax and miscellaneous fee data.
Where the source is clearly related to a {'articular registration class or group of classes, the generated revenue is prorated to vehicles in that class or group. Where the source is unrelated to specific vehicle operatio~ such as drivers' license fees, the generated revenue is prorated to all vehicles. Thus, every effort is made to assure that the tax responsibility of each vehicle is properly allocated.
Again, it is emphasized that these estimates are related only to programs developed on the basis of current fee structures and do not reflect highway needs.
The 1990 state revenue from all these.sources was $571 million.
State payments by passenger cars generate an average annual payment of $122. Average annual payments by trucks ranged from $93 for local trucks registered at or below 6,000 pounds to $3,247 for beyond local trucks registered at 80,000 pounds. Estimated 1990 payments per vehicle are shown in Table VII.

1990
ESTIMATED VEHICLE PAYMENTS STATE SYSTEM
Passenger Cars $ 122
Truck Gross Registered Weight Local ----------------------------- -------
6,0001 or less $ 93
6,001 - 12,000 105
12,001 - 18,000 143
18,001 - 24~000 138
24,001 - 30,000 162
30,001 - ·36, 000 185
36,001 - 42,000 258
42,001 - 48,000 287
48,001 - 54,000 339
54,001 - 60,010 410
60,011 - 66,000 535
66,001 - 72,000 602
Over 72,000 735
66,001 - 73,280 ---73,281 - 78,000 ---Over 78,000 ---
Beyortd Local
-------$ 10'3
1'=>-._..)
237
251
470
599
853
1,063
1,326
1,713
2,336
2,768
3,062
3,247

VI
COMPARISON OF USER RESPONSIBILI1Y AND TAX PAYMENTS
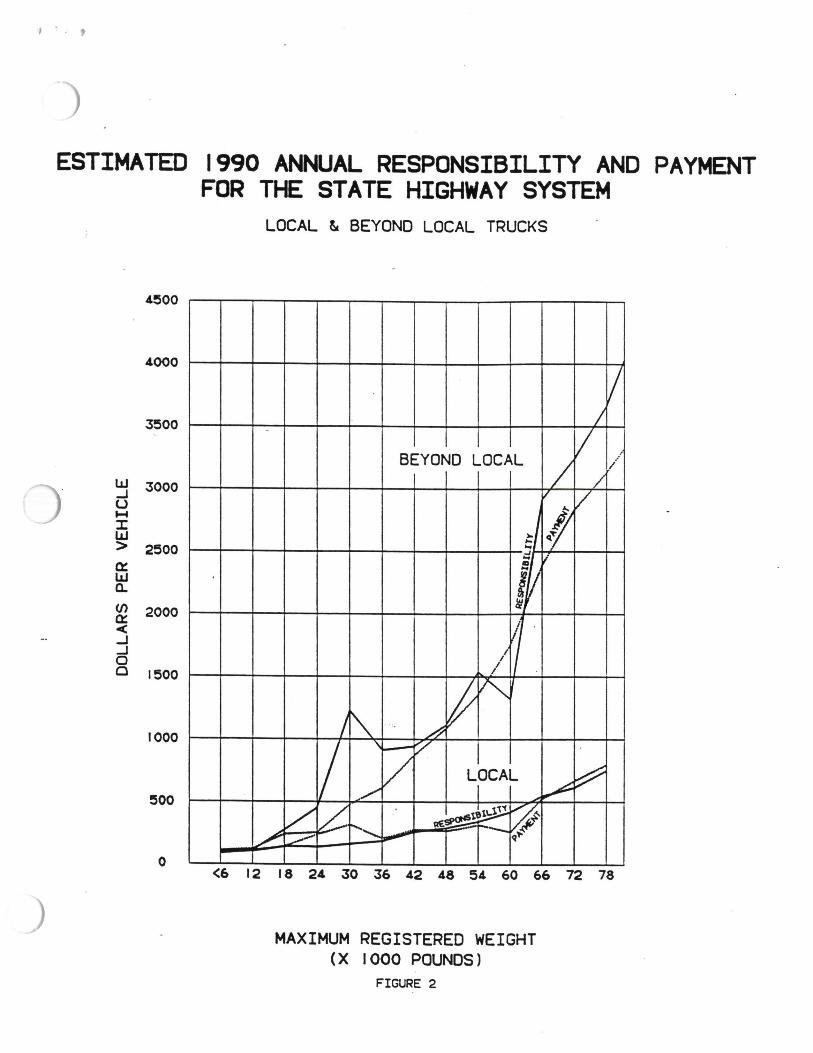
The key question is: Is each class of vehicle paying its fair share? This is why this study compares the cost responsibility of vehicles in each weight group with the revenues generated (payments). This comparison {'rovides an indication of discrepancies and their magnitude between what the average vehicle in each weight group pays for the use of the state highway system versus the amount of the system "consumed" by the same vehicles.
Table VIII shows comparative values for payment and responsibility for each registration class. Figure 2 graphically depicts the comparisons for all classes of trucks.
The study indicated that passenger car payments are $30.2 million more than their responsi_bi?ty ($11 per vehi~le) while .b~~ond local trucks ~egistered ove~ 66,010 pounds pay $18.8 million less than therr responsibility ($760 per vehicle). Some hghter beyond local trucks and most heavier local trucks proVIde revenues in excess of their responsibility. The number of vehicles that overpay is large compared to the number that underpay. However, as s~own in Table VITI, vehicles generally underpay at a more significant rate than those which overpay.
The results of this or other studies of a similar nature definitely establish trends which are not particularly sensitive to changes in some of the elements. On the other hand, specific values may be significantly altered if circumstances force a change in the elements to be funded. Thus, it is that we can say with confidence that some classes of vehicles pay less than their fair share of the cost of operating the highway system while other classes pay more than their fair share. The dollar value of such difference would however vary somewhat if the distribution of costs between the elements making up the total were significantly different. In this study, about three-fourths of the projected costs were allocated on some basis other than weight.

'TI H
@ ::0 JTI
4,5
...J < 3,0 CJ) w
I • !5
EQUIVALENT I8 1 THOUSANJ POUND SINGLE AXLE LOAD (ESAL)
18
THE INDICATED MAX LOAD IS THE MAXIMUM LEGAL GROSS LOAD FOR THE TRUCK CONFIGURATIONS
Tl£ GRAPH SH:lWS Tl£ G£t£RAL TRDO. ll£RE IS SCI£ SLIGHT VARIATION BETWEEN FLEXIBLE AND RIGID PAVEMENT AND Tt£ TRUCK CON'"IIll.AATION IN SCI£ GROU>ING.
J AlCLE • TRACTCII at£ TRAIL.£11 1251)
24
~ AlCLE 4 TIIIUI Tli\.DC
INEJI I TON 1251
~
30 36 42 48 54 60 66
I I
I I
I I
I I
72
GROSS WEIGHT IN THOUSAND POUNDS
78 80
II AlCLE 1'M.DI NC TRAIL.£11 IJT21
b; HAX b IT 'CoHo~
II AlCLE·TIIACTCII at£ TliAIL.£11 13521
I 101( II MAX .. I ~ ~
' AlCLE • 2 TRAIL.£11 1252-21
~..--0-.-01(--0-, ::X: 0
II AlCLE • 2 TRAIL.£11 1251·21
~d 7 AlCLE - 2 TliAlL.£11
(JS2·21
•

Passenger Cars
Truck Gross Registered Weight
60001 or less 6,001 - 12,000
12,001 - 18,000 18,001 - 24,000 24,001 - 30,000 30,001 - 36,000 36,001 - 42,000 42,001 - 48,000 48,001 - 54,000 54,001 - 60,010 60,011 - 66,000 66,001 - 72,000 Over 72,000 66,001 - 73,280 73,281 - 78,000 Over 78,000
1990
COMPARISON OF ESTIMATED PAYMENT AND RESPONSIBILITY
PAYMENT PAYMENT STATE VS. STATE VS.
STATE RESPONSI- RESPONSI- STATE RESPON~I- RESPONSI-PAYMENT BILITY BILITY PAYMENT BILITY DILITY
$ 122 $ 111 $ 11
L 0 C A L B E Y 0 N D L 0 C A L ------------------------------------ ------------------------------------
$ 93 $ 87 $ G $ 109 ' $ 106 0 105 112 -7 123 115 8 143 146 -3 237 2'/6 -39 138 240 -102 2~1 454 -203 162 320 -158 4'/0 1,226 -756 185 208 -23 599 915 -316 258 281 -23 853 946 -93 287 269 18 1,063 1, 116 -53 339 318 21 1,326 1,537 -211 410 260 150 1, 713 1,320 393 535 527 a 2,336 2,917 -581 602 669 -67 --- --- ---735 798 -63 --- --- ---
2,768 3,244 -476 3,062 3,667 -605 3,247 4,033 -786
I ' t
ESTIMATED 1990 ANNUAL RESPONSIBILITY AND PAYMENT FOR THE STATE HIGHWAY SYSTEM
4~00
4000
3~00
w 3000 ~ u ..... J: w > 2~00
0:: w a. (/) 2000 0:: < ~ ~ 0 Cl 1~00
1000
~00
0
LOCAL ~ BEYOND LOCAL TRUCKS
v _j_
- v BEYOND LOCAL ,.
L / '
L
II v
~I 2' ~~
II
:iJ i .
I
I I
/ if
v r"'-I r\ A
I ' v I ~ v ~ LOCAL v _/ I ;
v ? ~~~~ ........ .4 r--..... ~ :::: -/#
~ ~ - 1 q~
<6 12 18 24 30 36 42 48 ~4 60 66 72 78
MAXIMUM REGISTERED WEIGHT (X 1000 POUNDS)
FIGURE 2