1983 evaluative voting behavior_an experimental examination
TRANSCRIPT
7/28/2019 1983 Evaluative Voting Behavior_An Experimental Examination
http://slidepdf.com/reader/full/1983-evaluative-voting-behavioran-experimental-examination 1/11
University of Utah
Western Political Science Association
Evaluative Voting Behavior: An Experimental ExaminationAuthor(s): Bart R. SalisburyReviewed work(s):Source: The Western Political Quarterly, Vol. 36, No. 1 (Mar., 1983), pp. 88-97Published by: University of Utah on behalf of the Western Political Science Association
Stable URL: http://www.jstor.org/stable/447846 .
Accessed: 13/03/2013 20:57
Your use of the JSTOR archive indicates your acceptance of the Terms & Conditions of Use, available at .
http://www.jstor.org/page/info/about/policies/terms.jsp
.JSTOR is a not-for-profit service that helps scholars, researchers, and students discover, use, and build upon a wide range of
content in a trusted digital archive. We use information technology and tools to increase productivity and facilitate new forms
of scholarship. For more information about JSTOR, please contact [email protected].
.
University of Utah and Western Political Science Association are collaborating with JSTOR to digitize,
preserve and extend access to The Western Political Quarterly.
http://www.jstor.org
This content downloaded on Wed, 13 Mar 2013 20:57:05 PMAll use subject to JSTOR Terms and Conditions
7/28/2019 1983 Evaluative Voting Behavior_An Experimental Examination
http://slidepdf.com/reader/full/1983-evaluative-voting-behavioran-experimental-examination 2/11
EVALUATIVE VOTING BEHAVIOR:
AN EXPERIMENTAL EXAMINATIONBART R. SALISBURY
University f Washington
JOHN ANDERSON'S third-party andidacy for the presidency n1980 has re-kindled nterest n thebehavior oftheAmericanvoterwhenfaced withmore thantwocandidates.When more thantwocandidates are present, oters re forcedfrom heirnormalpattern
ofstraight reference oting o a morecomplexdecision-making rocess.This
processemploysboth thevoters'
preferencerankingof thecandi-
dates and thevoters'perceptionof each candidate's chance of winning.Furthermore,nmulti-candidate aces votersmust ontend notonlywithwhotheywould ike to see elected,but also withwhotheywouldnot iketosee elected. With three or more candidates present the voter cannotsimply ote forhis mostpreferred andidate- particularlyfthis ctioninanyway ncreases the ikelihoodof his eastpreferred andidatebeingelected.
The type of behavior described here is basicallythe same as thathypothesizedbyAnthonyDowns for electoral behavior in a multi-party
systemDowns, 1957: 47-48). This formof rationalbehavior seems un-common in American electionsbecause of a two-party raditionthatpervadestheelectoralprocessand because researchers nthis rea tend toconcentrate on general electionswhere two candidates are the norm,ignoringprimary lectionswhere multi-candidate aces are frequentlyseen. American electoral analysis,as a result, s less likelyto producesupporting videncefor n evaluativevotingbehaviorhypothesis.Whenonly two candidates are present, simple preference structuresprovesufficient ormakinga decision. When more than twoalternatives represent,the votermust carefully valuate informationpresent in the
electoral environment nd incorporatethis synthesis nto his decisionconcerningwhichcandidate to support.
The intent fthispaper is toexaminethestrategy oters mploywhenfaced with hree lternatives n an election.The hypothesis o be tested swhether r notvotersuse an evaluativeapproach whenthere are morethan two candidates. This involves the weighting of a normallypreference-basedvote witha subjectiveassessment of the voter's mostpreferred andidate'schanceofwinning. fthis hance ofwinningdropsfar enough, and the voter's first nd second preferencesare closely
ranked, hevoterwillcontemplate witching is voteto thesecondprefer-ence. The presence of more than two candidates allows the voterthisoption.
NOTE: am indebted toDonald McCrone forhisgenerousassistancewith hisproject nd toRuthRoss forherexcellenteditorialreview.
This content downloaded on Wed, 13 Mar 2013 20:57:05 PMAll use subject to JSTOR Terms and Conditions

7/28/2019 1983 Evaluative Voting Behavior_An Experimental Examination
http://slidepdf.com/reader/full/1983-evaluative-voting-behavioran-experimental-examination 3/11
EvaluativeVoting ehavior 89
FRAMEWORK FOR ANALYSIS
The hypothesispresented will be investigated using a computer-assisted electionsimulation.The twomajor information lementsto beincorporated ntothe simulation re the candidates' issue positions ndpublicopinionpolls.' This analysiswill ookat theconditionsunderwhicha voter will or will not support his first referenceto see if evaluativevotingbehavior does occur.
The electionsimulationwillpresentthree simplified lectionsitua-tions.These situationswill be laid out over time as theywould be in anactualelection. n the firstituation, ollswill ndicate hat he voter'sfirstpreferencewillbe ina close race withhis second preference.Pollsin thesecond situationwill howthevoter's econdpreferencewell ahead ofthe
other wo andidates.The third ituationwillpresent closerace betweenthe voter'ssecond and thirdpreferenceswhile hisfirst reference osesground.
The threesituations ffer he voterdifferingnformational ontexts;if the voter exercises evaluative behavior each context will resultin apredictableoutcome. In the first ituation, he voter'smost preferredcandidate is viable and in a close race withthe second preference.Theproperdecisionunder these conditionswould be thecontinuedsupportofthevoter'smostpreferred andidate. In thesecondsituation hevoter'sbehavior s difficulto pinpointexactly.With his first reference sure
loserand thesecondpreference surewinner, he voterhas no reasontocast a ballot. It mightbe thatsome will vote regardless,and thatsomemight venvotefor heir econdpreference bandwagoning). n thethirdsituation he voter's irst referencehas no realchance ofwinning nd thesecond preference s in need of support. In this situationthe properdecision would be for the voter to abandon his firstpreferenceandsupporthis second preference.
METHODOLOGY
SubjectsThe purposivesamples drawnfor thisstudyconsistof 183 students
from ntroductory-levelourses in politicalscience at the University fWashington,Seattle. The first ample (65 students)was taken WinterQuarter, 1981, and thesecond sample (118 students)was drawnWinterQuarter, 1982. Statistical omparisons of the two groups showed nodifferences n themajor variables of the study o the twogroups werecombined for the analysis.The population from whichthese samples
1As will be seen later in thispaper,
issuepositions
will serve as the basis forpreferenceranking he three andidates and thepollswill erve s information n the status feach
candidate at specifiedpointsduringthe election simulation.Choosing these informa-tionelements snota statement ftheirmportance na regularelectionenvironment;rather hat n the imited nformationnvironment fthe election imulation heywillprovidesufficientnformation o allow subjectsto differentiatehecandidates and toevaluate theirchances ofwinning.
This content downloaded on Wed, 13 Mar 2013 20:57:05 PMAll use subject to JSTOR Terms and Conditions

7/28/2019 1983 Evaluative Voting Behavior_An Experimental Examination
http://slidepdf.com/reader/full/1983-evaluative-voting-behavioran-experimental-examination 4/11
90 WesternoliticalQuarterly
were drawn college students,18-24yearsofage) has a 72 percentvoterturnoutrate (Wolfinger nd Rosenstone,1980: 47).
Procedures
Each subjectwas givena handout describingthree candidates com-petingforan unspecified ffice. he candidates are describedaccordingtotheir ositions n five ssues.2Usingthecandidates' ssue statementshesubjectswere instructed o preferencerankthecandidateson a 7-pointscale (1 - least preferred o 7 - mostpreferred).
The computer-assistedlection imulation onsists fthepresentationof five eparate opinion polls takenduringa hypothetical lection cam-
paign.3These pollsreflected he actual structure f a publicopinionpoll,containingnformation bout candidate standings, ndecideds,and pos-siblepoll measurement rror. After ach poll subjectswere asked threequestions:
1. Ifthe lectionwereheldnow,which andidatewouldyouvotefor?
2. In light f the bove nformationouldyou go out andvote?3. Whatdo youfeelare yourmostpreferredandidates'shancesofwinning?4
Subjectswererandomly ssignedtoone of threegroupsat the timeof
the simulation.The three groups consistof a controlgroup and twoexperimentalgroups. The opinion polls for thecontrolgroup show thesubject'sfirst reference n a close race withhissecond preferencewhilehis thirdpreference oses ground. In the first xperimentalgroup thepollsshowthesubject's econd preference eadingthe field fcandidateswhile his first nd thirdpreferences ose ground. The situationforthesecond experimentalgroup is a close race, like that presented to thecontrolgroup,exceptthatthesubject's econd and thirdpreferences rebattling tout whilehis first referencefades.
Subjectswere notallowedto communicatewith ach otherduringthe
simulation.The simulation dministered s extremely imple in nature, acking
some of the more prevalentdecision-making ues of an actual election(e.g., party dentification, ersonal appearances, speeches, etc.). It is,however, ufficientlyomplex to involvethe subjectsand allow them todemonstrate valuativevotingbehaviorif t exists.
2The issues used forcandidate descriptions re welfare,housing, nflation, nergy, ndconsumerprotection.
3The subjects re toldthe first oll isconductedat thebeginning fthe electioncampaign,the fifth oll ust beforethe election tself, nd the remainingthreepolls are evenly
spaced between.4Subjects reaskedtoassess their irst reference's hanceofwinning ccording othe scale:
0, no chance at all; 1 to 49, chance is less than the othercandidates'; 50, chance is thesame as the other andidates'; 51 to99,chance is better han theother andidates';and100, surewinner.
This content downloaded on Wed, 13 Mar 2013 20:57:05 PMAll use subject to JSTOR Terms and Conditions

7/28/2019 1983 Evaluative Voting Behavior_An Experimental Examination
http://slidepdf.com/reader/full/1983-evaluative-voting-behavioran-experimental-examination 5/11
Evaluative VotingBehavior 91
FINDINGS
An hypothesis f evaluativevotingbehaviorrequiresthatvoters ccu-
ratelynterpretnformation vailable to them n an election. n thesimu-lation this nformation omes in the form fopinion polls.To determinewhether ubjectscan make this nterpretation hey re asked to indicate,on a scale of 0 to 100,whattheyfelttheirfirst reference's hances ofwinningthe election are. The mean subjectivechance (MSC) foreachgroup,across the fivepoll sessions, s shown in Figure 1,along withthepoll standingof the subjects'first reference.For each group the MSCvaluecloselyfollows hepattern etbythe first reference's ollstanding.5The controlgroupevaluates theirfirst reference's hances after hefirstsession t 59.3,whichrisesto64.5 after essionthree, nd finallyettles t
61.3 after hefinal ession.Experimentalgroupsone and twobothshowconsistent eclines nMSC: groupone's evaluationdropping22.4 pointsfrombeginning o end and grouptwo'sfalling 0.9 points.An indicationofthesensitivityfthesubjects' valuationof a candidate's chances can be
FIGURE 1SUBJECT RERCTION TO POLL INFORMRTION
100- \ 100-
80-
N,-
80-
60-0--
40-
20
_\ -\
40-N\ \
- N - \
20 I0 1 2 3 4 5 01 2 3 4 5
EXPERIMENTAL EXPERIMENTRLGROUP ONE GROUPTWO
PERCENTVOTE. 1ST PREFERENCE--- ERN SUBJECTIVE CHRNCE-------- POLL STRNDING. 1ST PREFERENCE
5After hefirst oll session,where the standingsforthecandidates are the same foreachsubject, he MSC values are: controlgroup,59.3 points; experimentalgroupone, 55.2points; and experimentalgroup two, 57.9 points.There is no statistical ifferencebetweenthethree numbers.
100-
80-
PERCE 60-NTR
E
40-
20 i I I I0123451 2 3 4 5
CONTROLGROUP
-
This content downloaded on Wed, 13 Mar 2013 20:57:05 PMAll use subject to JSTOR Terms and Conditions

7/28/2019 1983 Evaluative Voting Behavior_An Experimental Examination
http://slidepdf.com/reader/full/1983-evaluative-voting-behavioran-experimental-examination 6/11
92 Western oliticalQuarterly
seen in thecontrolgroup afterthe fourthpoll session. At thispointthesubject'sfirst referencehas dropped twopercentagepointsfrom the
previouspoll, nto tiewith he secondpreference. his dropof2 percentfromthe previous poll session resulted n a 7.2 point drop in MSC.How the subjectstreattheirfirst reference s thefirstndicationof
evaluativevotingbehavior.Figure 1 showsthe level of support giventothe subjects'first referenceforeach of the threegroups. The controlgroup supports ts first reference100 percent,with singleexceptionafter hefourth ession also probablydue to thefirst reference's rop inthepollsat thatpoint).The experimentalgroupsbothshowdecreases infirst reference upportover time. n experimentalgroup one this up-portdrops41 percentagepoints; nexperimental rouptwo t falls lmost
40 percentagepoints.Evaluativebehavior can not be shownsimply hroughthe oss of firstpreference upport,as in experimentalgroups one and two, t must becoupled withan increase in second preference upport. Figure 2 showsthe support subjects give to both their first nd second preferences.Without xception, decrease in first reference upport s mirrored nan increase n second preference upport,consistentwith hehypothesisbeing tested.
There is one furtherrequirementfor the hypothesisof evaluativebehaviorto be borne out- that hevotermake hissupportfelt ycasting
100-
80-
PER 60--CENTR 40-GE
20 -
0 I r_0 1 2 3CONTROLGR
FIGURE 2VOTE TRRNSFER TO SECOND PREFERENCE
-Io00- \ 100-
80-
60-
40--
20-
80-
60-
40-
20-
II
r II I
O
4 5 0 1 2 3 4 5 0 1tOUP EXPERIMENTRL EXPI
GROUP ONE GR
PERCENT VOTE. 1ST PREFERENCE-- PERCENT VOTE. 2ND PREFERENCE
/
//
//I I I .
/
I I I 12 3 4 5
ERIMENTALtOUP TWO
-
This content downloaded on Wed, 13 Mar 2013 20:57:05 PMAll use subject to JSTOR Terms and Conditions
7/28/2019 1983 Evaluative Voting Behavior_An Experimental Examination
http://slidepdf.com/reader/full/1983-evaluative-voting-behavioran-experimental-examination 7/11
EvaluativeVoting ehavior 93
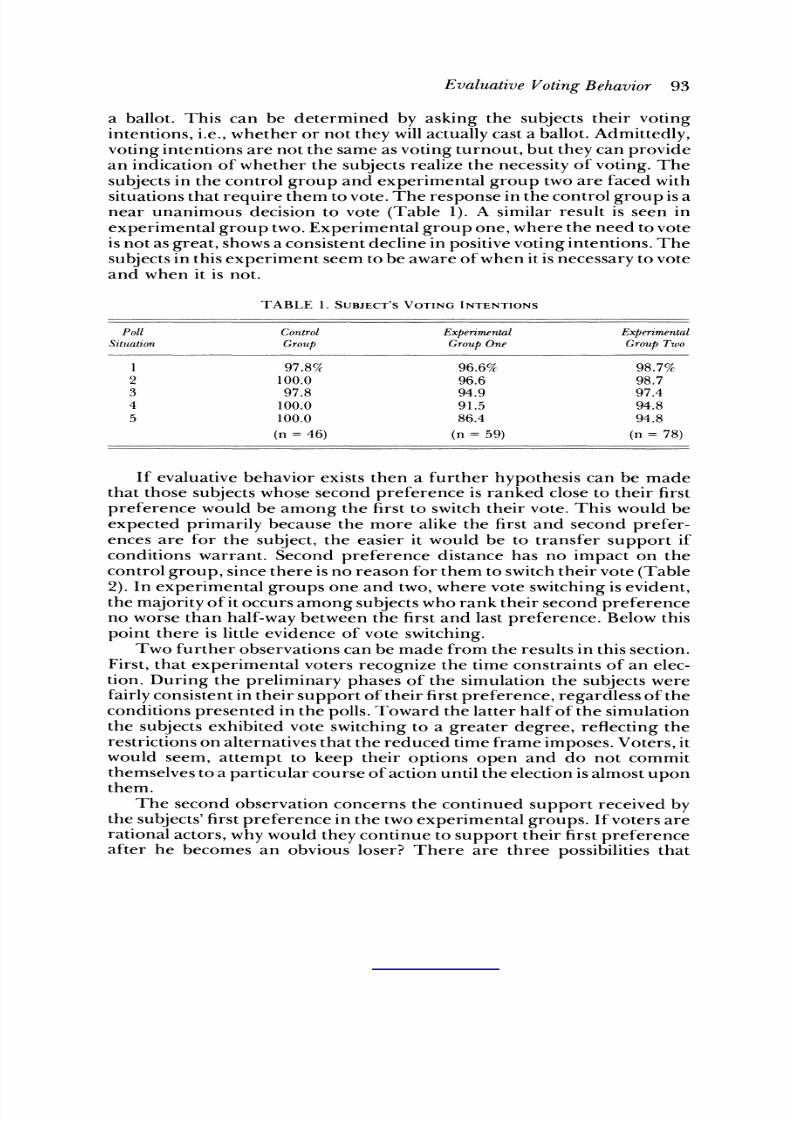
a ballot. This can be determined by asking the subjects theirvotingintentions,.e.,whether r nottheywill ctually asta ballot.Admittedly,
votingntentions re not the same as voting urnout, utthey an providean indicationof whether hesubjectsrealizethenecessity fvoting.Thesubjects n thecontrolgroup and experimentalgroup twoare facedwithsituations hatrequirethem o vote.The response n thecontrolgroup sanear unanimous decision to vote (Table 1). A similarresult s seen inexperimental rouptwo.Experimentalgroupone,wherethe need tovoteis notas great, hows consistent ecline npositive otingntentions. hesubjects n this xperiment eemto be awareofwhen t snecessary ovoteand when it is not.
TABLE 1. SUBJECT'S VOTING INTENTIONS
Poll Control Experimental ExperimentalSituation Group GroupOne GroupTwo
1 97.8% 96.6% 98.7%2 100.0 96.6 98.73 97.8 94.9 97.44 100.0 91.5 94.85 100.0 86.4 94.8
(n = 46) (n = 59) (n = 78)
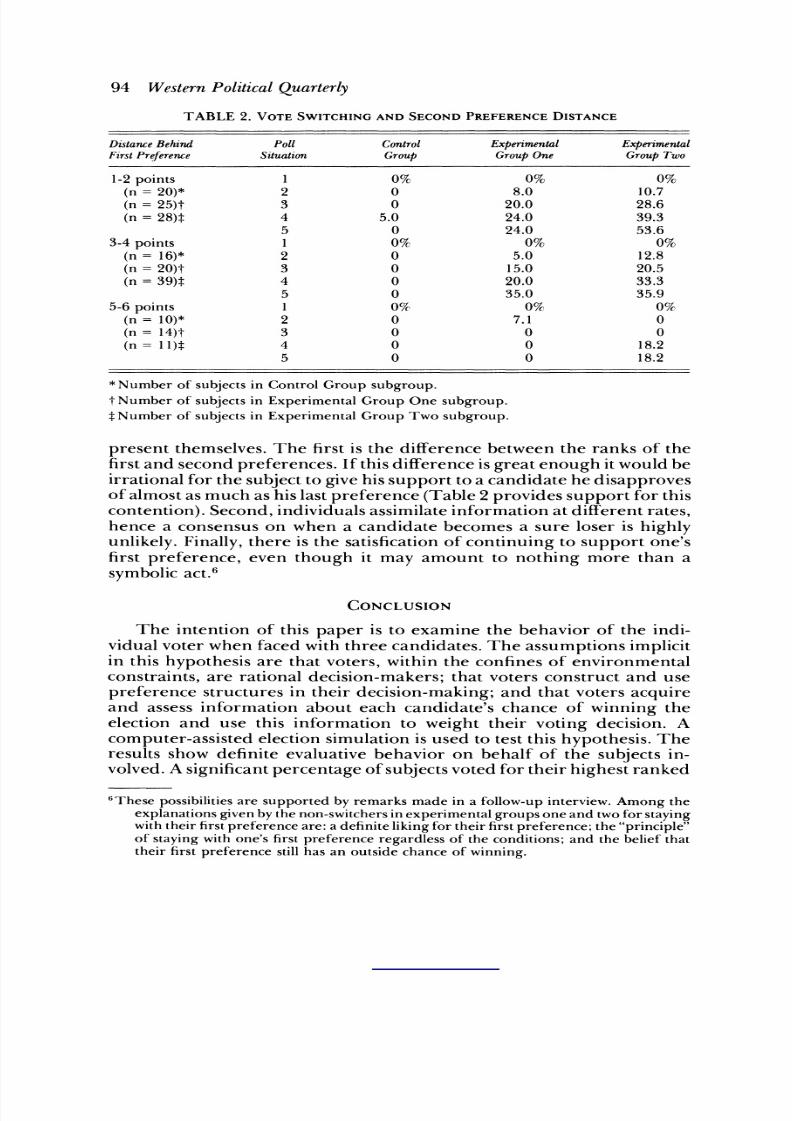
If evaluative behaviorexiststhen a furtherhypothesis an be madethatthosesubjectswhose second preference s ranked close to theirfirstpreferencewould be among the first o switch heirvote. This would beexpected primarily ecause the more alike the first nd second prefer-ences are for the subject,the easier it would be to transfer upport ifconditionswarrant. Second preferencedistance has no impact on thecontrolgroup,sincethere s no reason for hem o switch heir ote Table2). In experimentalgroupsone and two,where voteswitchingsevident,themajorityf toccursamong subjectswhoranktheir econdpreference
no worse thanhalf-way etween the first nd lastpreference.Below thispointthere s little vidence ofvote switching.Two further bservations an be made from heresults nthis ection.
First, hatexperimentalvotersrecognizethe timeconstraints f an elec-tion.During the preliminary hases of the simulation he subjectswerefairlyonsistent n their upportoftheir irst reference, egardless f theconditionspresented nthepolls.Toward the atterhalfofthe simulationthe subjectsexhibited vote switching o a greaterdegree, reflectingherestrictionsn alternatives hat hereduced timeframe mposes.Voters, twould seem, attemptto keep theiroptions open and do not commit
themselves o a particular ourse ofactionuntil heelection s almostuponthem.The second observation oncerns thecontinuedsupportreceivedby
thesubjects'first referencenthetwoexperimental roups. Ifvoters rerational ctors,whywouldthey ontinue tosupporttheirfirst referenceafterhe becomes an obvious loser? There are three possibilities hat
This content downloaded on Wed, 13 Mar 2013 20:57:05 PMAll use subject to JSTOR Terms and Conditions
7/28/2019 1983 Evaluative Voting Behavior_An Experimental Examination
http://slidepdf.com/reader/full/1983-evaluative-voting-behavioran-experimental-examination 8/11
94 Western oliticalQuarterly
TABLE 2. VOTE SWITCHING AND SECOND PREFERENCE DISTANCE
DistanceBehind Poll Control Experimental Experimental
First reference Situation Group GroupOne GroupTwo
1-2points 1 0% 0% 0%(n = 20)* 2 0 8.0 10.7(n = 25)t 3 0 20.0 28.6(n = 28)t 4 5.0 24.0 39.3
5 0 24.0 53.63-4 points 1 0% 0% 0%
(n= 16)* 2 0 5.0 12.8(n = 20)t 3 0 15.0 20.5(n = 39)t 4 0 20.0 33.3
5 0 35.0 35.9
5-6 points 1 0% 0% 0%(n 10)* 2 0 7.1 0(n= 14)t 3 0 0 0(n = 11)t 4 0 0 18.2
5 0 0 18.2
*Number of subjects n ControlGroup subgroup.tNumber of subjects n Experimental Group One subgroup.tNumber of subjects n Experimental Group Two subgroup.
presentthemselves.The first s the difference etweenthe ranks of the
first nd secondpreferences. fthisdifferencesgreatenoughitwould beirrational orthesubject ogivehissupportto a candidatehedisapprovesofalmost s muchas his astpreferenceTable 2 provides upportforthiscontention). econd, individuals ssimilate nformationtdifferentates,hence a consensus on when a candidate becomes a sure loser is highlyunlikely.Finally, here s thesatisficationfcontinuing o supportone'sfirstpreference,even though it may amount to nothingmore than asymbolic ct.6
CONCLUSION
The intention f thispaper is to examine the behavior of the indi-vidualvoterwhenfaced with hreecandidates. The assumptions mplicitin thishypothesis re thatvoters,within he confinesof environmentalconstraints,re rationaldecision-makers; hatvotersconstruct nd usepreference tructuresn theirdecision-making; nd that votersacquireand assess information bout each candidate's chance of winningtheelection and use this information o weighttheirvoting decision. Acomputer-assistedlection imulation s used totest hishypothesis. heresultsshow definite valuativebehavior on behalf of the subjectsin-volved.A
significantercentageof
subjectsvoted for heir
highestanked
6These possibilitiesre supported byremarksmade in a follow-up nterview.Amongtheexplanationsgivenbythenon-switchersnexperimental roupsone and twofor tayingwith heir irst reference re: a definiteiking or heir irst reference; he"principle"of stayingwithone's first referenceregardlessof theconditions;and thebeliefthattheirfirst reference tillhas an outside chance ofwinning.
This content downloaded on Wed, 13 Mar 2013 20:57:05 PMAll use subject to JSTOR Terms and Conditions

7/28/2019 1983 Evaluative Voting Behavior_An Experimental Examination
http://slidepdf.com/reader/full/1983-evaluative-voting-behavioran-experimental-examination 9/11
EvaluativeVoting ehavior 95
preferencewith the greatest ikelihoodof winning.7The subjectswereable criticallyo evaluate preferencepolls and to determine, n an indi-
vidual level,theirmostpreferred andidate's chance of winning.Also,when the situationpresenteda need for the subjectto vote,the subjectindicated thathe/shewould actuallycast a ballot.
The election simulation lso produced at least one other nterestingobservation:the voterappears to recognize the time constraints f anelection and senseswhenit becomes important o become seriousabout
decidingwhich andidatetosupport.Sincethispoint s close to the end ofthehypotheticalampaign nthesimulation,t wouldseemthat he trendtoward beginning electoral campaigns earlier may not produce thebeneficialresults desired because votersdo not make theirfinalvoting
decision until ate in the election.8Whydo Americanelectionsseem devoid of evaluative behavior?As
explained earlier,most studieson votingbehavior focuson generalelec-tions where votersare usuallyfaced withonlytwochoices. This allowsthemto vote onlyin a straightforward,reference-basedmanner (i.e.,choose thecandidatetheymostprefer).Evaluativebehavior can be more
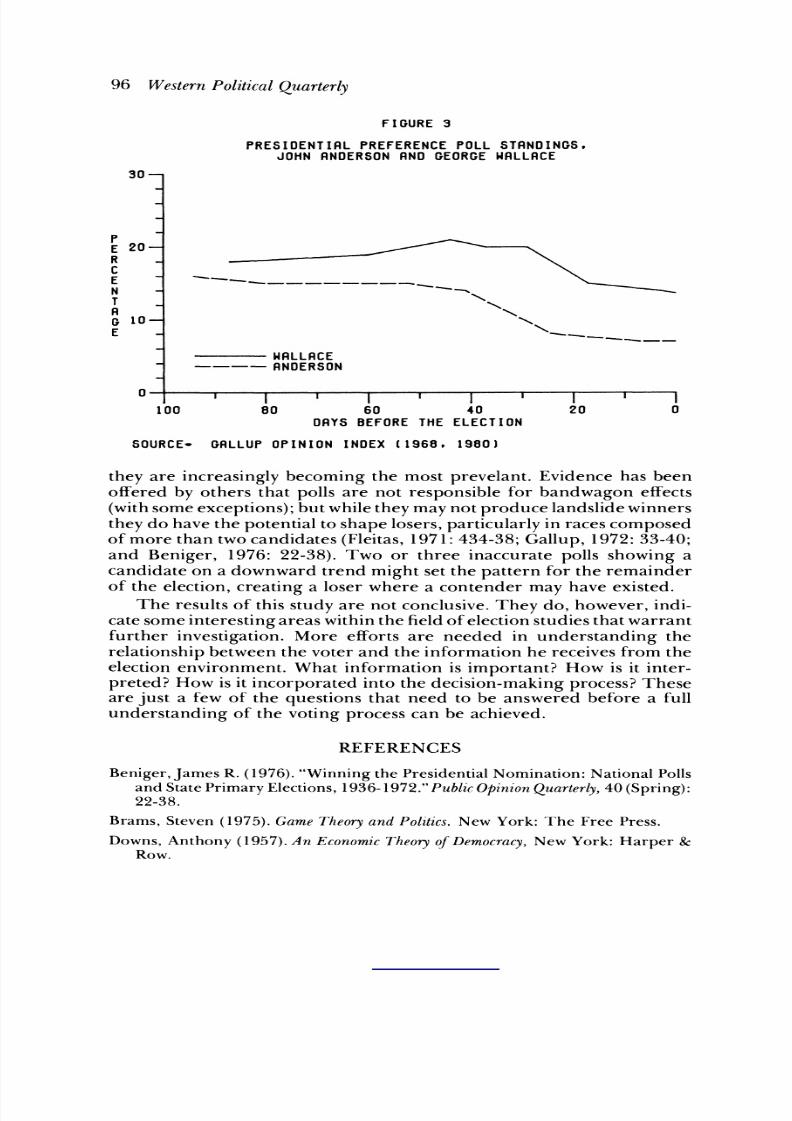
readilyobserved in primary lections,where the slate of candidates isoften threeor more. Americanpresidentialelections offer t least tworecentexamples of evaluativevotingbehavior: Anderson's bid for thepresidency,mentioned previously,and George Wallace's third-party
campaign in 1968. Both candidatesdid wellin thepolls until about onemonthbefore the election,when both candidates began a downwardtrend Figure 3). As theelectiondate neared a proportionof voterswhosupportedthethird-partyandidates saw thattheirfirst referencewasnotlikely owin nd transferred heir upporttoone ofthetworemainingcandidates.9
One additionalpoint: publicopinionpollsmayhave an impacton thedecision-making rocess n a waynotpreviously ealized. Whileopinionpolls are byno means theonly nformation vailable duringan election
7A result onsistent ithrationalvotermodelsthatspecify ecision-makerseek tomaximizeheirxpected alue ntheirhoice fcandidates. orexamplesee Downs(1957),Edwards1954), nd Fishbein ndAjzen 1975).
8This result sconsistentwithdata from he CPSR 1976 NationalElectionStudy.Forty-sixpercentof voters n the 1976 election did not reach a final decision untilaftertheRepublicanand DemocraticNationalConventions. Of these,slightly verhalfwaiteduntil hefinal woweeksof theelectionbeforedeciding. n regardto the1968presiden-tialelection a Gallup Opinionndex Report42, 1968) states that". . . one voter n foursaid that, ven twoweeks before theelection,he had not definitely'made up hismindhow he would vote" p. 7).
9In regardtoWallace,Steven Brams 1975: 95), notesthat In thefinal wo months f the
campaign, from the beginningof September to Election Day at the beginning ofNovember,polls indicated thathe [Wallace] lost tobothmajor party andidates)morethanone-third f his earlysupporters .. ." In regardtoAnderson,Schneider 1981:257), states hat People accepted theargumentthatAnderson could notwinand that,byvoting orhim, heymight e helping oelect the andidatethey ike east" page 257).For further iscussion fAnderson'scampaign alongthis ine see: Pomper,etal. (1981:84, 108).
This content downloaded on Wed, 13 Mar 2013 20:57:05 PMAll use subject to JSTOR Terms and Conditions
7/28/2019 1983 Evaluative Voting Behavior_An Experimental Examination
http://slidepdf.com/reader/full/1983-evaluative-voting-behavioran-experimental-examination 10/11
96 WesternoliticalQuarterly
FIGURE 3
PRESIDENTIRL PREFERENCE POLL STRNDINGS.
JOHNANDERSONAND GEORGEWRLLACE30-
E 20-RCE
- -' "- -.-N - ,T .
G 10--E -
-.. _
WALLACE- --- RANDERSON
100 80 0 40 20 000 80 60 40 20 0DRYS BEFORE THE ELECTION
SOURCE- GALLUP OPINION INDEX (1968. 1980)
theyare increasingly ecoming the mostprevelant.Evidence has beenofferedby others thatpolls are not responsibleforbandwagon effects(with omeexceptions);butwhiletheymaynotproduce landslidewinnerstheydo have thepotential oshape losers,particularlynracescomposedofmore than twocandidates Fleitas,1971: 434-38; Gallup, 1972: 33-40;and Beniger, 1976: 22-38). Two or three inaccurate polls showing acandidate on a downward trendmight et thepatternfor theremainderof the election,creatinga loser where a contendermayhave existed.
The resultsof this tudy re not conclusive.They do, however, ndi-
catesome nterestingreas within hefield felection tudiesthatwarrantfurther nvestigation.More efforts re needed in understandingtherelationship etween thevoter nd the nformation e receives from heelectionenvironment.What information s important?How is it inter-preted?How is it ncorporated ntothedecision-making rocess?Theseare just a few of the questions thatneed to be answered before a fullunderstandingof thevotingprocesscan be achieved.
REFERENCES
Beniger, amesR. 1976)."WinninghePresidentialomination: ational ollsandState rimarylections,936-1972."ublic pinion uarterly,0 Spring):22-38.
Brams, teven1975).Game heoryndPolitics. ewYork:The Free Press.
Downs, Anthony1957). AnEconomic heoryfDemocracy, ew York: Harper &Row.
This content downloaded on Wed, 13 Mar 2013 20:57:05 PMAll use subject to JSTOR Terms and Conditions

7/28/2019 1983 Evaluative Voting Behavior_An Experimental Examination
http://slidepdf.com/reader/full/1983-evaluative-voting-behavioran-experimental-examination 11/11
Evaluative VotingBehavior 97
Edwards,W. (1954). "The Theoryof Decision Making." Psychologicalulletin 1:380-417.
Fishbein,Martin, nd IcekAjzen (1975). Belief, ttitude,ntentionndBehavior:AnIntroductionoTheoryndResearch. eading,Mass.: Addison-Wesley ublishingCompany.
Fleitas,Daniel W. (1971). "Bandwagon and Underdog Effectsn Minimal nfor-mation Elections."American olitical cienceReview65 (une): 434-38.
Gallup, George (1972). The Sophisticatedoll Watcher's uide. Princeton,N.J.:PrincetonOpinion Press.
Pomper,Gerald M., et al. (1981). TheElection f1980: ReportsndInterpretations.Chatham,N.J.;Chatham House Publishers, nc.
Schneider,William
1981)."The November 4 Vote for President: What Did it
Mean?" In The American lections f1980, AustinRanney,ed. Washington,D.C.: AmericanEnterprise nstitutefor Public PolicyResearch: 212-62.
Wolfinger, aymondE., and StevenJ.Rosenstone 1980). WhoVotes?New Haven:Yale University ress.