19571105jec fedexpenditure hines
TRANSCRIPT
T H E USE OF NATURAL RESOURCE EX PEN D ITU RES TO PROMOTE GROWTH AND STABILITY IN TH E AMERICAN ECONOMY
Lawrence G. Hines, professor of economics, Dartmouth College
Seldom has a statistical projection excited so much enthusiasm as the trend line of American economic growth. Like the rainbow with the pot of gold, although it describes no descending arc, the growth trend promises leisure and plenty in the not distant future. Economic growth, generally indicated by increasing gross national product, is more often than not advanced uncritically as an important and laudable goal of American economic activity. Morever, economists find themselves in unusual agreement on the major requisite for promoting economic grow th: Maintain (or create) ample opportunities for investment. Of course there are minor discords over the precise role to assign to consumption and investment, but the historic 16 or 17 percent investment component of gross national product generally has been accepted as a reasonable benchmark of how much capital formation we must have to prevent a serious dip in the growth trend. A t the same time, investment of this magnitude is thought to provide the necessary underpinning of the economy and facilitate the achievement of the somewhat antithetical goal of stability. But at this point more caution must be observed.
Although economic growth usually has been achieved with a stable capital-output ratio, it is not a sound inference that economic growth can be endlessly stimulated by raising the capital side of the equation—■ or more properly, it i* a reasonable premise to assume that capital accumulation can be indefinitely increased.1 Capital accumulation must be based on sound technological innovation, new markets, or other demand-increasing avenues of profit-making opportunities else the rise in output will founder on the diminishing marginal productivity of later capital installations. In short, a boom level of investment may overreach the optimum ratio. But if the innovation or “newness” achieved by capital rationalization is underwritten by consumer purchases, we can tilt the growth line more sharply upward.
I t is commonplace for economists to avoid the question of the social worth of economic activity (at least when viewing the output of the market economy) but certainly Government policy cannot ignore this question. Assuming that we can push the rate of growth m the American economy substantially above its present level, or for that matter, maintain it at its present level—should this be an overriding objective of Federal policy? Although growth in one sense is inseparable from the announced objective of stability, that is, in its
1 See A. H. Hansen, Economic Growth and Stability, Federal Tax Policy for Economic Growth and Stability (W ashington: Joint Committee on the Economic Report, 84th Cong., 1st sess., November 9, 1955).
683
Digitized for FRASER http://fraser.stlouisfed.org/ Federal Reserve Bank of St. Louis
684 ECONOMIC GROWTH AND STABILITY
counteraction to a downturn in economic activity, some of the increase in economic output of the American economy is devoted primarily to satisfying the consumer’s passion for keeping up-to-date: pointed shoes, and Easter-egg cars. Moreover, consumer acceptance—even clamour—to spin the economic wheel of wealth faster to keep from going backward should not blind us to the fact that such consumer demand is largely implanted by the producer. Although economists may understandably feel uneasy if called upon to appraise the worth of such accelerated obsolescence, a critical choice may confront the Government policymaker in deciding between alternatives that will have less growth stimulation for the American economy, but which may possess intrinsic merit or strengthen the economy in important areas. At the same time, capital growth is itself temporarily responsible for a decrease in consumers goods. The drive for newness in capital stock necessarily reduces the production of consumers goods during the period of capital creation. I f this accelerated obsolescence is produced primarily by a jockeying for position among major producers, the resultant consumer benefit may be slight indeed and at times have virtually no effect upon the positions of the competitive contestants.
To meet the requirements of public policy, the economist’s crude dollar measure of productivity (or growth) of the economy must be refined by further analysis. Depending upon the preeminent objectives of society at the time, e. g., increased capacity for war, enhancement of public welfare, improvement of international goodwill, etc., some types of economic and noneconomic activity may contribute more to the acomplishment of these objectives than others. Thus, it is impossible to ignore the fact that equal units of national income are not equally productive in attaining given objectives. Although it may not be possible in many cases to substitute one type of resource- using activity that promotes a given societal goal at the expense of another resource-using activity that has a neutral or negative effect, we should recognize that some of the most productive activities undertaken in our society have little effect upon the generation of gross national product. For example, secondary and tertiary effects of consumer spending and induced private investment may be very meager from a program to increase educational opportunities and stimulate the arts. Indeed, gross national product may initially fall as resources are withdrawn from the labor market for a time and the net (crude) effect of such a program may be to stimulate the economy much les than investment that calls forth a demand for brick, mortar, and machines. But if not now, at least eventually we may reach an imbalance in the accumulation of brick, mortar, and machines in relation to the opportunities for cultural expression and development. We may even reach the conclusion that transfer payments may substantially enhance productivity if they result in equipping a segment of our society to contributing more satisfactorily to the accepted goals of our society. I t is the continuing obligation of our governmental organizations to prevent such an imbalance from seriously impairing the productivity of our society.
The twin goals of growth and stability are to a large extent the product of preoccupation with problems of the great depression and post-World W ar I I eras. We want to avoid a return to the economic distress of either, but in our concentration on problems of the past
Digitized for FRASER http://fraser.stlouisfed.org/ Federal Reserve Bank of St. Louis

ECONOMIC GROWTH AND STABILITY 685
we may fail to recognize more important needs of the future. A t the same time we are sometimes inclined to deplore any divergence from stability and treat moderate inflation and deflation as equivalent evils. Quite possibly we fear inflation too much, at least the type of inflation that has mildly harassed the American economy during the past 10 years. Although we can posit a constant growth rate and a dead level of stability, such a situation seems so unlikely that it is better to err on the side of mild inflation than moderate deflation. Such a course has its disadvantages and inequities: The fixed income group may be seriously distressed, employers may face the pinch of a tight labor market,2 tax adjustments upwards may cause discontent, etc., but there are compelling compensating factors in the general strengthening of the economy and the ascendancy of lower income families to higher income positions. Compared with the last period of normalcy of the 1920’s, our society is better off economically in almost every w ay: Home and farm ownership has increased, savings per family has virtually doubled, inequality in income distribution has decreased. On the basis of rational economic choice, moderate inflation does not appear to be too great a price to pay for such developments. This does not mean that public policy should be unconcerned about checking inflation and indifferent to the singular hardship it may cause among certain groups. We should maintain an interest in stability of our economy and stability of the purchasing power of the dollar, but we should be more than critical of a program that is willing to abandon stability of relatively full employment to attain neat stability of purchasing power. We should in turn devise special programs to meet the needs of those groups particularly distressed by a mildly ascending price level.
T h e T h e o r y o f P u b l ic E x p e n d it u r e s
In a short time we have come a long way from the dictum of Jean Baptiste Say that “The very best of all plans of [public] finance is to spend little.” In approximately 25 years, spanning 1929 to 1955, total Federal, State, and local expenditures have moved from less than 10 percent of gross national product to slightly over 25 percent, with 1943 and 1944 war expenditures coming close to half of the gross national product for those years. Moreover, the rise in government expenditures over this period has occurred almost entirely at the Federal level, with State and local expenditures in 1929 over twice as high as Federal expenditures—7.3 percent of gross national product for State and local and 2.5 percent for Federal, while in1955 the State and local proportion of gross national product had risen only 0.2 of 1 percent to 7.5 percent, but Federal expenditures had increased to 17.7 percent of gross national product.
W ith combined Government expenditures constituting slightly over one-fourth of total gross national product, it has become a widely accepted truism that one of the most important forces for inflation or deflation lies in the taxation and expenditure policies adopted that affect this decisive portion of our national product. In short, the role of public expenditures has changed over the last 20 years from
* See Paul A. Samuelson, Full Employment Versus Progress and Other Economic Goals, Income Stabilization for a Developing Democracy (New H aven : Yale University Press, 1953, M. F. Milllkan, ed.).
97735— 57-------15Digitized for FRASER http://fraser.stlouisfed.org/ Federal Reserve Bank of St. Louis

6 8 6 ECONOMIC GROWTH AND STABILITY
relatively minor outlays for activities that could not easily be undertaken through the private economy to a myriad of governmental functions and duties involving a different level of expenditure. This change has created a new threat and a new opportunity. I f this quarter portion of gross national product can be brought under rational, decisive control, it may greatly assist in alleviating the problems of insecurity and instability that have plagued us in the past. I f it cannot, we may be attempting to predict and control the course of an economic tumbleweed. But in either case, we can no longer view public expenditures purely from the standpoint of whether particular outlays are desirable or undesirable in their own right; we are forced to think in terms of the magnitude of the total expenditures and the fiscal appropriateness of particular outlays. Another dimension, which has various subdimensions, has been added to the problem of the selection of Government activities.
Briefly, these well-known major fiscal dimensions may be separated on the point that divides inflation and deflation. Historically, of course, our original concern with the countercyclical features of public expenditure programs was directed toward deflation and generally, since public expenditures demonstrate a pronouncedly greater flexibility m an upward direction, we have thought of expenditures as appropriate primarily as a means of stimulating economic activity rather than dampening down its upward thrust. Taxation and monetary controls have been relied upon and prescribed with more success in meeting the problems of inflation. But it is impossible to ignore the fact that public expenditures of one-quarter of gross national product cannot really be thought of as neutral or passive, even if income and outgo are perfectly balanced. I t makes little difference whether a deficit is created by lack of taxes or excess of expenditures, or that an overbalance of receipts over outlays is the result of curtailed expenditures or increased taxes. The important fact is that large expenditures do provide an opportunity for curtailment, although there may be compelling reasons for not pressing this fiscal advantage. A rational approach to public expenditure policy cannot ignore the consideration of the suitability of different types of public expenditures for fiscal
contol, although the decision may sometimes be that certain government functions are so important that they must be maintained irrespective of their fiscal inappropriateness.
Countercyclical fiscal policy as a means of combating deflation was embraced tentatively during the later period of the great depression. The experience during this period was somewhat inconclusive, but the trial maneuver was long enough to provide clues to the requisites and limitations of positive fiscal policy. The concern of this paper is with expenditure policy, although it is unrealistic to ignore the important role of taxation and borrowing.
The primary lesson of the depression appears to be that the magnitude of deficit expenditures (and/or tax relief) must be sufficiently great to compensate for the decline in consumer purchasing power. Moreover, the public expenditure must carry with it sufficient stimulus to encourage the private economy to take up again the full employment level of investment, else the recovery will be tentative and short lived. In other words, public expenditures must not only fill the gap resulting from decreased private consumption and investment, but provide a rejuvenating force that will restore these activities to their
Digitized for FRASER http://fraser.stlouisfed.org/ Federal Reserve Bank of St. Louis
ECONOMIC GROWTH AND STABILITY 687
previous vigorousness. I t is apparent from a close inspection of our experiences during the great depression that our expenditure policy was not sufficiently vigorous to achieve this goal. During the early
geriod of the depression total expenditures by State, local, and Federal Government for public-works projects were actually below the levels
of the late 1920’s, largely as a result of drastic curtailment of State and local outlays. This cut heavily into the normal government contribution to national product. A t the same time tax increases, rather than tax relief, helped to counteract the possible stimulus to recover from deficit spending. Partly because of the insufficiency of government deficit spending, partly because of fiscally inappropriate tax policies, and partly because of the hostility and suspicion of this new tool of deficit finance, the American economy had to wait for recovery to be achieved by the deficits of World W ar II.
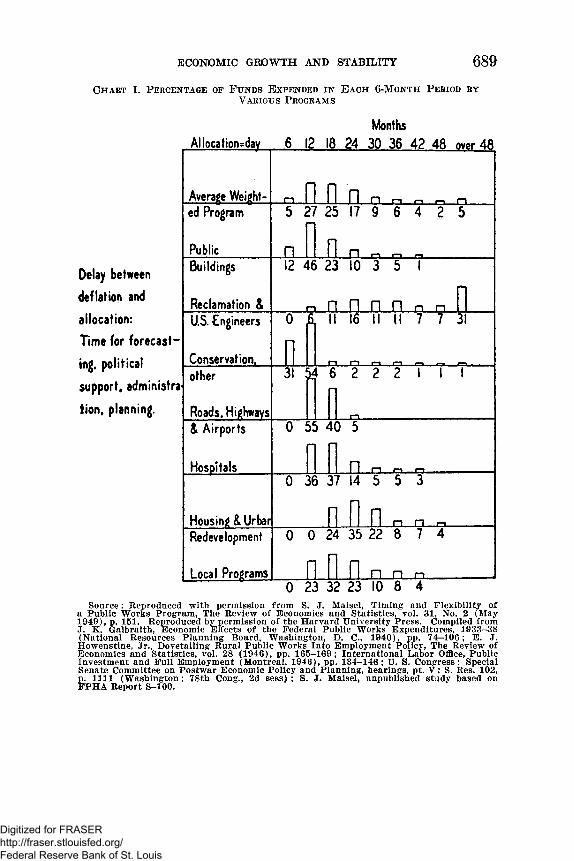
A lesson not so apparent from the experience of the great depression is that public expenditure policy is a cumbersome and unwieldy thing. I t is sometimes assumed that the time required to initiate a full-scale Federal public works (expenditure) program during the great depression was largely the result of indecision and lack of experience with compensatory finance. Certainly the unfamiliarity with this new tool must account for considerable delay in its use, but even after spending decisions have been made and allocations of funds achieved, a distressing delay must take place before the funds circulate in the economy in amounts sufficient to have any significant effect in raising the level of economic activity. Ideally, public expenditures should be subject to the smallest possible controlled variation during a given expenditure period: 3 to 6 months’ lag between decision to spend and the accomplished fact of spending. Actually, public expenditures do not lend themselves to anything like the precision of control necessary to promote great confidence in their use. I t is a misconception to believe that the lag in the stimulating effect of public expenditures can be overcome by having an administrative organization ready to undertake projects and a shelf of plans already certified. The lag between appropriation or allocation time and the peak impact of spending is so great that had we attempted to counteract the recessions of 1948-49 and 1953-54 with extensive expenditure programs the peak impact of such activities would have occurred in time to add further embarrassment to our attempts to control rising prices. Although some types of public expenditures lend themselves to more sensitive control than others, for the most part the use of public expenditures as a counteracting influence for anything other than a well-established, serious depression does not appear appropriate. The more resilient approach through tax policy seems to offer prospects of greater success.
The sluggishness of public works is well illustrated by public housing expenditures, frequently designated as a desirable objective of Federal expenditures, partly because of the stagnation in the construction industry which generally accompanies a recession. Persuasive arguments appear to favor stimulation of the construction industry through some form of public housing program: The administration organization for undertaking a Federal housing program exists in at least a modified form; our Federal Government has probably as much experience in housing public works as any other large-scale undertaking; housing construction uses large amounts of manpower
Digitized for FRASER http://fraser.stlouisfed.org/ Federal Reserve Bank of St. Louis
and materials, hence promising secondary and tertiary stimulation of the economy; to some extent housing projects can be undertaken in localities where the depressed condition of the construction industry is greatest and where the greatest benefits from stimulation may be expected; Federal assistance for housing development and community slum clearance is a generally accepted function of the Federal Government, affording the opportunity for Federal cooperation with State and local governments.
The great disadvantage of a large-scale housing project is the lapse of time between the allocation of the funds for the program and the time at which the expenditure finally affects the private economy. As is shown in chart I , a timelag of 2 years occurs before any significant effect on the private economy can be expected from public housing expenditures. This timelag is partly the result of proolems peculiar to housing programs—for example, condemnation proceedings normally require from 2 to 3 years—and partly a characteristic of large- scale contracting.
6 8 8 ECONOMIC GROWTH AND STABILITY
Digitized for FRASER http://fraser.stlouisfed.org/ Federal Reserve Bank of St. Louis
ECONOMIC GROWTH AND STABILITY 689C h a r t I. P e r c e n t a g e o f F u n d s E x p e n d e d i n E a c h 6 - M o n t h P e b io d b y
V a r io u s P r o g r a m s
Months
Delay between
deflation and
allocation:
Time for forecast
ing. political
support, administra
tion. planning.
Source: Reproduced with permission from S. J. Maisel, Timing and Flexibility of a Public Works Program, The Review of Economics and Statistics, vol. 31, No. 2 (May 1949), p. 151. Reproduced by permission of the Harvard University Press. Compiled from J. K. Galbraith, Economic Effects of the Federal Public Works Expenditures, 1933-38 (National Resources Planning Board, W ashington, D. C., 1940), pp. 74—106; E. J. Howenstine, Jr., Dovetailing Rural Public Works Into Employment Policy, The Review of Economics and Statistics, vol. 28 (1946), pp. 165-169; International Labor Office, Public Investment and Full Employment (Montreal, 1946), pp. 134-146; U. S. Congress: Special Senate Committee on Postwar Economic Policy and Planning, hearings, pt. V ; S. Res. 102, p. 1111 (W ashington: 78th Cong., 2d sess) ; S. J. Maisel, unpublished study based on FPHA Report S-100.
Allocation=day 6 12 18 24 30 36 42 48 over 48
Average Weight m II II 11 n n m i—» ned Program
Public
5 2
n
7 25 17 9 6 4 2 5
Buildings
Reclamation &
12
r
6 23 10 3 5 1
t n n n n n nU.S. Engineers
Conservation.
0II 16 II 11 7 7 3
other
Roads, Highways
3 5 3 2 2 2 1 1 1
L& Airports
Hosoitals
0 5 A0 5
1 1 n pi n ----------
Housing & Urban
0 36 37 14 5 5 3
I"! 1 fl n n r-.Redevelopment
Local Programs
0 0 2
n4 35 22 8 7 4
fl n n n ...0 23 32 23 10 8 4
Digitized for FRASER http://fraser.stlouisfed.org/ Federal Reserve Bank of St. Louis
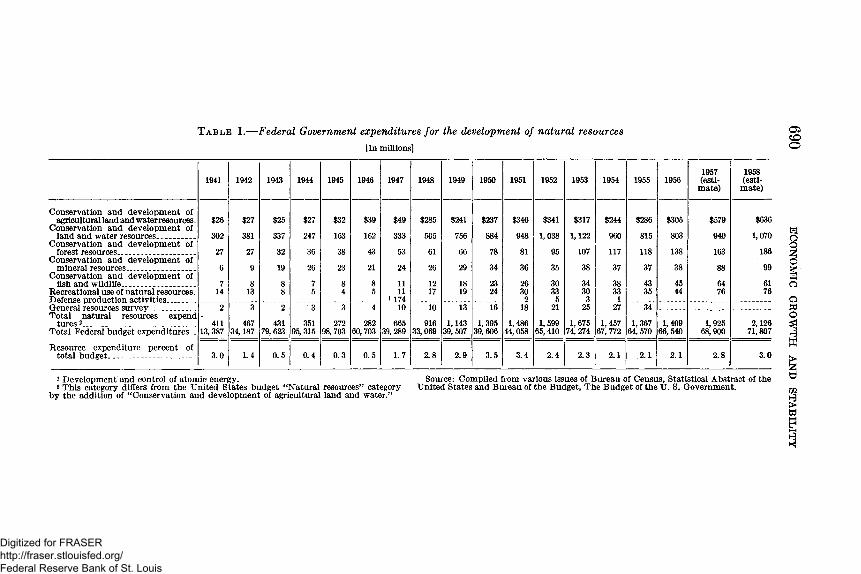
T a b l e I .— Federa l Governm ent expenditures fo r the development of n a tu ra l resources
[In millions]
a*COO
1941 1942 1943 1944 1945 1946 1947 1948 1949 1950 1951 1952 1953 1954 1955 19561957(esti
mate)
1958(esti
mate)
Conservation and development ofagricultural tend and waterresources. $26 $27 $25 $27 $32 $39 $49 $285 $241 $237 $346 $341 $317 $244 $286 $305 $579 $636
Conservation and development ofland and water resources. _ . 302 381 337 247 163 162 333 505 756 884 948 1, 038 1,122 960 815 803 940 1,070
Conservation and development offorest resources................................. 27 27 32 36 38 43 53 61 66 78 81 95 107 117 118 138 163 186
Conservation and development ofmineral resources............................. 6 9 19 26 23 21 24 26 29 34 36 35 38 37 37 38 88 99
Conservation and development offish and wildlife............................... 7 8 8 7 8 8 11 12 18 23 26 30 34 38 43 45 64 61
Recreational use of natural resources. 14 13 8 5 4 5 11 17 19 24 30 33 30 33 35 44 76 761 174 2 5 3 1
2 3 2 3 3 4 10 10 13 16 18 21 25 27 34Total natural resources expend
tures2.................................. ............. 411 467 431 351 272 282 665 916 1,143 1,395 1,486 1, 599 1,675 1,457 1,367 1,409 1,925 2,126Total Federal budget expenditures.. 13,387 34,187 79,623 95,315 98,703 60,703 39, 289 33,069 39,507 39,606 44,058 65,410 74, 274 67,772 64,570 66,540 68,900 71,807
Resource expenditure percent oftotal budget_____ ________ 3.0 1.4 0.5 0.4 0.3 0.5 1.7 2.8 2.9 3.5 3.4 2.4 2.3 2.1 .2.1 2.1 2.8 3.0
1 Development and control of atomic energy. Source: Compiled from various issues of Bureau of Census, Statistical Abstract of the2 This category differs from the United States budget “Natural resources'’ category United States and Bureau of the Budget, The Budget of the U. S. Government,
by the addition of “Conservation and development of agricultural land and water.”
ECO
NO
MIC
G
ROW
TH
AND ST
AB
ILIT
Y
Digitized for FRASER http://fraser.stlouisfed.org/ Federal Reserve Bank of St. Louis
Quite as important as whether a public works program can be initiated quickly is the question of whether the project is susceptible to wide variation in expenditures upon short notice and quick termination. Projects that involve considerable prior planning and large units of construction, such as housing, flood control, and reclamation, are generally extremely inflexible. Once a housing or slum clearing project is initiated, for example, strong community pressure may be exerted to continue the undertaking even though it may no longer be fiscally appropriate.3 Aside from these pressures, termination of a partially completed housing development, flood-control dam, or reclamation project is generally not feasible if the project is to provide any benefit from the original investment. As a result, only in cases where the portent of the future is clearly for a prolonged depression is it safe to risk undertaking such projects for their countercyclical influence.
Aside from the activities of the Bureau of Reclamation and the civilian functions of the Army engineers, as indicated in chart I, expenditures for conservation activities are relatively good candidates for counterfiscal projects. The prime advantage of such expenditures is that the appropriations flow into the money stream of the economy rapidly. The larger portion of natural resource expenditures goes for the purchase of labor services and involves the use of easily available equipment. The process of spending natural resource allocations is largely that of adapting existing organizations to the task of increased activities and recruiting workers to perform the services required. During a recession the recruitment of labor is generally simple, but the location of the greater bulk of the unemployed in eastern urban areas may retard the initiation of projects that are undertaken in less densely populated regions of the country. As a result, the problem of mobility is a major disadvantage of natural resource expenditures as a countercyclical influence. Additional disadvantages are that expenditures for resource development usually involve the use of little machinery and equipment, hence reducing the secondary and tertiary influence of such spending, and rarely employ manpower at the skills practiced prior to unemployment. These are serious disadvantages that restrict the potential impact of such programs and decrease their attractiveness to the unemployed worker. Many resource development activities, such as the improvement of watersheds, small upstream flood-control projects, reduction in forest-fire hazard, and the like, provide some gain, however, even though a whole area is not covered or the original plan is not fully completed.
ECONOMIC GROWTH AND STABILITY 691
3 Professor Abbott describes well, it somewhat cynically, the forces that work against curtailment of expenditure: “Spending begets an organization of spenders— an administrative staff as a minimum, supported by an administrative budget, to supervise the outlay of the appropriation. Spending necessarily produces records, and records in the Government seem to have a w ill and an ability to survive and perpetuate themselves that are almost independent o f the desires or actions of the recordkeepers. Very often It results in the acquisition by the Government of assets that must be preserved and maintained— office furnishings, If nothing more. Almost always It fathers ‘projects’ which w ill take some months or years to complete and which must be continued or else result in a complete waste of the public moneys already spent. By Its nature It develops, from out of its own administrative organization, experts who can, from their familiarity with the records that they themselves keep, assemble more facts In its defense than can be brought to bear by its opponents who do not have ready access to the Information. Above all, spending establishes a host of vested interests that range from the employees actually on the payroll to the business firms and local government bodies in the districts where the funds are spent.” (By permission from Management of the Federal Debt, by C. C. Abbott. Copyright, 1946, McGraw-Hill Book Co., Inc., p. 166.)
Digitized for FRASER http://fraser.stlouisfed.org/ Federal Reserve Bank of St. Louis
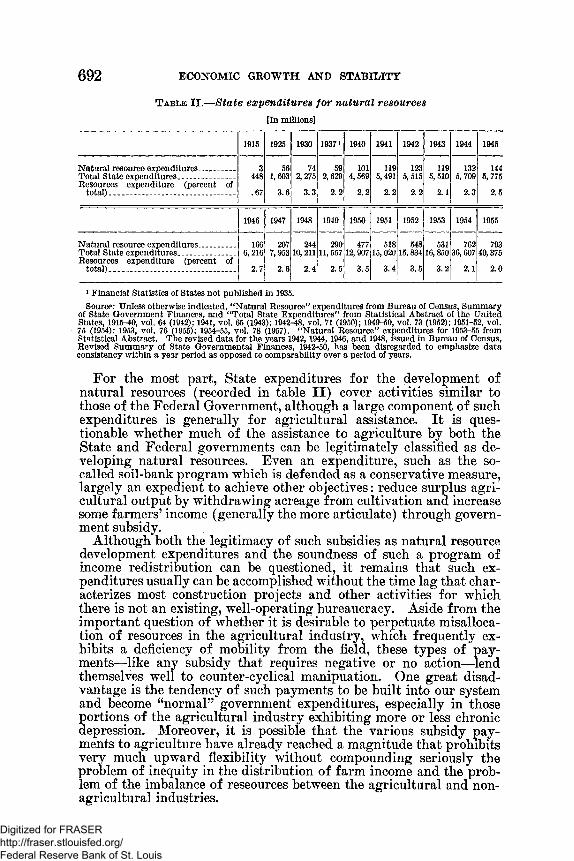
T a b le II.— State expenditures for natural resources
692 ECONOMIC GROWTH AND STABILITY
[In millions]
1915 1925 1930 1937* 1940 1941 1942 1943 1944 1945
Natural resource expenditures................ 3 56 74 59 101 119 123 119 132 144Total State expenditures........................ 448 1,603 2,275 2,629 4,569 5,491 5,515 5,510 5,709 5,775Resources expenditure (percent of
total)...................................................... .67 3.6 3.3 2.2 2.2 2.2 2.2 2.1 2.3 2.5
1946 1947 1948 1949 1950 1951 1952 1953 1954 1955
Natural resource expenditures............... 166 207 244 290 477 518 548 531 762 793Total State expenditures......................... 6,216 7,953 10, 211 11,557 12,907 15, 020 15,834 16, 850 36,607 40,375Resources expenditure (percent of
total).................................................... 2.7 2.6 2.4 2.5 3.5 3.4 3.5 3.2 2.1 2.0
1 Financial Statistics of States not published in 1935.Source: Unless otherwise indicated, “Natural Resource" expenditures from Bureau of Census, Summary
of State Government Finances, and “Total State Expenditures" from Statistical Abstract of the United States, 1915-40, vol. 64 (1942); 1941, vol. 65 (1943); 1942-48, vol. 71 (1950); 1949-50, vol. 73 (1952); 1951-52, vol. 75 (1954); 1953, vol. 76 (1955); 1954-55, vol. 78 (1957). “Natural Resource” expenditures for 1953-55 from Statistical Abstract. Tne revised data for the years 1942,1944,1946, and 1948, issued in Bureau of Census, Revised Summary of State Governmental Finances, 1942-50, has been disregarded to emphasize data consistency within a year period as opposed to comparability over a period of years.
For the most part, State expenditures for the development of natural resources (recorded in table I I ) cover activities similar to those of the Federal Government, although a large component of such expenditures is generally for agricultural assistance. I t is questionable whether much of the assistance to agriculture by both the State and Federal governments can be legitimately classified as developing natural resources. Even an expenditure, such as the so- called soil-bank program which is defended as a conservative measure, largely an expedient to achieve other objectives: reduce surplus agricultural output by withdrawing acreage from cultivation and increase some farmers’ income (generally the more articulate) through government subsidy.
Although both the legitimacy of such subsidies as natural resource development expenditures and the soundness of such a program of income redistribution can be questioned, it remains that such expenditures usually can be accomplished without the time lag that characterizes most construction projects and other activities for which there is not an existing, well-operating bureaucracy. Aside from the important question of whether it is desirable to perpetuate misalloca- tion of resources in the agricultural industry, which frequently exhibits a deficiency of mobility from the field, these types of payments—like any subsidy that requires negative or no action—lend themselves well to counter-cyclical manipuation. One great disadvantage is the tendency of such payments to be built into our system and become “normal” government expenditures, especially in those portions of the agricultural industry exhibiting more or less chronic depression. Moreover, it is possible that the various subsidy payments to agriculture have already reached a magnitude that prohibits very much upward flexibility without compounding seriously the problem of inequity in the distribution of farm income and the problem of the imbalance of reseources between the agricultural and non- agricultural industries.
Digitized for FRASER http://fraser.stlouisfed.org/ Federal Reserve Bank of St. Louis
ECONOMIC GROWTH AND STABILITY 693
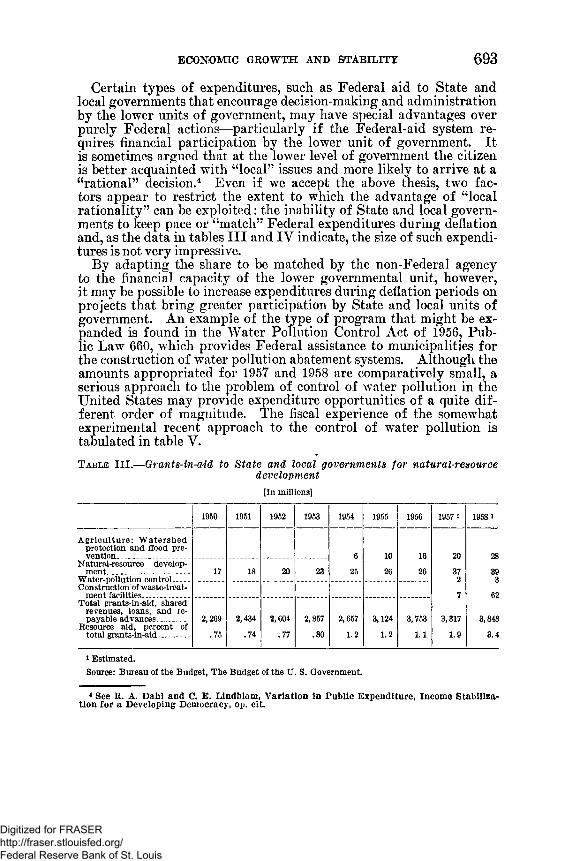
Certain types of expenditures, such as Federal aid to State and local governments that encourage decision-making and administration by the lower units of government, may have special advantages over purely Federal actions—particularly if the Federal-aid system requires financial participation by the lower unit of government. I t is sometimes argued that at the lower level of government the citizen is better acquainted with “local” issues and more likely to arrive at a “rational” decision.4 Even if we accept the above thesis, two factors appear to restrict the extent to which the advantage of “local rationality” can be exploited: the inability of State and local governments to keep pace or “match” Federal expenditures during deflation and, as the data in tables I I I and IY indicate, the size of such expenditures is not very impressive.
By adapting the share to be matched by the non-Federal agency to the financial capacity of the lower governmental unit, however, it may be possible to increase expenditures during deflation periods on projects that bring greater participation by State and local units of government. An example of the type of program that might be expanded is found in the Water Pollution Control Act of 1956, Public Law 660, which provides Federal assistance to municipalities for the construction of water pollution abatement systems. Although the amounts appropriated for 1957 and 1958 are comparatively small, a serious approach to the problem of control of water pollution in the United States may provide expenditure opportunities of a quite different order of magnitude. The fiscal experience of the somewhat experimental recent approach to the control of water pollution is tabulated in table V.T ab le III.— Grants-in-aid to State and local governments for natural-resource
development[In millions]
1950 1951 1952 1953 1954 1955 1956 1957 i 1958 *
Agriculture: Watershed protection and flood pre-
6 10 16 20 28Natural-resource develop-
17 18 20 23 25 26 26 37 392 3
Construction'of waste-treat-7 62
Total grants-in-aid, shared revenues, loans, and re-
2,269
.75
2,434
.74
2,604
.77
2,857
.80
2,657
1.2
3,124
1.2
3,753
1.1
3,317
1.9
3,848
3.4Resource aid, percent of
l Estimated.Source: Bureau ol the Budget, The Budget of the U. S. Government.
* See R. A. Dahl and C. E. Lindblom, Variation in Public Expenditure, Income Stabilization for a Developing Democracy, op. cit.
Digitized for FRASER http://fraser.stlouisfed.org/ Federal Reserve Bank of St. Louis

T a b le IV.— Federal aid to State and local governments for natural resources,z fiscal years 1950, 1952, 1954-37
694 ECONOMIC GROWTH AND STABILITY
[In thousands]
Aid for natural resources 1950 1952 1954 19551956(esti
mated)3
1957(esti
mated)3
Total aid to States and local govemmcnts- $43,654 $57,280 $75, 045 $83, 202 $86,570 $108, 547
16,957 19,755 24, 940 25, 934 25,983 36, 550
108 150 1509,466 10, 037 9, 800 9,509 10,465
30010, 4653.000
11,7004,035
5.000
2,200
7,491 9,518200
12, 848 2,293
12, 796 10,8803,522 4,188
Proposed legislation:Partnership projects (Defense, Army
Partnership projects (Interior Depart-
26,697 37,525 50,105 57, 268 60,587 69,797
28 28 35 33 31 37185 288 349 352 370 368
Proceeds to States, sales of public lands,5 118 67 86 134 246
(*) 600
3,172
1 1 3 2Boulder Canyon project, payments to Ari
zona. Nevada............................. ..................Oregon Mid California land-grant fund, to
600
1,762 44
600
6,422
600
11,756 143
600
9,000 43
600
8,755Coos Bay Wagon Road grant lands, Oregon. Oil and gas royalty payments, Oklahoma,
504
11,325
3 1,991
615,108
255
918,741
1222,189
724,940
826,917
Migratory Bird Conservation Act, to471 564 547 55026 26 26 26
National-forest fund, to States for counties-. National-forest receipts, Arizona, New
7,753
61
13,993
107
18,695
123
16,471
103
19,428
114
26,089
115Flood Control A c t .. ........................................TVA, payments in lieu of taxes.. ...............
Loans and repayable advances (net of collec-468
2,471813
3,036989
3,5791,053 3,878
1,190 4,152
1,250 4,7862,2002,200
* Detail will not necessarily add to totals because of rounding.* In the budget of the United States Government for the fiscal year ending June 30,1957.3 Part of a larger appropriation account.* Less than $500.Source: Bureau of the Budget, The Budget of the U. S. Government, 1957, pp. 1148
1149 ; 1956, pp. 1192-1193 ; 1954, pp. 1132-1133; 1952, pp. 996-997.
T a b le V.— Fiscal data on water pollution control appropriations[In thousands]
1957 1958
$2,000
2,224 50,000
$3,000
3, 500 45,000
General headquarters activities, including Sanitary Engineering Center at
54,224 51,500
Source: U. S. Public Health Service.
This program is selected for special attention B because it is preeminently a matter of resource development (or resource rehabilita
B A similar problem resulting from urban concentration, air pollution, m ight have been chosen as an illustration of a Federal grants program for resource development, but the air-pollutlon program even more than the water pollution control program is In its Infancy. Public Law 158, 84th Cong., 1955, established “An act to provide research and technical assistance relating to air-pollutlon control.” At the present time expenditures have been concentrated primarily upon research and study carried on w ith States, Federal agencies, and universities. The program is administered by the U. S. Public Health Service and has the follow ing appropriation record: 1956, $1,784,000; 1957, $2,740,000; and 1958, $4,000,000.Digitized for FRASER
http://fraser.stlouisfed.org/ Federal Reserve Bank of St. Louis

tio n ); it involves' a resource whose use extends to the most varied directions (industrial, agricultural, domestic, and recreational) ; it involves issues of interstate jurisdiction that compel Federal participation and possible initiation, but require decisions and construction at the local level; and it appears to have favorable countercyclical fiscal characteristics. Construction of pollution-abatement installations take place in local communities, with greater need for such abatement installations generally coinciding with the more highly industrialized, heavily populated urban centers. The local organization for administering such installations (local waterworks or sewage- disposal authorities) are frequently available to undertake such programs.6 The engineering design for pollution-abatement systems is relatively standardized and the installations themselves are not subject to unique local specifications or wide stylistic variations, such as is the case with housing developments, school plans, fiood-control projects, and the like. The construction of pollution-abatement systems uses large amounts of concrete, moderate quantities of steel, and specialized pumping equipment, thus promising some degree of stimulation to investment as well as to consumption. Finally, although such systems operate most successfully when construction is completed to capacity design, it is possible to terminate construction somewhat short of the optimum plan and still obtain benefit from the installation.7
C r i t e r i a f o r t h e S e l e c t i o n o f N a t u r a l R e s o u r c e D e v e l o p m e n t
P r o j e c t s
“Crab and all sorts of things * * * plenty of choice, only make up your mind.”
Alice’s problem of choice was small compared with decision making in the formulation of public policy. Complications occur in making up the public mind as a result o f : (1) The necessity for a small number of individuals (legislators and administrators) to decide on the basis of imperfect information what other people would like; (2) the special nature of conflicting public policy objectives, such as the goals of stimulation of economic activity or improvement of resource allocation,8 which do not lend themselves to decisions on the basis of personal experience; (3) the lack of a ready mechanism, such as the market economy, that can be relied upon more or less automatically to assemble a consensus from conflicting opinions.
ECONOMIC GROWTH AND STABILITY 695
fl A serious and increasingly important reservation should be noted in the case of the available community administrative organization for undertaking water pollution-control projects. The growth of metropolitanism, i. e., the spread of residential developments beyond the boundaries of existing community administrative organization, may be expected to create more rather than less administrative no man’s land.
7 Pollution-treatment plants are usually designated as “primary” or “secondary.” Primary treatment consists of settlem ent and secondary treatment involves filtration and biological reaction. Flexibility in pollution treatment may be obtained by treating less than the total volume of the community’s waste water and through progressive expension of pollution treatment from primary to secondary coverage. Although it is generally conceded that virtually all communities should provide primary treatment as a means of water-pollution control, the practice is far from universal, thus providing an opportunity for extensive expenditure. Further exibility is available in the decision to advance from primary to secondary treatment.
8 Thus the payment of subsidies to farmers for not producing may be a more flexible form ofcountercycle stimulation than housing projects, but at the same time may enhance the misallocation of the economy’s productive resources.
Digitized for FRASER http://fraser.stlouisfed.org/ Federal Reserve Bank of St. Louis
Although the problem of decision making in public policy is by no means new, with each enlargement of the variety and extent of governmental activities the impact of public policy upon the economy becomes more significant. Growth in size and variety of Government undertakings has stimulated interest and research in developing procedure by which public-policy decisions will be more nearly in accord with defensible standards of choice.9 The most refined attempt to provide a basis for economic evaluation of public expenditures by a governmental agency is found in the Report to the Federal In teragency Eiver Basin Committee on Proposed Practices for Economic Analysis of River Basin Projects10 by the subcommittee on benefits and costs. This document has been prepared through the cooperation of the Departments of Agriculture, Commerce, and Interior, the Army Corps of Engineers, and the Federal Power Commission. These departments and agencies represent most of the important Federal Government units that carry on programs for the development of natural resources. Although skepticism is undoubtedly justified in appraising the influence that some parts of the interagency report have had upon either the participating Federal agencies or Congress, it provides an accepted framework for the presentation and analysis of economic data for most federally sponsored water-control projects. As a result, adherence to the philosophy and procedures advanced in the interagency report are sometimes important features in the competition for appropriations and the justification before Congress of agency expenditures. Briefly, project justification relies heavily upon benefit-cost analysis, which in turn is very closely identified with the standards of value established in the private market economy. For example, the interagency report holds that—
* * * In order for the effects of a project to have economic value in terms of benefits or costs it is necessary that there be a need or demand for the goods and services produced by or used for the project.
The most practicable measure of the relative desirability of goods and services for meeting the various needs and demands which exist is the market price in dollars. * * * To the extent that project effects can be assigned an actual or estimated market value, they may be defined as benefits and costs in terms of the market value in dollars of the increases or decreases in goods and services that are expected to result if a project is undertaken.11 ’
Although the interagency report is studded with careful disclaimers that private market data alone should not serve as the basis for determining the acceptability of a Federal project, the very nature of
696 ECONOMIC GROWTH AND STABILITY
•M ajor contributions to the investigation of policy determination in governmental natural resource-using projects have been made by S. V. Ciriacy-Wantrup. Resource Conservation : Economics and Policies (Berkeley: University of California, 1 0 5 2 ): 0 . Eckstein. Benefits and Costs: Studies in the Economics of Public Works Evaluation (Cambridge: Ph. D. thesis. Harvard University, April 1 9 5 5 ): R. N. McKean, Cost-Beneflt Analysis and Efficiency in Government (Santa Monica: RAND Corp., 1955). The most thoroughgoing Federal agency studv of this problem is to be found in Proposed Practices for Economic Analysis of River Basin P rojects: Report to the Federal Interagency River Basin Committee (prepared by Subcommittee on Benefits and Costs, W ashington, D. C., May 1950). This report is generally known as the Green Book.
10 Cited above, note 9.* Ibid., pp. 7-8 .
Digitized for FRASER http://fraser.stlouisfed.org/ Federal Reserve Bank of St. Louis

ECONOMIC GROWTH AND STABILITY 697
the benefit-cost ratio, which is the end product of the benefit-cost analysis, creates an almost irresistible temptation to place primary emphasis upon this succinct and ready means of comparing different projects. Unfortunately the admonitions to evaluate projects in terms of their appropriateness from the standpoint of the public viewpoint may be rather futile if the benefit-cost ratio excludes considerations that are not expressed by data translated from or into the parameters of the private market economy. In such a case the decisive point is the dividing line between so-called tangible and intangible benefits, with the former comprising the benefit side of the ratio and the latter “described with care” and “recognized and considered apart from the analysis of monetary values.” 12 The interagency report distinguishes between tangible and intangible effects as follows:
The tangible effects of a project are, for the purposes of this report, defined as those measurable in monetary terms, and the intangible effects are those which cannot be measured in monetary terms. Most of the effects of most projects, whether benefits or costs, can be evaluated on the basis of market prices. Some tangible effects cannot be evaluated directly on the basis of market prices, but their values may in some cases be derived or estimated indirectly from prices established in the market for similar or analogous effects or may be derived from the most economical cost of producing similar effects by alternate means. Other effects cannot be evaluated in monetary terms by any satisfactory device and so are called intangible.13
I t is understandable that the typical Congressman, harried by a nagging conscience to try to cut Federal expenditures, should be attracted by a benefit-cost ratio that purports to reveal clearly and quickly whether a particular public project in natural resource development is worth the Government expenditure that is requested. The answer is seemingly simple: if the ratio of benefit to cost is greater than unity, the Government is getting its “money’s worth.” Projects that have a higher ratio of benefit to cost must be better Government “investments” than undertakings with a lower ratio. Although it is of course possible to look behind the benefit-cost ratio to the analysis of the data and the description of the intangible features of a given project, those activities that do not lend themselves to monetary interpretation are at a greater competitive disadvantage in the struggle for congressional appropriations—especially in the press of Washington decision-making.
In view of the strong emphasis in the interagency report on the use of private market data as measures of benefits and cost and the frequent allusion that the cost to the community of resource use by the Federal Government is the output consequently foregone by private production, it is surprising that participating agencies do not necessarily consider the benefit-cost ratio to provide information on whether resources should be shifted from the private to the public sector of the economy. One would expect—and most reviewers have
Digitized for FRASER http://fraser.stlouisfed.org/ Federal Reserve Bank of St. Louis

assumed—that the emphasis upon private market data and standards has been primarily for the purpose of facilitating comparison between public and private direction of resources and providing a measure of effeciency.
Two major aspects of project cost accounting prevent the benefit/ cost ratio from indicating whether it is economical to shift resources from the private to the public sector of the economy: (1) the use of a 21/2 percent interest rate and (2) the unsatisfactory arrangement for tax allowance. Although a low rate of interest may correspond to the long-term Federal Government borrowing rate, thus in a partial sense representing the risk to the lender, such a rate can hardly reflect adequately the economic hazard of investment in a given resource development project. Indeed, if the repayment history of some irrigation developments is indicative of “return on investment,” a phenomenally higher rate of interest might be required to attract resources away from the private economy for such activities. I t may be unnecessary to point out that the Federal Government borrowing rate is largely disassociated from the risk and uncertainty of the projects that it undertakes and therefore provides no basis for relating private and public investment.
In considering the proper treatment of taxation in the benefit-cost analysis, the interagency report is concerned primarily with the aggregate effect of such levies upon the tax capacity of the economy or the pertinent region. I t is apparently not concerned with the impact that a given method of tax accounting may have upon the scale of development of resource use in public as compared with private undertakings. Although portions of the report’s consideration of tax accounting are subject to conflicting interpretation, apparently an allowance for taxes comparable to that encountered in similar private investment is made through reduction in price (but not to measure benefits), rather than addition to cost. Since benefits are measured when possible by the prevailing market price, the allowance for taxes via price reduction in effect permits the Government investment to exploit a lower portion of the demand curve. In other words, it is simple to justify larger capacity than comparable private installations if the benefits for the public installation are measured by the price obtained by the private installation, and if the Government price and cost actually does not include a tax allowance equivalent to the tax-cost outlay by the private firm. The effect of this accounting technique— including tax outlays in establishing project benefits and excluding them in computing project costs—is to provide a purely artificial basis for the expansion of Government installations. This stimulus to expansion will of course cause the greatest distortion in resource allocation vis-a-vis the private economy when the activity involved is subject to significant economy of scale.14
698 ECONOMIC GROWTH AND STABILITY
14 The relevant portions of the interagency report appear to be the fo llow in g:“* * * ^he primary effect of a river-basin project on local government units arises from
changes in the real-estate tax base. The local government revenues may in some cases be reduced to a greater extent than the corresponding reduction in the costs of the services it provides. In other cases, the local tax revenues may be increased* by the project proportionally more than are the costs of providing services to such an area. When decreases in tax revenue in a given taxing unit are offset by decreases in the costs of governmental services, no allowance needs to be made in project costs. Also when increased revenues are sufficient just to cover both any increased costs of service and any losses in tax revenues from lands withdrawn from the tax base, no allowance needs to be made in project costs. A tax-adjustment problem arises when an adversely affected taxing district cannot benefit from the increased tax returns in other areas which may
Digitized for FRASER http://fraser.stlouisfed.org/ Federal Reserve Bank of St. Louis

ECONOMIC GROWTH AND STABILITY 699
The justification for including taxes on the benefit side and deducting them when computing government project costs may be the result of an analytical misconception. I t may be argued, for example, that since the shift of resources between private and public activities occurs from “marginal” private investment, the taxation issue “washes out” because the marginal firm does not bear taxes. The misconception involved here is that although the marginal firm may not bear taxes— in the sense that such levies must be compensated for by price adjustment—the effect of the higher private price is to curtail private investment at the same time that it enhances the benefit figure for public projects and increases the latter's scale of operation.
The net effect of the use of such a double standard for the treatment of cost outlays in government and private investment renders invalid the use of the benefit-cost ratio as a measure of the economic appropriateness in terms of private market appraisal of shifting resources from the private to the public sector of the economy.
Quite aside from the technical inadequacies of benefit-cost analysis, however, the appropriateness of using private market standards for determining public investment is questionable. A t times a half-administrative, half-economic argument is made in defense of the use of these types of evaluation that hold up government expenditures and investment to the assumed rigorousness of the private market. I t is contended that although the standard is not perfect, it helps to hold in check those Federal agencies that are adept at creating local pressure- group support for their functions and most frequently the beneficiaries of “pork barrel” appropriations. More often than not, however, the benefit-cost analysis results not in restraining the agencies that have built empires of bureaucracy, but merely hamstringing other agencies that have not yet developed such an effective entree to the Federal purse.
Although benefit-cost analysis is not intended to provide the only or main basis for project justification, very frequently it has attained an influence in decisionmaking quite out of keeping with its proper role— even if the analysis were performed satisfactorily. The acceptance of the private market standard as a criterion for Federal project justification places the public interest in a peculiar double jeopardy. The private market standard, i. e., justification of public investment on the basis of whether it can yield a return commensurate with private investment, ignores the critical difference between the purposes of private and public economic activities. Moreover this procedure confers on resource allocation decisions of the private market an economic and ethical omniscience unfortunately not possessed by the market economy. Although the American economy has an impressive record by pragmatic test of its ability to increase national output, it does not follow that its ordering of resource allocation represents the apogee of output and efficiency. There are areas in the American economy where its efficiency is under restraint and other areas where the direc
have their tax base raised by the project * * *. The total reduction in net tax revenues in adversely affected taxing districts may be regarded as a project benefit, and may be accounted for as a deduction from tax charges included in associated costs.
“* * * When the benefits of a Federal projects [sic] are evaluated on the basis of the cost of producing similar products from an alternative private source, the estim ate of private costs should include taxes that would be payable. Proper comparison may also be obtained if project costs for given purposes are compared with the charges less taxes for comparable products and services from private sources” (ibid., pp. 30, 31).
Digitized for FRASER http://fraser.stlouisfed.org/ Federal Reserve Bank of St. Louis

700 ECONOMIC GROWTH AND STABILITY
tion of resources seem to falter. The efficiency of the market economy is retarded by various monopoly restrictions of business and labor, by certain subsidies and controls imposed by government, by an institutional background that affects mobility of resources, by less than complete consumer knowledge, which sometimes makes the “consumer sovereignty” doctrine read backward.
But even if the view is accepted that the market economy cannot be excelled in the excellence of its efficiency, we are confronted with the fact that the private market must avoid those activities that are not susceptible to the precept that price must cover cost. The result is well known. Such functions as education, public health, and national defense must be carried on outside the framework of the private market. Moreover, the pattern of resource allocation that results from consumer choice cannot be sanctified with ethical justification. The production arrangements and the distribution of goods and services in the American economy conform to no higher ethical standards than those implicit in the underlying distribution of wealth and income in our society. I t appears strangely inappropriate that the value system of the private market should be accorded such importance in the selection and justification of Federal projects when one of the main functions of government is to initiate or supplement activities that cannot be adequately performed by the market. Such a partial view of the problem of project selection as that presented by the benefit-cost ratio acts as a Procrustean mold to eliminate nonconformity with the decisions of the market economy. To point out the inadequacy of this approach, however, is not to decry the use of economic analysis for project justification. The remedy for this situation is more, not less, economic analysis—but an analysis that does more than mirror the value judgments of the private market. Economic analysis must include a careful consideration of the public interest.
Digitized for FRASER http://fraser.stlouisfed.org/ Federal Reserve Bank of St. Louis