19571105jec fedexpenditure campbell
TRANSCRIPT

FED ERA L EX PEN D ITU R E POLICY FOR H EA LTH , ED U CATION, AND SOCIAL SECURITY
W. Glenn Campbell,1 director of research, American Enterprise Association, Washington, D. C.
Government social-welfare expenditures have grown rapidly during recent decades. They are officially estimated at $7.9 billion in fiscal year 1935, $9.1 billion in fiscal 1940, $23.8 billion in fiscal 1950, $32.5 billion in fiscal 1955 and $34.5 billion in fiscal 1956. Federal funds supplied $14.6 billion or 42 percent of the 1956 total. The remaining 58 percent of the total, $19.9 billion, came from State and local funds. Given the large current increase in OASI benefit payments and the continuing rapid growth in State and local expenditures for public education, government social-welfare expenditures will undoubtedly total some $40 billion in fiscal year 1958.
The largest Federal welfare outlays are for the social-insurance programs which totaled $7.5 billion m fiscal 1956, with $5.5 billion going for OASI benefits alone. Veterans’ programs accounted for $4.5 billion and the various Federal grant-in-aid public-assistance programs totaled $1.5 billion. Other Federal welfare expenditures in fiscal 1956 included $350 million for health and medical services, $235 million for education, $90 million for public housing and $318 million for other welfare programs which include such activities as school lunches and vocational rehabilitation.
However, it would appear from the scattered data available that despite the great growth in tax-supported welfare outlays, private voluntary welfare expenditures have also grown tremendously. Unfortunately, in the words of a recent Social Security Bulletin “information on private spending for social welfare purposes is scattered and incomplete.” I t is to be hoped that the Research and Statistics Division of the Social Security Administration which for years has done such an extensive job of collecting and analyzing data on compulsory welfare expenditures will turn more of its massive fact gathering facilities toward the collection and dissemination of information on voluntary welfare outlays.
1 This paper reflects the views of the author, not necessarily those of the American Enterprise Association.
906
Digitized for FRASER http://fraser.stlouisfed.org/ Federal Reserve Bank of St. Louis

ECONOMIC GROWTH AND STABILITY 907Welfare expenditures, fiscal 1956
[In billions of dollars]
Public Private
Social insurance; death benefits and pensions L................................ .............. 10.6 3.12.8
Health and medical services.......................................................... . . . . _ _ 3.211.8
11.63.8
Assistance, rehabilitation, institutional care, school lunch, etc....................... 4.14.6
3 5.8
.1
* Payments by private insurance carriers and self-insurers required under State disability laws are included in the “Public” total of $10.6 billion.
2 Calendar year 1955.3 Contributions for all philanthropic and religious welfare purposes in 1956.Source: U. S. Department of Health, Education, and Welfare, Research and Statistics Notes, No. 29,
1957, Sept. 3, 1957.
A recent research and statistics note of the Department of Health, Education, and Welfare estimates private welfare expenditures in fields comparable to those covered by the definition of public-welfare outlays at amounts which totaled about $25 billion in fiscal year 1956 as compared with the public-welfare expenditure figure of $34.5 billion. However, even this $25 billion figure gives an incomplete picture of the impact and potential of private provision for what are commonly designated as welfare functions. For example, although public-housing subsidies are included under the Social Security Bulletin definition of public social-welfare expenditures, the many billions expended voluntarily every year by individuals for housing are not classified as private welfare outlays.
R e l a t iv e M a g n it u d e s o f V o l u n t a r y a s C o m p a r e d W i t h C o m p u l s o r y P r o v is io n f o r O l d - A g e a n d S u r v iv o r s B e n e f i t s
Of particular importance is the fact that many private welfare programs are currently undergoing very rapid growth and thus the figures for current benefit payments do not begin to indicate their future importance. For example, employer contributions to private pension and welfare funds totaled $5.7 billion in 1956 as against only $0.3 billion in 1940 and $1.2 billion as late as 1946. Employee contributions average about half the amount contributed by employers. Thus, total employer-employee contributions to private pension and welfare plans must have equaled at least $8.5 billion in 1956. These programs continue to grow at a rapid rate.
Private pension plans covered only 3.7 million persons in 1940 whereas 13.3 million were covered in 1955 and 15 million are currently covered. Reserves of private pension plans are growing at a rate of $2.5 to $3 billion a year and probably total $30 billion at the present time. In the 1955 New York State hearings on welfare and pension funds, Dr. A. A. Berle estimated that private pension reserves would total $80 billion by 1975. This is a sum which is almost four times the present size of the OASI trust fund. When one considers that OASI expenditures exceeded OASI tax revenues during the 1957 fiscal year and that the situation is not likely to improve much in this respect in the next decade or two, this comparison takes on added significance.
Digitized for FRASER http://fraser.stlouisfed.org/ Federal Reserve Bank of St. Louis

908 ECONOMIC GROWTH AND STABILITY
Private pension plans paid out some $725 million in fiscal 1956 as compared to $5.5 billion under OASI. However, from the above facts it is clear that by 1975 private pension benefit payments should be several multiples of their present level and will undoubtedly be a substantially larger percentage of OASI benefit payments than they are at the present time, even after allowance is made for the fact that total OASI benefits will at least double between now and 1975.
Similarly, whereas death-benefit payments under all types of life- insurance policies totaled some $2.4 billion in 1956, life-insurance premium payments amounted to $9.4 billion and income from investments of life-insurance companies equaled $3.1 billion. This latter figure is significant because the major portion of insurance-company reserves are held to assure fulfillment of life-insurance policy contracts. Thus it is clearly obvious that future life-insurance death benefits will be much higher than their present amounts. Life insurance death-benefit payments increased almost 150 percent between 1940 and 1956. I t would seem not unreasonable to estimate that they will increase by another 150 percent in the next 16-year period. Under this assumption life insurance death benefits will equal $6 billion by 1.972. . . . . . . .
Matured endowment policies paid $653 million to policyholders in 1956. Again, this is an increase of almost 150 percent over the amount paid in 1940. Assuming another increase of 150 percent in the next16 years matured endowments will total more than $1.5 billion by i972.
From the above it seems clear that in 15 to 20 years’ time, benefits paid under private programs corresponding to those paid under the Federal old-age and survivors insurance system will, unless present trends are interfered with, play a relatively much more important role than they do at the present time. This is a development which is thoroughly in accord with American traditions of individualism and self-reliance and should be encouraged. This development will be facilitated and perhaps accelerated if Federal expenditures, including welfare outlays, are kept to a minimum so that taxes can be reducea and individuals will be able to keep and voluntarily dispose of more of the income they have earned. They can then set aside voluntarily an even larger percentage of their income than they do at present to provide for retirement and for the needs of survivors.
One way to encourage this desirable trend would be congressional action allowing self-employed individuals to deduct from taxable income amounts set aside for retirement purposes within reasonable limits.
H e a l t h I n s u r a n c e
Voluntary health insurance has had a phenomenal growth since World W ar II . From fiscal year 1949 to fiscal 1956, private health insurance benefit payments increased from 7.4 to 18.9 percent of total personal health care costs whereas during the same period governmental expenditures for health and medical services increased only from 19.4 to 21.4 percent of the total. In fiscal 1956 private insurance benefits covered 24.1 percent of the total private medical bill.
Effective development of hospital expense protection began about 1934. The comparable date for surgical expense protection is 1939 and for regular medical expense protection, 1944. Practically all the
Digitized for FRASER http://fraser.stlouisfed.org/ Federal Reserve Bank of St. Louis

ECONOMIC GROWTH AN® STABILITY 909
growth in major medical expense coverage has taken place during the past 5 years. Even as recently as the end of 1951, relatively few persons were covered by this type of health insurance. From the table it can clearly be seen that the older the program, the more extensive the coverage. Also as one would expect, the newer the program, the greater is the current rate of growth.
Voluntary health insurance coverage[Millions of persons protected]
January194U
Dec. 31, 1953
Dec. 31, 1955
Percentageincrease,1953-55
12 3 97.3 107.7 10.75 4 81.0 91.9 13.53.0 42.7 55.5 30.00 1.2 5.2 333.3
i Ibid., p. 10.Source: Health Insurance Council, The Extent of Voluntary Health Insurance Coverage in the United
States as of Dec. 31,1955, p. 23.
Nearly 108 million Americans, or almost two-thirds of the 166 million population of the United States had voluntary hospital expense protection at the end of 1955. A significant proportion of the 58 million persons without hospital insurance as of this date—such as members of the Armed Forces and persons in prisons, sanitariums, and other public institutions for whom needed hospital and medical care is provided by the Government—do not need it. Further, it is worthy of note that hospital expense coverage, the oldest form of voluntary health insurance, continued to grow at a rate considerably in excess of the population growth rate. All the other newer forms of voluntary health insurance grew at even faster rates. Thus the gaps in the Nation’s health insurance coverage continued to diminish. The rate of increase in hospital expense coverage during 1955 was 6.1 percent whereas the civilian population of the United States increased only 1.9 percent.
The voluntary health insurance record becomes all the more significant when it is remembered that up to very recently many persons who either had no confidence in or did not wish the voluntary approach to the problem of providing adequate health services to succeed, were asserting that two-thirds of the population could not afford private health insurance. Another view frequently expressed is that perhaps voluntary insurance will be able to do a tolerably acceptable job of protecting most of the population against the costs of the more usual type of noncatastrophic hospitalization and surgical expense but that because of the cost factor and for other reasons it will not be equal to the task of providing protection against unusually costly illnesses and injuries. The extremely rapid recent growth of major medical expense policies seems effectively to be disposing of this fear.
Currently concern seems to be centering more on the special medical problems of the aged. I t is, of course, well known that medical care costs are higher for the older persons in society. I t is also a fact that voluntary health insurance coverage is much less extensive for persons over 65 than under 65. Health Information Foundation data
97735— 57-------59Digitized for FRASER http://fraser.stlouisfed.org/ Federal Reserve Bank of St. Louis

910 ECONOMIC GROWTH AND STABILITY
for 1953 showed that whereas more than 60 percent of the population was covered by some form of medical insurance, only 30 percent of those aged 65 or over had such protection.
The principal explanation for this situation is that until recently so many health-insurance plans limited coverage to persons below a certain age because of the cost factor. However, this situation is rapidly changing and more and more plans offer continuation of coverage regardless of age. Blue Cross-Blue Shield plans typically allow retiring persons to convert their group coverage to an individual “left employ” contract. For obvious cost reasons an older person frequently has to pay a higher premium rate and/or is eligible for fewer benefits than a younger person.
There are good reasons for feeling that the problem of limited health insurance coverage of older persons is largely a temporary one. W ith few exceptions the vast majority of the working population is now covered by health insurance, particularly by hospital and surgical insurance. Now that it is becoming more and more the practice to allow continuation of coverage regardless of age, it would seem that in another decade or two, when in terms of the current labor force the voluntary health insurance programs should have fully matured, most aged people will also have health insurance protection. Experimental health insurance policies open only to individuals already 65 years and over are also currently being pioneered by some midwestern insurance companies.
Another promising approach to the problem of insuring people against the higher medical costs of old age is more extensive use of the funding principle. By this means the cost of old-age medical care is spread over the entire productive life of an individual by accumulating through regular contributions in earlier years part or all of the sum necessary to meet costs in later years. This eliminates the necessity either to raise the premium rates or limit the benefits for older people. In fact, if a sufficient reserve is accumulated, no premium payments would be required after a certain age.
I m p l ic a t io n s f o r F e d e r a l L e g is l a t iv e P o l ic y i n t h e F ie l d s o f H e a l t h a n d S o c ia l S e c u r i t y
The necessarily brief preceding review of welfare activities points up at least one very pertinent fact in terms of legislative policy implications. This is the remarkable growth pattern of private welfare activities and expenditures during the last decade and the tangible evidence indicating the continuation and, more likely, the acceleration of the upward trend in the private sector.
Given this fact, it becomes highly pertinent to question seriously the desirability or the necessity at the present time either to increase the benefit levels under the old-age and survivors and disability insurance system or to increase the taxable wage base.
In the field of providing health services for elderly persons, encouraging progress is being made via the voluntary route. Congress should give the insurance industry and the medical profession a chance to work this problem out through traditional methods rather than institute a costly compulsory system with all its attendant damage to the effective practice of medicine.
Digitized for FRASER http://fraser.stlouisfed.org/ Federal Reserve Bank of St. Louis

ECONOMIC GROWTH AND STABILITY 911
OASI expenditures currently equal or exceed OASI tax revenues. In short, the program is on a pay-as-you-go basis and it gives every indication of remaining in this status for some time to come. Thus, it is now clear that basically our social security system is one under which today’s working population pays taxes in order to provide benefits to retired persons and survivor beneficiaries. No longer is it possible to increase existing social security benefits or to add to benefits without raising the tax rates imposed on the working population. Every increase in the social security tax makes it that much more difficult for a working person to provide for his own and his family’s health and retirement needs. _
Under one well-known proposal to increase social security expenditures, benefits paid to current beneficiaries would be increased some 10 percent, benefits paid future beneficiaries would be increased more than this as a result of increasing the earnings base from $350 to $500 a month and hospital, nursing home and surgical benefits would be provided to OASI beneficiaries. To finance this program the taxable wage base would be increased from $350 to $500 a month (from $4,200 to $6,000 annually) and the social security tax rate would be increased by y2 percent for both employer and employee and by % percent for the self-employed.
A t present the maximum social security tax for an employee is $94.50 and is paid by a person with an income of $4,200 a year and above. Under this proposal the $4,200 individual would pay $21 a year more in social security tax. A worker making $6,000 a year would pay a total of $165 or $70.50 additional in social security tax. These tax increases would not be paid by a small number of people. Given the current level of wages in the United States, many, many millions of wage earners would have their social security taxes increased somewhere between $21 and $70.50 a year. Even a comparatively low paid worker making $3,000 a year would have his social security tax increased by $15 a year. Let us compare this with the amount that a married person with two children would save in income taxes if the Federal income tax should be cut by 10 percent. This, of course, is on the assumption that Federal expenditures can be reduced sufficiently so that an income tax cut is justified. A $3,000 a year man with a wife and two children currently pays $65 in Federal income tax. A $4,200 a year man pays $281 and a $6,000 a year man pays $600. A 10 percent cut in the Federal income tax would mean a tax reduction of $6.50, $28.10 and $60.00 respectively. In each case this would be approximately equal to the proposed increase in social security tax and thus the income tax reduction would be nullified.
: Now that OASI coverage is virtually universal the time has arrived when at least a start should be made toward getting the Federal Government out of the old-age assistance field. When the Social Security Act was under consideration in 1935, President Roosevelt recommended in connection with old-age assistance that “the Federal Government assume one-half the cost of the old-age pension plan, which ought ultimately to be supplanted by self-supporting annuity plans.” I t must, of course, be assumed that by “self-supporting annuity plans” the President had clearly in mind the extension of the OASI system to near universality of coverage. His definition of “self-supporting” must have had reference to the concept of a retire
Digitized for FRASER http://fraser.stlouisfed.org/ Federal Reserve Bank of St. Louis

912 ECONOMIC GROWTH AND STABILITY
ment benefit system supported entirely through the levy of earmarked taxes on employer, employee, and the self-employed. While it is true that at present may elderly people are not eligible for OASI benefits, virtually every working person currently reaching retirement age is eligible.
Congress should eliminate Federal old-age assistance to States for individuals who are also receiving Federal OASI benefits. As of December 1956,560,000 OASI beneficiaries also received old-age assistance. Under this approach Federal old-age assistance grants would continue to be made to States for individuals not receiving Federal OASI benefits.
The Federal Government fulfills its responsibilities to the aged by the provision of OASI benefits. Public assistance is traditionally a State and local function. Whatever extra resources over and above OASI benefits and personal savings an elderly individual needs can be provided by States and localities.
I f Congress feels that it does not wish to eliminate Federal grants to the States for individuals who are currently receiving both OASI and OAA, at the very least it should adopt a policy of not making Federal old-age assistance grants available to new double beneficiaries. In either case the result would be to make the Federal old-age assistance program in fact as it is already in theory a temporary one which would gradually disappear.
E d u c a t io n
A larger percentage of our population is going through formalized education for a greater number of years than ever before in our history or than in any other country in the world. One-fourth of the population is enrolled in schools. More than four-fifths of our youth attend high school; about one-third enter college. In most European countries only 10 to 15 percent of the youth attend secondary schools and barely 5 percent go to college. The World Survey of Education by the United Nations in 1955 showed no country with a lower illiteracy rate than the United States.
Percentage of school enrollment in selected age groups in 1956Percent enrolled Percent enrolled
Age group: school Age group—Continued in school 5 58. 9 14 to 17___________________ 88.2 6 97.0 18 to 19__________________ 35.47 to 13---------------------------- 99.3 20 to 24___________________ 12. 8
Source: U. S. Bureau of the Census, Current Population Reports, series P-20, No. 74.Enrollment in public educational institutions has barely kept up
with the population increase over the past half century, but enrollment in nonpublic schools has grown more rapidly. As a result, the ratio of public school enrollment to nonpublic school enrollment was cut in half between 1900 and 1956—from a ratio in excess of 10 to 1 to a ratio of less than 5 to 1.
Digitized for FRASER http://fraser.stlouisfed.org/ Federal Reserve Bank of St. Louis

ECONOMIC GROWTH AND STABILITY 913
Population and school enrollment, 1900 and 1956
Year
Population
residing in United States (thousands)
Enrollment in public education
Enrollment In nonpublic education
Total enrollment
Thousands
Percent of popu
lationThousands
Percent of popu
lationThousands
Percent of popu
lation
1900.............. ................. ............. 76,094 167,091
120
15,700 34,338
119
20.620.5
1,499 7,028
369
2.04.2
17,19941,366
141
22.624.71956—.........................................
N o t e .—The U. S. Bureau of the Census showed school enrollment In October 1956 at 39,353,000 (Current Population Reports, series 20, N o . 74). Office of Education data relate to enrollment during the entire school year.
Source: Population: U. S. Bureau of the Census, Statistical Abstract of the United States, 1957. Enrollment, 1903: U. S. Office of Education, Biennial Survey of Education, 1953-54; 1956: U. S. Office of Education, Releases Mar. 25 and Aug. 17,1957.
Next to national defense, education is by far the largest item of public expenditure in the United States. The cost of education is growing rapidly. In fact, the increase in education expenditures during the past 4 years has exceeded half the total increase in all governmental expenditures in the United States.
Almost all of the costs of public education are borne by the State and local governments. Most of the Federal contributions to education were initiated or are made primarily for other purposes, for example, veterans educational benefits, payments to local governments in federally affected areas in lieu of payment of property taxes, school lunch and milk programs, education of Indians on tribal reservations, and training for the Federal service or of children of Federal employees in areas where public schools are not available. Other educational expenditures arise from the Federal responsibility for the District of Columbia and the Territories, a small contribution originated in 1862 to promote the establishment of colleges for the agriculture and mechanic arts and grants-in-aid to the States for vocational education, started during World W ar I.
Proposals for broad Federal support of public education have been introduced in Congress at various times over the past 85 years. However, in keeping with the intent of the Constitution and the strong tradition of State and local responsibility for and control of education, no such proposal has ever been enacted.The school-financing record of States and localities
Education has fared well under State and local responsibility. Enrollment in public institutions has multiplied 2.2 times since the turn of the century; but expenditures for public education have multiplied17 times in constant dollars. In terms of the national income, expenditures for public education have risen from 1.5 percent in 1902 to 4.4 percent in 1956. Since, contrary to common belief, the percentage of the population enrolled in public education has remained stable, the increase in the percentage of national income for education reflects a broadening and enrichment of the programs and a growing recognition of the importance and needs of education by the American people.
Digitized for FRASER http://fraser.stlouisfed.org/ Federal Reserve Bank of St. Louis
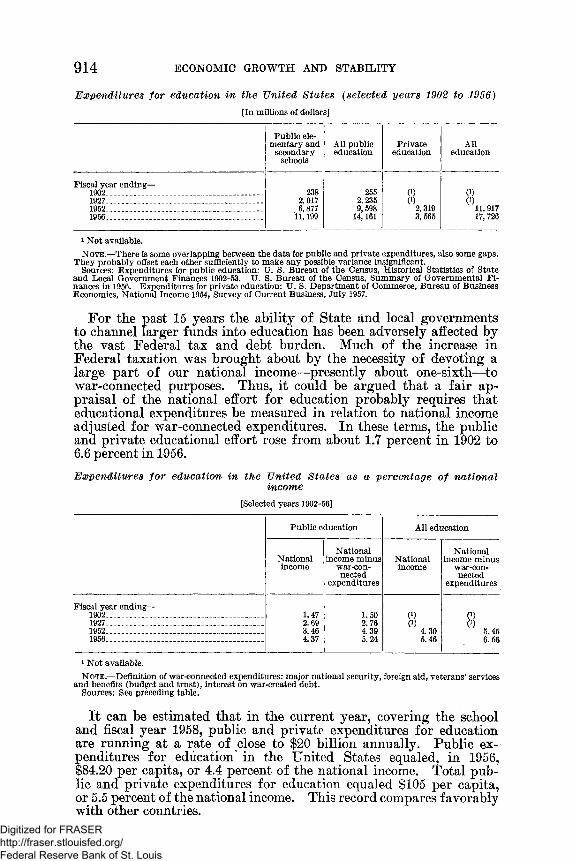
914 ECONOMIC GROWTH AND STABILITY
Expenditures for education in the United States (selected years 1902 to 1956)[In millions of dollars]
Public elementary and
secondary schools
All public education
Privateeducation
AHeducation
Fiscal year ending-1902__________________________ _____ 238 255 0) 0)1927_________________________________ 2,017 2,235 0) (0
11,9171952..................................................... ............. 6,877 11,199
9,598 14,161
2,3191956 .................................. 3,565 17,726
i Not available.N o t e .—There is some overlapping between the data for public and private expenditures, also some gaps.
They probably offset each other sufficiently to make any possible variance insignificant.Sources: Expenditures for public education: U. S. Bureau of the Census, Historical Statistics of State
and Local Government Finances 1902-53. U. S. Bureau of the Census, Summary of Governmental Finances in 1956. Expenditures for private education: U. S. Department of Commerce, Bureau of Business Economics, National Income 1954, Survey of Current Business, July 1957.
For the past 15 years the ability of State and local governments to channel larger funds into education has been adversely affected by the vast Federal tax and debt burden. Much of the increase in Federal taxation was brought about by the necessity of devoting a large part of our national income—presently about one-sixth—to war-connected purposes. Thus, it could be argued that a fair appraisal of the national effort for education probably requires that educational expenditures be measured in relation to national income adjusted for war-connected expenditures. In these terms, the public and private educational effort rose from about 1.7 percent in 1902 to6.6 percent in 1956.Expenditures for education in the United States as a percentage of national
income[Selected years 1902-56]
Public education All education
Nationalincome
National income minus
war-connected
expenditures
Nationalincome
National income minus
war-connected
expenditures
Fiscal year ending-1902 ________________________________ 1.47 1.50 0)
0)4.30
0)0)
5.451927______________ _________ _________ 2.69 2.761952_________________________________ 3.46 4.391956___ ____ _____________ __________ 4.37 5.24 5.46 6.56
1 Not available.N o t e — Definition of war-connected expenditures: major national security, foreign aid, veterans’ services
and benefits (budget and trust), interest on war-created debt.Sources: See preceding table.
I t can be estimated that in the current year, covering the school and fiscal year 1958, public and private expenditures for education are running at a rate of close to $20 billion annually. Public expenditures for education in the United States equaled, in 1956, $84.20 per capita, or 4.4 percent of the national income. Total public and private expenditures for education equaled $105 per capita, or 5.5 percent of the national income. This record compares favorably with other countries.
Digitized for FRASER http://fraser.stlouisfed.org/ Federal Reserve Bank of St. Louis

UNESCO has published the following data for other major countries (mostly for 1953) :
ECONOMIC GROWTH AND STABILITY 915
Educational expenditures in selected countries
Per capitaPercent of national income
Canada....... ................................................................................................... $28.73 24.31
2.55 2.96
15.74 2.2516.10 3.5022.87 2.5615.66 1.74
Source: UNESCO: Financing of Education, 1955.
Educational expenditures of the Soviet Union are listed by UNESCO at $91.06 per capita, converting the ruble at the highly artificial exchange rate of $0.25. However, the true value of the ruble is actually less than 10 cents and per capita expenditures thus equal less than $36.42. I t is not known what part of the education item in the Soviet budget is used for political education and propaganda. Nor can a reliable percentage of national income figure be established.
In most countries the major part of the cost of education is borne by the national government. Private education, which absorbs 1 percent of the national income in the United States, is relatively insignificant in each of the other countries mentioned above.
I t can be assumed that educational expenditures, measured per capita or as percent of national income, have risen in those countries since 1953. Even so, it is evident that education receives considerably more support, both in per capita terms and as percent of national income, in the United States than in countries where financial responsibility for education rests upon the national government.
In the United States education has been doing much better—- financially and staff-wise—under State and local responsibility than most of the other public services, many of which receive Federal subsidies. The particulars are shown in the following table.School enrollment, State and local expenditures, and State and local employees,
1940 and 1956
Year
Enrollment in public schools,
colleges and universities
Expenditures(millions)
Employees (thousands)
For education
For all other
purposesSchool
Nonschool
1940_________________________________________ 26,394,000 $2,638 6,371
13,220 108
$6. 591 15.917 23,491
48
1,320 2,026
1956 _________ ____ . . . . . . „ - - 34,312,000 30
2,283 73
2,99248
1 Adjusted by “implicit price deflator” for State and local government purchases of goods and services, U. S. Department of Commerce, Office of Business Economics.
Source: U. S. Bureau of the Census: Historical Review of State and Local Government Finances, 190253; State Distribution of Public Employment in 1956: Summary of Governmental Finances in 1956. Enrollment: U. S. Office of Education, Biennial Survey of Education, and 1957 releases.
I t appears that the staff-student ratio in public educational institutions declined from 1:20 to 1:15 between 1940 and 1956.
Digitized for FRASER http://fraser.stlouisfed.org/ Federal Reserve Bank of St. Louis
916 ECONOMIC GROWTH AND STABILITY
The foregoing tables show that education has done relatively better than other public services in the United States and is doing better than education in other countries of the world.
However, it is known that certain educational shortcomings exist, particularly in the public-school system, which usually are being blamed on lack of adequate financing.Are there shortages of teachers and classrooms?
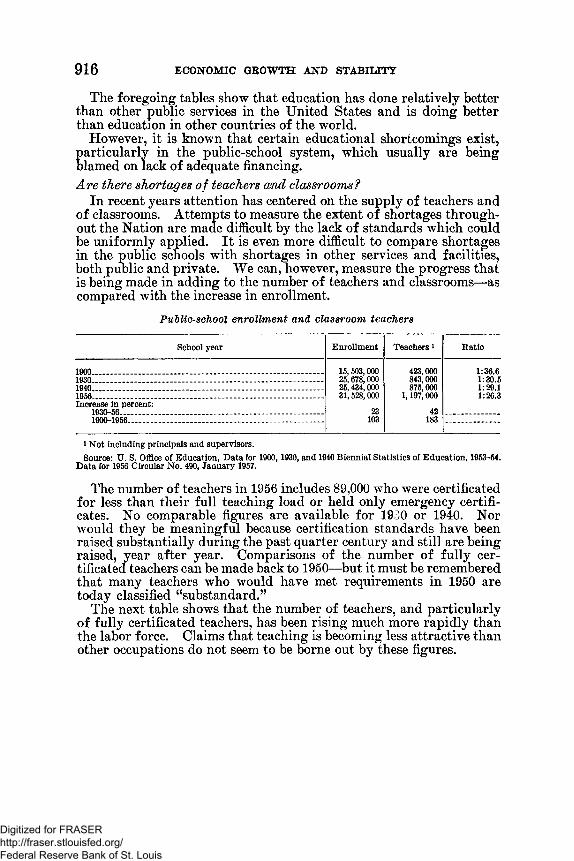
In recent years attention has centered on the supply of teachers and of classrooms. Attempts to measure the extent of shortages throughout the Nation are made difficult by the lack of standards which could be uniformly applied. I t is even more difficult to compare shortages in the public schools with shortages in other services and facilities, both public and private. We can, however, measure the progress that is being made in adding to the number of teachers and classrooms—as compared with the increase in enrollment.
PuMic-school enrollment and classroom teachers
School year Enrollment Teachers1 Ratio
1900 ............................................................................................... 15.503.00025.678.00025.434.00031.528.000
23103
423.000843.000875.000
1,197,000
42183
1:36.61:30.51:29.11:26.3
1930 ..................................................................................................1940 ................................................................................................1956...................................................................................................Increase in percent:
1930-56 ....................................................................................1900-1956 ........................................................................
i Not including principals and supervisors.Source: U. S. Office of Education, Data for 1900,1930, and 1940 Biennial Statistics of Education, 1953-54.
Data for 1956 Circular No. 490, January 1957.
The number of teachers in 1956 includes 89,000 who were certificated for less than their full teaching load or held only emergency certificates. No comparable figures are available for 1930 or 1940. Nor would they be meaningful because certification standards have been raised substantially during the past quarter century and still are being raised, year after year. Comparisons of the number of fully certificated teachers can be made back to 1950—but it must be remembered that many teachers who would have met requirements in 1950 are today classified “substandard.”
The next table shows that the number of teachers, and particularly of fully certificated teachers, has been rising much more rapidly than the labor force. Claims that teaching is becoming less attractive than other occupations do not seem to be borne out by these figures.
Digitized for FRASER http://fraser.stlouisfed.org/ Federal Reserve Bank of St. Louis
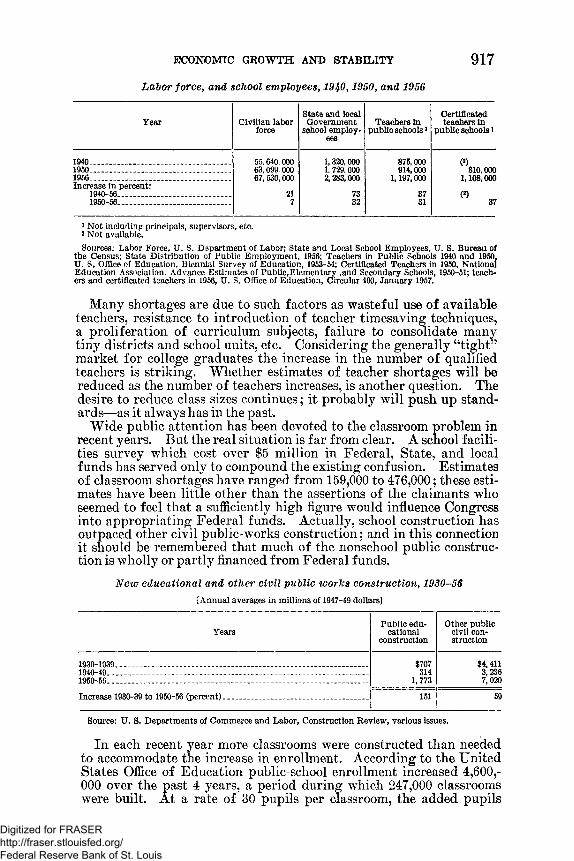
Labor force, and school employees, 1940,1950, and 1956
ECONOMIC GROWTH AND STABILITY 917
Year Civilian labor force
State and local Government
school employees
Teachers in public schools1
Certificated teachers in
public schools1
1940.......................... .................. ............... 55.640.00063.099.000 67, 530,000
217
1.320.000 1. 729.0002.283.000
7332
875.000914.000
1,197,000
3731
V)810,000
1,108,000
(a)37
1950............................................................1956............................................................Increase in percent:
1940-56................................................1950-56.............. ................— ...........
i Not including principals, supervisors, etc.8 Not available.Sources: Labor Force, U. S. Department of Labor; State and Local School Employees, U. S. Bureau of
the Census; State Distribution of Public Employment, 1956; Teachers in Public Schools 1940 and 1950. U. S. Office of Education, Biennial Survey of Education, 1953-54; Certificated Teachers in 1950, National Education Association. Advance Estimates of Public.Elementary ,and Secondary Schools, 1950-51; teachers and certificated teachers in 1956, U. S. Office of Education, Circular 490, January 1957.
Many shortages are due to such factors as wasteful use of available teachers, resistance to introduction of teacher timesaving techniques, a proliferation of curriculum subjects, failure to consolidate many tiny districts and school units, etc. Considering the generally “tight” market for college graduates the increase in the number of qualified teachers is striking. Whether estimates of teacher shortages will be reduced as the number of teachers increases, is another question. The desire to reduce class sizes continues; it probably will push up standards—as it always has in the past.
Wide public attention has Deen devoted to the classroom problem in recent years. But the real situation is far from clear. A school facilities survey which cost over $5 million in Federal, State, and local funds has served only to compound the existing confusion. Estimates of classroom shortages have ranged from 159,000 to 476,000; these estimates have been little other than the assertions of the claimants who seemed to feel that a sufficiently high figure would influence Congress into appropriating Federal funds. Actually, school construction has outpaced other civil public-works construction; and in this connection it should be remembered that much of the nonschool public construction is wholly or partly financed from Federal funds.
New educational and other civil public works construction, 1930-56[Annual averages in millions of 1947-49 dollars]
YearsPublic edu
cational construction
Other public civil construction
1930-1939....................... ..................... ............. ........... ........................ ......... $707 $4,4113,236 7,020
1940-49______________________________ -________________________ 314_ ____________________________________ 1,773
151 59
Source: U. S. Departments of Commerce and Labor, Construction Review, various issues.
In each recent year more classrooms were constructed than needed to accommodate the increase in enrollment. According to the United States Office of Education public-school enrollment increased 4,600,000 over the past 4 years, a period during which 247,000 classrooms were built. A t a rate of 30 pupils per classroom, the added pupils
Digitized for FRASER http://fraser.stlouisfed.org/ Federal Reserve Bank of St. Louis

918 ECONOMIC GROWTH AND STABILITY
would have needed 153,000 classrooms; 93,700 classrooms were available to reduce class size or to replace older buildings.
I t can be estimated that presently about 42 percent of all children are attending school in classrooms built since the end of World W arII. I f construction continues for the next 10 years to increase at only half the rate it has been increasing for the past 5 years, more than three-fourths of all children will be going to school in postwar buildings. The question may be raised—and is being argued in many communities—whether we can afford to retire a large part of our existing school plants at a time of unprecedented increase in enrollment.
Some States and communities are making rapid progress in meeting existing shortages. Others are lagging behind. A number of factors have been and are delaying school construction:
1. The excessive burden of Federal taxes, which makes it d ifficult for State and local governments to boost their own taxes and debts at a more rapid ra te ;
2. The promise of Federal school aid, held out year after year, which has caused some communities to postpone building plans in the hope of being able to get their school for 50 cents on the dollar;
3. The fear of being forced to integrate newly built schools, which has caused some southern communities to delay construction plans.
Methods by which the Federal Government can advance school construction include:
1. A reduction in Federal expenditures and taxes, which will enable State and local governments to boost their own levies.
2. A clear statement that further waiting for Federal school aid is futile and will injure the children in those communities which have been holding out for some of the promised “free” money.
Implications for Federal legislative 'policyFurther pursuit of proposals for Federal school aid are likely to
work to the detriment of education. Amounts of $300 million to $400 million a year, as suggested in recent legislation, are insignificant in the field of public-school education in which State and local governments are spending $13 billion a year and increasing their contribution at the rate of about $1 billion a year. But such an aid program, whether enacted or merely considered each year, induces numerous communities to delay their building programs.
I f Federal aid were raised to several billion dollars a year, as has been suggested by many people, Federal control of education would inevitably follow, sooner or later.
A number of existing Federal grant-in-aid programs for educational purposes could be gradually reduced and eliminated. This applies particularly to the nondefense part of vocational education, to the cash part of the school lunch and milk programs, and to aid for the colleges for the agriculture and mechanic arts. There is also a strong case for replacing the program of payments to school districts in federally affected areas with a system of payments in lieu of taxes to local governments where property has been removed from local tax rolls and where special burdens are being imposed on communities.
Digitized for FRASER http://fraser.stlouisfed.org/ Federal Reserve Bank of St. Louis