19 june 2019 ren21 secretariat gsr@ren21 · 260 million electric two-wheelers and 40 million...
TRANSCRIPT

19 June 2019REN21 [email protected]

REN21 is an international policy network of passionate players dedicated to building a sustainable renewable energy future.
Industry Associations:AMDA, ARE, ACORE, ALER, APREN,CREIA, CEC, EREF, GOGLA, GSC, GWEC,IREF, IGA, IHA, RES4MED, WBA, WWEA
Science & Academia:AEE INTEC, Fundacion Bariloche,
IIASA, ISES, NREL, SANEDI, TERINGOs: CAN-I, CCA, CLASP, Club-ER, CEEW, Energy Cities, FER, GFSE, Global 100% Renewable Energy, Greenpeace International, GWNET, ICLEI, IEC, ISEP, JVE, MFC, Power for All, REEP, REI, SCI, SLoCaT, WCRE, WFC, WRI, WWF
Inter-governmental Organisations:ADB, APERC, ECREEE, EC, GEF, IEA,
IRENA, IsDB, RCREEE, UNDP, UN Environment, UNIDO, World Bank
Governments:Afghanistan, Brazil, Denmark,
Germany, India, Mexico, Norway, South Africa, Spain, UAE, USA

Evidence and knowledge to shape the global energy debate
Global Status Report:yearly publication since 2005
Renewables in CitiesStatus Report:
Regional Reports Global Futures Reports
Thematic Reports

The report features:
01. Global Overview
02. Policy Landscape
03. Market & Industry Trends
04. Distributed Renewables for Energy Access
05. Investment Flows
06. Energy Systems Integration and Enabling Technologies
07. Energy Efficiency
08. Feature: Renewable Energy in Cities
Renewables Global Status Report
Collaborative annual reporting since 2005 building on international expert community.

➜ Total global capacity rose 8% in 2018
• 2,378 GW capacity including hydropower
➜ Non-hydro capacity grew 15%
• 1,246 GW by the end of 2018
➜ 181 GW of renewable power additions led by
• Solar PV with 100 GW (55% of new additions)
• Wind power: 51 GW (28%)
• Hydropower: 20 GW (11%)
➜ Global reach of renewable power:
• over 90 countries have more than 1 GW
• over 30 countries have more than 10 GW
Another strong year for renewable energy

➜ Global investment in renewable power and fuels totalled USD 288.9 billion, a decrease of 11.5%
• Fall driven mainly by China
➜ Fifth consecutive year in which investment topped USD 280 billion
➜ Investment in developing and emerging countries exceeded that in developed countries for the fourth consecutive year
Investment in renewable energy fell in China, rose elsewhere

➜ Investment varied by region:
• Rising in Asia, Europe, the Middle East and Africa, and the United States
• Falling in the Americas, China and India
➜ China accounted for majority of investment despite the decline in its market (32%)
Investment also declined in India, but rose in the rest of Asia

➜ Renewables supplied an estimated 26.2% of global electricity at the end of 2018
➜ For the first time, more electricity was from solar PV than bio-power
➜ Strong growth in renewable generation, but rising electricity demand (up 4% in 2018) makes it challenging to achieve larger share
Power sector leading: Renewables supply more than 26% of global electricity

➜ Renewable energy is now more than 33% of global installed power generating capacity
➜ Within renewable capacity, hydropower (1,132 GW) no longer makes up half of installed capacity
➜ Wind power (592 GW) accounts for 25% and solar PV (505 GW) covers over 21%
➜ Remaining 6% of bio-power, geothermal power, CSP and ocean
Renewable power now makes up over one-third of global capacity

➜ Around 55% of these new additions were solar PV
➜ Added in 2018:
• 100 GW of solar PV
• 51 GW of wind power
• 20 GW of hydropower
• 10 GW of bio-power, CSP and geothermal power
➜ 2018 was the 4th consecutive year that more than 50 GW of wind power was added
181 gigawatts of renewable power added in 2018

➜ In 2018, nearly twice as much renewable power capacity added as all other sources, the highest share ever
➜ Fourth consecutive year that net additions of renewable power were more than 50%
➜ 2011 was the last year that clearly more non-renewable capacity was added than renewable
More renewable power capacity added than fossil fuel and nuclear power

➜ Solar PV capacity additions were more than 100 GW for the first time
➜ Cumulative capacity reached 505 GW, an increase of 25% from 2017
Solar PV capacity additions pass 100 GW mark in 2018

➜ Asia added the most capacity for the 6th year in a row, followed by the Americas
➜ China accounted for 45% of global additions
➜ The top 5 markets accounted for three-quarters of newly installed capacity
Asia the main world market for solar PV for sixth consecutive year

➜ In 2018, installed capacity of Floating PV crossed the 1 GW mark
➜ Floating PV systems exist in at least 29 countries in nearly every world region
➜ Top markets include China, Japan, Republic of Korea, Chinese Taipei, and UK
Floating solar PV cumulative capacity passes 1 GW mark

➜ The additions in 2018 pushed cumulative capacity up 9% to 591 GW
➜ Of the 51 GW added, nearly 47 GW was onshore and 4.5 GW was offshore
➜ This was the fifth consecutive year with annual additions exceeding 50 GW, but also the third year of decline following the peak in 2015
Wind power capacity continues to increase steadily year-on-year

➜ By the end of 2018, 17 countries had offshore wind capacity
➜ The United Kingdom leads with 8 GW of installed capacity
➜ In 2018, seven countries in Europe and two in Asia connected 4.5 GW, increasing global cumulative capacity 24%
➜ Europe accounts for about 79% of global capacity
Success of offshore wind in Europe has sparked interest elsewhere

➜ Bio-power capacity increased 6.5% in 2018
➜ Bioelectricity generation increased 9%, most rapidly in China
➜ EU remains largest generator by region
➜ Top countries were China, Brazil, Germany, India, UK, and Japan
Bio-power continues trends from previous years

➜ 20 GW were added to reach a total of 1,132 GW by end-2018
➜ China represented more than 35% of new installations, followed by Brazil, Pakistan, and Turkey
➜ Generation estimated at 4,210 TWhin 2018
Hydropower characterised by market stability
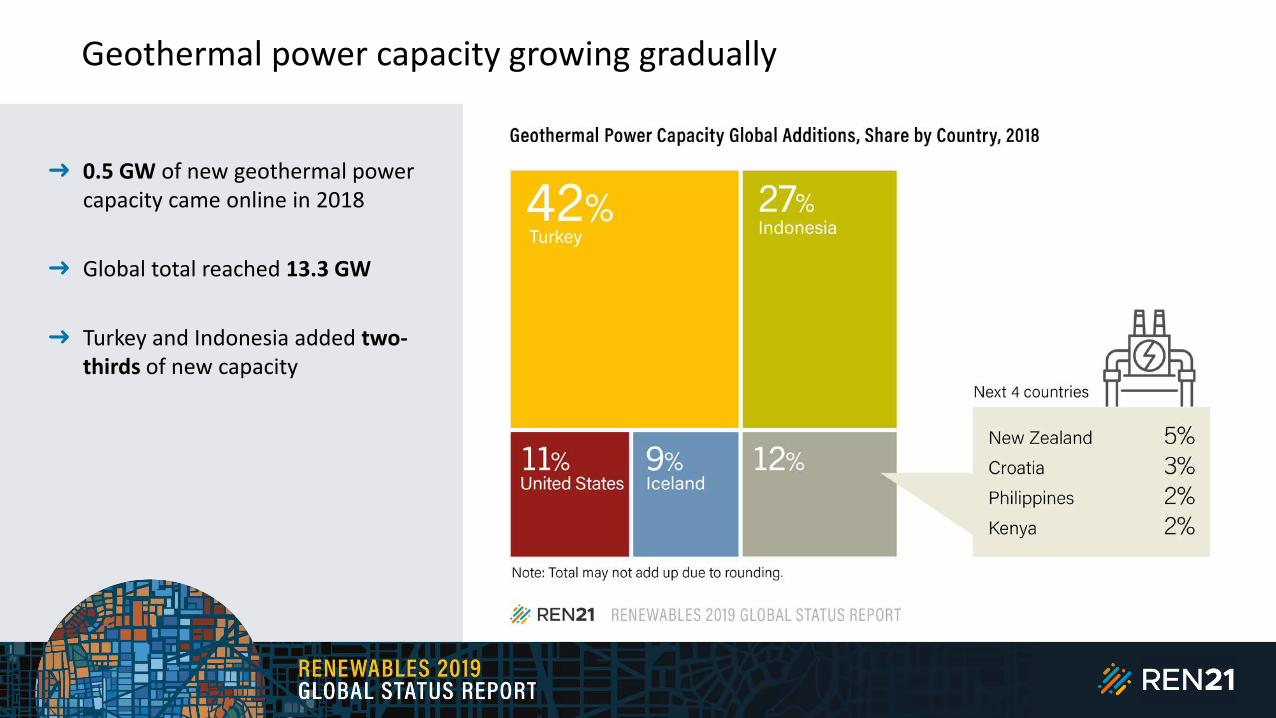
➜ 0.5 GW of new geothermal power capacity came online in 2018
➜ Global total reached 13.3 GW
➜ Turkey and Indonesia added two-thirds of new capacity
Geothermal power capacity growing gradually

➜ Modern renewable energy accounted for 10.6% of final energy demand in 2017.
➜ Considering traditional biomass, renewable energy covered 18.1% of final energy demand
➜ Modern bioenergy contributed 5% to total final energy consumption
➜ Growing at a rate of 9% per year in electricity sector, 7% in transport, 1.8% in heat
Modern renewables slowly gaining ground in final energy demand

➜ Modern renewables account for just 10% of heating and cooling demand
• Demand growth is minimal (1.8%/year)
➜ Lack of policy support in the sector
• Number of countries with regulatory policies fell from 21 to 20
• Only 47 countries had targets for RHC
➜ Bio-heat provides majority but integration with power sector is key
Renewables in heating and cooling increasing very slowly

➜ Cumulative global operating capacity for solar water heating collectors increased 2% to reach 480 GWth
➜ The majority of this capacity is glazed collectors
➜ The 2018 increase of 8 GWth is the smallest in the last ten years
Growth rate slows for solar water heating capacity additions

➜ Global energy demand in transport increased 45% since 2000
➜ Transport accounts for 23% of global CO2 emissions
➜ The renewable share of transport grew slightly to 3.3%
➜ Biofuels make up majority of renewable contribution, but sector increasingly open to electrification
Biofuels and EVs growing but renewable share in transport remains low

➜ 260 million electric two-wheelers and 40 million electric three-wheelers
➜ More than 2 million electric cars(inc. battery EV and plug-in hybrid EV) were sold in 2018 (+68%)
➜ China had nearly 50% of global stock, followed by US at 22%
➜ EV markets highly concentrated: 40% of all EVs were in just 20 cities
➜ Share of RE power: around 25%
Electric passenger vehicle stock grew over 60%

➜ EVs can play a role in increasing renewables in transport when powered by renewable electricity
➜ Only 1 country with policy support directly linking renewables and EVs
➜ At least 49 countries have independent targets for renewable electricity and EVs
Little direct linking of EVs and renewables
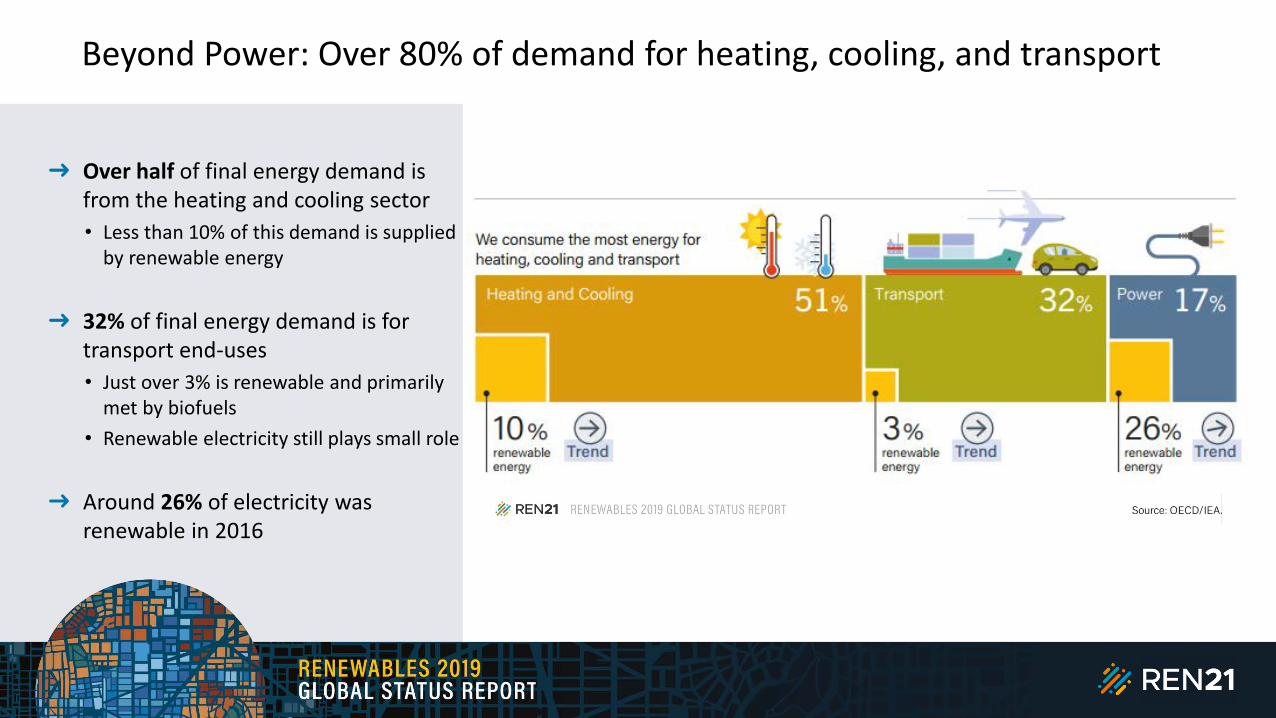
➜ Over half of final energy demand is from the heating and cooling sector
• Less than 10% of this demand is supplied by renewable energy
➜ 32% of final energy demand is for transport end-uses
• Just over 3% is renewable and primarily met by biofuels
• Renewable electricity still plays small role
➜ Around 26% of electricity was renewable in 2016
Beyond Power: Over 80% of demand for heating, cooling, and transport

➜ Renewable power auctions were held in at least 48 countries
➜ FITs in place in 111 countries
➜ No new countries adopted biofuels mandates
➜ The number of countries with H&C regulatory policies fell by 1
Advances in power made possible by policy support, other sectors lacking

➜ Targets in the power sector remain more ambitious, more numerous than in heating and cooling and transport
➜ Fewer than 10 countries and states/provinces had economy-wide targets for at least 50% renewable energy
➜ Still only 1 country with a target for 100% renewables in total final energy
Targets uneven across sectors

➜ At least 54 carbon pricing initiatives implemented by end-2018
• 27 emission trading systems
• 27 carbon taxes
• Covering 44 countries
➜ Covering only 13% of global greenhouse gas emissions
Carbon pricing slowly expanding

➜ Global subsidies for fossil fuel consumption reached an estimated USD 300 billion in 2017
• an 11% increase from the year before
• about double the estimated support for renewable power generation
➜ Fossil fuel subsidies remained in place in at least 115 countries in 2017
➜ 73 countries provide subsidies of more than USD 100 million each
Not a level playing field: Fossil fuel subsidies are still widespread

A sustainable energy future requires stronger policy action now

Which countries led the way in 2018?

Who were the renewable energy leaders at the end of 2018?

➜ Renewable energy sector employed around 11 million people worldwide in 2018
➜ Solar PV was again the largest employer of all renewable energy industries
➜ The largest employer remained China, followed by the EU, Brazil, US, and India
Jobs in renewable energy increase again in 2018

➜ Largest regional wind power market, with a total added capacity exceeding 262 GW, for 10th consecutive year
➜ Increasing number of people are employed in off-grid solar and biofuels
➜ Asia-Oceania (excluding China and India):
• accounted for 15% of total renewables investment globally
• investment increased 6% to USD 44.2 billion, the highest in 3 years
• largest percentage increase in R&D
➜ 91% of population in developing Asia have access to electricity
Where is Asia leading?

➜ All regions of the world showed some improvement in the energy intensity of their economic activities between 2012 and 2017
➜ Asia (led by China) had the most marked decline in energy intensity during the period – an annual average drop of 3.6%
➜ Global primary energy intensity decreased more than 10% between 2012 and 2017
Asia is leading the global decrease in primary energy intensity

➜ Collectively, energy demand in member countries of the OECD reached a historical peak in 2007
➜ In China, energy demand fell slightly in 2016 – its first decline since 1997 – before reaching a new high in 2017
Energy demand in non-OECD countries continues to rise

➜ Between 2012 and 2017, global average electricity consumption per household grew 0.7% annually, but this growth varied widely by region
➜ Household electricity demand rose most rapidly in Asia (average annual growth of 3.7%)
➜ Oceania, Europe and North America saw a decrease in demand
Global household electricity consumption increases in 2017

➜ In 2017:
• 13% of the global population lived without electricity– approx. 992 million people
• 36% of the global population lived without clean cooking – approx. 2.7 billion people
• A majority live in rural areas of sub-Saharan Africa and Asia-Pacific regions
Access to energy expands

➜ 150 million people across Africa and Asia benefit from energy access through off-grid solar systems
• 5% of the population in Africa
• 2% of the population in Asia
Off-grid solar PV is increasingly widespread

➜ Off-grid solar devices (solar lanternsand solar home systems): 50% annualgrowth rates between 2010 and 2018
➜ In 2018:
• Total sales of off-grid solar products: 23.5 million units
• Sales of affiliated off-grid solar products: 7.6 million units
➜ Installed capacity of affiliated off-grid solar products increased 45%
➜ Change in the dynamics of the market:
• Pico-solar sales decreased 9%
• Larger solar home systems increased 77%
Global sales of off-grid solar systems sees strong growth rates

➜ 125 million people using biogas for cooking (111 million in China and 9 million in India)
➜ China: 13.1 billion m3 of biogasproduced for cooking; India: 1.7 million m3
➜ Use of biogas for cooking grewover the past five years in Asia (Bangladesh, Cambodia, Indonesia, Nepal) and sub-Saharan Africa(Burkina Faso, Ethiopia, Kenya, Tanzania and Uganda)
Production of biogas for cooking expands in new markets

Renewable energy is powering the world

➜ Create a level playing field by removing fossil fuel subsidies and adopting carbon pricing
➜ Encourage sector integration among power, heating and cooling, and transport
➜ Align policies across the national, sub-national and local levels
➜ Link to energy efficiency inrenewable energy policy initiatives
From an electricity transition to an energy system transformation

➜ Leadership from national governments is paving the way towards 100% renewables in countries.
➜ Cities and sub-national governmentsare setting more ambitious policies than their national governments.
➜ 1000+ organisations, totaling USD 8 trillion of managed assets, have committed to divesting from fossil fuels.
➜ The private sector has doubled its investment in sourcing renewable power.
The transition is possible – positive examples are showing the way!

➜ Set ambitious targets globally, across regions, countries and sectors
➜ Create the right, sustainable market conditions
➜ Accelerate investment in renewable power, while also establishing new (and strengthening existing) policies for renewables in heating, cooling and transport
➜ Encourage sector integration among the power, heating andcooling, and transport sectors
➜ Align regional, national and sub-national policies, and support cities in their actions
➜ Enact integrated policies that enforce energy efficiency measures while promoting the uptake of renewable energy
➜ Support local job creation and a just transition
➜ Build social acceptance and increase public buy-in
Conclusions – what is needed to advance the energy transition?

Renewable Energy Policy Network for the 21st Century
www.ren21.net/gsr
Subscribe to our newsletter
www.ren21.net
SAVE THE DATE:22-25 October 2019
Seoul, Republic of Korea
Global Status Report:yearly publication since 2005
Renewables in CitiesStatus Report:
Regional Reports Global Futures Reports
Thematic Reports REN21 Academy
International Renewable Energy Conferences
