19 corp presentation-bigevent-timmins-handouts-01jun16
TRANSCRIPT
Click to edit Master title style
• Click to edit Master
text styles
– Second level
• Third level
– Fourth level
» Fifth level
• Click to edit Master
text styles
– Second level
• Third level
– Fourth level
» Fifth level
TSX:KGI 1 klgold.com
TSX:KGI
GROWTH & VALUE
Creating an Ontario
Focused Intermediate
Gold Producer
Timmins Mine Expo – The Big Event | June 1-2, 2016
Click to edit Master title style
• Click to edit Master
text styles
– Second level
• Third level
– Fourth level
» Fifth level
• Click to edit Master
text styles
– Second level
• Third level
– Fourth level
» Fifth level
TSX:KGI 2 klgold.com TSX:KGI klgold.com 2
Forward Looking Statements
Cautionary Note Regarding Forward Looking Statements.
Statements made in the Company’s handouts and as part of the corporate presentation contain statements which
constitute ”forward-looking statements”, including statements regarding the plans, intentions, beliefs and current
expectations of the Company with respect to the future business activities and operating performance of the Company. The
words “may”, “would”, “could”, “should”, “will”, “intend”, “plan”, “anticipate”, “believe”, “estimate”, “expect” and similar
expressions, as they relate to the Company, are intended to identify such forward-looking statements. Forward-looking
statements used in handouts and as part of the corporate presentation include, but may not be limited to;
statements regarding the Company’s guidance metrics for 2016 and 2017 including, gold production, head grade,
cash operating costs, AISC, capital expenditures, revenue, cash flow from operations and free cash flow
generation; the exploration programs and associated budgets with respect to the Kirkland Lake Camp and East
Timmins Assets and the results and timing thereof, the medium to long-term strategy and potential of the
Company to continue to grow by way of organic growth and/or through various strategic transactions, including
mergers and acquisitions.
With respect to the forward looking information of Kirkland Lake Gold, concerning gold resources and reserves of the Kirkland Lake properties and
the East Timmins properties, and the development of such properties are subject to various key assumptions described in the Annual Information
Forms and Technical Reports of both Kirkland Lake Gold and St Andrew Goldfields Ltd. referred to herein and as filed on the SEDAR profiles of both
companies at www.sedar.com and on the Company’s website at www.klgold.com.
Investors are cautioned that forward-looking statements are based on the opinions, assumptions and estimates of management considered
reasonable at the date the statements are made such as, without limitation, opinion, assumptions and estimates of management regarding the
Company’s business, its ability to increase its production capacity and decrease its production cost. Such opinions, assumptions and estimates, are
inherently subject to a variety of risks and uncertainties and other known and unknown factors that could cause actual events or results to differ
materially from those projected in the forward-looking statements. These factors are discussed in length in the Company's annual Management's
Discussion and Analysis and Annual Information Form for the year ended December 31, 2015 filed with the securities regulatory authorities in
certain provinces of Canada and available at www.sedar.com.
Should one or more of these risks or uncertainties materialize, or should assumptions underlying the forward-looking statements prove
incorrect, actual results may vary materially from those described herein as intended, planned, anticipated, believed, estimated or
expected. Although the Company has attempted to identify important risks, uncertainties and factors which could cause actual results to
differ materially, there may be others that cause results not to be as anticipated, estimated or intended. The Company does not intend,
and does not assume any obligation, to update these forward-looking statements except as otherwise required by applicable law.
Click to edit Master title style
• Click to edit Master
text styles
– Second level
• Third level
– Fourth level
» Fifth level
• Click to edit Master
text styles
– Second level
• Third level
– Fourth level
» Fifth level
TSX:KGI 3 klgold.com
A New Mid-Tier Gold Producer
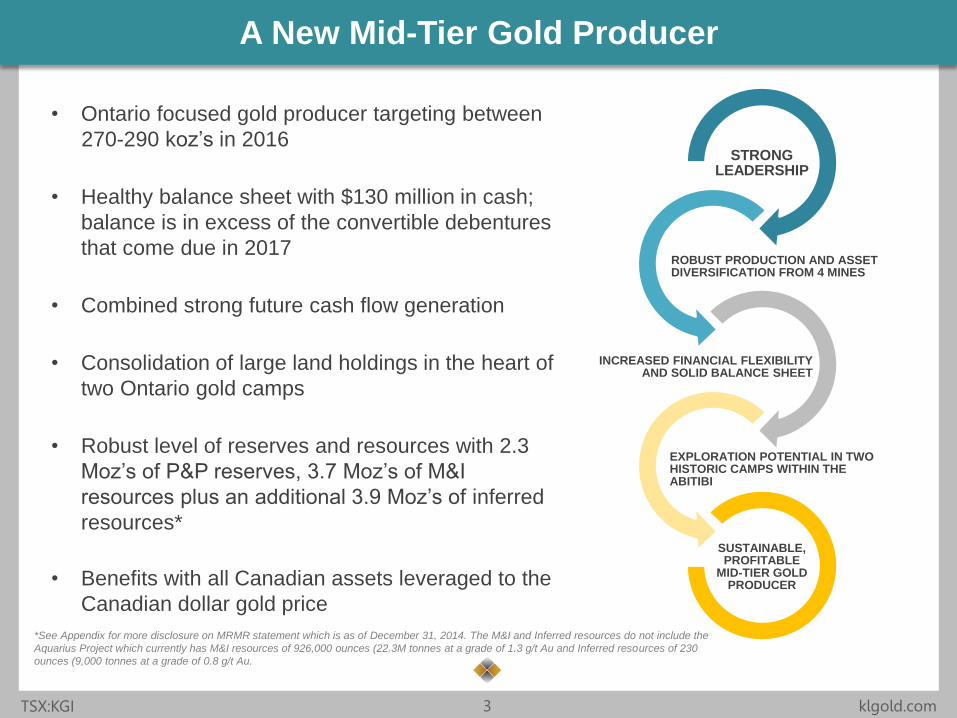
STRONG LEADERSHIP
ROBUST PRODUCTION AND ASSET DIVERSIFICATION FROM 4 MINES
INCREASED FINANCIAL FLEXIBILITY AND SOLID BALANCE SHEET
EXPLORATION POTENTIAL IN TWO HISTORIC CAMPS WITHIN THE ABITIBI
SUSTAINABLE, PROFITABLE
MID-TIER GOLD PRODUCER
• Ontario focused gold producer targeting between
270-290 koz’s in 2016
• Healthy balance sheet with $130 million in cash;
balance is in excess of the convertible debentures
that come due in 2017
• Combined strong future cash flow generation
• Consolidation of large land holdings in the heart of
two Ontario gold camps
• Robust level of reserves and resources with 2.3
Moz’s of P&P reserves, 3.7 Moz’s of M&I
resources plus an additional 3.9 Moz’s of inferred
resources*
• Benefits with all Canadian assets leveraged to the
Canadian dollar gold price
*See Appendix for more disclosure on MRMR statement which is as of December 31, 2014. The M&I and Inferred resources do not include the
Aquarius Project which currently has M&I resources of 926,000 ounces (22.3M tonnes at a grade of 1.3 g/t Au and Inferred resources of 230
ounces (9,000 tonnes at a grade of 0.8 g/t Au.
Click to edit Master title style
• Click to edit Master
text styles
– Second level
• Third level
– Fourth level
» Fifth level
• Click to edit Master
text styles
– Second level
• Third level
– Fourth level
» Fifth level
TSX:KGI 4 klgold.com
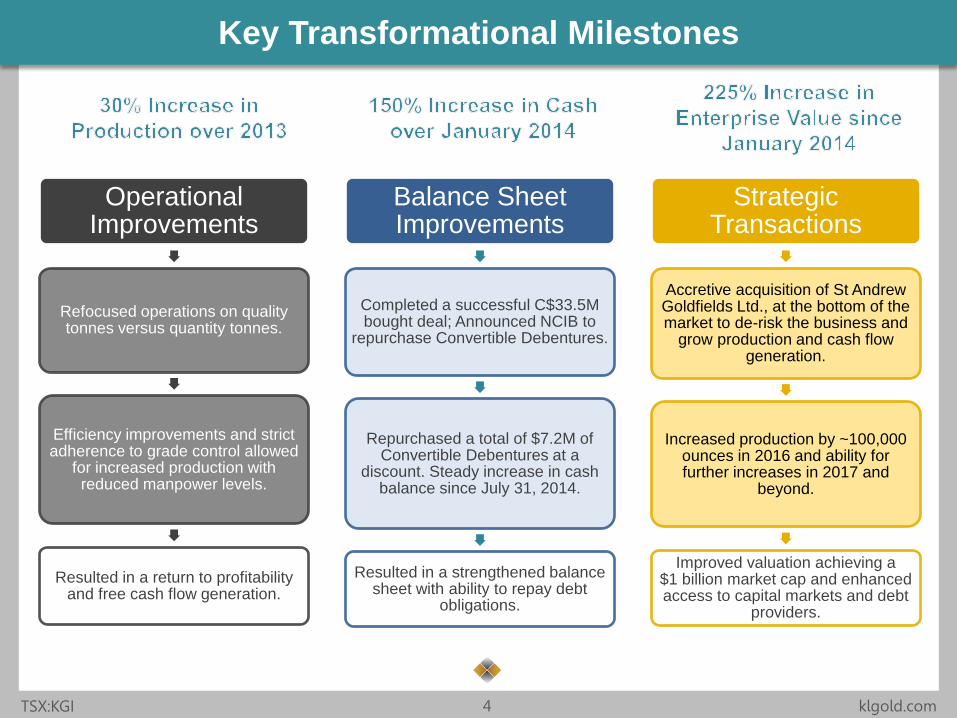
Key Transformational Milestones
Operational Improvements
Refocused operations on quality tonnes versus quantity tonnes.
Efficiency improvements and strict adherence to grade control allowed
for increased production with reduced manpower levels.
Resulted in a return to profitability and free cash flow generation.
Balance Sheet Improvements
Completed a successful C$33.5M bought deal; Announced NCIB to
repurchase Convertible Debentures.
Repurchased a total of $7.2M of Convertible Debentures at a
discount. Steady increase in cash balance since July 31, 2014.
Resulted in a strengthened balance sheet with ability to repay debt
obligations.
Strategic Transactions
Accretive acquisition of St Andrew Goldfields Ltd., at the bottom of the market to de-risk the business and
grow production and cash flow generation.
Increased production by ~100,000 ounces in 2016 and ability for further increases in 2017 and
beyond.
Improved valuation achieving a $1 billion market cap and enhanced access to capital markets and debt
providers.
Click to edit Master title style
• Click to edit Master
text styles
– Second level
• Third level
– Fourth level
» Fifth level
• Click to edit Master
text styles
– Second level
• Third level
– Fourth level
» Fifth level
TSX:KGI 5 klgold.com
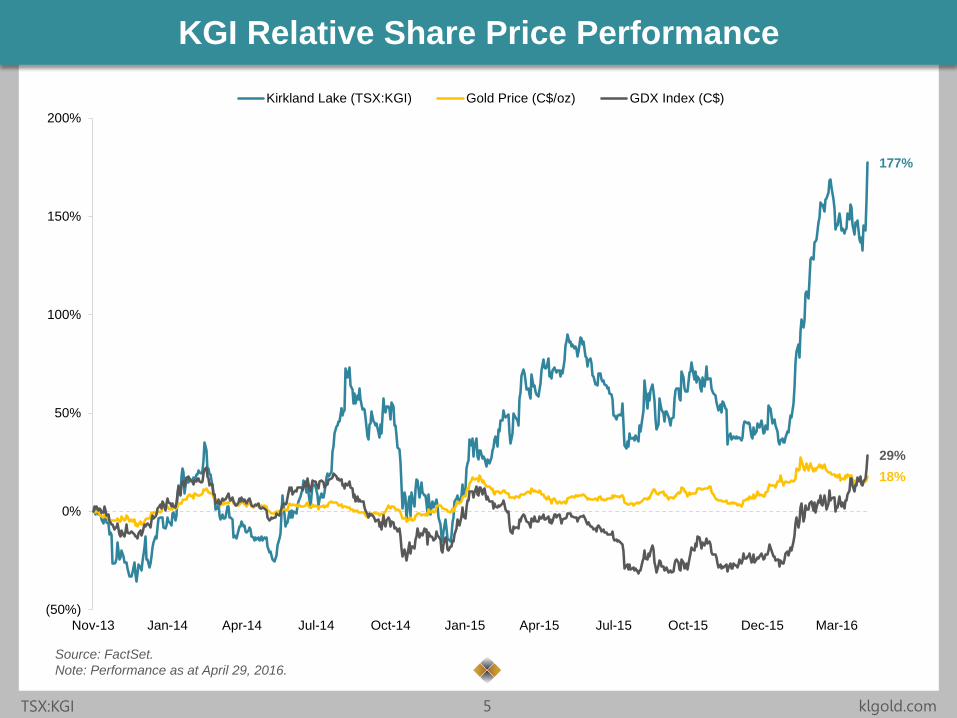
KGI Relative Share Price Performance
Source: FactSet.
Note: Performance as at April 29, 2016.
177%
18%
29%
(50%)
0%
50%
100%
150%
200%
Nov-13 Jan-14 Apr-14 Jul-14 Oct-14 Jan-15 Apr-15 Jul-15 Oct-15 Dec-15 Mar-16
Kirkland Lake (TSX:KGI) Gold Price (C$/oz) GDX Index (C$)
Click to edit Master title style
• Click to edit Master
text styles
– Second level
• Third level
– Fourth level
» Fifth level
• Click to edit Master
text styles
– Second level
• Third level
– Fourth level
» Fifth level
TSX:KGI 6 klgold.com
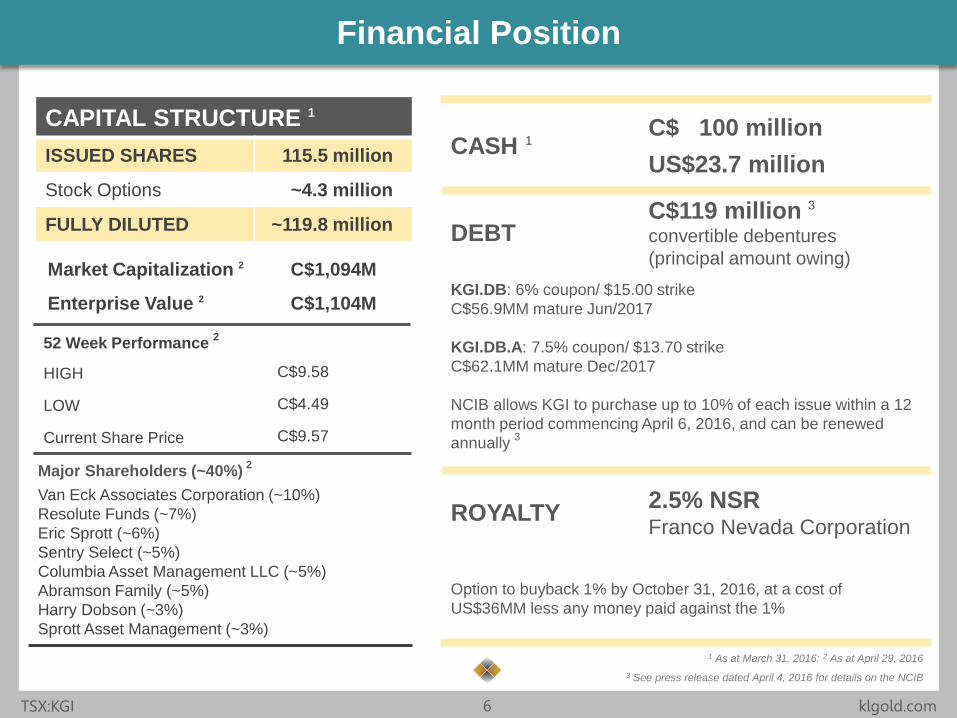
Financial Position
52 Week Performance 2
HIGH C$9.58
LOW C$4.49
Current Share Price C$9.57
CAPITAL STRUCTURE 1
ISSUED SHARES 115.5 million
Stock Options ~4.3 million
FULLY DILUTED ~119.8 million
Market Capitalization 2 C$1,094M
Enterprise Value 2
C$1,104M
Major Shareholders (~40%) 2
Van Eck Associates Corporation (~10%)
Resolute Funds (~7%)
Eric Sprott (~6%)
Sentry Select (~5%)
Columbia Asset Management LLC (~5%)
Abramson Family (~5%)
Harry Dobson (~3%)
Sprott Asset Management (~3%)
CASH 1
C$ 100 million
US$23.7 million
DEBT C$119 million 3
convertible debentures
(principal amount owing)
KGI.DB: 6% coupon/ $15.00 strike
C$56.9MM mature Jun/2017
KGI.DB.A: 7.5% coupon/ $13.70 strike
C$62.1MM mature Dec/2017
NCIB allows KGI to purchase up to 10% of each issue within a 12
month period commencing April 6, 2016, and can be renewed
annually 3
ROYALTY 2.5% NSR Franco Nevada Corporation
Option to buyback 1% by October 31, 2016, at a cost of
US$36MM less any money paid against the 1%
1 As at March 31, 2016: 2 As at April 29, 2016
3 See press release dated April 4, 2016 for details on the NCIB
Click to edit Master title style
• Click to edit Master
text styles
– Second level
• Third level
– Fourth level
» Fifth level
• Click to edit Master
text styles
– Second level
• Third level
– Fourth level
» Fifth level
TSX:KGI 7 klgold.com
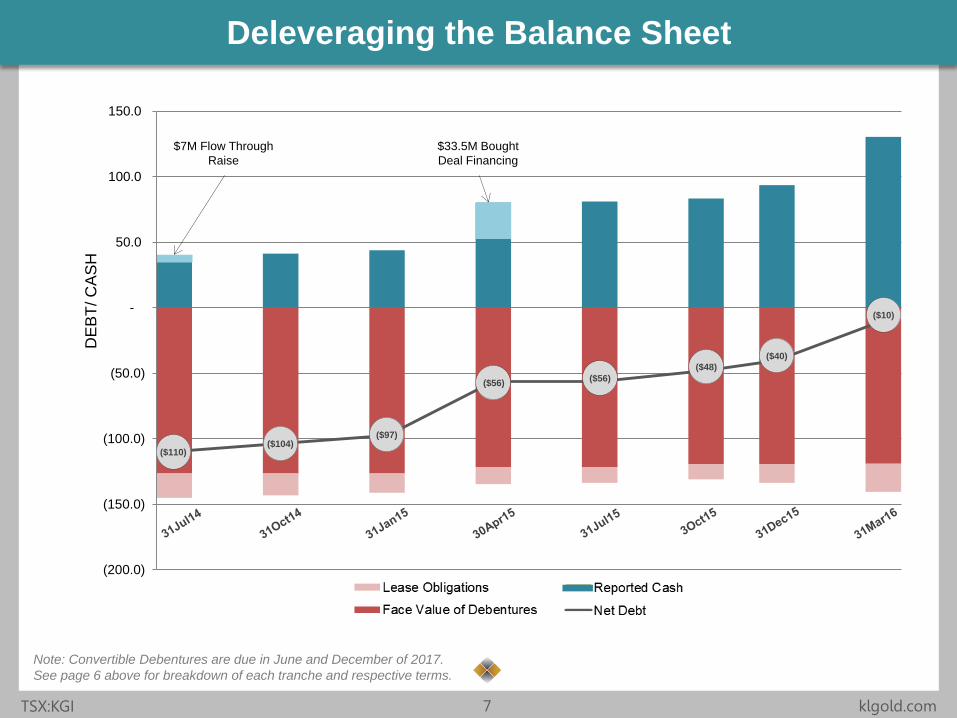
Deleveraging the Balance Sheet
(200.0)
(150.0)
(100.0)
(50.0)
-
50.0
100.0
150.0
DE
BT
/ C
AS
H
$7M Flow Through
Raise
$33.5M Bought
Deal Financing
($110) ($104)
($97)
($56) ($56)
($48)
($40)
($10)
Note: Convertible Debentures are due in June and December of 2017.
See page 6 above for breakdown of each tranche and respective terms.
Click to edit Master title style
• Click to edit Master
text styles
– Second level
• Third level
– Fourth level
» Fifth level
• Click to edit Master
text styles
– Second level
• Third level
– Fourth level
» Fifth level
TSX:KGI 8 klgold.com
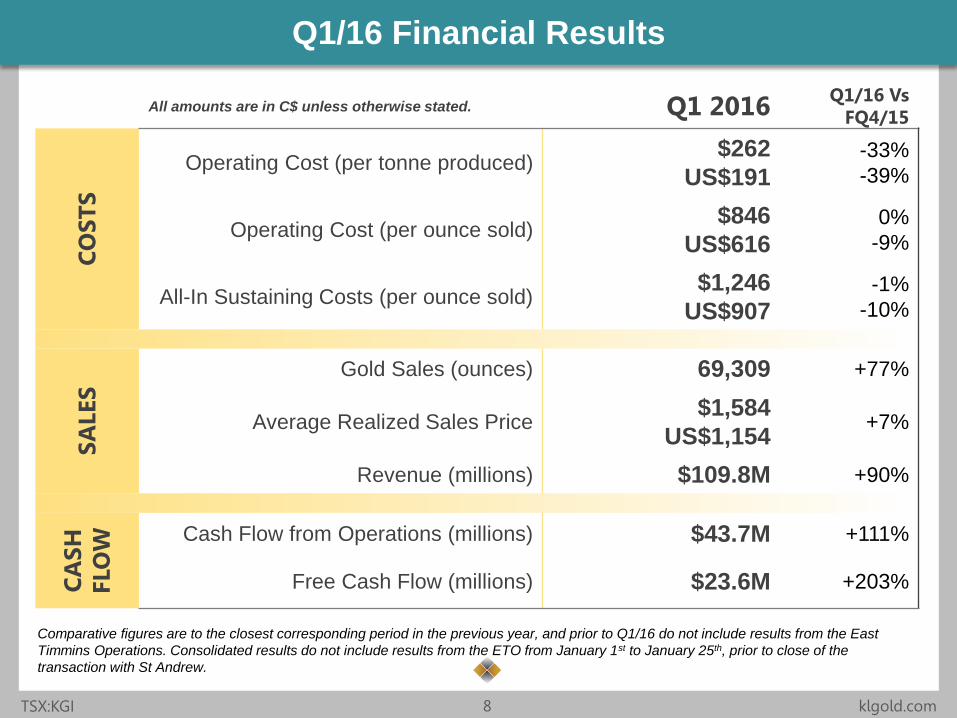
Q1/16 Financial Results
All amounts are in C$ unless otherwise stated. Q1 2016 Q1/16 Vs
FQ4/15
CO
ST
S
Operating Cost (per tonne produced) $262
US$191
-33%
-39%
Operating Cost (per ounce sold) $846
US$616
0%
-9%
All-In Sustaining Costs (per ounce sold) $1,246
US$907
-1%
-10%
SA
LES
Gold Sales (ounces) 69,309 +77%
Average Realized Sales Price $1,584
US$1,154 +7%
Revenue (millions) $109.8M +90%
CA
SH
FLO
W
Cash Flow from Operations (millions) $43.7M +111%
Free Cash Flow (millions) $23.6M +203%
Comparative figures are to the closest corresponding period in the previous year, and prior to Q1/16 do not include results from the East
Timmins Operations. Consolidated results do not include results from the ETO from January 1st to January 25th, prior to close of the
transaction with St Andrew.
Click to edit Master title style
• Click to edit Master
text styles
– Second level
• Third level
– Fourth level
» Fifth level
• Click to edit Master
text styles
– Second level
• Third level
– Fourth level
» Fifth level
TSX:KGI 9 klgold.com
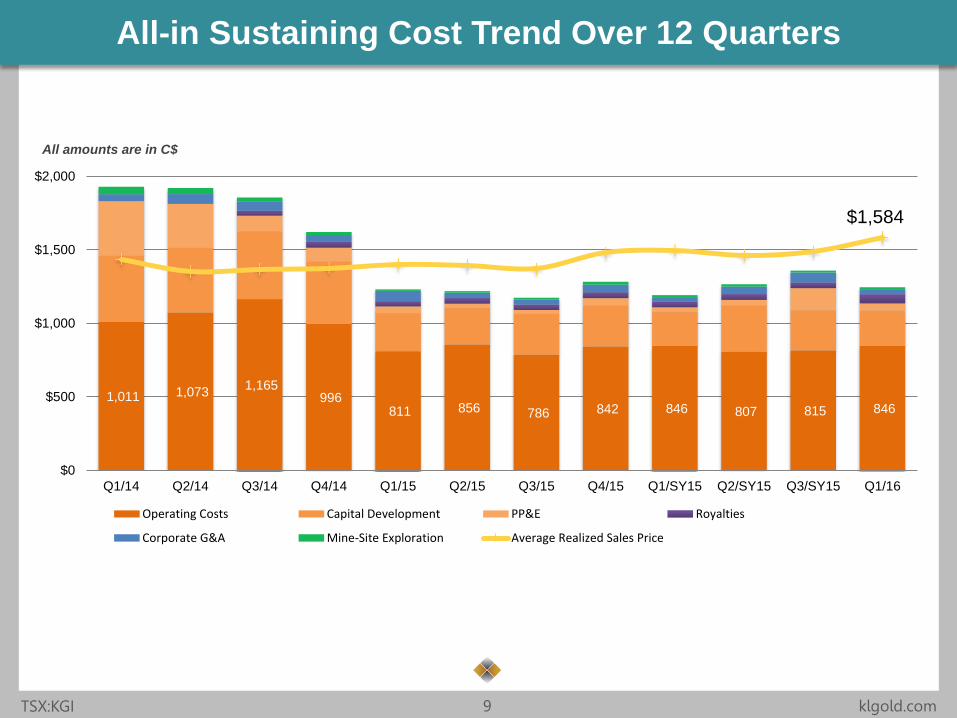
All-in Sustaining Cost Trend Over 12 Quarters
1,011 1,073 1,165
996 811 856 786 842 846 807 815 846
$0
$500
$1,000
$1,500
$2,000
Q1/14 Q2/14 Q3/14 Q4/14 Q1/15 Q2/15 Q3/15 Q4/15 Q1/SY15 Q2/SY15 Q3/SY15 Q1/16
Operating Costs Capital Development PP&E Royalties
Corporate G&A Mine-Site Exploration Average Realized Sales Price
All amounts are in C$
$1,584
Click to edit Master title style
• Click to edit Master
text styles
– Second level
• Third level
– Fourth level
» Fifth level
• Click to edit Master
text styles
– Second level
• Third level
– Fourth level
» Fifth level
TSX:KGI 10 klgold.com
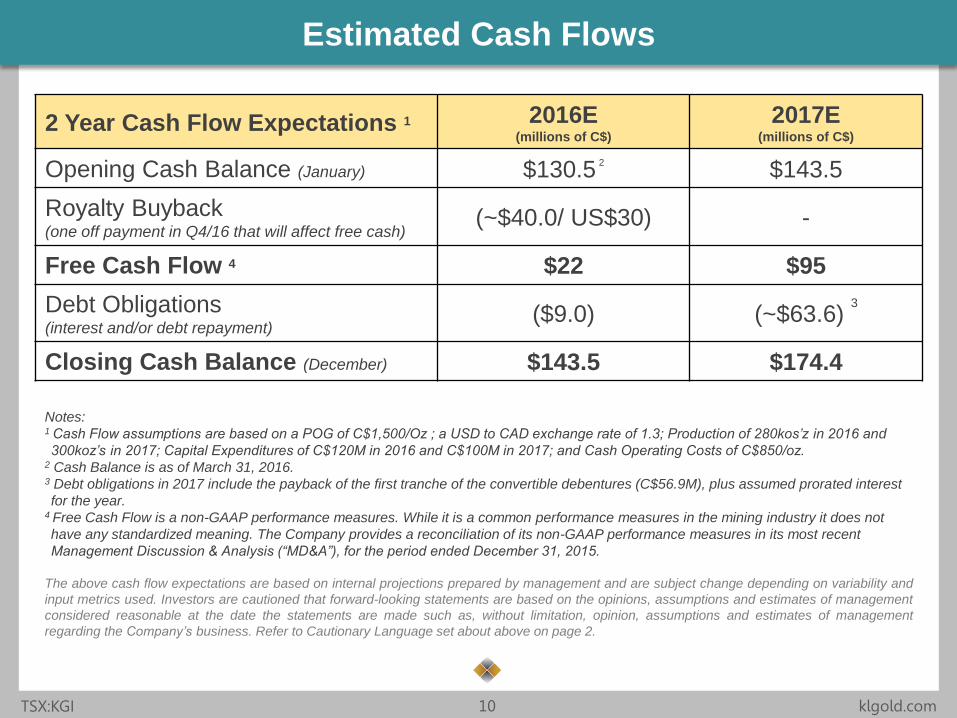
Estimated Cash Flows
2 Year Cash Flow Expectations 1 2016E (millions of C$)
2017E (millions of C$)
Opening Cash Balance (January) $130.5 2
$143.5
Royalty Buyback (one off payment in Q4/16 that will affect free cash)
(~$40.0/ US$30) -
Free Cash Flow 4 $22 $95
Debt Obligations (interest and/or debt repayment)
($9.0) (~$63.6) 3
Closing Cash Balance (December) $143.5 $174.4
Notes: 1 Cash Flow assumptions are based on a POG of C$1,500/Oz ; a USD to CAD exchange rate of 1.3; Production of 280kos’z in 2016 and
300koz’s in 2017; Capital Expenditures of C$120M in 2016 and C$100M in 2017; and Cash Operating Costs of C$850/oz. 2 Cash Balance is as of March 31, 2016. 3 Debt obligations in 2017 include the payback of the first tranche of the convertible debentures (C$56.9M), plus assumed prorated interest
for the year. 4 Free Cash Flow is a non-GAAP performance measures. While it is a common performance measures in the mining industry it does not
have any standardized meaning. The Company provides a reconciliation of its non-GAAP performance measures in its most recent
Management Discussion & Analysis (“MD&A”), for the period ended December 31, 2015.
The above cash flow expectations are based on internal projections prepared by management and are subject change depending on variability and
input metrics used. Investors are cautioned that forward-looking statements are based on the opinions, assumptions and estimates of management
considered reasonable at the date the statements are made such as, without limitation, opinion, assumptions and estimates of management
regarding the Company’s business. Refer to Cautionary Language set about above on page 2.
Click to edit Master title style
• Click to edit Master
text styles
– Second level
• Third level
– Fourth level
» Fifth level
• Click to edit Master
text styles
– Second level
• Third level
– Fourth level
» Fifth level
TSX:KGI 11 klgold.com
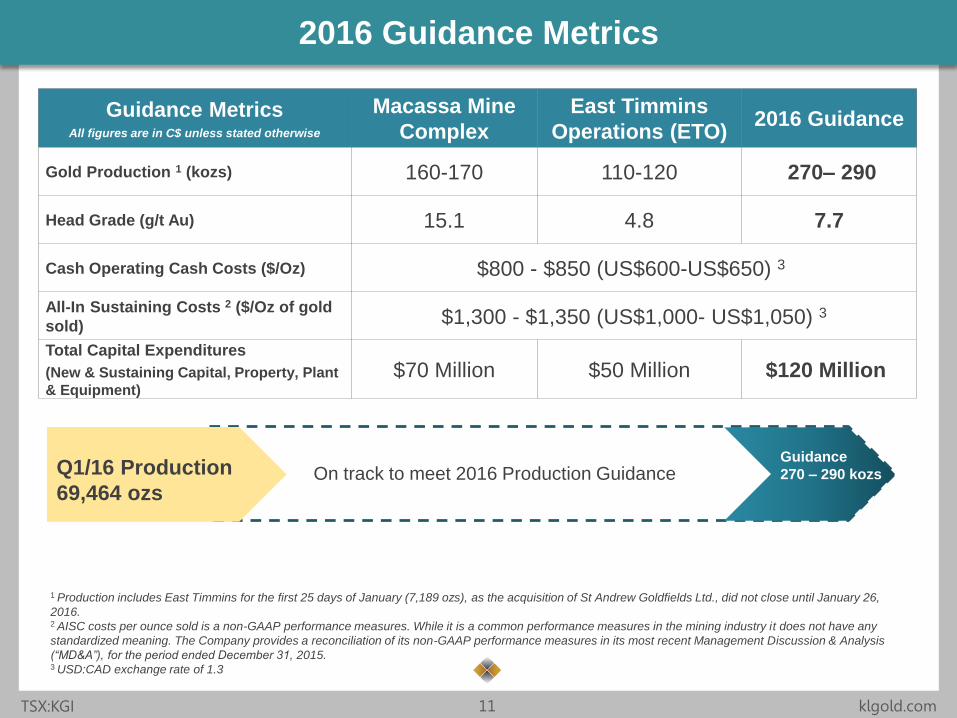
2016 Guidance Metrics
Guidance Metrics All figures are in C$ unless stated otherwise
Macassa Mine
Complex
East Timmins
Operations (ETO) 2016 Guidance
Gold Production 1 (kozs) 160-170 110-120 270– 290
Head Grade (g/t Au) 15.1 4.8 7.7
Cash Operating Cash Costs ($/Oz) $800 - $850 (US$600-US$650) 3
All-In Sustaining Costs 2 ($/Oz of gold
sold) $1,300 - $1,350 (US$1,000- US$1,050) 3
Total Capital Expenditures
(New & Sustaining Capital, Property, Plant
& Equipment)
$70 Million $50 Million $120 Million
1 Production includes East Timmins for the first 25 days of January (7,189 ozs), as the acquisition of St Andrew Goldfields Ltd., did not close until January 26,
2016. 2 AISC costs per ounce sold is a non-GAAP performance measures. While it is a common performance measures in the mining industry it does not have any
standardized meaning. The Company provides a reconciliation of its non-GAAP performance measures in its most recent Management Discussion & Analysis
(“MD&A”), for the period ended December 31, 2015. 3 USD:CAD exchange rate of 1.3
Q1/16 Production
69,464 ozs
Guidance
270 – 290 kozs On track to meet 2016 Production Guidance
Click to edit Master title style
• Click to edit Master
text styles
– Second level
• Third level
– Fourth level
» Fifth level
• Click to edit Master
text styles
– Second level
• Third level
– Fourth level
» Fifth level
TSX:KGI 12 klgold.com
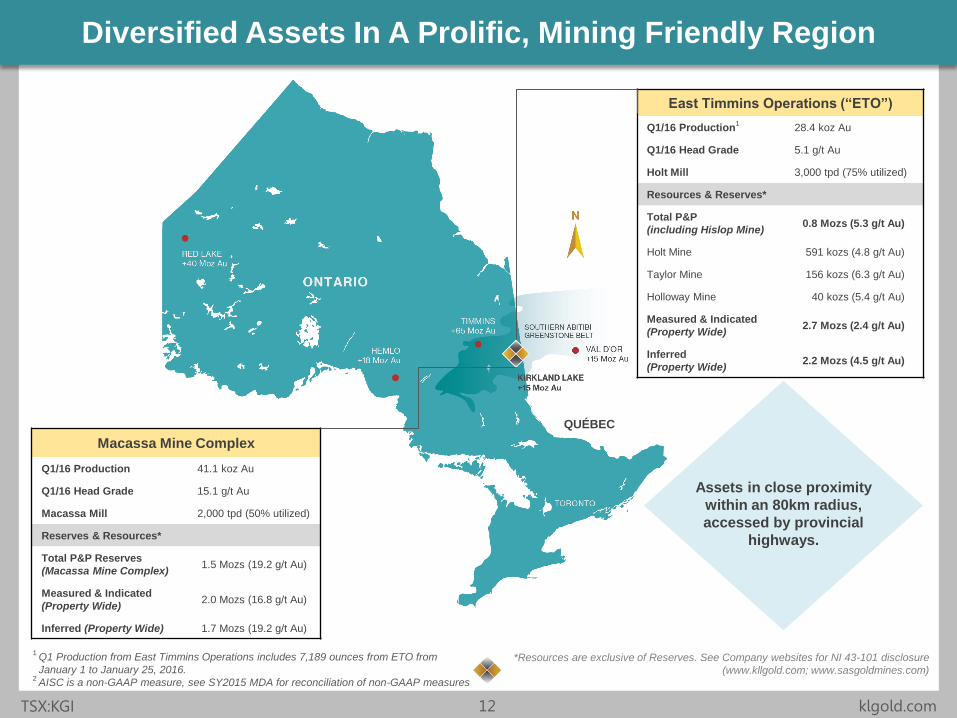
Diversified Assets In A Prolific, Mining Friendly Region
East Timmins Operations (“ETO”)
Q1/16 Production1 28.4 koz Au
Q1/16 Head Grade 5.1 g/t Au
Holt Mill 3,000 tpd (75% utilized)
Resources & Reserves*
Total P&P
(including Hislop Mine) 0.8 Mozs (5.3 g/t Au)
Holt Mine 591 kozs (4.8 g/t Au)
Taylor Mine 156 kozs (6.3 g/t Au)
Holloway Mine 40 kozs (5.4 g/t Au)
Measured & Indicated
(Property Wide) 2.7 Mozs (2.4 g/t Au)
Inferred
(Property Wide) 2.2 Mozs (4.5 g/t Au)
Macassa Mine Complex
Q1/16 Production 41.1 koz Au
Q1/16 Head Grade 15.1 g/t Au
Macassa Mill 2,000 tpd (50% utilized)
Reserves & Resources*
Total P&P Reserves
(Macassa Mine Complex) 1.5 Mozs (19.2 g/t Au)
Measured & Indicated
(Property Wide) 2.0 Mozs (16.8 g/t Au)
Inferred (Property Wide) 1.7 Mozs (19.2 g/t Au)
*Resources are exclusive of Reserves. See Company websites for NI 43-101 disclosure
(www.kllgold.com; www.sasgoldmines.com)
Assets in close proximity
within an 80km radius,
accessed by provincial
highways.
QUÉBEC
1 Q1 Production from East Timmins Operations includes 7,189 ounces from ETO from
January 1 to January 25, 2016. 2 AISC is a non-GAAP measure, see SY2015 MDA for reconciliation of non-GAAP measures
Click to edit Master title style
• Click to edit Master
text styles
– Second level
• Third level
– Fourth level
» Fifth level
• Click to edit Master
text styles
– Second level
• Third level
– Fourth level
» Fifth level
TSX:KGI 13 klgold.com
A Corner Stone
High-Grade Asset
MACASSA MINE
COMPLEX
Click to edit Master title style
• Click to edit Master
text styles
– Second level
• Third level
– Fourth level
» Fifth level
• Click to edit Master
text styles
– Second level
• Third level
– Fourth level
» Fifth level
TSX:KGI 14 klgold.com
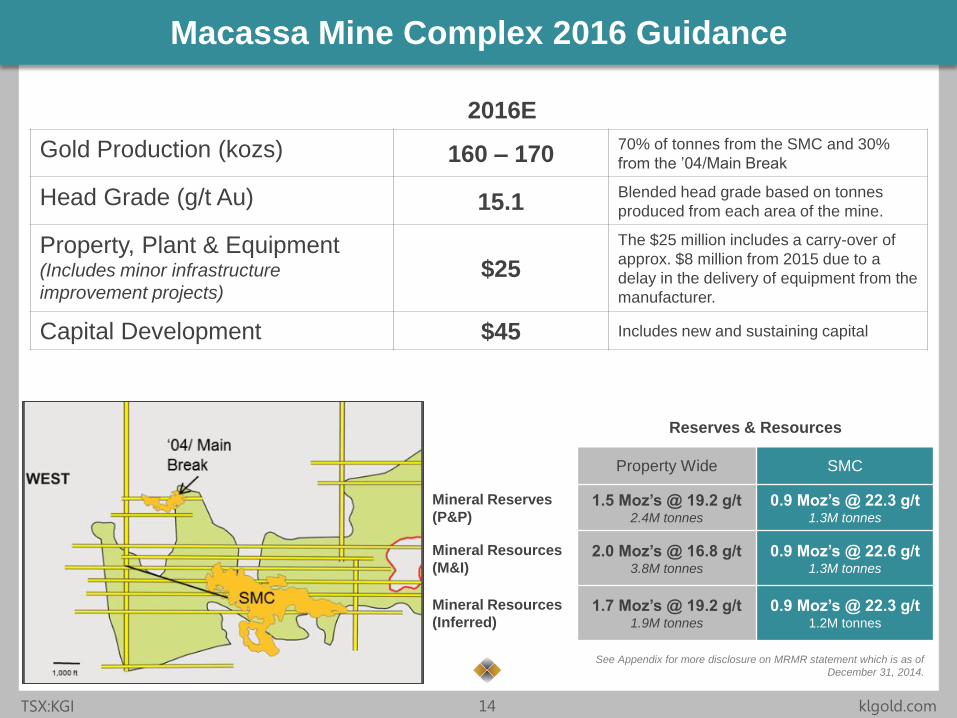
Macassa Mine Complex 2016 Guidance
Reserves & Resources
Property Wide SMC
Mineral Reserves
(P&P) 1.5 Moz’s @ 19.2 g/t
2.4M tonnes
0.9 Moz’s @ 22.3 g/t 1.3M tonnes
Mineral Resources
(M&I) 2.0 Moz’s @ 16.8 g/t
3.8M tonnes
0.9 Moz’s @ 22.6 g/t 1.3M tonnes
Mineral Resources
(Inferred) 1.7 Moz’s @ 19.2 g/t
1.9M tonnes
0.9 Moz’s @ 22.3 g/t 1.2M tonnes
2016E
Gold Production (kozs) 160 – 170 70% of tonnes from the SMC and 30%
from the ’04/Main Break
Head Grade (g/t Au) 15.1 Blended head grade based on tonnes
produced from each area of the mine.
Property, Plant & Equipment (Includes minor infrastructure
improvement projects)
$25
The $25 million includes a carry-over of
approx. $8 million from 2015 due to a
delay in the delivery of equipment from the
manufacturer.
Capital Development $45 Includes new and sustaining capital
See Appendix for more disclosure on MRMR statement which is as of
December 31, 2014.
Click to edit Master title style
• Click to edit Master
text styles
– Second level
• Third level
– Fourth level
» Fifth level
• Click to edit Master
text styles
– Second level
• Third level
– Fourth level
» Fifth level
TSX:KGI 15 klgold.com
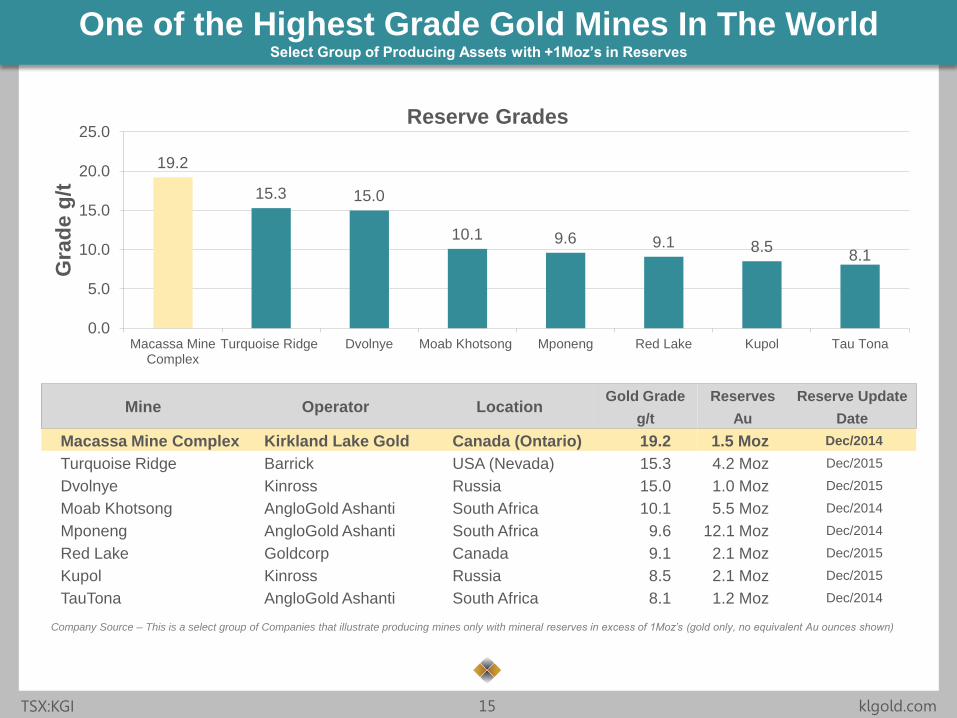
One of the Highest Grade Gold Mines In The World Select Group of Producing Assets with +1Moz’s in Reserves
Mine Operator Location Gold Grade Reserves Reserve Update
g/t Au Date
Macassa Mine Complex Kirkland Lake Gold Canada (Ontario) 19.2 1.5 Moz Dec/2014
Turquoise Ridge Barrick USA (Nevada) 15.3 4.2 Moz Dec/2015
Dvolnye Kinross Russia 15.0 1.0 Moz Dec/2015
Moab Khotsong AngloGold Ashanti South Africa 10.1 5.5 Moz Dec/2014
Mponeng AngloGold Ashanti South Africa 9.6 12.1 Moz Dec/2014
Red Lake Goldcorp Canada 9.1 2.1 Moz Dec/2015
Kupol Kinross Russia 8.5 2.1 Moz Dec/2015
TauTona AngloGold Ashanti South Africa 8.1 1.2 Moz Dec/2014
19.2
15.3 15.0
10.1 9.6 9.1 8.5 8.1
0.0
5.0
10.0
15.0
20.0
25.0
Macassa MineComplex
Turquoise Ridge Dvolnye Moab Khotsong Mponeng Red Lake Kupol Tau Tona
Gra
de g
/t
Reserve Grades
Company Source – This is a select group of Companies that illustrate producing mines only with mineral reserves in excess of 1Moz’s (gold only, no equivalent Au ounces shown)
Click to edit Master title style
• Click to edit Master
text styles
– Second level
• Third level
– Fourth level
» Fifth level
• Click to edit Master
text styles
– Second level
• Third level
– Fourth level
» Fifth level
TSX:KGI 16 klgold.com
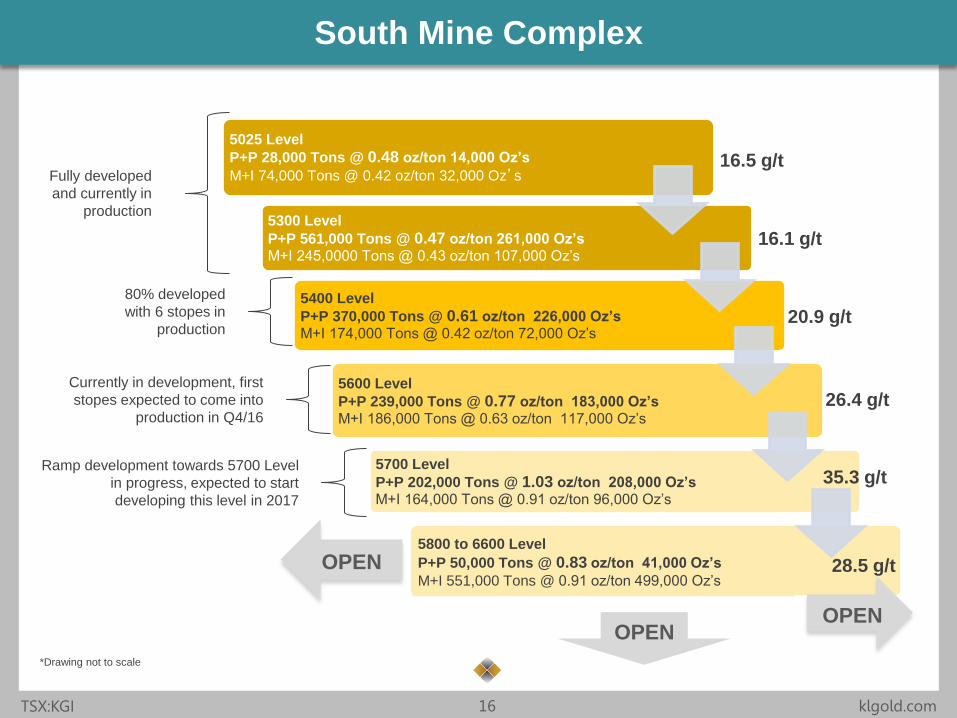
5025 Level
P+P 28,000 Tons @ 0.48 oz/ton 14,000 Oz’s
M+I 74,000 Tons @ 0.42 oz/ton 32,000 Oz’s
5300 Level
P+P 561,000 Tons @ 0.47 oz/ton 261,000 Oz’s M+I 245,0000 Tons @ 0.43 oz/ton 107,000 Oz’s
5400 Level
P+P 370,000 Tons @ 0.61 oz/ton 226,000 Oz’s M+I 174,000 Tons @ 0.42 oz/ton 72,000 Oz’s
5600 Level
P+P 239,000 Tons @ 0.77 oz/ton 183,000 Oz’s M+I 186,000 Tons @ 0.63 oz/ton 117,000 Oz’s
5700 Level
P+P 202,000 Tons @ 1.03 oz/ton 208,000 Oz’s M+I 164,000 Tons @ 0.91 oz/ton 96,000 Oz’s
South Mine Complex
OPEN
*Drawing not to scale
5800 to 6600 Level
P+P 50,000 Tons @ 0.83 oz/ton 41,000 Oz’s
M+I 551,000 Tons @ 0.91 oz/ton 499,000 Oz’s
OPEN
OPEN
16.5 g/t
16.1 g/t
20.9 g/t
26.4 g/t
35.3 g/t
28.5 g/t
Fully developed
and currently in
production
80% developed
with 6 stopes in
production
Currently in development, first
stopes expected to come into
production in Q4/16
Ramp development towards 5700 Level
in progress, expected to start
developing this level in 2017
Click to edit Master title style
• Click to edit Master
text styles
– Second level
• Third level
– Fourth level
» Fifth level
• Click to edit Master
text styles
– Second level
• Third level
– Fourth level
» Fifth level
TSX:KGI 17 klgold.com
Sustainable Assets
EAST TIMMINS
ASSETS
Click to edit Master title style
• Click to edit Master
text styles
– Second level
• Third level
– Fourth level
» Fifth level
• Click to edit Master
text styles
– Second level
• Third level
– Fourth level
» Fifth level
TSX:KGI 18 klgold.com
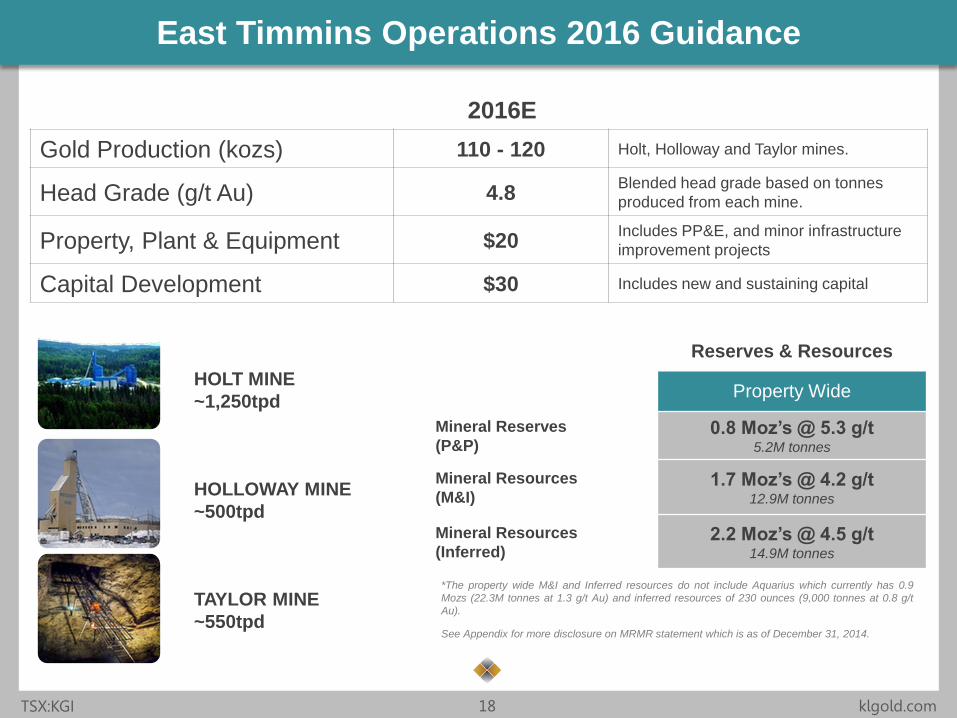
East Timmins Operations 2016 Guidance
Reserves & Resources
Property Wide
Mineral Reserves
(P&P) 0.8 Moz’s @ 5.3 g/t
5.2M tonnes
Mineral Resources
(M&I) 1.7 Moz’s @ 4.2 g/t
12.9M tonnes
Mineral Resources
(Inferred) 2.2 Moz’s @ 4.5 g/t
14.9M tonnes
See Appendix for more disclosure on MRMR statement which is as of December 31, 2014.
2016E
Gold Production (kozs) 110 - 120 Holt, Holloway and Taylor mines.
Head Grade (g/t Au) 4.8 Blended head grade based on tonnes
produced from each mine.
Property, Plant & Equipment $20 Includes PP&E, and minor infrastructure
improvement projects
Capital Development $30 Includes new and sustaining capital
HOLT MINE
~1,250tpd
HOLLOWAY MINE
~500tpd
TAYLOR MINE
~550tpd
*The property wide M&I and Inferred resources do not include Aquarius which currently has 0.9
Mozs (22.3M tonnes at 1.3 g/t Au) and inferred resources of 230 ounces (9,000 tonnes at 0.8 g/t
Au).
Click to edit Master title style
• Click to edit Master
text styles
– Second level
• Third level
– Fourth level
» Fifth level
• Click to edit Master
text styles
– Second level
• Third level
– Fourth level
» Fifth level
TSX:KGI 19 klgold.com
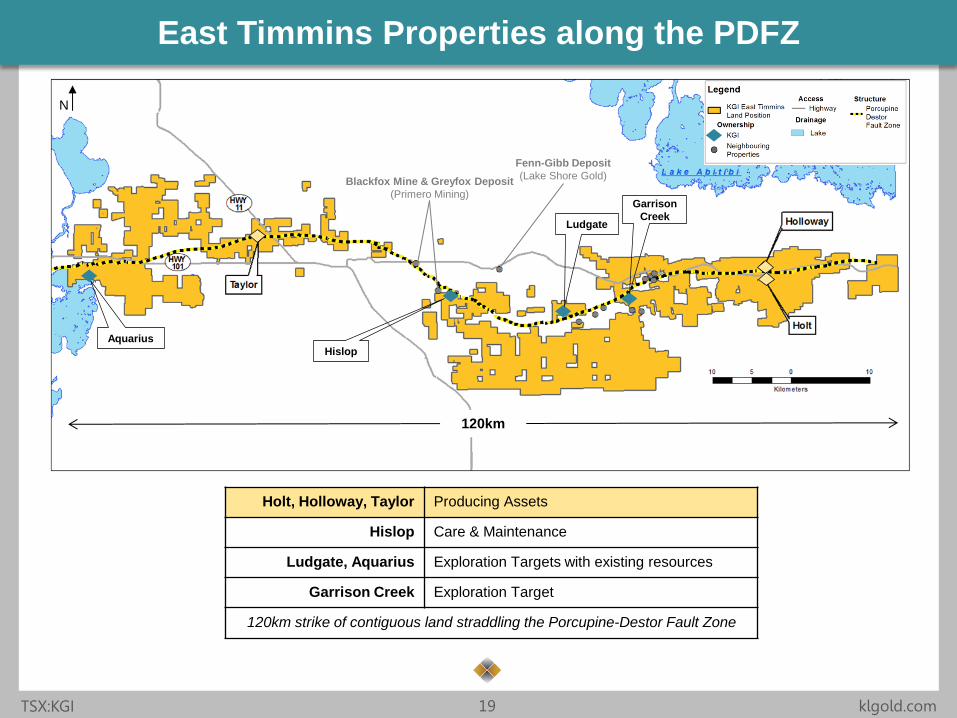
East Timmins Properties along the PDFZ
Holt, Holloway, Taylor Producing Assets
Hislop Care & Maintenance
Ludgate, Aquarius Exploration Targets with existing resources
Garrison Creek Exploration Target
120km strike of contiguous land straddling the Porcupine-Destor Fault Zone
Blackfox Mine & Greyfox Deposit
(Primero Mining)
Aquarius
Hislop
Ludgate
Garrison
Creek
120km
N
Fenn-Gibb Deposit
(Lake Shore Gold)

Click to edit Master title style
• Click to edit Master
text styles
– Second level
• Third level
– Fourth level
» Fifth level
• Click to edit Master
text styles
– Second level
• Third level
– Fourth level
» Fifth level
TSX:KGI 20 klgold.com
Organic Growth
Opportunities
EXPLORATION
PROGRAMS
Click to edit Master title style
• Click to edit Master
text styles
– Second level
• Third level
– Fourth level
» Fifth level
• Click to edit Master
text styles
– Second level
• Third level
– Fourth level
» Fifth level
TSX:KGI 21 klgold.com
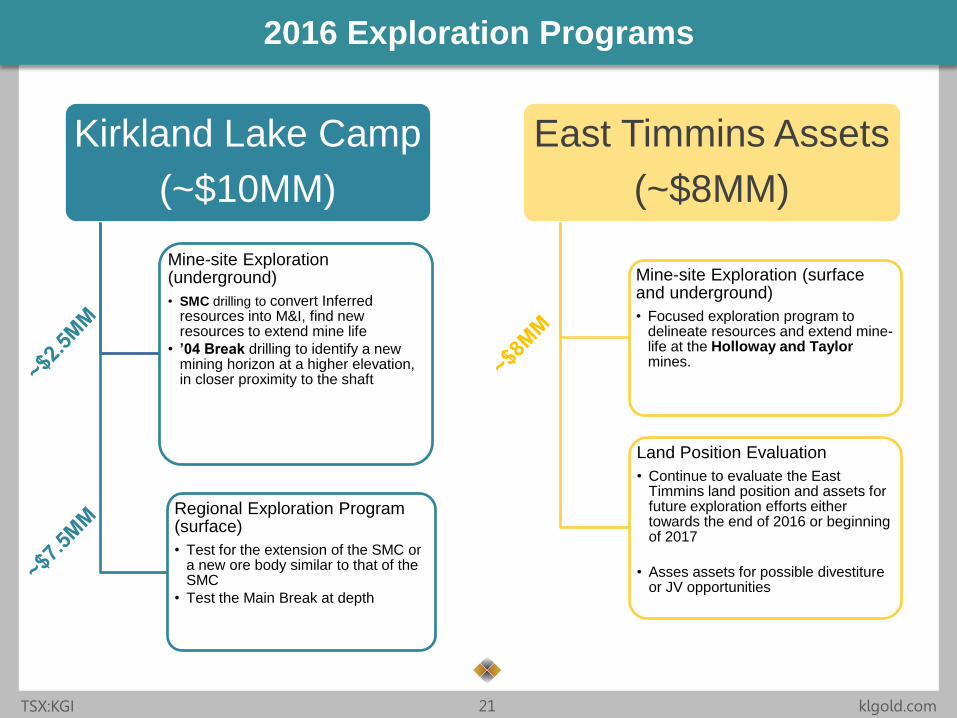
2016 Exploration Programs
Kirkland Lake Camp
(~$10MM)
Mine-site Exploration (underground)
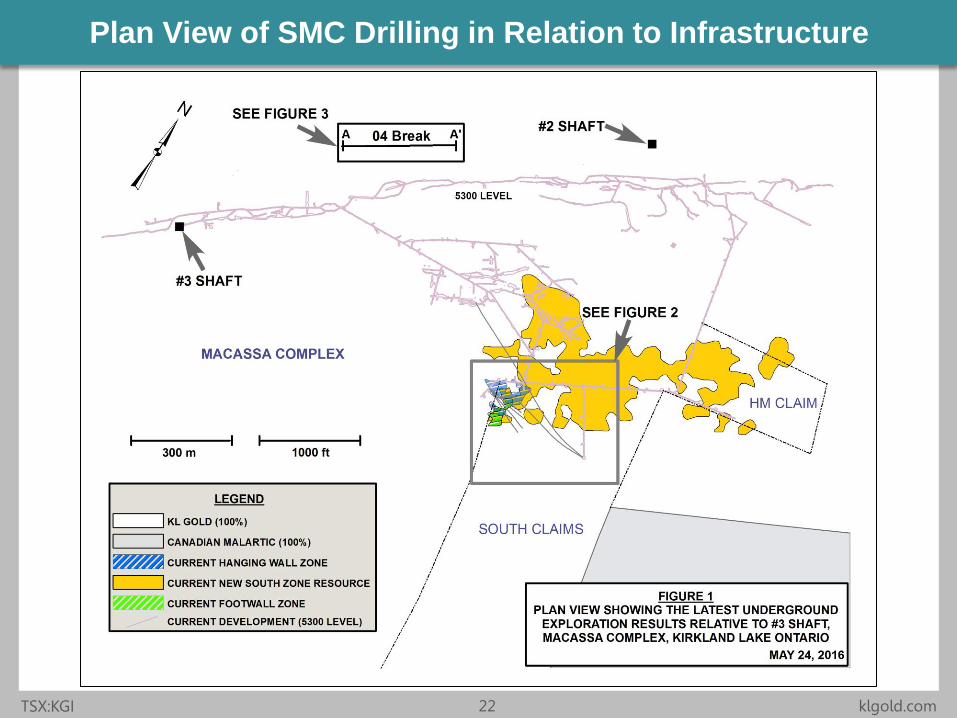
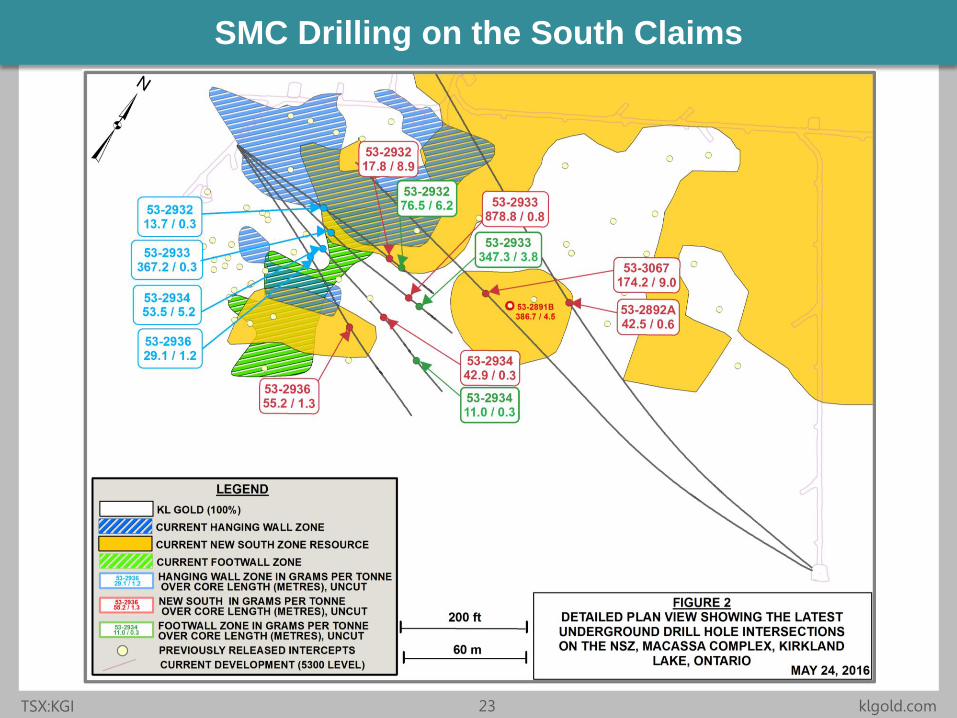
• SMC drilling to convert Inferred resources into M&I, find new resources to extend mine life
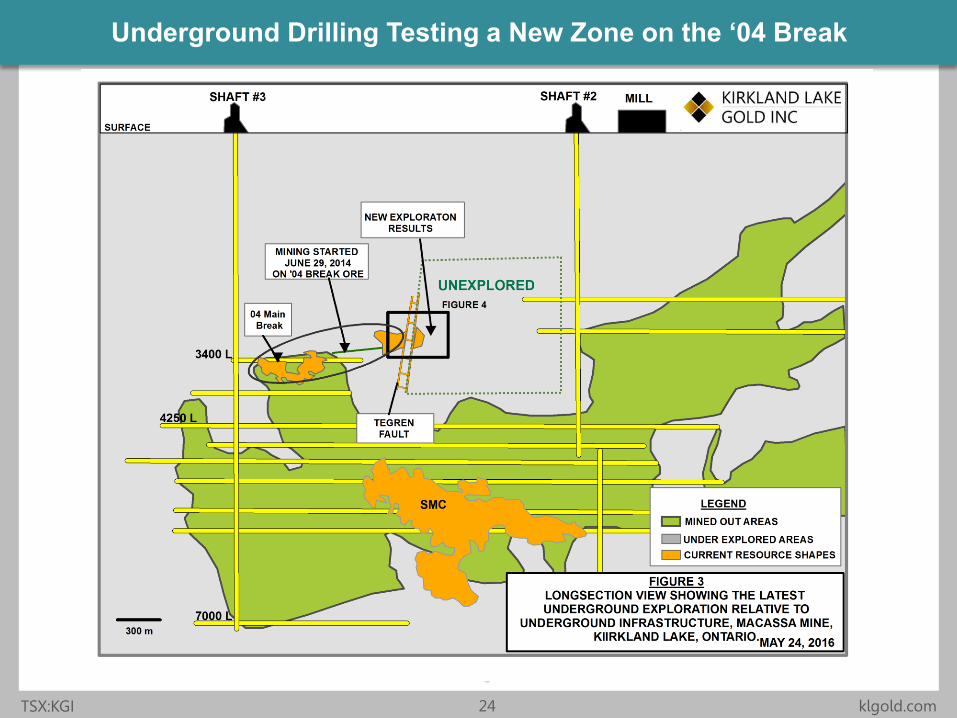
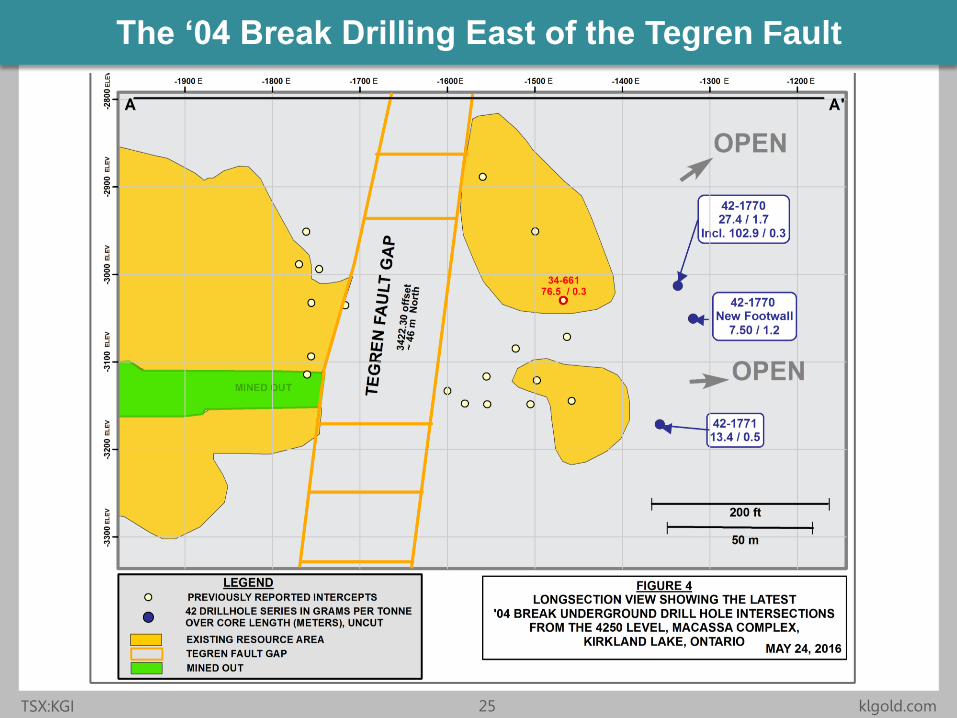
• ’04 Break drilling to identify a new mining horizon at a higher elevation, in closer proximity to the shaft
Regional Exploration Program (surface)
• Test for the extension of the SMC or a new ore body similar to that of the SMC
• Test the Main Break at depth
East Timmins Assets
(~$8MM)
Mine-site Exploration (surface and underground)
• Focused exploration program to delineate resources and extend mine-life at the Holloway and Taylor mines.
Land Position Evaluation
• Continue to evaluate the East Timmins land position and assets for future exploration efforts either towards the end of 2016 or beginning of 2017
• Asses assets for possible divestiture or JV opportunities
Click to edit Master title style
• Click to edit Master
text styles
– Second level
• Third level
– Fourth level
» Fifth level
• Click to edit Master
text styles
– Second level
• Third level
– Fourth level
» Fifth level
TSX:KGI 22 klgold.com
Plan View of SMC Drilling in Relation to Infrastructure
Click to edit Master title style
• Click to edit Master
text styles
– Second level
• Third level
– Fourth level
» Fifth level
• Click to edit Master
text styles
– Second level
• Third level
– Fourth level
» Fifth level
TSX:KGI 23 klgold.com
SMC Drilling on the South Claims
Click to edit Master title style
• Click to edit Master
text styles
– Second level
• Third level
– Fourth level
» Fifth level
• Click to edit Master
text styles
– Second level
• Third level
– Fourth level
» Fifth level
TSX:KGI 24 klgold.com
Underground Drilling Testing a New Zone on the ‘04 Break
Click to edit Master title style
• Click to edit Master
text styles
– Second level
• Third level
– Fourth level
» Fifth level
• Click to edit Master
text styles
– Second level
• Third level
– Fourth level
» Fifth level
TSX:KGI 25 klgold.com
The ‘04 Break Drilling East of the Tegren Fault
Click to edit Master title style
• Click to edit Master
text styles
– Second level
• Third level
– Fourth level
» Fifth level
• Click to edit Master
text styles
– Second level
• Third level
– Fourth level
» Fifth level
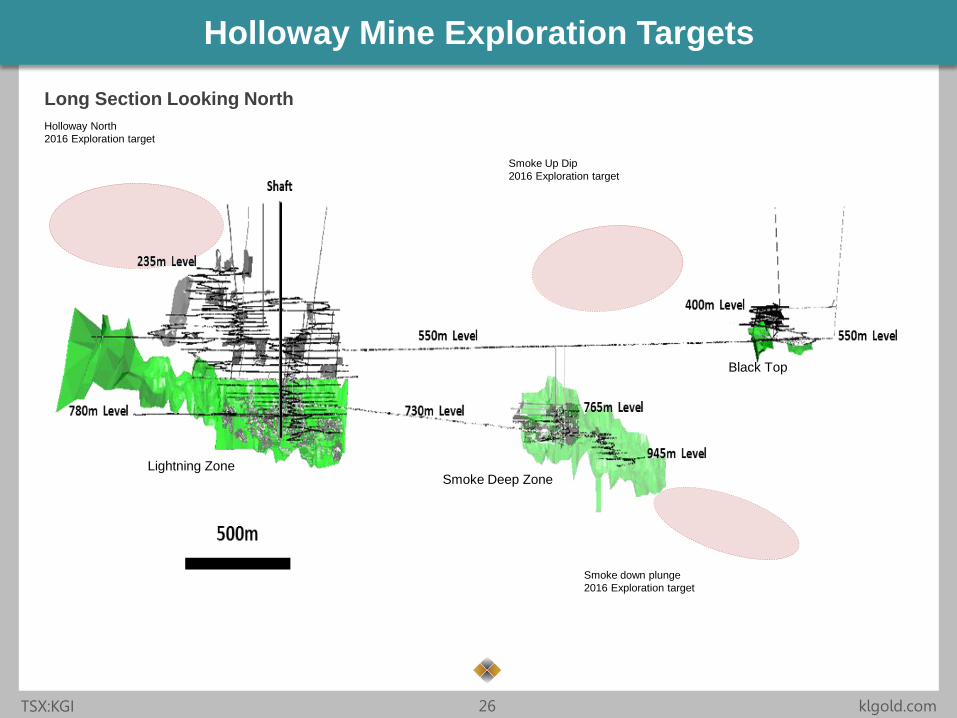
TSX:KGI 26 klgold.com
Holloway Mine Exploration Targets
Long Section Looking North
Smoke Deep Zone
Smoke down plunge
2016 Exploration target
Holloway North
2016 Exploration target
Smoke Up Dip
2016 Exploration target
Black Top
Lightning Zone

Click to edit Master title style
• Click to edit Master
text styles
– Second level
• Third level
– Fourth level
» Fifth level
• Click to edit Master
text styles
– Second level
• Third level
– Fourth level
» Fifth level
TSX:KGI 27 klgold.com
Taylor Mine Exploration Targets
Long Section Looking North
West Porphyry Zone (WPZ)
Indicated 248 koz
1.63M tonnes @ 4.7 g/t
Inferred 251 koz
1.86M tonnes @ 4.2 g/t
Click to edit Master title style
• Click to edit Master
text styles
– Second level
• Third level
– Fourth level
» Fifth level
• Click to edit Master
text styles
– Second level
• Third level
– Fourth level
» Fifth level
TSX:KGI 28 klgold.com
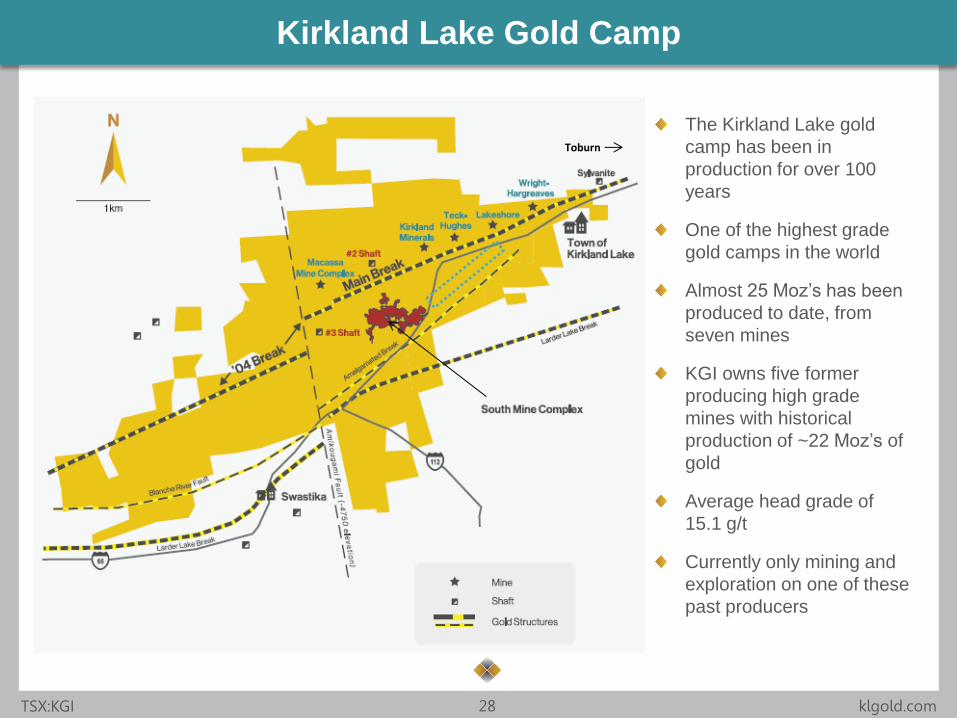
Kirkland Lake Gold Camp
The Kirkland Lake gold
camp has been in
production for over 100
years
One of the highest grade
gold camps in the world
Almost 25 Moz’s has been
produced to date, from
seven mines
KGI owns five former
producing high grade
mines with historical
production of ~22 Moz’s of
gold
Average head grade of
15.1 g/t
Currently only mining and
exploration on one of these
past producers
Toburn
Click to edit Master title style
• Click to edit Master
text styles
– Second level
• Third level
– Fourth level
» Fifth level
• Click to edit Master
text styles
– Second level
• Third level
– Fourth level
» Fifth level
TSX:KGI 29 klgold.com
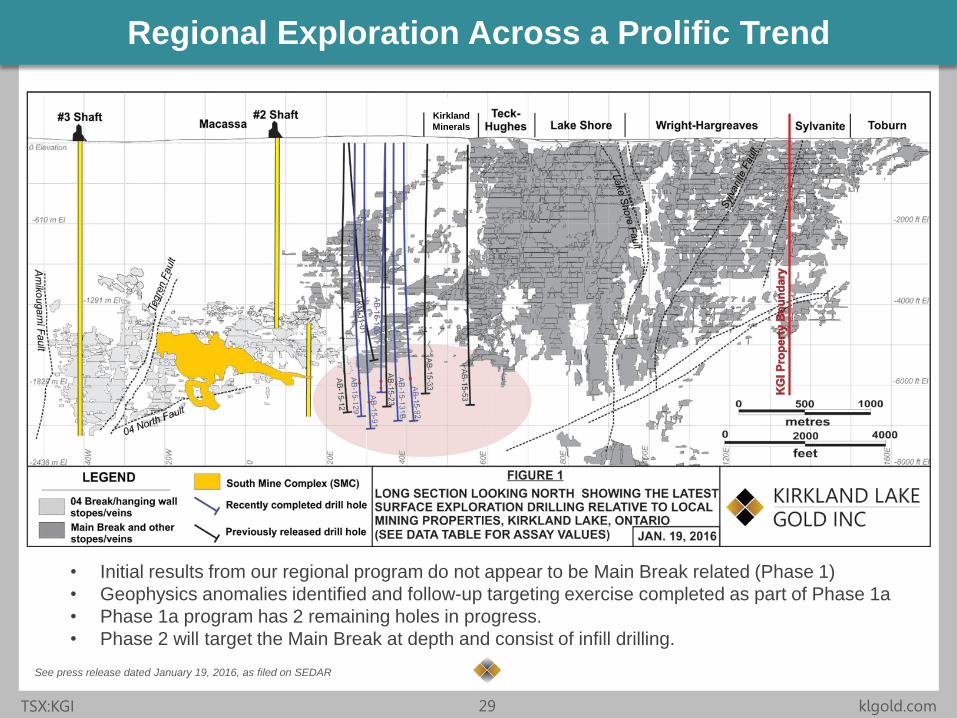
Regional Exploration Across a Prolific Trend
• Initial results from our regional program do not appear to be Main Break related (Phase 1)
• Geophysics anomalies identified and follow-up targeting exercise completed as part of Phase 1a
• Phase 1a program has 2 remaining holes in progress.
• Phase 2 will target the Main Break at depth and consist of infill drilling.
Kirkland
Minerals
See press release dated January 19, 2016, as filed on SEDAR
Click to edit Master title style
• Click to edit Master
text styles
– Second level
• Third level
– Fourth level
» Fifth level
• Click to edit Master
text styles
– Second level
• Third level
– Fourth level
» Fifth level
TSX:KGI 30 klgold.com
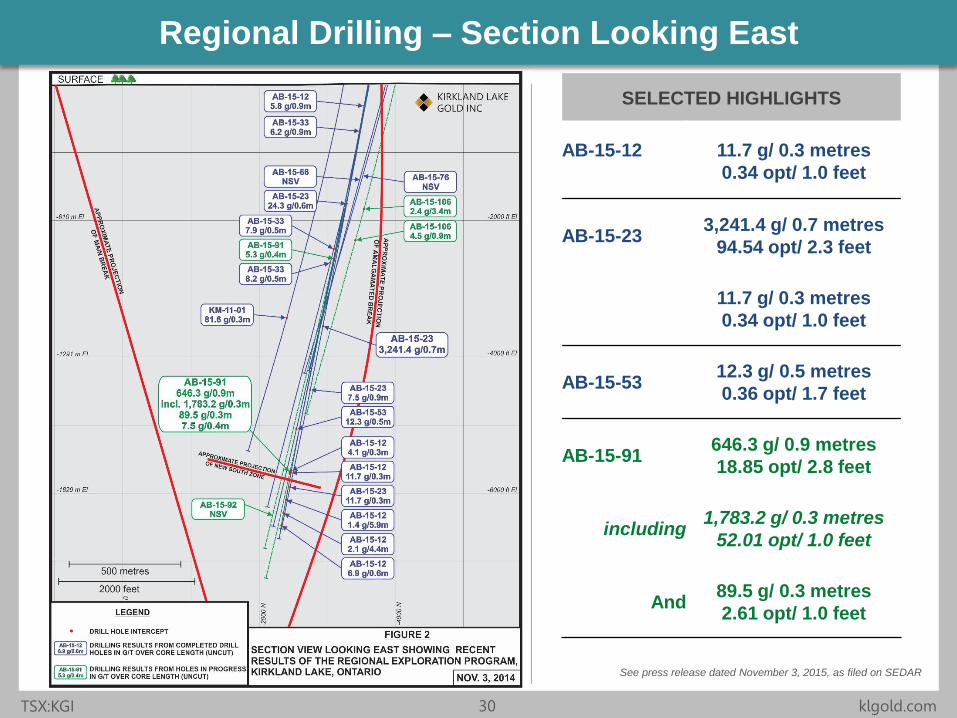
Regional Drilling – Section Looking East
SELECTED HIGHLIGHTS
AB-15-12
11.7 g/ 0.3 metres
0.34 opt/ 1.0 feet
AB-15-23 3,241.4 g/ 0.7 metres
94.54 opt/ 2.3 feet
11.7 g/ 0.3 metres
0.34 opt/ 1.0 feet
AB-15-53 12.3 g/ 0.5 metres
0.36 opt/ 1.7 feet
AB-15-91 646.3 g/ 0.9 metres
18.85 opt/ 2.8 feet
including 1,783.2 g/ 0.3 metres
52.01 opt/ 1.0 feet
And 89.5 g/ 0.3 metres
2.61 opt/ 1.0 feet
See press release dated November 3, 2015, as filed on SEDAR

Click to edit Master title style
• Click to edit Master
text styles
– Second level
• Third level
– Fourth level
» Fifth level
• Click to edit Master
text styles
– Second level
• Third level
– Fourth level
» Fifth level
TSX:KGI 31 klgold.com
Future Upside Potential
Yet to Be Unlocked
BUILDING VALUE
Click to edit Master title style
• Click to edit Master
text styles
– Second level
• Third level
– Fourth level
» Fifth level
• Click to edit Master
text styles
– Second level
• Third level
– Fourth level
» Fifth level
TSX:KGI 32 klgold.com
2.8x
1.6x 1.5x1.3x
1.2x 1.2x1.0x
0.8x 0.8x
Hecla KirklandLake
Klondex Richmont Alamos SilverStandard
Argonaut Wesdome Primero
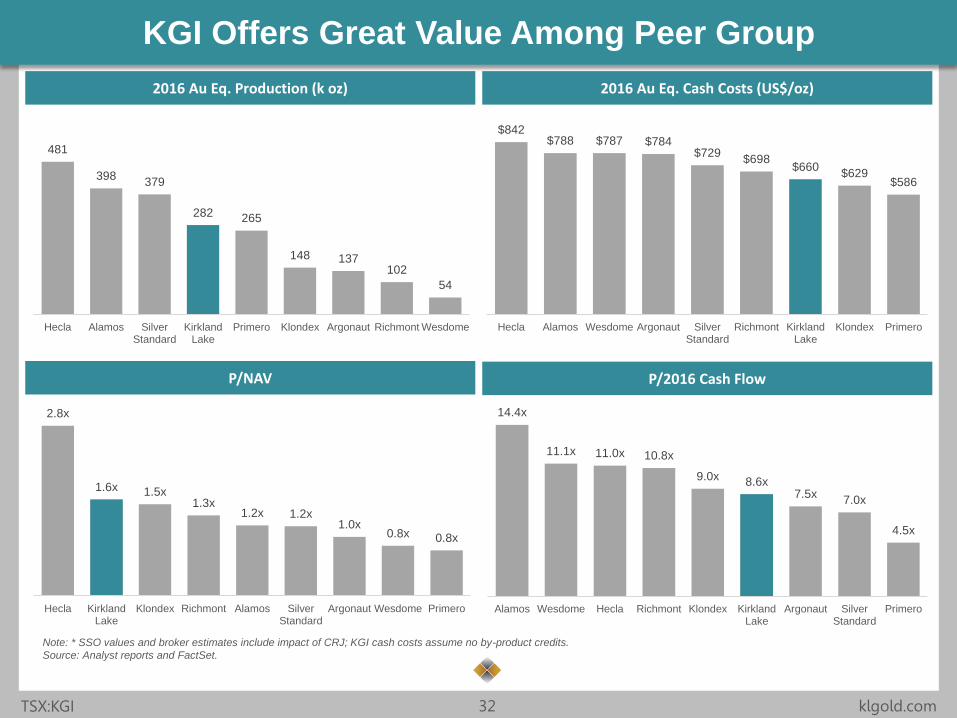
KGI Offers Great Value Among Peer Group
Note: * SSO values and broker estimates include impact of CRJ; KGI cash costs assume no by-product credits.
Source: Analyst reports and FactSet.
2016 Au Eq. Production (k oz)
P/2016 Cash Flow P/NAV
2016 Au Eq. Cash Costs (US$/oz)
14.4x
11.1x 11.0x 10.8x
9.0x 8.6x7.5x
7.0x
4.5x
Alamos Wesdome Hecla Richmont Klondex KirklandLake
Argonaut SilverStandard
Primero
$842$788 $787 $784
$729$698
$660$629
$586
Hecla Alamos Wesdome Argonaut SilverStandard
Richmont KirklandLake
Klondex Primero
481
398379
282 265
148 137102
54
Hecla Alamos SilverStandard
KirklandLake
Primero Klondex Argonaut Richmont Wesdome
Click to edit Master title style
• Click to edit Master
text styles
– Second level
• Third level
– Fourth level
» Fifth level
• Click to edit Master
text styles
– Second level
• Third level
– Fourth level
» Fifth level
TSX:KGI 33 klgold.com
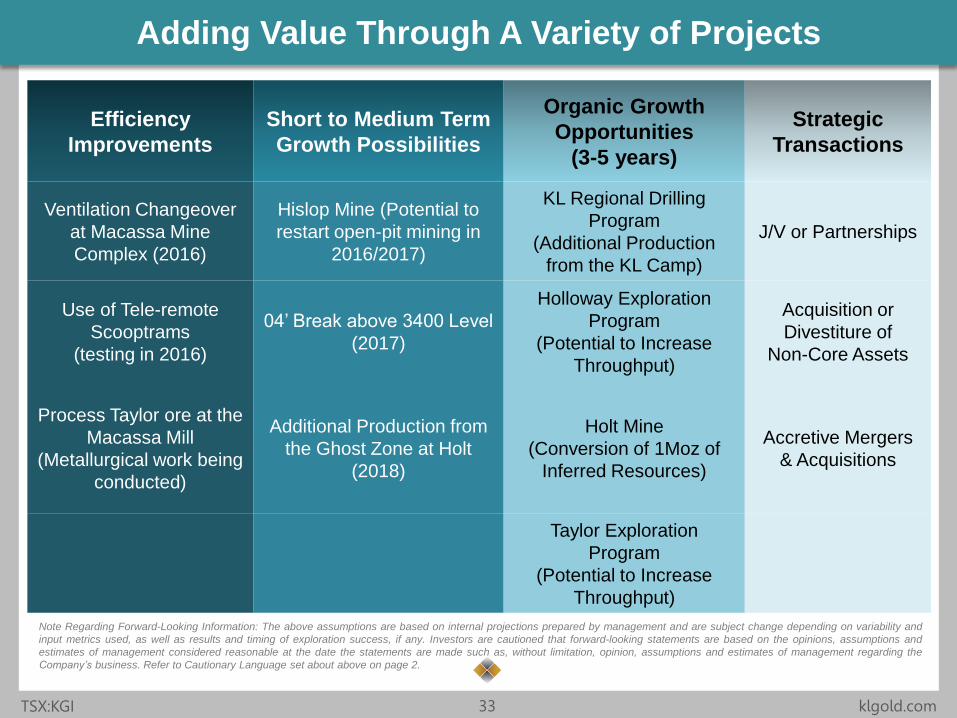
Adding Value Through A Variety of Projects
Efficiency
Improvements
Short to Medium Term
Growth Possibilities
Organic Growth
Opportunities
(3-5 years)
Strategic
Transactions
Ventilation Changeover
at Macassa Mine
Complex (2016)
Hislop Mine (Potential to
restart open-pit mining in
2016/2017)
KL Regional Drilling
Program
(Additional Production
from the KL Camp)
J/V or Partnerships
Use of Tele-remote
Scooptrams
(testing in 2016)
04’ Break above 3400 Level
(2017)
Holloway Exploration
Program
(Potential to Increase
Throughput)
Acquisition or
Divestiture of
Non-Core Assets
Process Taylor ore at the
Macassa Mill
(Metallurgical work being
conducted)
Additional Production from
the Ghost Zone at Holt
(2018)
Holt Mine
(Conversion of 1Moz of
Inferred Resources)
Accretive Mergers
& Acquisitions
Taylor Exploration
Program
(Potential to Increase
Throughput)
Note Regarding Forward-Looking Information: The above assumptions are based on internal projections prepared by management and are subject change depending on variability and
input metrics used, as well as results and timing of exploration success, if any. Investors are cautioned that forward-looking statements are based on the opinions, assumptions and
estimates of management considered reasonable at the date the statements are made such as, without limitation, opinion, assumptions and estimates of management regarding the
Company’s business. Refer to Cautionary Language set about above on page 2.
Click to edit Master title style
• Click to edit Master
text styles
– Second level
• Third level
– Fourth level
» Fifth level
• Click to edit Master
text styles
– Second level
• Third level
– Fourth level
» Fifth level
TSX:KGI 34 klgold.com
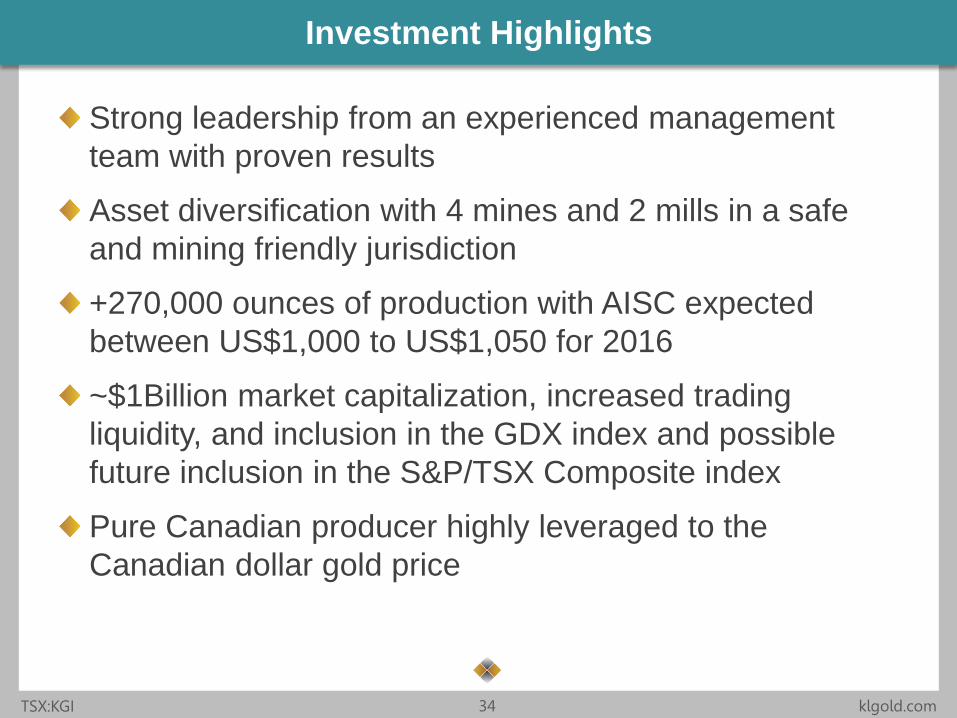
Investment Highlights
Strong leadership from an experienced management
team with proven results
Asset diversification with 4 mines and 2 mills in a safe
and mining friendly jurisdiction
+270,000 ounces of production with AISC expected
between US$1,000 to US$1,050 for 2016
~$1Billion market capitalization, increased trading
liquidity, and inclusion in the GDX index and possible
future inclusion in the S&P/TSX Composite index
Pure Canadian producer highly leveraged to the
Canadian dollar gold price

Click to edit Master title style
• Click to edit Master
text styles
– Second level
• Third level
– Fourth level
» Fifth level
• Click to edit Master
text styles
– Second level
• Third level
– Fourth level
» Fifth level
TSX:KGI 35 klgold.com
APPENDIX
Notes, additional disclosure
and other information
Click to edit Master title style
• Click to edit Master
text styles
– Second level
• Third level
– Fourth level
» Fifth level
• Click to edit Master
text styles
– Second level
• Third level
– Fourth level
» Fifth level
TSX:KGI 36 klgold.com
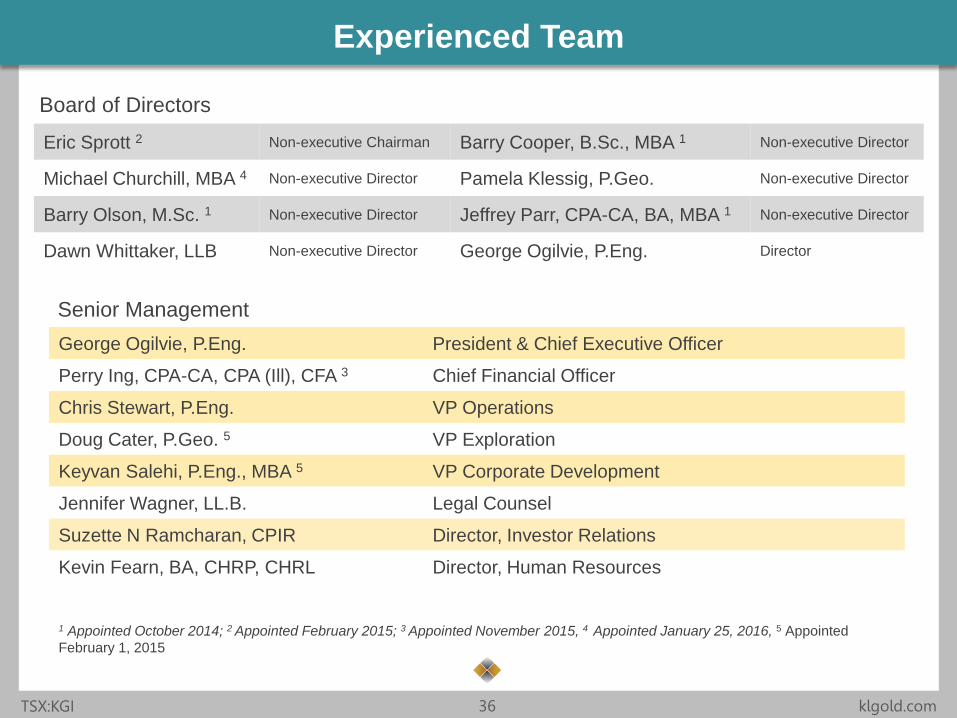
Experienced Team
Eric Sprott 2 Non-executive Chairman Barry Cooper, B.Sc., MBA 1 Non-executive Director
Michael Churchill, MBA 4 Non-executive Director Pamela Klessig, P.Geo. Non-executive Director
Barry Olson, M.Sc. 1 Non-executive Director Jeffrey Parr, CPA-CA, BA, MBA 1 Non-executive Director
Dawn Whittaker, LLB Non-executive Director George Ogilvie, P.Eng. Director
George Ogilvie, P.Eng. President & Chief Executive Officer
Perry Ing, CPA-CA, CPA (Ill), CFA 3 Chief Financial Officer
Chris Stewart, P.Eng. VP Operations
Doug Cater, P.Geo. 5 VP Exploration
Keyvan Salehi, P.Eng., MBA 5 VP Corporate Development
Jennifer Wagner, LL.B. Legal Counsel
Suzette N Ramcharan, CPIR Director, Investor Relations
Kevin Fearn, BA, CHRP, CHRL Director, Human Resources
Board of Directors
Senior Management
1 Appointed October 2014; 2 Appointed February 2015; 3 Appointed November 2015, 4 Appointed January 25, 2016, 5 Appointed
February 1, 2015
Click to edit Master title style
• Click to edit Master
text styles
– Second level
• Third level
– Fourth level
» Fifth level
• Click to edit Master
text styles
– Second level
• Third level
– Fourth level
» Fifth level
TSX:KGI 37 klgold.com
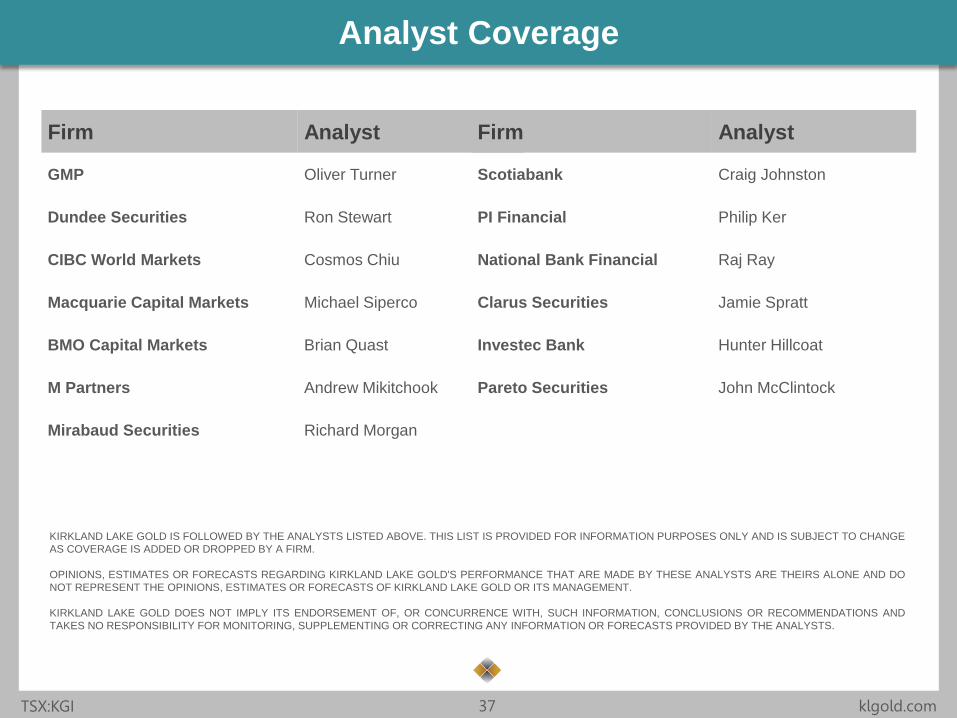
Analyst Coverage
Firm Analyst
GMP Oliver Turner
Dundee Securities Ron Stewart
CIBC World Markets Cosmos Chiu
Macquarie Capital Markets Michael Siperco
BMO Capital Markets Brian Quast
M Partners Andrew Mikitchook
Mirabaud Securities Richard Morgan
Firm Analyst
Scotiabank Craig Johnston
PI Financial Philip Ker
National Bank Financial Raj Ray
Clarus Securities Jamie Spratt
Investec Bank Hunter Hillcoat
Pareto Securities John McClintock
KIRKLAND LAKE GOLD IS FOLLOWED BY THE ANALYSTS LISTED ABOVE. THIS LIST IS PROVIDED FOR INFORMATION PURPOSES ONLY AND IS SUBJECT TO CHANGE
AS COVERAGE IS ADDED OR DROPPED BY A FIRM.
OPINIONS, ESTIMATES OR FORECASTS REGARDING KIRKLAND LAKE GOLD'S PERFORMANCE THAT ARE MADE BY THESE ANALYSTS ARE THEIRS ALONE AND DO
NOT REPRESENT THE OPINIONS, ESTIMATES OR FORECASTS OF KIRKLAND LAKE GOLD OR ITS MANAGEMENT.
KIRKLAND LAKE GOLD DOES NOT IMPLY ITS ENDORSEMENT OF, OR CONCURRENCE WITH, SUCH INFORMATION, CONCLUSIONS OR RECOMMENDATIONS AND
TAKES NO RESPONSIBILITY FOR MONITORING, SUPPLEMENTING OR CORRECTING ANY INFORMATION OR FORECASTS PROVIDED BY THE ANALYSTS.
Click to edit Master title style
• Click to edit Master
text styles
– Second level
• Third level
– Fourth level
» Fifth level
• Click to edit Master
text styles
– Second level
• Third level
– Fourth level
» Fifth level
TSX:KGI 38 klgold.com
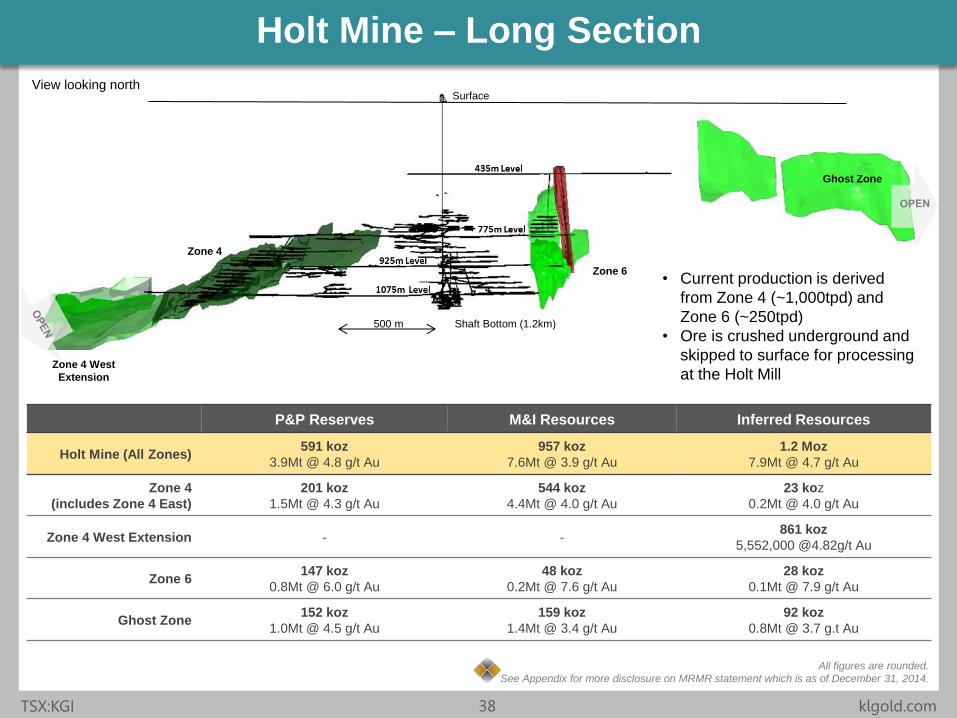
Holt Mine – Long Section
All figures are rounded.
See Appendix for more disclosure on MRMR statement which is as of December 31, 2014.
P&P Reserves M&I Resources Inferred Resources
Holt Mine (All Zones) 591 koz
3.9Mt @ 4.8 g/t Au
957 koz
7.6Mt @ 3.9 g/t Au
1.2 Moz
7.9Mt @ 4.7 g/t Au
Zone 4
(includes Zone 4 East)
201 koz
1.5Mt @ 4.3 g/t Au
544 koz
4.4Mt @ 4.0 g/t Au
23 koz
0.2Mt @ 4.0 g/t Au
Zone 4 West Extension - - 861 koz
5,552,000 @4.82g/t Au
Zone 6 147 koz
0.8Mt @ 6.0 g/t Au
48 koz
0.2Mt @ 7.6 g/t Au
28 koz
0.1Mt @ 7.9 g/t Au
Ghost Zone 152 koz
1.0Mt @ 4.5 g/t Au
159 koz
1.4Mt @ 3.4 g/t Au
92 koz
0.8Mt @ 3.7 g.t Au
500 m
Surface
Shaft Bottom (1.2km)
Ghost Zone
Zone 6
Zone 4
Zone 4 West
Extension
• Current production is derived
from Zone 4 (~1,000tpd) and
Zone 6 (~250tpd)
• Ore is crushed underground and
skipped to surface for processing
at the Holt Mill
View looking north
Click to edit Master title style
• Click to edit Master
text styles
– Second level
• Third level
– Fourth level
» Fifth level
• Click to edit Master
text styles
– Second level
• Third level
– Fourth level
» Fifth level
TSX:KGI 39 klgold.com
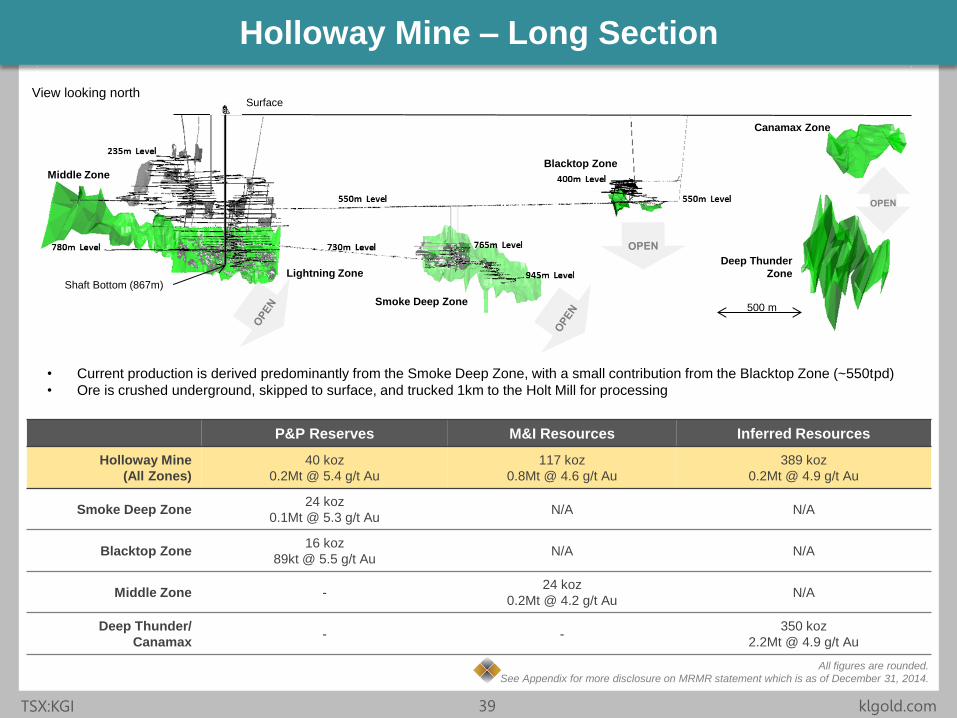
Holloway Mine – Long Section
P&P Reserves M&I Resources Inferred Resources
Holloway Mine
(All Zones)
40 koz
0.2Mt @ 5.4 g/t Au
117 koz
0.8Mt @ 4.6 g/t Au
389 koz
0.2Mt @ 4.9 g/t Au
Smoke Deep Zone 24 koz
0.1Mt @ 5.3 g/t Au N/A N/A
Blacktop Zone 16 koz
89kt @ 5.5 g/t Au N/A N/A
Middle Zone - 24 koz
0.2Mt @ 4.2 g/t Au N/A
Deep Thunder/
Canamax - -
350 koz
2.2Mt @ 4.9 g/t Au
All figures are rounded.
See Appendix for more disclosure on MRMR statement which is as of December 31, 2014.
• Current production is derived predominantly from the Smoke Deep Zone, with a small contribution from the Blacktop Zone (~550tpd)
• Ore is crushed underground, skipped to surface, and trucked 1km to the Holt Mill for processing
Surface
500 m
Shaft Bottom (867m)
Smoke Deep Zone
Blacktop Zone
Canamax Zone
Deep Thunder
Zone
View looking north
Middle Zone
Lightning Zone
Click to edit Master title style
• Click to edit Master
text styles
– Second level
• Third level
– Fourth level
» Fifth level
• Click to edit Master
text styles
– Second level
• Third level
– Fourth level
» Fifth level
TSX:KGI 40 klgold.com
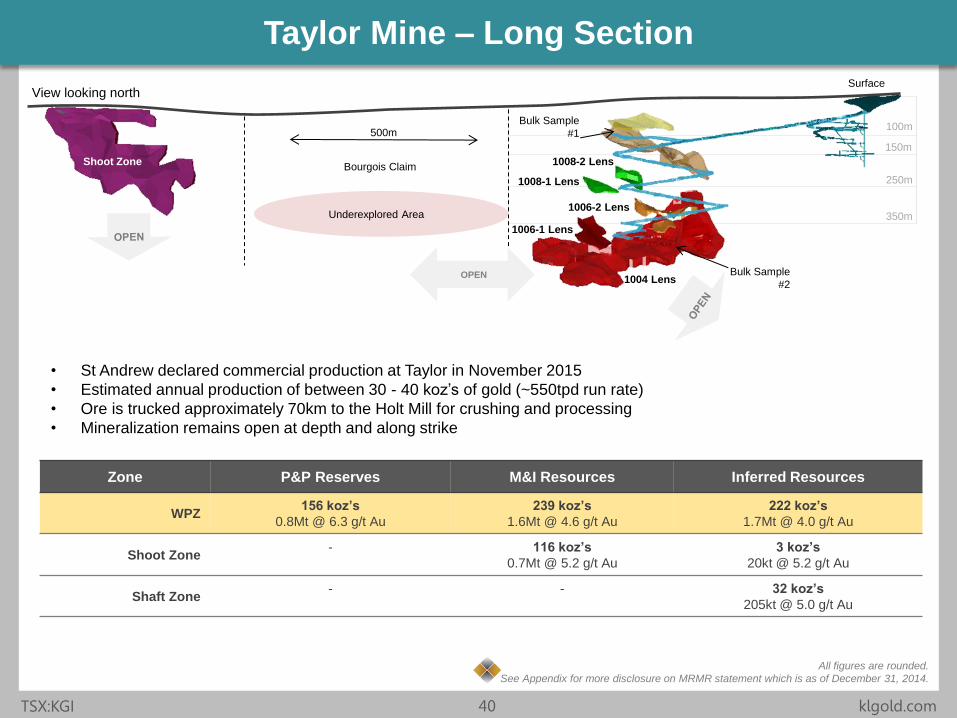
150m
Taylor Mine – Long Section
Zone P&P Reserves M&I Resources Inferred Resources
WPZ 156 koz’s
0.8Mt @ 6.3 g/t Au
239 koz’s
1.6Mt @ 4.6 g/t Au
222 koz’s
1.7Mt @ 4.0 g/t Au
Shoot Zone - 116 koz’s
0.7Mt @ 5.2 g/t Au
3 koz’s
20kt @ 5.2 g/t Au
Shaft Zone - - 32 koz’s
205kt @ 5.0 g/t Au
Surface
Bourgois Claim Shoot Zone
All figures are rounded.
See Appendix for more disclosure on MRMR statement which is as of December 31, 2014.
• St Andrew declared commercial production at Taylor in November 2015
• Estimated annual production of between 30 - 40 koz’s of gold (~550tpd run rate)
• Ore is trucked approximately 70km to the Holt Mill for crushing and processing
• Mineralization remains open at depth and along strike
Bulk Sample
#1
Bulk Sample
#2 1004 Lens
1006-1 Lens
1008-1 Lens
1008-2 Lens
100m
250m
350m 1006-2 Lens
500m
View looking north
OPEN
Underexplored Area
Click to edit Master title style
• Click to edit Master
text styles
– Second level
• Third level
– Fourth level
» Fifth level
• Click to edit Master
text styles
– Second level
• Third level
– Fourth level
» Fifth level
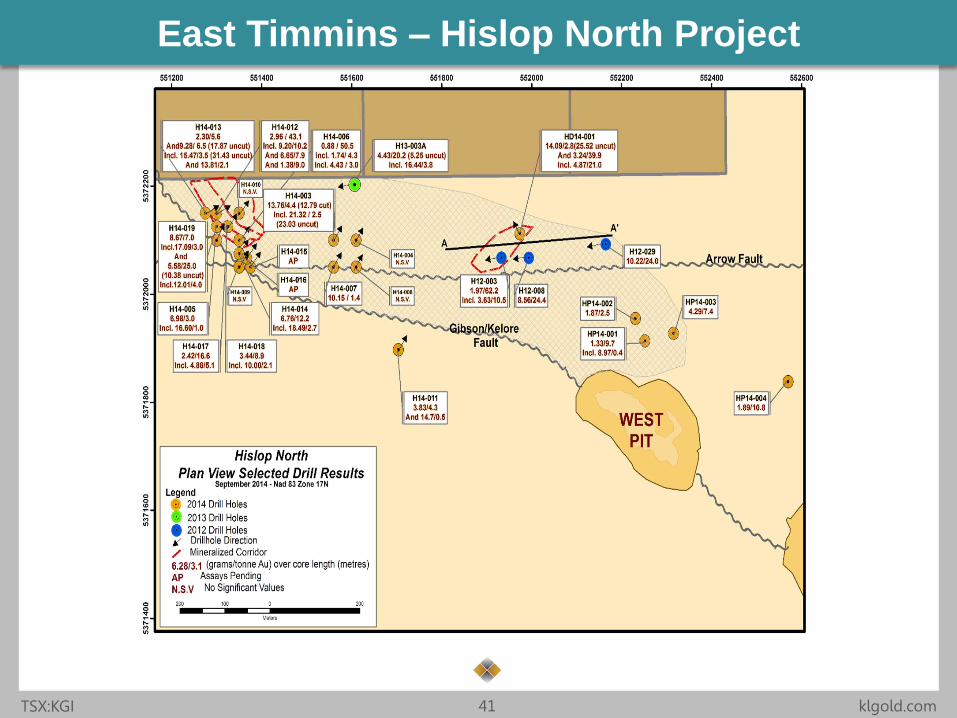
TSX:KGI 41 klgold.com
East Timmins – Hislop North Project
Click to edit Master title style
• Click to edit Master
text styles
– Second level
• Third level
– Fourth level
» Fifth level
• Click to edit Master
text styles
– Second level
• Third level
– Fourth level
» Fifth level
TSX:KGI 42 klgold.com
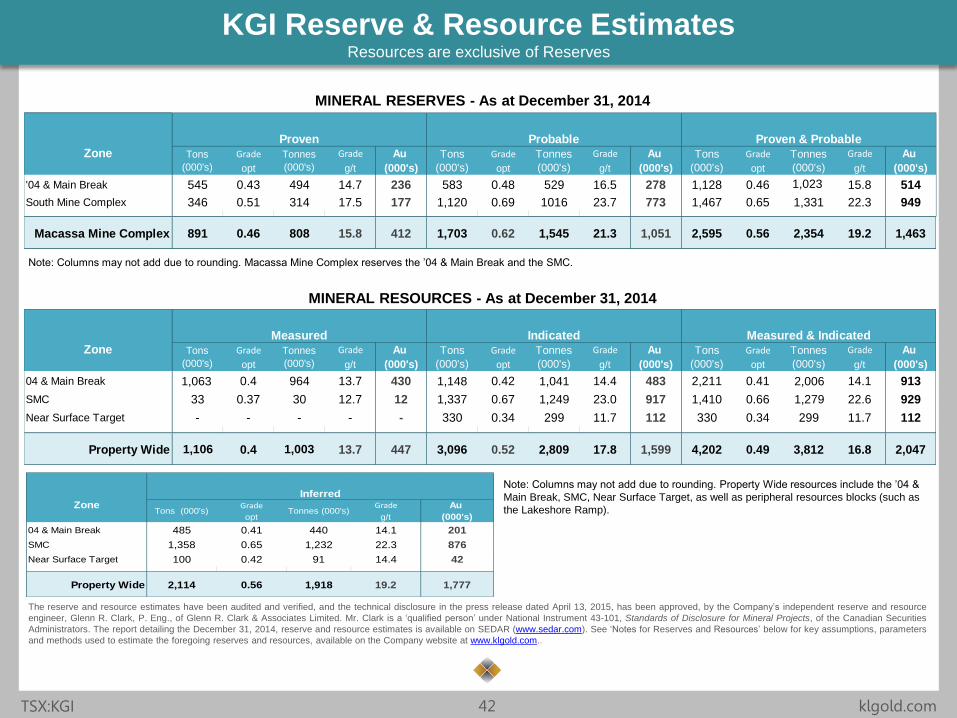
KGI Reserve & Resource Estimates Resources are exclusive of Reserves
MINERAL RESERVES - As at December 31, 2014
Note: Columns may not add due to rounding. Macassa Mine Complex reserves the ’04 & Main Break and the SMC.
MINERAL RESOURCES - As at December 31, 2014
Grade Grade Au
opt g/t (000's)
04 & Main Break 485 0.41 440 14.1 201
SMC 1,358 0.65 1,232 22.3 876
Near Surface Target 100 0.42 91 14.4 42
Property Wide 2,114 0.56 1,918 19.2 1,777
ZoneTons (000's) Tonnes (000's)
InferredNote: Columns may not add due to rounding. Property Wide resources include the ’04 &
Main Break, SMC, Near Surface Target, as well as peripheral resources blocks (such as
the Lakeshore Ramp).
The reserve and resource estimates have been audited and verified, and the technical disclosure in the press release dated April 13, 2015, has been approved, by the Company’s independent reserve and resource
engineer, Glenn R. Clark, P. Eng., of Glenn R. Clark & Associates Limited. Mr. Clark is a ‘qualified person’ under National Instrument 43-101, Standards of Disclosure for Mineral Projects, of the Canadian Securities
Administrators. The report detailing the December 31, 2014, reserve and resource estimates is available on SEDAR (www.sedar.com). See ‘Notes for Reserves and Resources’ below for key assumptions, parameters
and methods used to estimate the foregoing reserves and resources, available on the Company website at www.klgold.com..
Grade Grade Au Grade Grade Au Grade Grade Au
opt g/t (000's) opt g/t (000's) opt g/t (000's)
04 & Main Break 1063 0.4 964 13.7 430 1148 0.42 1041 14.4 483 2,211 0.41 2006 14.1 913
SMC 33 0.37 30 12.7 12 1377 0.67 1249 23.0 917 1,410 0.66 1279 22.6 929
Near Surface Target - - - - - 330 0.34 299 11.7 112 330 0.34 299 11.7 112
Property Wide 1106 0.4 1003 13.7 447 3,096 0.52 2,809 17.8 1,599 4,202 0.49 3,812 16.8 2,047
Measured
Tons
(000's)
Tonnes
(000's)
ZoneIndicated Measured & Indicated
Tons
(000's)
Tonnes
(000's)
Tons
(000's)
Tonnes
(000's)
1,106 1,003
1,063 1,148
1,337
1,041
1,249
2,006
1,279
Grade Grade Au Grade Grade Au Grade Grade Au
opt g/t (000's) opt g/t (000's) opt g/t (000's)
'04 & Main Break 545 0.43 494 14.7 236 583 0.48 529 16.5 278 1,128 0.46 1023 15.8 514
South Mine Complex 346 0.51 314 17.5 177 1,120 0.69 1016 23.7 773 1,467 0.65 1,331 22.3 949
Macassa Mine Complex 891 0.46 808 15.8 412 1,703 0.62 1,545 21.3 1,051 2,595 0.56 2,354 19.2 1,463
Proven
Tonnes
(000's)
Tons
(000's)
Tonnes
(000's)
ZoneProbable Proven & Probable
Tons
(000's)
Tonnes
(000's)
Tons
(000's)
1,023
Click to edit Master title style
• Click to edit Master
text styles
– Second level
• Third level
– Fourth level
» Fifth level
• Click to edit Master
text styles
– Second level
• Third level
– Fourth level
» Fifth level
TSX:KGI 43 klgold.com
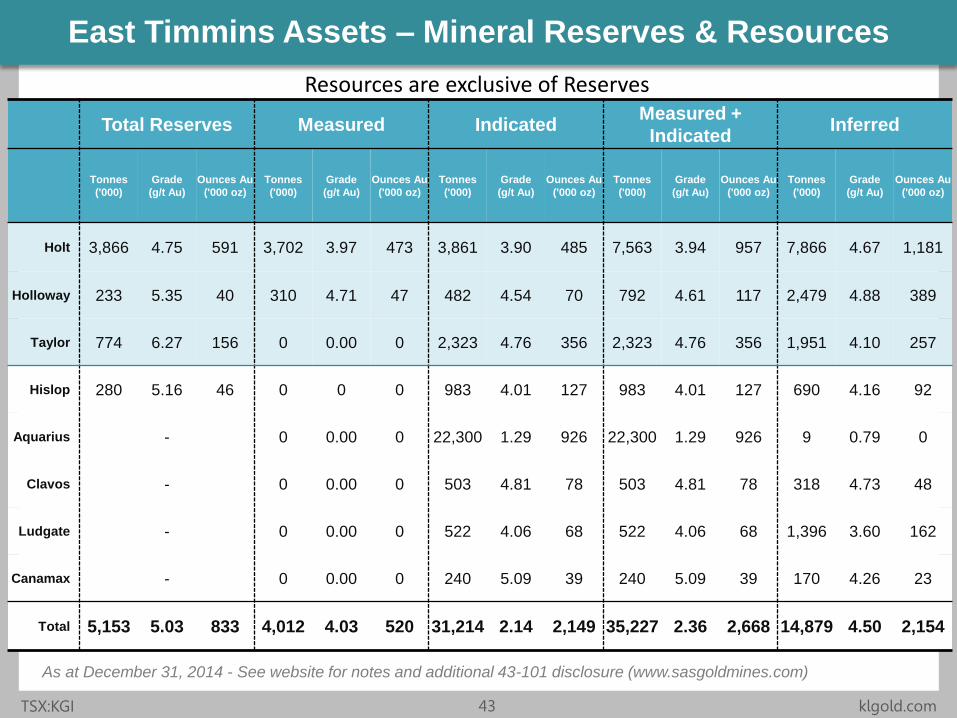
East Timmins Assets – Mineral Reserves & Resources
Total Reserves Measured Indicated Measured +
Indicated Inferred
Tonnes
('000)
Grade
(g/t Au)
Ounces Au
('000 oz)
Tonnes
('000)
Grade
(g/t Au)
Ounces Au
('000 oz)
Tonnes
('000)
Grade
(g/t Au)
Ounces Au
('000 oz)
Tonnes
('000)
Grade
(g/t Au)
Ounces Au
('000 oz)
Tonnes
('000)
Grade
(g/t Au)
Ounces Au
('000 oz)
Holt 3,866 4.75 591 3,702 3.97 473 3,861 3.90 485 7,563 3.94 957 7,866 4.67 1,181
Holloway 233 5.35 40 310 4.71 47 482 4.54 70 792 4.61 117 2,479 4.88 389
Taylor 774 6.27 156 0 0.00 0 2,323 4.76 356 2,323 4.76 356 1,951 4.10 257
Hislop 280 5.16 46 0 0 0 983 4.01 127 983 4.01 127 690 4.16 92
Aquarius - 0 0.00 0 22,300 1.29 926 22,300 1.29 926 9 0.79 0
Clavos - 0 0.00 0 503 4.81 78 503 4.81 78 318 4.73 48
Ludgate - 0 0.00 0 522 4.06 68 522 4.06 68 1,396 3.60 162
Canamax - 0 0.00 0 240 5.09 39 240 5.09 39 170 4.26 23
Total 5,153 5.03 833 4,012 4.03 520 31,214 2.14 2,149 35,227 2.36 2,668 14,879 4.50 2,154
As at December 31, 2014 - See website for notes and additional 43-101 disclosure (www.sasgoldmines.com)
Resources are exclusive of Reserves
Click to edit Master title style
• Click to edit Master
text styles
– Second level
• Third level
– Fourth level
» Fifth level
• Click to edit Master
text styles
– Second level
• Third level
– Fourth level
» Fifth level
TSX:KGI 44 klgold.com
www.klgold.com
Suzette N Ramcharan, CPIR
Director of Investor Relations
+1-647-361-0200
TSX:KGI