1605. water sustainability through the use of advanced ... · use of advanced biological nutrient...
TRANSCRIPT

August 2014Rick Johnson
Clearas Water RecoveryVice President, Business Development
Water Sustainability through the use of Advanced Biological
Nutrient Recovery

Agenda• Who we are• What is the technology• What are the results
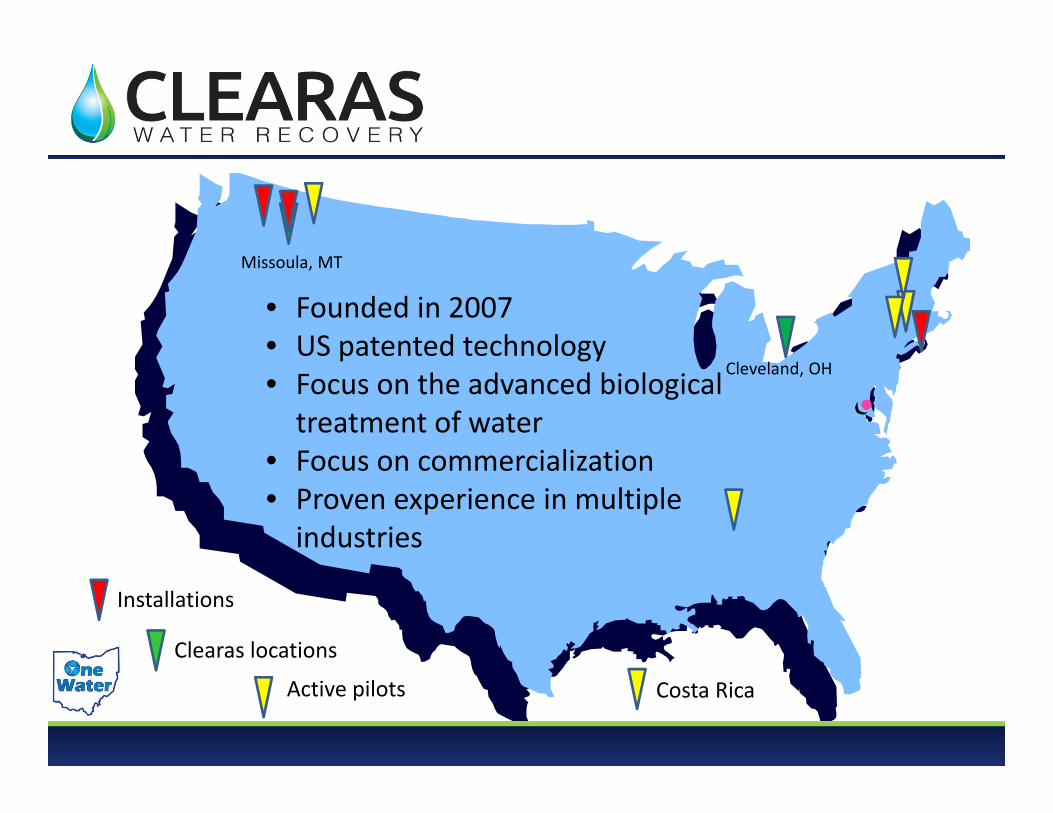
Missoula, MT
Cleveland, OH
Clearas locations
Installations
Active pilots
• Founded in 2007• US patented technology• Focus on the advanced biological treatment of water
• Focus on commercialization• Proven experience in multiple industries
Costa Rica

Whether something is a problem…..
Depends on how you look at it.
"Vision without action is a daydream. Action without vision is a nightmare."

Algae as a process / service• US Patent 8,101,080
Proven in multiple industry verticals• Municipal Wastewater• Agricultural• Pulp & Paper• Beverage• Ethanol Production• Anaerobic Digestion• Industrial Laundry • Fish Processing• Aquaculture• Chemical and Fertilizer
CO2 consumption & O2 releaseBiomass co‐productReusable water
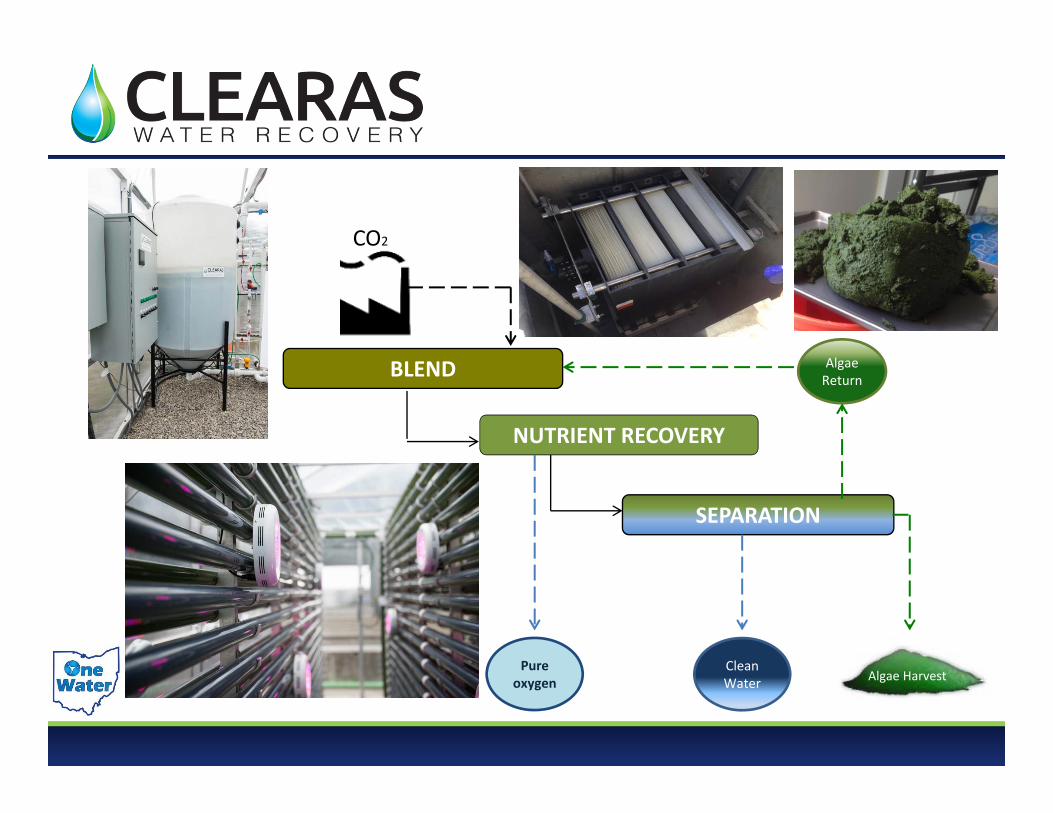
SEPARATION
NUTRIENT RECOVERY
BLEND
Clean Water
Algae Return
CO2
Algae HarvestPure
oxygen

83% 267% 500%
Activated Sludge Clearas ABNRReturn Activated Sludge (RAS) Return Activated Algae (RAA)
Waste Activated Sludge (WAS) Waste Activated Algae (WAA)
Wasting Harvest
Food/Mass Ratio Culture density

TP TN Ammonia BOD TSS TKNMunicipal 98.7% 58.9% 95.0% 85.2% 96.1% 85.5%Industrial 95.2% 92.8% 89.5% 96.5% 100.0% 94.4%Agricultural 99.6% 95.1% 92.3% 95.3% 100.0% 95.0%
0.0%
20.0%
40.0%
60.0%
80.0%
100.0%
Average redu
ction, %
Average reduction, %Municipal Industrial Agricultural

0
0.01
0.02
0.03
0.04
0.05
0.06
0.07
0 1 2 3 4 5 6
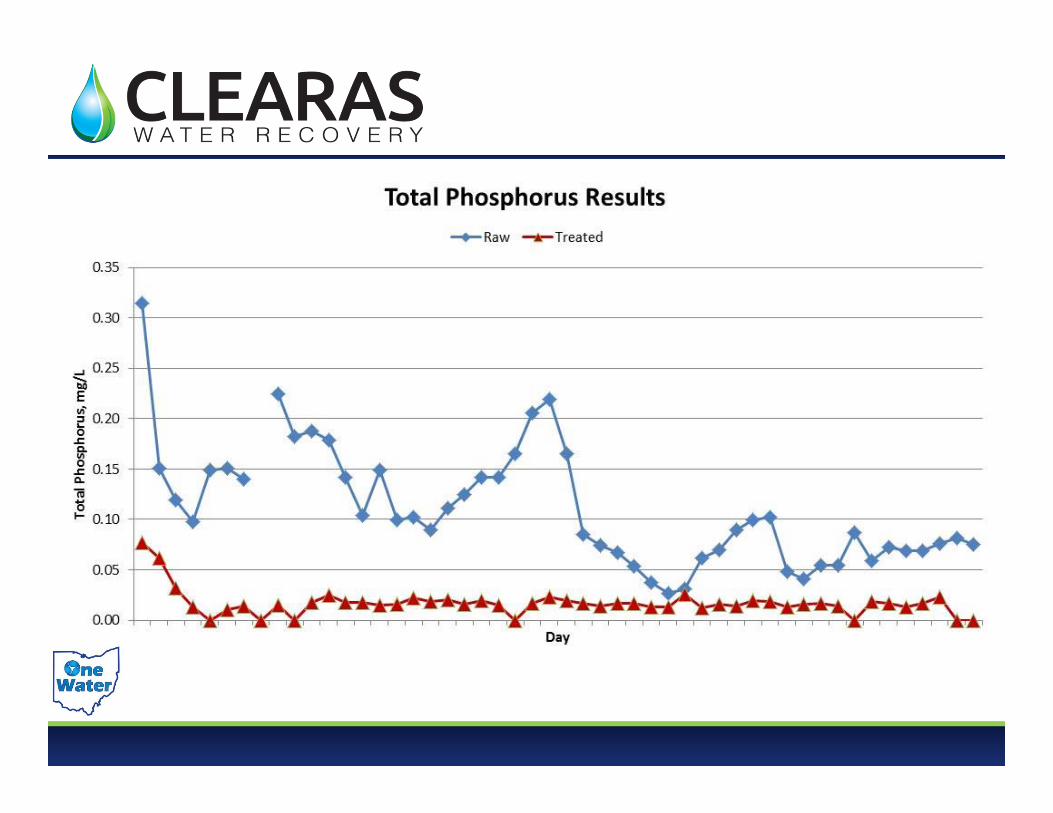
Treated TP
, mg/L
Raw TP, mg/L
Raw vs Treated TP, municipal
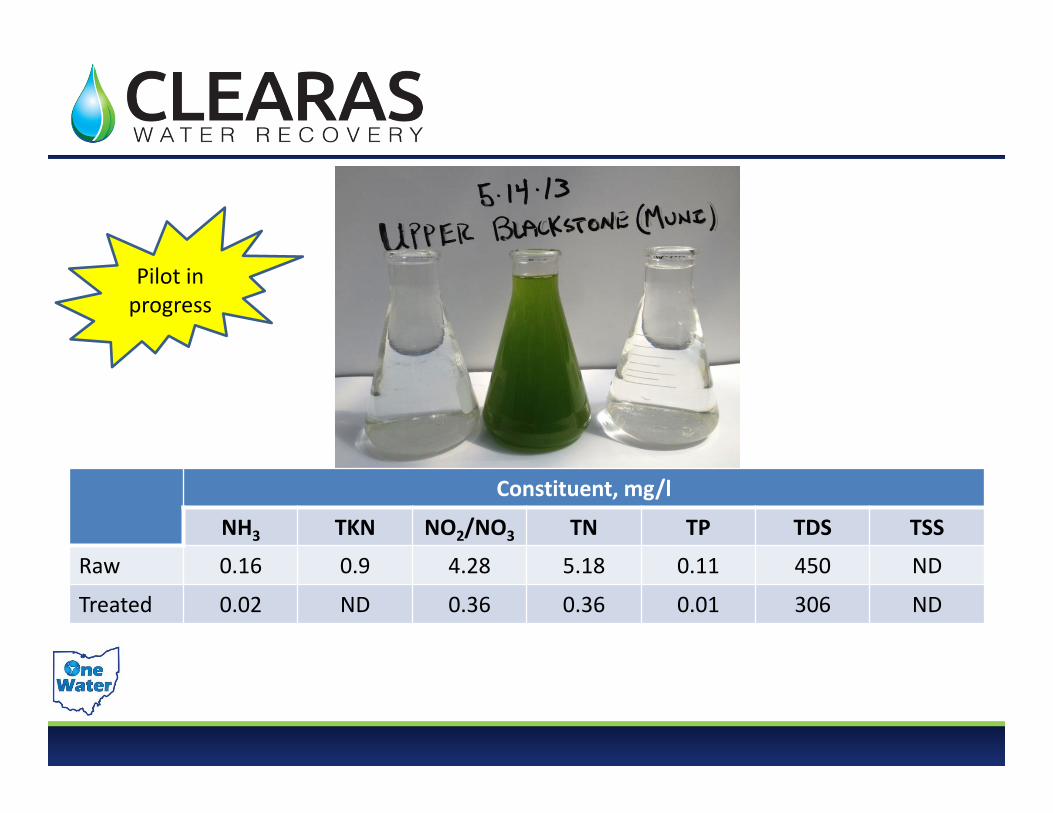
Constituent, mg/l
NH3 TKN NO2/NO3 TN TP TDS TSS
Raw 0.16 0.9 4.28 5.18 0.11 450 ND
Treated 0.02 ND 0.36 0.36 0.01 306 ND
Pilot in progress

Constituent Units Raw Treated % reductionNH3 mg/l 229 3.62 98.4%BOD mg/l 3000 4 99.9%CBOD mg/l 716 3 99.6%TKN mg/l 320 4.73 98.5%TN mg/l 320 4.93 98.5%TP mg/l 178 0.02 100.0%TSS mg/l 2600 ND 100.0%FOG (HME) mg/l 22 ND 100.0%
10 MGD

Integrated solutions for industrial applications• Food processing• Beverage production• Aquaculture• Fish processing• Beef rendering


Municipal wastewater treatmentNorthwest region municipality primary challenge –total phosphorus
Constituent Before* After* % Removal
Total P (mg/L) 0.625 0.036 94.14%
TSS (mg/L) 12.18 0.24 98.00%
PCB (pg) 2141 144.1 93.00%
14

Missoula Wastewater Plant Results:
Constituent Before After % RemovalTotal P (mg/L) 0.29 0.035 87.93%
Ammonia (mg/L) 1.038 0.012 98.84%
Total N (mg/L) 8.26 3.188 61.40%
TSS (mg/L) 3.8 0.021 99.45%
15

Inland Empire Paper Company Results
16

Dalton Utility Plant Results:Constituent Before After % Removal
Total P (mg/L) 2.68 0.18 93.3%
Ammonia (mg/L) 0.60 0.05 91.7%
Total N (mg/L) 14.1 3.26 76.9%

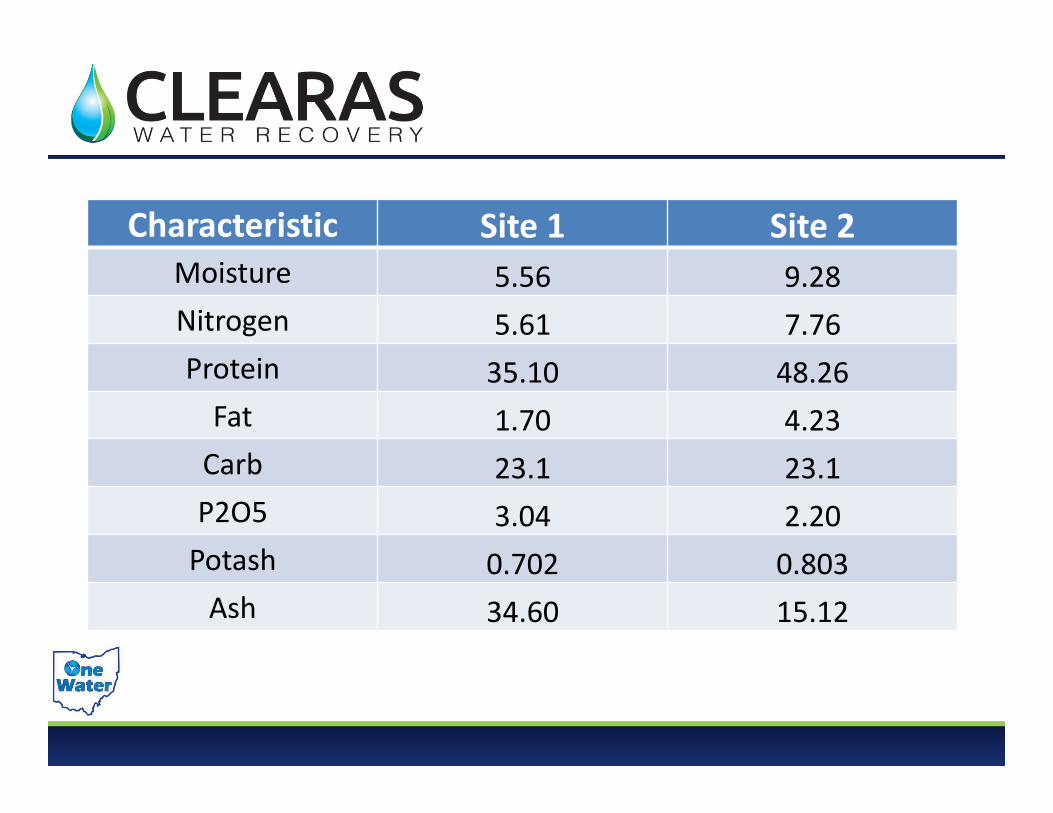
Characteristic Site 1 Site 2Moisture 5.56 9.28Nitrogen 5.61 7.76Protein 35.10 48.26Fat 1.70 4.23Carb 23.1 23.1P2O5 3.04 2.20Potash 0.702 0.803Ash 34.60 15.12

Site Flow (MGD)
Total Phosphorus, mg/L Volumeto treat % of Total Estimated
Savings, $MCurrent Target
Region 4 20 2.58 1.00 12.4 62.0% $19.0
Region 2 3.4 0.50 0.375 0.9 26.5% $6.3
Region 1 80 0.45 0.10 67.5 84.3% $31.3
Region 1 45 0.47 0.10 38.3 85.1% $16.8
Region 1 28 0.17 0.10 15.0 53.5% $32.5
Savings based on $2.50/gal. capex estimate

?

All information contained in this presentation is strictly confidential and proprietary. Not for distribution. Copyright AlgEvolve 2013
Summary• Proven solution to next generation nutrient targets• Scalable• Sustainable• Significant potential cost savings
– Capex– Opex– NPW
