15021-gem mortgages and credit cycle divergence in
TRANSCRIPT

1
Anna Samarina
Lu Zhang
Dirk Bezemer
15021-GEM
Mortgages and Credit Cycle
Divergence in Eurozone Economics
2
SOM is the research institute of the Faculty of Economics & Business at the University of Groningen. SOM has six programmes: - Economics, Econometrics and Finance - Global Economics & Management - Human Resource Management & Organizational Behaviour - Innovation & Organization - Marketing - Operations Management & Operations Research
Research Institute SOM Faculty of Economics & Business University of Groningen Visiting address: Nettelbosje 2 9747 AE Groningen The Netherlands Postal address: P.O. Box 800 9700 AV Groningen The Netherlands T +31 50 363 9090/3815 www.rug.nl/feb/research
SOM RESEARCH REPORT 12001

3
Mortgages and Credit Cycle Divergence in
Eurozone Economies Anna Samarina Faculty of Economics and Business, Department of Global Economics and Management [email protected] Lu Zhang Faculty of Economics and Business, Department of Global Economics and Management, & University of Utrecht Dirk Bezemer Faculty of Economics and Business, Department of Global Economics and Management

Mortgages and Credit Cycle Divergence inEurozone Economies
Anna Samarinaa,∗ Lu Zhanga,b
Dirk Bezemera
aUniversity of Groningen, The NetherlandsbUtrecht University, The Netherlands
This version: December 10, 2015
Abstract
The dynamics of household mortgage credit and loans to non-financial busi-
ness have diverged significantly in recent decades. In this paper we construct
and describe credit cycles for total bank credit, household mortgages and non-
financial business loans for 14 EMU economies over 1990–2013. We explore
the cross-country coherence of credit gaps measured by synchronicity of move-
ments and similarity of amplitudes, and analyze correlates of credit cycle coher-
ence. Two findings stand out. As household mortgage credit assumes a larger
share in total credit, credit cycle coherence across EMU economies decreases.
EMU membership is associated with convergence of business credit cycles but
divergence of household mortgage credit cycles. These findings survive a bat-
tery of sensitivity checks. We discuss implications for monetary policy.
Keywords: credit cycles, synchronicity, similarity, EMU
JEL Classification: E32; E44; E51; F36
∗Corresponding author: Faculty of Economics and Business, University of Groningen, PO Box800, 9700 AV Groningen, The Netherlands. Phone: +31 50 363 3689; Email: [email protected].

1 Introduction
Business cycles are linked to financial cycles. Growth recoveries are faster if they co-
incide with an upswing of the financial cycle; recessions last longer if they coincide
with a downturn of the financial cycle (Drehmann et al., 2012; IMF, 2012). The after-
math of the 2007 crisis has reminded us that ’balance sheet recessions’ (Koo, 2011)
or ’debt deflations’ (Fisher, 1933) are painfully long stagnations, when firms and
households focus on reducing debt rather than maximizing profit or consumption.
This has sparked a revival of research and policy interest in the drivers and con-
sequences of credit market conditions. Credit is ’back from the wilderness’ (Borio
and Lowe, 2004) and the credit (or financial) cycle was rediscovered (Borio, 2014).
And yet research on credit cycles is still scarce. The present paper is the first to
(i) construct and describe credit cycles for household mortgages and non-financial
business loans for 14 EMU economies over 1990–2013, (ii) construct measures for
their coherence, and (iii) analyze correlates of credit cycle coherence. Key find-
ings will be that more household mortgage credit in total credit tends to decrease
credit cycle coherence, and that EMU membership is associated with convergence
of business credit cycles (in line with convergence of business cycles) but divergence
of mortgage credit cycles, and therefore total-credit cycles.
The context to this study is one where over the last decades, bank lending, es-
pecially in advanced economies, has increased rapidly. Increasingly, credit flows
have been towards households, mostly as household mortgage loans. In a bal-
anced panel of 14 countries from 1990 to 2012 Bezemer et al. (2015) find an in-
crease in mortgage loans as percentage of total bank loans from 20% to 50% (see
also Jorda et al., 2014). One motivation for our study is that this changing com-
position of credit has adverse implications for growth and stability. It may also
impinge on monetary policy effectiveness, which depends on credit market condi-
tions (Bernanke and Gertler, 1995). This is especially relevant in the context of the
single monetary policy in the Eurozone. In the next section we discuss each of these
1

motivations for the present paper.
We construct credit cycles based on turning points and filters (Drehmann et al.,
2012). We do this for total bank credit, for credit to non-financial business and for
household mortgage credit. The data show that these are the two most important
bank credit categories, jointly accounting for about 75% of the total stock of bank
credit in our sample in 2012. We then construct measures for credit cycle coherence
following Mink et al. (2012), in terms of synchronicity (do credit cycles move in the
same direction?) and similarity (do credit cycle have similar amplitudes?).
We regress these measures in panel models on possible drivers of similarity and
synchronicity, with a particular interest in the roles of changing credit composition
over time, and of EMU membership. The findings underline the importance of dif-
ferentiating between credit types in understanding the financial cycle. We discuss
how our findings may help understand different impacts of the single monetary
policy across EMU economies.
The paper is structured as follows. Section 2 explores linkages between credit
cycles, credit composition and monetary union, which motivate this paper. The
methodology of constructing credit cycles and synchronicity and similarity mea-
sures is described in Section 3. Section 4 discusses trends in the data and key statis-
tics. Section 5 presents the results from the empirical analysis. Section 6 concludes
with summary and reflection on the findings and their policy relevance.
2 Optimal Currency Areas, Credit Cycles and the Credit Channel
of Monetary Policy
2.1 Credit Cycles, Optimal Currency Areas and EMU
The theory of optimum currency areas (OCA) (Mundell, 1961) indicates that common-
currency benefits are larger if member-states have larger similarity in their macroe-
conomic shocks and cycles (Frankel and Rose, 1998). This has sparked an exten-
2
sive literature on business cycles convergence within the European Economic and
Monetary Union (EMU), with mixed findings.1 While some studies find evidence
for increased correlation of business cycles within the EMU, particularly after the
euro adoption (Crespo-Cuaresma and Fernandez-Amador, 2013; Enders et al., 2013;
Gachter and Riedl, 2014), others report weak output coherence with no effects of the
euro changeover (Giannone et al., 2008; Canova et al., 2012; Mink et al., 2012). Also,
EMU business cycles have de-synchronized since the onset of the global financial
crisis (Gachter et al., 2012).
The many studies on business cycle convergence are not matched by compara-
ble research interest in financial cycle convergence. A currency union implies finan-
cial integration (e.g., Ingram, 1969; Mundell, 1973; Rose and Engel, 2002), but OCA
theory is silent on financial optimality conditions. This was criticized by Goodhart
(1998), who argues that the neglect in OCA theory of credit leads to the neglect of
the sustainability of debt structures and of political underpinnings of a viable cur-
rency union. Others argue that OCA theory should include optimality conditions
on capital flows and integrated credit markets, in analogy to optimality conditions
on labor mobility (Priewe, 2007). Praet (2014) points to the possibility that financial
factors may contribute to capital misallocation. Another concern is that the effects
of ECB monetary policy on aggregate bank lending are heterogeneous across euro
area countries (Angeloni et al., 2002; De Santis and Surico, 2013), particularly dur-
ing the global financial crisis (Cour-Thimann and Winkler, 2012). There is some
evidence to suggest that this may be so because different credit aggregates respond
differently to policy shocks (Ciccarelli et al., 2013, 2015).
All this suggests that understanding synchronicity of credit cycles is important
to understanding currency area optimality and sustainability, in addition to well-
known factors such as capital flows (Lane, 2006), international portfolio diversifica-
tion (McKinnon, 2002) and integration of financial markets (Baele et al., 2004; Kim
1See e.g., De Haan et al. (2008) for a survey of studies on business cycle convergence in EMU.
3
et al., 2005). A key motivation for including credit conditions in OCA is its theoret-
ical emphasis on the importance of shocks. Credit may amplify or even originate
shocks, as in Minsky’s ’Financial Instability Hypothesis’ (Minsky, 1978) and also in
more recent theoretical contributions (Kiyotaki and Moore, 1997; Brunnermeier and
Sannikov, 2014; Boissay et al., 2015). Monetary policy shocks may affect bank cap-
ital and lending (e.g., Kishan and Opiela, 2000; Stein and Kashyap, 2000; Mishkin,
2001; Ashcraft, 2006). The effects of shocks are intermediated by the interaction of
credit and real estate markets. Empirical studies (Black et al., 2010; Jimenez et al.,
2012) show that asset market shocks may have real effects through the bank lending
channel, by changing banks’ balance sheet strength and risk perception (Davis and
Zhu, 2009; Disyatat, 2011).
2.2 Differentiating Household Mortgages and Business Credit
Mortgages, which connect credit markets and real estate asset markets, take on par-
ticular relevance in this context — especially given their abundant growth in recent
years. And indeed the dynamics of mortgage credit are pivotal in understanding
credit cycle convergence, as we shall find in this paper. This conforms an emerg-
ing literature which finds that household loans (especially mortgages) and business
loans have fundamentally different impacts on growth (Werner, 1997, 2012; Jappelli
et al., 2013; Bezemer, 2014). Empirical research finds that expansion of household
mortgage loans depresses economic growth rates (Barba and Pivetti, 2009; Suther-
land et al., 2012; Jappelli et al., 2013), increases the probability of a financial crisis
(Claessens et al., 2010; Cecchetti et al., 2011) and worsens its consequences in terms
of output loss and recession duration (Lane and Milesi-Ferretti, 2011; Berkmen et al.,
2012; Babecky et al., 2013; Beck et al., 2014).
For instance, Mian and Sufi (2014) show that U.S. households with more mort-
gage debt reduced their spending more than others after 2007 (also, Mian and Sufi,
2009; Dynan, 2012). There are also spillover effects via bank balance sheets. Banks
4

holding more household mortgage loans on their books reduce lending to business
more, and firms that borrow from these banks have significantly lower investment
(Black et al., 2010; Jimenez et al., 2012; Chakraborty et al., 2014). This suggests
that it is helpful to study not just ‘the’ financial or credit cycle, but different credit
cycles, differentiating (at least) between household mortgage credit and credit to
non-financial business.
The different growth rates of credit to firms and to households have implica-
tions for monetary policy. It is plausible that changes in interest rates affect the
demand for household mortgage credit differently from the demand for business
credit for investment. If both credit types are developing along similar trends and
are driven by similar factors, there is a good case that they will respond similarly to
monetary policy, and will be well described in a common credit cycle. But the large
divergence in growth rates of household and business credit in recent decades sug-
gests that this is not the case (Angeloni et al., 2002; Ciccarelli et al., 2015). Indeed,
‘Credit View’ or ‘Credit Channel’ literature shows that the effectiveness of monetary
policies depends on credit market conditions (Bernanke and Gertler, 1995). Credit
cycle divergence across EMU economies may be one reason for different policy ef-
fects across economies. But while business cycle integration is part and parcel of
the theory of optimal currency areas, that theory is silent on credit cycle integra-
tion, as early OCA theorists already noted (Ingram, 1969; Mundell, 1973). In this
paper we connect credit market conditions – that is, the growth and composition of
credit flows – to cross-country credit cycle coherence.
2.3 Financial Cycles and Credit Dynamics
How, then, to capture the dynamics of credit and asset markets empirically? This is
the domain of research on the financial or credit cycle, defined as systematic varia-
tions in credit supply (Borio, 2014). Theoretically, credit cycles have been modeled
by e.g., Kiyotaki and Moore (1997) and Boissay et al. (2015). They are commonly
5

measured as the trend-corrected expansion and contraction in bank credit supply
and property prices over time. According to Borio (2014), financial cycles are much
longer (around 16 years) and have a larger amplitude than business cycles; their
peaks coincide with banking crises; they help to predict financial distress risk; and
they are dependent on policy regimes.
Research on the financial cycle also finds that the impact of monetary policy
regime on financial and credit cycles varies depending on the credit cycle phase.
This complements ’Credit View’ literature. It follows that if business cycle integra-
tion matters to currency area optimality, so must credit cycle integration. Studies
on their interaction find that recessions are more severe when they coincide with
a downturn of the financial cycle. Recessions tend to be longer and deeper if they
are preceded by financial booms, with rising mortgage loans and house prices, or
if they are associated with credit crunches and house price busts in the contraction
phase of the financial cycle (Igan et al., 2011; Drehmann et al., 2012; Claessens et al.,
2012).2
A recent study by Meller and Metiu (2014) is a first attempt to analyze credit
cycle co-movement and synchronization. The authors use concordance measures
and clustering techniques to study non-financial sector credit cycle synchronization
of 14 advanced economies. They group them in two clusters with distinct credit
cycles. We build on their contribution by (i) studying synchronicity and similarity
of credit cycles in the Euro area, and their possible drivers; and (ii) distinguishing
different types of credit cycles, in household mortgages and non-financial business
loans. While there is some evidence that both credit markets behave very differently
(Jorda et al., 2014; Favara and Imbs, 2015), the present paper is the first to extract
mortgage credit cycles as distinct from total-credit cycles.
2Another strand studies credit boom and credit bust episodes, rather than the cycle as a whole.One strand analyzes regularities and determinants of credit booms (see e.g., Mendoza and Terrones,2008; Borio et al., 2011; Calderon and Kubota, 2012; Furceri et al., 2012; Lane and McQuade, 2014).Credit booms are strong predictors of credit busts and financial crises (Mendoza and Terrones, 2008;Schularick and Taylor, 2012; Jorda et al., 2014).
6

3 Data and Methodology
3.1 Data
We examine credit cycles in 14 EMU countries over the period 1990–2013 with quar-
terly data. The choice of the sample period is constrained by data availability on
disaggregated credit. We use a recently constructed dataset on domestic bank credit
to the private sector, collected from central bank statistics on the consolidated bal-
ance sheets of monetary financial institutions. On the asset side of the balance sheet,
loans are reported separately as mortgages to households, household consumption
credit, credit to non-financial business, and credit to non-bank financial business.
Household mortgages and loans to non-financial business are the two principal
credit categories. We refer to Bezemer et al. (2015) for a detailed description of the
dataset.
3.2 Credit cycles construction
Most studies on business cycle fluctuations examine cycles lasting 5 to 32 quarters
(up to 8 years). Drehmann et al. (2012) analyze credit and property cycles and
compare the behavior of short-term cycles with medium-term cycles between 32
to 120 quarters (8 to 30 years). They find that the volatility of these medium-term
credit cycles is larger than of short-term cycles. Also Borio (2014) discusses that a
financial cycle lasts about 16 years. Therefore, to capture credit dynamics well, we
construct medium-term cycles of three credit series in our analysis.
We observe credit series in real terms (deflated by CPI). After logarithmic trans-
formation, following Drehmann et al. (2012) we apply the band-pass filter of Chris-
tiano and Fitzgerald (2003) in order to isolate the component of each credit series
that corresponds to a medium-term frequency.3 As the maximum length of time
3Christiano and Fitzgerald (2003) provide an optimal finite sample linear approximation to the‘ideal band-pass filter’. An ‘ideal band-pass filter’ (i.e. in a theoretical setting with unlimited ob-servations) removes all fluctuations outside the pass band, leaves fluctuations inside the pass band
7
series observations in our sample is 24 years, we select frequencies between 32 to
96 quarters.
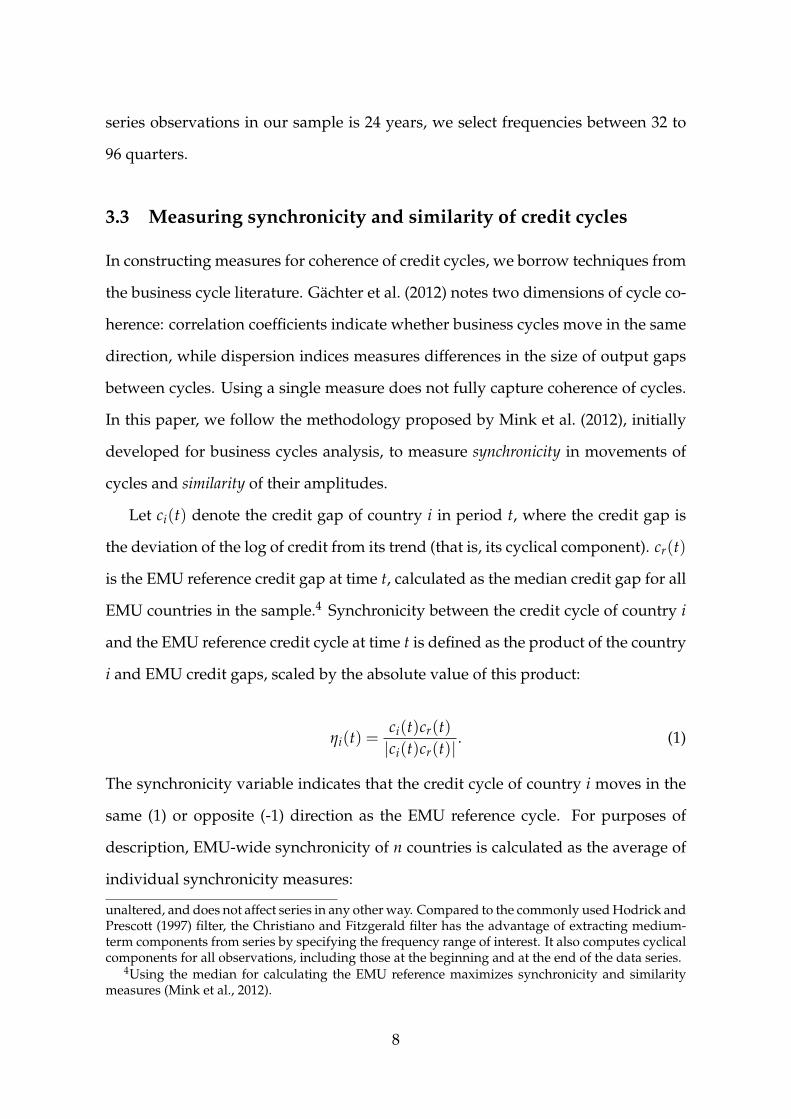
3.3 Measuring synchronicity and similarity of credit cycles
In constructing measures for coherence of credit cycles, we borrow techniques from
the business cycle literature. Gachter et al. (2012) notes two dimensions of cycle co-
herence: correlation coefficients indicate whether business cycles move in the same
direction, while dispersion indices measures differences in the size of output gaps
between cycles. Using a single measure does not fully capture coherence of cycles.
In this paper, we follow the methodology proposed by Mink et al. (2012), initially
developed for business cycles analysis, to measure synchronicity in movements of
cycles and similarity of their amplitudes.
Let ci(t) denote the credit gap of country i in period t, where the credit gap is
the deviation of the log of credit from its trend (that is, its cyclical component). cr(t)
is the EMU reference credit gap at time t, calculated as the median credit gap for all
EMU countries in the sample.4 Synchronicity between the credit cycle of country i
and the EMU reference credit cycle at time t is defined as the product of the country
i and EMU credit gaps, scaled by the absolute value of this product:
ηi(t) =ci(t)cr(t)|ci(t)cr(t)|
. (1)
The synchronicity variable indicates that the credit cycle of country i moves in the
same (1) or opposite (-1) direction as the EMU reference cycle. For purposes of
description, EMU-wide synchronicity of n countries is calculated as the average of
individual synchronicity measures:
unaltered, and does not affect series in any other way. Compared to the commonly used Hodrick andPrescott (1997) filter, the Christiano and Fitzgerald filter has the advantage of extracting medium-term components from series by specifying the frequency range of interest. It also computes cyclicalcomponents for all observations, including those at the beginning and at the end of the data series.
4Using the median for calculating the EMU reference maximizes synchronicity and similaritymeasures (Mink et al., 2012).
8

η(t) =1n
n
∑i=1
ci(t)cr(t)|ci(t)cr(t)|
. (2)
It is defined on a scale [0,1]. Credit cycles in all countries may be fully synchronized
with the EMU reference cycle (value 1). Value 0 indicates that half of countries in
the analyzed sample have credit cycles moving in the same directions, and the other
half in the opposite direction.
We then define credit cycle similarity as the difference in credit cycle amplitude
between country i credit gap and the EMU reference credit gap:
θi(t) = 1− |ci(t)− cr(t)|1n ∑n
i=1 |ci(t)|. (3)
Similarity is defined on a scale [1− n,1], where value 1 indicates that both credit
cycles have identical amplitudes and are perfectly synchronized. Similarly to syn-
chronicity, EMU-wide similarity of the n EMU countries is defined as:
θ(t) = 1− ∑ni=1 |ci(t)− cr(t)|
∑ni=1 |ci(t)|
. (4)
EMU-wide similarity takes values from 0 to 1, with higher values indicating more
similar amplitudes of credit cycles with the EMU reference cycle.
Below we explore synchronicity and similarity of total-credit cycles and of cycles
for the two credit aggregates. In Section 5 we study their correlates.
4 Stylized Facts
4.1 Credit cycles in the EMU
Figure 1 shows credit cycles for total, mortgage and non-financial business credit
for each of EMU economies and the EMU reference cycles over 1990–2013. Most
countries experienced credit booms between 2003 and 2007, followed by a credit
crunch during the global financial crisis. Although the timing of credit cycle phases
9

was rather similar, amplitudes differ substantially from country to country across
the Euro area. This is linked to the asymmetry of responses of bank credit in each
country to common monetary policy shocks (Angeloni et al., 2002; De Santis and
Surico, 2013).
There are clear differences between countries’ total and disaggregated credit cy-
cles in terms of their magnitudes and fluctuations. In Belgium, the Netherlands
and Greece, mortgage credit cycles have a bigger amplitude but the same direction
as the total cycle, while non-financial business credit cycles move in the opposite
direction. Malta and Italy also stand out as countries where mortgage credit booms
are mirrored by a large decline in non-financial business lending. The EMU ref-
erence cycles follow similar pattern. Germany and Finland have mortgage cycles
with larger amplitudes than non-financial business credit cycle. This observation
is in line with previous studies showing that credit booms in advanced countries
were caused mainly by the expansion of mortgage lending to households (Bezemer
et al., 2015; Jorda et al., 2014). All types of credit cycles co-move closely to each
other in most countries in the Eurozone periphery (Spain, Estonia, Ireland, Portu-
gal). Several core EMU economies had clearly dissimilar credit cycles in terms of
their amplitudes.
4.2 Credit cycle synchronicity and similarity across countries
We proceed to examine synchronicity and similarity of national credit cycles with
the EMU reference cycle. Table 1 and Figure A.1 (in the Appendix) show means of
synchronicity and similarity over 1990–2013 of (1) total, (2) non-financial business,
and (3) mortgage credit cycles across countries. In Table 1 we additionally report
tests for the difference in means of synchronicity/similarity between non-financial
business credit cycle and total cycle, and between mortgage credit cycle and total
cycle. For almost all countries, differences in amplitudes (’similarity’) of both cycles
10

Figure 1: Credit cycles in EMU economies
(a) AUT
−.1
−.0
50
.05
.1
1990q1 1995q1 2000q1 2005q1 2010q1 2013q4Time
(b) BEL
−.1
0.1
.2
1990q1 1995q1 2000q1 2005q1 2010q1 2013q4Time
(c) DEU
−.1
−.0
50
.05
.1
1990q1 1995q1 2000q1 2005q1 2010q1 2013q4Time
(d) ESP
−.2
−.1
0.1
.2.3
1990q1 1995q1 2000q1 2005q1 2010q1 2013q4Time
(e) EST−
.4−
.20
.2.4
.6
1990q1 1995q1 2000q1 2005q1 2010q1 2013q4Time
(f) FIN
−.1
5−
.1−
.05
0.0
5.1
1990q1 1995q1 2000q1 2005q1 2010q1 2013q4Time
(g) FRA
−.1
−.0
50
.05
.1
1990q1 1995q1 2000q1 2005q1 2010q1 2013q4Time
(h) GRC
−.2
−.1
0.1
.2.3
1990q1 1995q1 2000q1 2005q1 2010q1 2013q4Time
(i) IRE−
.4−
.20
.2.4
1990q1 1995q1 2000q1 2005q1 2010q1 2013q4Time
(j) ITA
−.1
5−
.1−
.05
0.0
5.1
1990q1 1995q1 2000q1 2005q1 2010q1 2013q4Time
(k) LUX
−.2
−.1
0.1
.2.3
1990q1 1995q1 2000q1 2005q1 2010q1 2013q4Time
(l) MLT
−.4
−.2
0.2
.4
1990q1 1995q1 2000q1 2005q1 2010q1 2013q4Time
(m) NLD
−.1
5−
.1−
.05
0.0
5.1
1990q1 1995q1 2000q1 2005q1 2010q1 2013q4Time
(n) PRT
−.2
−.1
0.1
.2
1990q1 1995q1 2000q1 2005q1 2010q1 2013q4Time
(o) EMU
−.1
−.0
50
.05
.1
1990q1 1995q1 2000q1 2005q1 2010q1 2013q4Time
Notes: Based on authors’ calculations. Solid lines show total credit cycles, dashed lines — mortgage credit cycles, and dottedlines — non-financial business credit cycles.
11

with the total-credit cycle are statistically significant. This supports the study of
separate cycles.
Table 1: Synchronicity and similarity of credit cycles
Synchronicity Similarity
Total credit Non-fin. bus. Mortgage Total credit Non-fin. bus. Mortgagecycle credit cycle cycle cycle credit cycle cycle
Austria 0.233 0.342 −0.726*** 0.523 0.504 0.248***Belgium 0.833 0.800 0.667 0.593 0.689 0.348***Germany −0.167 −0.104 0.000*** 0.206 0.333*** 0.333***Spain 0.953 0.435*** 0.882 0.005 −0.247*** 0.341***Estonia 0.906 0.250*** 0.906 −1.714 −1.938 −1.442***Finland 0.735 0.152*** 0.227*** 0.665 0.145*** 0.093***France 0.630 0.531 0.358*** 0.639 0.718** 0.480***Greece 0.583 0.667 0.708** 0.115 0.379*** 0.010***Ireland 0.909 0.409*** 0.864 −0.892 −1.593*** −0.113***Italy 0.778 0.365*** 0.619* 0.797 0.581*** 0.576***Luxemburg 0.633 0.867* 0.567 −0.748 0.573*** 0.605***Malta 0.528 0.417 0.417 0.831 0.366*** −0.336***Netherlands 0.441 0.634* 0.462 0.667 0.535** 0.619**Portugal 0.229 0.625*** −0.104*** 0.102 0.095 0.161EMU-wide 0.547 0.453*** 0.390*** 0.203 0.151*** 0.205
Notes: The Table reports means of individual and EMU-wide synchronicity and similarity over the period 1990–2013.***p<0.01, **p<0.05, *p<0.1, p-values indicate that the mean difference of synchronicity/similarity between types of creditcycles is statistically significant on 1%, 5%, or 10% level, respectively. The null hypothesis of a two-sided mean comparisont-test is that the mean difference is zero: H0: mean (synchronicity/similarity of cycle A) – mean (synchronicity/similarity of cycleB)= 0. The alternative hypothesis is that the mean difference is not zero.
We find low synchronicity for non-financial business credit cycles, while mort-
gage cycles have been more synchronous in 6 countries. The latter could be ex-
plained by the global housing boom in the 2000s, preceding the global financial
crisis (see e.g., Dokko et al., 2011; Jorda et al., 2014). The mean of EMU-wide sim-
ilarity is rather low for all types of credit cycles, suggesting that amplitudes of all
types of credit cycles are dissimilar across the Euro area.
We observe large variation between countries in how coherent credit cycles are
with the EMU reference cycle. Total-credit cycles in Spain, Estonia, and Ireland are
most synchronized with the EMU cycle, while Austria, Germany, and Portugal have
the lowest synchronicity values in the sample. At least one of their cycles is moving
in opposite direction to the EMU reference cycle. Cycles in EMU core economies are
12

less synchronized with the EMU cycle than in EMU periphery economies. These
observations support Praet (2014) who argues that financial cycles of individual
countries within the Euro area are still very heterogeneous.
Notably, synchronicity need not imply similarity. For instance, in Spain and
Ireland total credit cycles move quite synchronously with the EMU reference cycle,
but have different credit amplitudes. And vice versa, the Austrian mortgage credit
cycle moves in the opposite direction but with a relatively similar amplitude to
the EMU reference cycle. In the analysis we will distinguish between credit cycle
similarity with and without credit cycle synchronicity.
4.3 Synchronicity and similarity of credit cycles over time
We study EMU-wide synchronicity and similarity of total-credit and differentiated
credit cycles over time in Figure 2. All credit cycles in the EMU became more
synchronized over 1990–1996, with EMU-wide synchronicity of total and business
credit cycles reaching its maximum value of 1 around 1996. This coincided with
an increase also in the similarity measure across the Euro area. In contrast, the two
years before and several years after euro creation saw a substantial decline in syn-
chronicity and similarity. We test the possible association of the EMU membership
with reduced credit cycle coherence in the next section.
The second wave of increases in EMU-wide synchronicity and similarity oc-
curred during the period 2005–2012. It was associated with the run-up to and un-
folding of the global financial crisis and the European sovereign debt crisis. Credit
cycles co-moved closely during the 2005–2007 credit boom. In the aftermath of the
2008 credit bust and debt crisis, all credit cycles started diverging from the EMU
reference cycle.
13
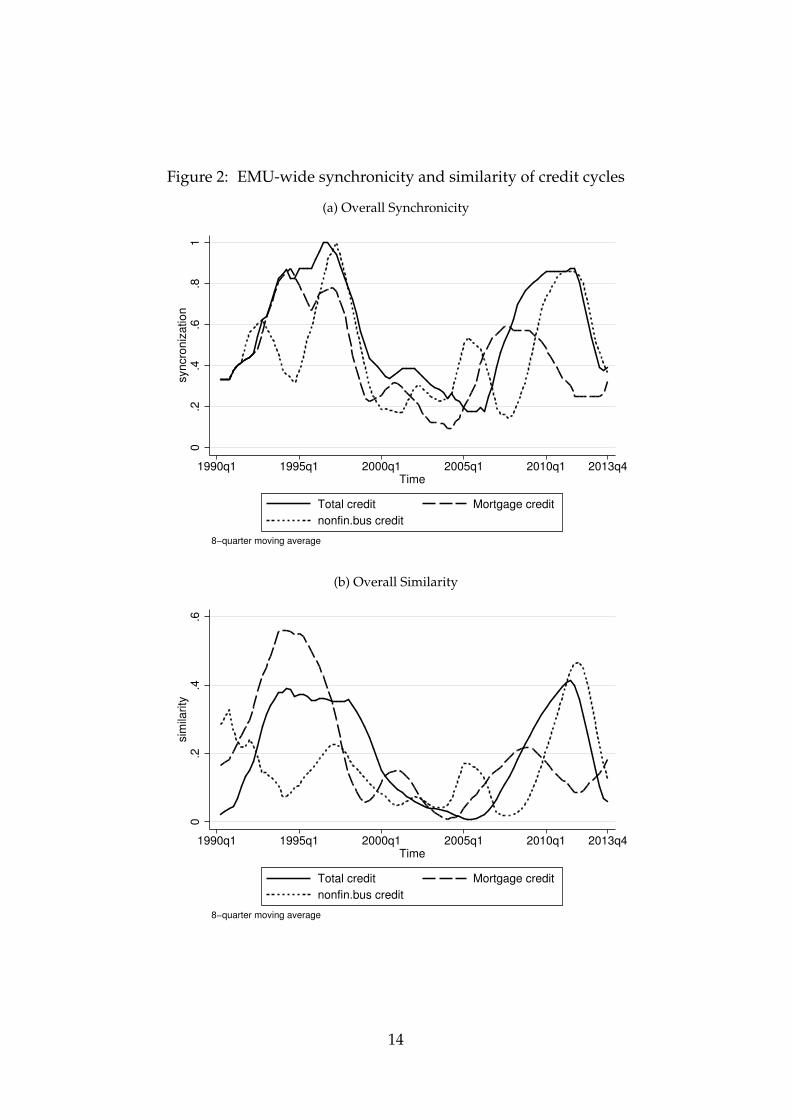
Figure 2: EMU-wide synchronicity and similarity of credit cycles
(a) Overall Synchronicity0
.2.4
.6.8
1syn
cro
niz
atio
n
1990q1 1995q1 2000q1 2005q1 2010q1 2013q4Time
Total credit Mortgage credit
nonfin.bus credit
8−quarter moving average
(b) Overall Similarity
0.2
.4.6
sim
ilarity
1990q1 1995q1 2000q1 2005q1 2010q1 2013q4Time
Total credit Mortgage credit
nonfin.bus credit
8−quarter moving average
14

4.4 Synchronicity and similarity of credit cycles: pre- and post-
EMU comparison
In Table 2 we report means of individual and EMU-wide synchronicity and similar-
ity in the pre- and post-EMU periods, and test for differences in means. To control
for the impact of financial crisis years, the ‘post-EMU (07)’ period runs till the end
of 2007, and the ‘post-EMU (13)’ till the end of 2013.
The mean comparison tests show that credit cycles in the Euro area have become
both more de-synchronized and more dissimilar after euro adoption, for all types
of credit and for both post-EMU periods. Large de-synchronization in the post-
EMU period is observed for mortgage and non-financial business credit cycles. In
particular, Germany, The Netherlands and Portugal experienced a significant and
substantial divergence of total and mortgage cycles from the EMU reference cycle
after euro introduction. This is also true for non-financial business credit cycles in
Finland, Spain, Greece, Italy, and Portugal.
The direction of change in similarity varies: credit gaps in some countries be-
came more similar in amplitudes (e.g., Austria, France, Finland, Greece), while their
dispersion broadened in other member-states (e.g., Spain, Germany, The Nether-
lands, Portugal). Germany, The Netherlands, and Portugal exhibit consistent pat-
terns: their credit cycles became less synchronized and less similar with the EMU
reference cycles after euro creation.
These explorations show that more synchronous credit cycles can be quite dis-
similar, confirming that these are indeed different dimensions of credit cycle coher-
ence. Total and disaggregated credit cycles differ significantly on both dimensions
and this supports their separate analysis. That is, even if a total-credit cycle of a
country is more synchronous and/or similar to the EMU reference total-credit cy-
cle, this need not hold for mortgage and non-financial business credit cycles. Also,
credit cycles became both less synchronous and similar after euro adoption.
15

Tabl
e2:
Sync
hron
icit
yan
dsi
mila
rity
:bef
ore
and
afte
rEM
U
Pane
lA:S
ynch
roni
city
Cou
ntry
tota
lcre
ditc
ycle
non-
finan
cial
busi
ness
cred
itcy
cle
mor
tgag
ecr
edit
cycl
ePr
e-EM
UPo
st-E
MU
(07)
Post
-EM
U(1
3)Pr
e-EM
UPo
st-E
MU
(07)
Post
-EM
U(1
3)Pr
e-EM
UPo
st-E
MU
(07)
Post
-EM
U(1
3)A
ustr
ia−
0.07
70.
111
0.30
0−
0.07
70.
500*
0.43
3*−
0.69
2−
0.72
2−
0.73
3Be
lgiu
m0.
833
0.83
30.
667
0.80
00.
833
0.66
7G
erm
any
0.50
0−
0.83
3***
−0.
567*
**−
0.16
70.
333*
*−
0.06
70.
556−
0.44
4***
−0.
333*
**Sp
ain
0.92
00.
944
0.96
70.
840−
0.05
6***
0.26
7***
1.00
00.
778*
*0.
833*
*Es
toni
a0.
900
0.83
30.
000
0.33
30.
900
0.83
3Fi
nlan
d1.
000
0.77
80.
700
1.00
0−
0.38
9***
0.06
7***
0.30
00.
227
Fran
ce0.
714
0.66
70.
600
0.61
90.
333
0.50
00.
238
0.55
60.
400
Gre
ece
0.59
10.
214*
0.57
70.
773
0.21
4***
0.57
70.
545
0.71
40.
846*
*Ir
elan
d0.
900
0.90
90.
200
0.40
90.
700
0.86
4It
aly
1.00
00.
889
0.76
71.
000−
0.05
6***
0.33
3***
1.00
00.
722
0.60
0Lu
xem
burg
0.66
70.
633
0.77
80.
867
0.83
30.
567
Mal
ta0.
417
0.75
0*0.
417
0.41
70.
542
0.16
7*N
ethe
rlan
ds0.
818−
0.27
8***
0.23
3***
0.51
50.
667
0.70
00.
758
0.00
0***
0.30
0***
Port
ugal
0.88
9−
0.88
9***
−0.
167*
**1.
000
0.16
7***
0.40
0***
0.61
1−
0.77
8***
−0.
533*
**EM
U-w
ide
0.61
20.
361*
**0.
515*
**0.
479
0.27
7***
0.43
7***
0.49
90.
337*
**0.
345*
**
Pane
lB:S
imil
arit
yto
talc
redi
tcyc
leno
nfin.
bus.
cred
itcy
cle
mor
tgag
ecr
edit
cycl
ePr
e-EM
UPo
st-E
MU
(07)
Post
-EM
U(1
3)Pr
e-EM
UPo
st-E
MU
(07)
Post
-EM
U(1
3)Pr
e-EM
UPo
st-E
MU
(07)
Post
-EM
U(1
3)A
ustr
ia0.
128
0.59
5***
0.60
9***
0.33
90.
543*
0.53
90.
371
0.32
20.
221*
*Be
lgiu
m0.
603
0.59
30.
604
0.68
90.
527
0.34
8G
erm
any
0.14
80.
141
0.24
10.
217
0.46
7***
0.40
2***
0.73
60.
095*
**0.
091*
**Sp
ain
0.36
7−
0.07
6***
−0.
145*
**−
0.01
4−
0.30
3**
−0.
344*
*0.
618
0.44
4**
0.22
6***
Esto
nia
−1.
903
−0.
893*
**−
2.22
1−
0.70
6***
−1.
716
−0.
254*
**Fi
nlan
d0.
768
0.61
3*0.
651
−0.
395−
0.07
0***
0.19
9***
0.13
00.
093
Fran
ce0.
450
0.77
1***
0.70
5***
0.62
40.
731
0.75
10.
408
0.60
2*0.
505
Gre
ece
−0.
070
0.14
20.
272*
*0.
032
0.60
2***
0.67
3***
−0.
123
0.09
40.
122
Irel
and
−1.
203
−0.
892
−1.
601
−1.
593
−0.
215
−0.
113
Ital
y0.
803
0.86
60.
797
0.67
90.
395
0.57
60.
271
0.63
5***
0.59
2***
Luxe
mbu
rg−
0.72
1−
0.74
80.
674
0.57
30.
746
0.60
5M
alta
0.86
00.
774
0.37
50.
348
−0.
691
0.37
2***
Net
herl
ands
0.74
10.
527*
**0.
626*
*0.
478
0.45
80.
566
0.85
60.
367*
**0.
489*
**Po
rtug
al0.
432−
0.53
5***
−0.
096*
**−
0.19
00.
050
0.26
6***
0.36
7−
0.28
1***
0.03
8***
EMU
-wid
e0.
267
0.07
0***
0.15
0***
0.15
10.
067*
**0.
149
0.30
60.
108*
**0.
127*
**N
otes
:The
Tabl
ere
port
sm
eans
ofin
divi
dual
and
EMU
-wid
esy
nchr
onic
ity
and
sim
ilari
tyin
pre-
and
post
-EM
Upe
riod
s.Pr
e-EM
Upe
riod
isfr
om19
90q1
(or
first
avai
labl
eda
te)u
ntil
the
last
quar
ter
befo
reth
eeu
road
opti
on.
Post
-EM
U(0
7)pe
riod
isfr
omth
eeu
road
opti
onda
teun
til2
007q
4;Po
st-E
MU
(201
3)—
unti
l201
3q4.
***p<
0.01
,**p<
0.05
,*p<
0.1,
p-va
lues
indi
cate
that
the
mea
ndi
ffer
ence
ofsy
nchr
onic
ity/
sim
ilari
tybe
twee
npr
e-an
dpo
st-E
MU
peri
ods
isst
atis
tica
llysi
gnifi
cant
on1%
,5%
,or
10%
leve
l,re
spec
tive
ly.
We
com
pare
mea
nsus
ing
atw
o-si
ded
mea
nco
mpa
riso
nt-
test
,whe
reth
enu
llhy
poth
esis
isth
atth
em
ean
diff
eren
ceof
vari
able
sin
pre-
and
post
-EM
Upe
riod
sis
zero
.The
alte
rnat
ive
hypo
thes
isis
that
the
mea
ndi
ffer
ence
isno
tzer
o.
16
5 Analysis: Correlates of credit cycle coherence
5.1 Data and methodology
This section explores possible drivers of credit cycle coherence. We will conduct
panel regression analysis of our measures for synchronicity and similarity. It is
important to emphasize that a strictly causal interpretation of these results is prob-
lematic. Rather than confidently pointing to ’drivers’ of credit cycle coherence, we
will be identifying correlates of credit cycle coherence. These results are a first step,
to be combined with other data and analysis beyond the scope of this paper, to iden-
tify any causal mechanisms. Given the literature and data exploration results, the
analysis focuses on two potential correlates of credit cycle coherence: (1) changing
composition of credit and (2) EMU membership.
We introduce a number of domestic factors and events as control variables. This
is a challenge, given the lack of literature to build on. Therefore, we follow studies
on business cycles synchronization and on credit booms to select covariates. We
refer to the literature discussion for their motivation. The description of variables
and their data sources are presented in Table A.1 in the Appendix.
Domestic factors include countries’ macroeconomic, financial, and institutional
characteristics. Given that synchronicity and similarity are constructed relative to
the EMU reference cycle, we also include some explanatory variables as ratios to the
EMU median. These variables are constructed as: Xit =ZitZrt
, where Zit is the value of
a variable for country i in year t and Zrt is the median of this variable for all EMU
countries in the sample. Variables measured in relative terms include: mortgage
share (the share of mortgage credit in total bank credit), net capital flows, real stock
price change, real house price change, long-term interest rate,5 trade openness, and
income growth.
5Alternatively, we include short-term interest rate measured by a three-month money marketrate. This did not change the estimation results. Short-term rates in the EMU have converged anddo not have an effect on credit cycle coherence. Meanwhile for long-term rates we can still observebetween-countries differences; therefore, it is more sensible to include them in the analysis.
17

We have no strong priors, but the literature leads us to expect that mortgage
shares in total credit will be negatively associated with credit cycle coherence. The
literature also shows (Imbs, 2004; Inklaar et al., 2008) that trade openness, financial
integration, and capital flows increase business cycle synchronization, which may
also hold for cycles in credit to non-financial business. We expect that higher capital
flows, rising stock and house prices, and higher interest rates relative to EMU me-
dian will increase a country’s credit cycle coherence with the EMU reference cycle.
We include two domestic institutional factors: capital account liberalization and
credit market deregulation. Figure 2 shows that credit cycles across the EMU be-
came more synchronized and similar in the 1990s, when most countries liberalized
their capital accounts in preparation for EMU accession. More deregulated credit
markets have higher credit growth (Lane and McQuade, 2014) which could make
credit cycles more synchronized during the credit boom phase.
Further, we include binary variables for EMU membership and the 2008–2013
financial crisis years. Frankel and Rose (1998) argue that economies become more
synchronized after joining the EMU, not before. But this need not imply greater
credit cycle synchronization, as EMU membership may drive cycles apart through
the following channels. EMU creation implied free capital mobility and no ex-
change rate risk, which intensified capital flows between member-states. These
flows were unevenly distributed across the Euro area – current account deficit,
EMU periphery economies were the main receivers of foreign capital, while sur-
plus economies experienced large outflows. Given low investment risk and high
EMU credibility, investors could allocate their funds in periphery countries offer-
ing higher returns. This caused credit booms in some countries but not in others
and may have contributed to credit cycles divergence across EMU.
Lastly, we control for global credit volatility, proxied by the VIX index.
Descriptive statistics are reported in Table A.2 in the Appendix. Correlation
analysis suggests that explanatory variables are not highly correlated with each
18

other. To check for stationarity of the variables, we apply panel unit-root tests.
We use Fisher-type tests (both ADF and PP tests) which allow for unbalanced pan-
els. Since only two variables (mortgage share and interest rate) turn out to be non-
stationary, this should not be a serious concern for the estimation. Correlation anal-
ysis and panel unit-root tests are available on request.
The analysis is conducted on annual data over 1990–2013. The baseline model
specification is the following:
Yit = α + βXit + κ INit + γDit + ψGLt + µi + εit, i = 1, ..., N; t = 1, ..., T, (5)
where Yit is credit cycle synchronicity/similarity of country i in year t; Xit is a matrix
of domestic factors constructed in relative terms; INit are institutional factors; Dit
are dummy variables for EMU membership and financial crisis; and GLt is a global
volatility factor; µi are unobserved country-specific fixed effects; εit is a white noise
error term with mean 0.
Annual synchronicity and similarity are calculated as averages over four quar-
ters of a year. We estimate panel regressions with country fixed effects and use
robust standard errors clustered on a country level.6
5.2 Estimation results
With total credit plus two credit aggregates and two measures for credit cycle co-
herence, we need to restrict and focus the analysis. This focus is guided by the
research questions: was EMU membership associated with decreasing or increas-
ing credit cycle coherence, and were changes in total-credit cycle associated with
6Since synchronicity takes quarterly values -1 or +1, annual synchronicity can take five values(-1, -0.5, 0, +0.5, +1), in increasing order of synchronicity. This suggests that ordered probit mightbe a better fit. The distribution of similarity is continuous with an upper bound of +1. As a robust-ness check, we estimate ordered probit for synchronicity and tobit for similarity measures. In bothmodels we include country dummies to control for fixed effects. Applying these models yields qual-itatively similar results (available on request). However, including country dummies may result ininconsistent estimates for ordered probit/tobit when the number of observations within each groupis small. Therefore, we focus on fixed-effects regressions for continuous dependent variable.
19

changes in credit composition? We also recognize that similarity of synchronous
cycles will have different correlates than similarity of dis-synchronous cycles. In
order to organize presentation of results, in this section we present three tables: for
synchronicity and similarity of total and differentiated credit cycles, and for similar-
ity conditional on positive synchronicity. To isolate the effect of the financial crisis
years, we conduct estimations separately for 1990–2013 and 1990–2007.
Table 3: Synchronicity of total credit and differentiated credit cycles
1990–2013 1990–2007total non-fin.bus. mortgage total non-fin.bus. mortgage
Mortgage share −2.284 *** −2.727 ***(0.715) (0.900)
Net capital flows −0.002 0.001 0.001 −0.004 0.001 0.001(0.004) (0.002) (0.002) (0.003) (0.002) (0.002)
Real stock price change 0.0005 0.003 −0.017 0.032 0.009 0.026(0.020) (0.036) (0.026) (0.029) (0.040) (0.040)
Real house price change −0.0001 −0.0001 −0.0002 0.033 −0.007 0.038(0.0003) (0.0003) (0.0003) (0.023) (0.040) (0.035)
Long-term interest rate 0.102 0.085 0.163 0.708 ** 0.658 0.653(0.070) (0.066) (0.118) (0.329) (0.563) (0.483)
Trade openness 0.341 −0.239 0.058 0.779 0.311 0.375(0.508) (0.434) (0.534) (0.664) (0.585) (0.609)
Income growth −0.018 0.013 −0.015 −0.028 −0.027 −0.025(0.011) (0.019) (0.015) (0.019) (0.023) (0.035)
Capital account liberalization 0.539 *** −0.095 0.200 * 0.657 *** 0.024 0.332 ***(0.139) (0.058) (0.100) (0.111) (0.110) (0.088)
Credit market deregulation 0.114 −0.099 0.118 0.258 *** −0.117 0.228 **(0.089) (0.092) (0.113) (0.079) (0.159) (0.092)
EMU membership −0.677 ** −0.238 −0.633 ** −0.835 *** −0.021 −0.726 ***(0.228) (0.210) (0.253) (0.228) (0.241) (0.225)
Financial crisis 0.316 0.323 * 0.107(0.190) (0.177) (0.212)
VIX 0.003 −0.001 −0.004 −0.0004 −0.008 −0.023(0.007) (0.006) (0.010) (0.012) (0.011) (0.015)
Observations 233 238 232 151 156 150Log-likelihood −221.8 −259.9 −241.1 −132.3 −174.7 −149.8R-squared 0.25 0.08 0.09 0.40 0.08 0.20
Notes: The dependent variable is synchronicity of total credit, non-financial business credit, and household mortgage creditcycles. The Table reports coefficient estimates with robust standard errors in parentheses. ***p<0.01, **p<0.05, *p<0.1.Constant and country-fixed effects are included in the estimations (not shown).
Table 3 presents the estimation results for synchronicity. In total-credit equation,
the coefficient estimate for the relative mortgage share is strongly significant with
a negative sign in both periods. This suggests that the more total credit cycles are
dominated by household mortgages, the less synchronous they are.
Further, we find that EMU membership is negatively associated with synchro-
nization, significantly for total-credit cycles and mortgage credit cycles. In contrast,
20

cycles of credit to non-financial business did not start moving less synchronously
after EMU accession. The EMU effect is not a market liberalization effect. Control-
ling for EMU membership, more domestic credit market deregulation and larger
capital account liberalization are associated with larger credit cycle synchronicity.
Additionally, higher long-term interest rates lead to more synchronous total credit
cycles in the pre-crisis period.
Table 4: Similarity of total credit and differentiated credit cycles
1990–2013 1990–2007total non-fin.bus. mortgage total non-fin.bus. mortgage
Mortgage share −1.035 −2.038 **(0.688) (0.712)
Net capital flows 0.002 * −0.002 0.001 0.002 ** −0.003 * 0.001(0.001) (0.001) (0.001) (0.001) (0.001) (0.001)
Real stock price change 0.044 *** 0.016 −0.006 0.057 * 0.006 0.027(0.013) (0.033) (0.042) (0.032) (0.021) (0.027)
Real house price change −0.0001 0.0002 −0.0002 0.006 0.012 0.004(0.0004) (0.0004) (0.0003) (0.018) (0.014) (0.014)
Long-term interest rate 0.083 −0.011 0.112 −0.238 −0.782 ** 0.126(0.089) (0.076) (0.101) (0.498) (0.348) (0.342)
Trade openness 0.189 0.464 0.770 −0.193 0.387 0.307(0.313) (0.354) (0.532) (0.196) (0.334) (0.361)
Income growth −0.002 −0.007 −0.019 *** 0.007 −0.002 −0.002(0.004) (0.005) (0.005) (0.010) (0.009) (0.007)
Capital account liberalization 0.058 −0.102 0.336 * 0.100 −0.198 ** 0.286 *(0.116) (0.109) (0.188) (0.157) (0.097) (0.155)
Credit market deregulation −0.076 −0.053 0.009 −0.039 −0.038 0.110 **(0.081) (0.090) (0.045) (0.115) (0.119) (0.048)
EMU membership 0.115 0.356 ** −0.075 −0.017 0.274 −0.388 **(0.140) (0.161) (0.258) (0.112) (0.184) (0.170)
Financial crisis 0.075 0.199 0.009(0.125) (0.124) (0.123)
VIX 0.004 −0.002 −0.0001 0.004 −0.005 −0.005(0.004) (0.003) (0.005) (0.009) (0.006) (0.010)
Observations 233 238 232 151 156 150Log-likelihood −155.0 −161.3 −175.0 −93.1 −87.8 −95.5R-squared 0.10 0.11 0.12 0.15 0.12 0.14
Notes: The dependent variable is similarity of total credit, non-financial business credit, and household mortgage creditcycles. The Table reports coefficient estimates with robust standard errors in parentheses. ***p<0.01, **p<0.05, *p<0.1.Constant and country-fixed effects are included in the estimations (not shown).
The results for similarity of credit cycles are somewhat different (see Table 4).
Here the coefficient estimate of the mortgage share in total credit is significant only
in the pre-crisis period (although sensitivity checks indicate that it is significant for
all years when excluding any one of the countries: Spain, Greece, or Estonia —
see below). EMU membership widened differences in mortgage credit cycle ampli-
tudes before the crisis, decreasing their similarity with EMU reference cycle, while
21

it made non-financial business credit cycles more similar in the period including
crisis years. Net capital flows and real stock price changes decrease the differences
in total credit cycle amplitudes, making cycles more similar.
Finally, we analyze similarity conditional on synchronicity of total-credit cycles.
Because of few observations on negative synchronicity, we do this by including
interaction terms of a synchronicity dummy with the mortgage share and capital
account liberalization (our key variables of interest), so that we can use the whole
sample.7 The dummy takes the value 0 when synchronicity is below or equal to
zero (cycles move in opposite directions to the EMU reference cycle), and 1 when
synchronicity is above zero (cycles move in the same direction).
In Table 5, we find that a higher relative mortgage share in total credit is asso-
ciated with larger similarity of the total-credit cycle when it was moving in sync
with the EMU reference cycle, but only when including the crisis years. This is
intuitive, as strongly synchronous mortgage cycles in the crisis years is an indica-
tor for the collapse of growth in mortgage lending throughout the EMU. It is clear
that this joint collapse increased similarity of credit cycles. Before the crisis, mort-
gage shares are negatively associated with similarity, but less strongly than in Table
4. When credit cycles are moving out of sync, mortgage share is significantly and
negatively correlated with the similarity of total cycles in the pre-crisis period.
Interestingly, we observe that EMU membership is now associated with more
total-credit cycle similarity when including the crisis years. In Table 4 we found
no significant EMU coefficient for total-credit similarity. In Table 5, the coefficient
estimate for 1990–2013 is more than twice the size of the Table 4 estimate, for 1990–
2007 it is ten times larger (and positive) – although insignificant.
We also find that liberalization makes synchronous total-credit cycles less simi-
lar, significantly so for the pre-crisis period. We speculate that this negative associa-
tion of similarity with capital account liberalization in synchronous credit cycles in
7We also estimated models with interaction terms for other explanatory variables, but those werefound insignificant.
22

Table 5: Similarity of synchronous total-credit cycles
1990–2013 1990–2007
Mortgage share −0.894 −0.882 −1.609 * −1.593 *(0.631) (0.640) (0.808) (0.814)
Synchronicity dummy −0.235 −0.055 −0.131 0.316(0.304) (0.490) (0.322) (0.293)
Mortgage share×Synchronicity dummy 0.631 * 0.677 * 0.479 0.534(0.328) (0.324) (0.384) (0.359)
Net capital flows 0.002 0.002 0.003 * 0.003 **(0.002) (0.001) (0.001) (0.001)
Real stock price change 0.042 *** 0.041 *** 0.052 * 0.048(0.010) (0.010) (0.030) (0.032)
Real house price change −0.0001 −0.0001 0.004 0.006(0.0004) (0.0004) (0.020) (0.020)
Long-term interest rate 0.057 0.061 −0.288 −0.516(0.070) (0.074) (0.472) (0.482)
Trade openness 0.083 0.091 −0.370 −0.367(0.309) (0.314) (0.233) (0.242)
Income growth 0.001 0.001 0.010 0.010(0.004) (0.003) (0.008) (0.007)
Capital account liberalization −0.061 −0.021 −0.033 0.024(0.135) (0.083) (0.188) (0.138)
CAL×Synchronicity dummy −0.100 −0.221 **(0.156) (0.105)
Credit market deregulation −0.105 −0.105 −0.074 −0.077(0.077) (0.078) (0.109) (0.109)
EMU membership 0.239 * 0.253 ** 0.104 0.137(0.115) (0.110) (0.101) (0.086)
Financial crisis 0.002 0.003(0.094) (0.095)
VIX 0.004 0.004 0.004 0.005(0.003) (0.003) (0.008) (0.008)
Observations 233 233 151 151Log-likelihood −140.6 −140.2 −86.5 −85.3Pseudo R-squared 0.20 0.21 0.22 0.23
Notes: The dependent variable is similarity of the total-credit cycle. The Table reports coefficient estimates with robuststandard errors in parentheses. ***p<0.01, **p<0.05, *p<0.1. Constant and country-fixed effects are included in theestimations (not shown).
Table 5, was probably absorbed into the EMU membership variable in Table 4. Sepa-
rating them out in Table 5 produces a positive association of EMU membership with
total-credit cycle similarity. This suggests that capital account liberalization could
be one of the channels through which EMU membership may have contributed to
divergence of credit cycles across EMU states.
23
5.3 Sensitivity checks
We conducted an extensive sensitivity analysis to test the robustness of all results
(available on request). First, to control for time fixed effects we included year dum-
mies. Notably, the coefficient of mortgage share became smaller (in absolute value)
in estimations for synchronicity, and significant for similarity during 1990–2013.
EMU membership turned insignificant for synchronicity, probably because time
dummies control for an effect of EMU years. The remaining results are compa-
rable to the main ones. Since adding so many time dummies leads to a substantial
loss of degrees of freedom and given that they are jointly insignificant, we choose
to report the estimation results without them.
Second, we excluded real house price changes from the estimation. Changes
in house prices could have an indirect effect on demand and supply of mortgages.
Consequently, when including house prices and mortgages together, we might not
be able to separate the impact of each of these variables. Moreover, the growth in
house price variable is volatile and may distort results due to extreme values. We
found that excluding house prices did not qualitatively influence the results.
Third, we re-defined three relative variables — real house price change, real
stock price change, and income growth — as differences to the EMU median (in-
stead of ratio), to reduce their volatility. The key results are not affected, although
some controls become significant — higher stock price changes and lower income
growth are associated with more synchronous total and business credit cycles.
Next, we re-defined synchronicity and similarity for country i while excluding
country i from the computation of the EMU reference cycle, to avoid any bias by
construction. To be consistent, we re-calculated domestic variables in relative terms;
that is, Xit =ZitZrt
, where Zrt is the median of this variable for all EMU countries in
the sample excluding country i. This decreases the size of the estimate on mortgage
share, but does not alter its significance. Moreover, EMU membership is robustly
associated with larger similarity of synchronous total credit cycles, in both periods.
24
Other results are similar to main ones.
Alternatively, we included all domestic variables in non-relative terms. Mort-
gage share became insignificant in explaining synchronicity of credit cycles, but
remained significant for similarity. Higher stock prices and interest rates and lower
income growth are associated with more synchronous cycles. The outcomes for
EMU membership and institutional factors are qualitatively similar to the main
ones. Given that we measure coherence of credit cycles as compared to the EMU
reference cycle, it is more sensible to measure domestic factors also as compared to
EMU reference; the results are more robust for relative variables.
Further, we used gross instead of net capital inflows. While this results in sig-
nificantly negative coefficients of capital flows with synchronicity and similarity of
total cycles in 1990–2007 (with no change to other outcomes), we found that these
changes are entirely driven by extreme values for Luxembourg.
Also, we control for cross-border financial exposure of countries, measured as
the sum of total claims and liabilities (in % GDP) of domestic financial institutions
abroad, from BIS consolidated banking statistics. This variable is available for 70%
of observations in our sample. More foreign exposure leads to credit concentration
in particular countries, which could make credit cycles less synchronized and less
similar. The findings show that more cross-border exposure does not affect similar-
ity, while it significantly reduces synchronicity of total and mortgage credit cycles
in the pre-crisis period. Other results are not affected.
In this small sample, it is important to check whether some countries are driv-
ing the results. We excluded each country in turn. This did not change the sign and
significance of most variables. The negative mortgage share coefficient remains ro-
bustly significant throughout. In estimations without Spain, Greece, or Estonia, the
mortgage share becomes significant also for 1990–2013 in the models for similarity
(Table 4) and for similarity conditional on synchronicity (Table 5).
Finally, we re-defined a financial crisis dummy as taking values 1 for 2008–2013
25

but also for 2000–2001, to account for the dot-com bubble crash. The results remain
qualitatively unchanged, while the crisis dummy is insignificant.
6 Conclusion
Credit cycles and their cross-country coherence matter to a range of macroeconomic
outcomes and to EMU monetary policy effectiveness. The dynamics of household
mortgage credit and loans to non-financial business have diverged significantly in
recent decades. Still, research on credit cycles is scant.
In this paper we construct and describe credit cycles for total bank credit, house-
hold mortgages and non-financial business loans for 14 EMU economies over 1990–
2013. We explore their cross-country coherence in terms of similarity in amplitudes
of credit gaps, and synchronicity of the direction of change in credit gaps. We also
analyze correlates of credit cycle coherence.
Two findings stand out. As household mortgage credit assumes a larger share
in total credit, this undermines credit cycle coherence across EMU economies. And
EMU membership is associated with convergence of business credit cycles (in line
with findings on convergence of business cycles) but divergence of household mort-
gage credit cycles — both in terms of similarity and synchronicity. Further ex-
ploration suggests that capital account liberalization could be one of the channels
through which EMU membership may have contributed to declining similarity of
credit cycles across EMU member-states. These findings survive a battery of sensi-
tivity checks.
While these findings are new and potentially policy relevant, it is important
to identify their limitations. Credit cycles can be constructed in many ways, de-
pending on choice of turning points and filters. They are considerably longer than
business cycles, so that the length of the sample may prevent observing the full cy-
cle. Their differences from a financial cycle — including both credit and property
prices (Borio, 2014) — must be borne in mind. Credit cycles are also endogenous to
26

most macroeconomic variables so that any causal analysis is challenging. And our
theoretical understanding of the significance of credit cycles is still very limited.
That said, we surveyed recent trends and literature which indicate that credit
cycles may have been neglected to our peril until recently. Early proponents such
as Borio and Lowe (2004) argued for the importance of quantitative credit aggre-
gates to understanding macroeconomic trends and policy effectiveness. A long-
standing literature has argued that credit conditions matter (Bernanke and Gertler,
1995). This has been underscored by recent research on growth and differentia-
tion of credit, and its link to long-term output growth, asset market developments,
financial instability and severity of post-crisis recessions.
In this light, the present paper contains two messages for policy makers. First,
the composition of credit matters to credit cycle coherence. We now know much
about the dangers of excessive mortgage growth. This paper adds declining credit
cycle coherence to this list of risks. Second, our results suggest that for many coun-
tries, EMU accession had unintended side effects: credit cycle de-synchronization
and divergence in amplitudes relative to an EMU-median trend. The credit channel
literature suggests that this makes for differences in impacts of the common mone-
tary policy. Both these findings should be important in assessing monetary policy
effectiveness.
Acknowledgments
This research is supported by the Institute for New Economic Thinking under grant
INO13-000. We thank Jan Jacobs, Sven Damen, and participants of the 19th Confer-
ence of the Research Network Macroeconomics and Macroeconomic Policies (FMM)
in Berlin (Germany), 7th ReCapNet Conference: Real Estate, Financial Stability, and
the Macroeconomy in ZEW Mannheim (Germany), for helpful comments and sug-
gestions.
27
References
Angeloni, I., A. Kashyap, B. Mojon, and D. Terlizzese (2002). Monetary transmission
in the Euro Area: Where do we stand? ECB Working Paper 114, European Central
Bank.
Ashcraft, A. B. (2006). New evidence on the lending channel. Journal of Money,
Credit and Banking 38(3), 751–775.
Babecky, J., T. Havranek, J. Mateju, M. Rusnak, K. Smidkova, and B. Vasicek (2013).
Leading indicators of crisis incidence: Evidence from developed countries. Jour-
nal of International Money and Finance 35(C), 1–19.
Baele, L., A. Ferrando, P. Hordahl, E. Krylova, and C. Monnet (2004). Measuring
financial integration in the Euro Area. ECB Occasional Paper Series 14, European
Central Bank.
Barba, A. and M. Pivetti (2009). Rising household debt: Its causes and macroe-
conomic implications — a long-period analysis. Cambridge Journal of Eco-
nomics 33(1), 113–137.
Beck, T., H. Degryse, and C. Kneer (2014). Is more finance better? Disentangling in-
termediation and size effects of financial systems. Journal of Financial Stability 10,
50–64.
Berkmen, S. P., G. Gelos, R. Rennhack, and J. P. Walsh (2012). The global finan-
cial crisis: Explaining cross-country differences in the output impact. Journal of
International Money and Finance 31(1), 42–59.
Bernanke, B. S. and M. Gertler (1995). Inside the black box: The credit channel of
monetary policy transmission. Journal of Economic Perspectives 9(4), 27–48.
Bezemer, D. (2014). The functional differentiation of credit. Journal of Evolutionary
Economics 24, 935–950.
28
Bezemer, D., M. Grydaki, and L. Zhang (2015). More mortgages, lower growth?
Economic Inquiry, forthcoming.
Black, L., D. Hancock, and W. Passmore (2010). The bank lending channel of mone-
tary policy and its effect on mortgage lending. Finance and Economics Discussion
Series 2010-39, Board of Governors of the Federal Reserve System.
Boissay, F., F. Collard, and F. Smets (2015). Booms and banking crises. Journal of
Political Economy, forthcoming.
Borio, C. (2014). The financial cycle and macroeconomics: What have we learnt?
Journal of Banking & Finance 45, 182–198.
Borio, C. and P. Lowe (2004). Securing sustainable price stability: should credit
come back from the wilderness? BIS Working Papers 157, Bank for International
Settlements.
Borio, C., R. McCauley, and P. McGuire (2011, September). Global credit and do-
mestic credit booms. BIS Quarterly Review, Bank for International Settlements.
Brunnermeier, M. K. and Y. Sannikov (2014). A macroeconomic model with a finan-
cial sector. American Economic Review 104(2), 379–421.
Calderon, C. and M. Kubota (2012). Gross inflows gone wild: Gross capital inflows,
credit booms and crises. Policy Research Working Paper 6270, World Bank.
Canova, F., M. Ciccarelli, and E. Ortega (2012). Do institutional changes affect
business cycles? Evidence from Europe. Journal of Economic Dynamics and Con-
trol 36(10), 1520–1533.
Cecchetti, S., M. R. King, and J. Yetman (2011). Weathering the financial crisis: good
policy or good luck? BIS Working Papers 351, Bank for International Settlements.
29
Chakraborty, I., I. Goldstein, and A. MacKinlay (2014). Do asset price booms have
negative real effects? http://papers.ssrn.com/sol3/papers.cfm?abstract_
id=2246214.
Chinn, M. D. and H. Ito (2008). A new measure of financial openness. Journal of
Comparative Policy Analysis 10, 309–322.
Christiano, L. J. and T. J. Fitzgerald (2003). The band pass filter. International Eco-
nomic Review 44(2), 435–465.
Ciccarelli, M., A. Maddaloni, and J.-L. Peydro (2013). Heterogeneous transmission
mechanism: monetary policy and financial fragility in the eurozone. Economic
Policy 28(75), 459–512.
Ciccarelli, M., A. Maddaloni, and J.-L. Peydro (2015). Trusting the bankers: A new
look at the credit channel of monetary policy. Review of Economic Dynamics, forth-
coming.
Claessens, S., G. Dell’Ariccia, I. Deniz, and L. Laeven (2010). Cross-country ex-
periences and policy implications from the global financial crisis. Economic Pol-
icy 25(4), 267–293.
Claessens, S., M. A. Kose, and M. E. Terrones (2012). How do business and financial
cycles interact? Journal of International Economics 87(1), 178–190.
Cour-Thimann, P. and B. Winkler (2012). The ECB’s non-standard monetary policy
measures: the role of institutional factors and financial structure. Oxford Review
of Economic Policy 28(4), 765–803.
Crespo-Cuaresma, J. and O. Fernandez-Amador (2013). Business cycle convergence
in EMU: A second look at the second moment. Journal of International Money and
Finance 37, 239–259.
30
Davis, E. P. and H. Zhu (2009). Commercial property prices and bank performance.
The Quarterly Review of Economics and Finance 49(4), 1341–1359.
De Haan, J., R. Inklaar, and R. Jong-A-Pin (2008). Will business cycles in the euro
area converge? A critical survey of empirical research. Journal of Economic Sur-
veys 22(2), 234–273.
De Santis, R. A. and P. Surico (2013). Bank lending and monetary transmission in
the euro area. Economic Policy 28(75), 423–457.
Disyatat, P. (2011). The bank lending channel revisited. Journal of Money, Credit and
Banking 43(4), 711–734.
Dokko, J., B. Doyle, M. Kiley, J. Kim, S. Sherlund, J. Sim, and S. van den Heuvel
(2011). Monetary policy and the global housing bubble. Economic Policy 26(66),
237–287.
Drehmann, M., C. Borio, and K. Tsatsaronis (2012). Characterising the financial
cycle: don’t lose sight of the medium term! BIS Working Papers 380, Bank for
International Settlements.
Dynan, K. (2012). Is a household debt overhang holding back consumption. Brook-
ings Papers on Economic Activity 44, 299–362.
Enders, Z., P. Jung, and G. J. Muller (2013). Has the Euro changed the business
cycle? European Economic Review 59, 189–211.
Favara, G. and J. Imbs (2015). Credit supply and the price of housing. American
Economic Review, forthcoming.
Fisher, I. (1933). The debt-deflation theory of great depressions. Econometrica 1(4),
337–357.
Frankel, J. A. and A. K. Rose (1998). The endogeneity of the Optimum Currency
Area criteria. The Economic Journal 108(449), 1009–1025.
31

Furceri, D., S. Guichard, and E. Rusticelli (2012). The effect of episodes of large
capital inflows on domestic credit. The North American Journal of Economics and
Finance 23(3), 325–344.
Gachter, M. and A. Riedl (2014). One money, one cycle? The EMU experience.
Journal of Macroeconomics 42, 141–155.
Gachter, M., A. Riedl, and D. Ritzberger-Grunwald (2012). Business cycle synchro-
nization in the Euro Area and the impact of the financial crisis. Monetary Policy &
the Economy 2012(2), 33–60.
Giannone, D., M. Lenza, and L. Reichlin (2008). Business cycles in the Euro Area.
NBER Working Paper 14529, National Bureau of Economic Research.
Goodhart, C. A. E. (1998). The two concepts of money: implications for the analysis
of optimal currency areas. European Journal of Political Economy 14, 407–432.
Hodrick, R. J. and E. C. Prescott (1997). Postwar U.S. business cycles: An empirical
investigation. Journal of Money, Credit and Banking 29(1), 1–16.
Igan, D., A. Kabundi, F. N. de Simone, and M. Pinheiro (2011). Housing, credit,
and real activity cycles: Characteristics and comovement. Journal of Housing Eco-
nomics 20(3), 210–231.
Imbs, J. (2004). Trade, finance, specialization, and synchronization. The Review of
Economics and Statistics 86(3), 723–734.
IMF (2012). World Economic Outlook, Chapter 3. Dealing with Household Debt, pp.
89–124. International Monetary Fund.
Ingram, J. C. (1969). Comment: The currency area problem. In R. A. Mundell and
A. L. Swoboda (Eds.), Monetary Problems of The International Economy, pp. 95–100.
Chicago: Chicago University Press.
32

Inklaar, R., R. Jong-A-Pin, and J. de Haan (2008). Trade and business cycle synchro-
nization in OECD countries — A re-examination. European Economic Review 52(4),
646–666.
Jappelli, T., M. Pagano, and M. di Maggio (2013). Households‘ indebtedness and
financial fragility. Journal of Financial Management, Markets and Institutions 1(1),
26–35.
Jimenez, G., S. Ongena, J. Peydro, and J. Saurina (2012). Credit supply and mon-
etary policy: Identifying the bank balance-sheet channel with loan applications.
The American Economic Review 102(5), 2301–2326.
Jorda, O., M. Schularick, and A. M. Taylor (2014). The great mortgaging: Housing
finance, crises, and business cycles. NBER Working Paper 20501, National Bureau
of Economic Research.
Kim, S., F. Moshirian, and E. Wu (2005). Dynamic stock market integration driven
by the European Monetary Union: An empirical analysis. Journal of Banking &
Finance 29(10), 2475–2502.
Kishan, R. P. and T. P. Opiela (2000). Credit cycles. Journal of Money, Credit and
Banking 32(1), 121–141.
Kiyotaki, N. and J. Moore (1997). Credit cycles. Journal of Political Economy 105(2),
211–248.
Koo, R. (2011). The world in balance sheet recession: causes, cure, and politics.
Real-World Economics Review 58, 19–37.
Lane, P. R. (2006). The real effects of European Monetary Union. Journal of Economic
Perspectives 20(4), 47–66.
Lane, P. R. and P. McQuade (2014). Domestic credit growth and international capital
flows. The Scandinavian Journal of Economics 116(1), 218–252.
33

Lane, P. R. and G. M. Milesi-Ferretti (2011). The cross-country incidence of the
global crisis. IMF Economic Review 59(1), 77–110.
McKinnon, R. (2002). Optimum currency areas and the European experience. Eco-
nomics of Transition 10(2), 343–364.
Meller, B. and N. Metiu (2014). The synchronization of credit cycles. Presented
at the Annual Congress of the European Economic Association & Econometric
Society, 27 August 2014.
Mendoza, E. G. and M. E. Terrones (2008). An anatomy of credit booms: Evidence
from macro aggregates and micro data. NBER Working Paper 14049, National
Bureau of Economic Research.
Mian, A. and A. Sufi (2009). The consequences of mortgage credit expansion:
Evidence from the U.S. mortgage default crisis. The Quarterly Journal of Eco-
nomics 124(4), 1449–1496.
Mian, A. and A. Sufi (2014). House of Debt. University of Chicago Press.
Mink, M., J. P. A. M. Jacobs, and J. de Haan (2012). Measuring coherence of output
gaps with an application to the euro area. Oxford Economic Papers 64(2), 217–236.
Minsky, H. (1978). The Financial Instability Hypothesis: A Restatement. Thames Papers
in Political Economy. London: Thames Polytechnic.
Mishkin, F. S. (2001). The transmission mechanism and the role of asset prices in
monetary policy. NBER Working Paper 8617, National Bureau of Economic Re-
search.
Mundell, R. A. (1961). A theory of optimum currency areas. The American Economic
Review 51(4), 657–665.
Mundell, R. A. (1973). Uncommon arguments for common currencies. In H. John-
son and A. K. Swoboda (Eds.), The Economics of Common Currencies: Proceedings of
34
the Madrid Conference on Optimum Currency Areas, pp. 114–132. London: Allen &
Unwin.
Praet, P. (2014). The financial cycle and real convergence in the euro area. Speech
by Peter Praet, Member of the Executive Board of the ECB, at the Annual Hyman
P. Minsky Conference on the State of the US and World Economies, Washington
D.C., 10 April 2014.
Priewe, J. (2007). Reconsidering the theories of optimum currency area — a critique.
In E. Hein, J. Priewe, and A. Truger (Eds.), European Integration in Crisis, pp. 27–52.
Marburg: Metropolis.
Rose, A. and C. Engel (2002). Currency unions and international integration. Journal
of Money, Credit, and Banking 34(4), 1067–1089.
Schularick, M. and A. M. Taylor (2012). Credit booms gone bust: monetary policy,
leverage cycles, and financial crises, 1870–2008. American Economic Review 102(2),
1029–1061.
Stein, J. C. and A. K. Kashyap (2000). What do a million observations on banks
say about the transmission of monetary policy? American Economic Review 90(3),
407–428.
Sutherland, D., P. Hoeller, R. Merola, and V. Ziemann (2012). Debt and macroeco-
nomic stability. OECD Economics Department Working Papers 1003, OECD.
Werner, R. A. (1997). Towards a new monetary paradigm: a quantity theorem of
disaggregated credit, with evidence from Japan. Kredit und Kapital 30, 276–309.
Werner, R. A. (2012). Towards a new research programme on ’banking and the
economy’ – Implications of the Quantity Theory of Credit for the prevention and
resolution of banking and debt crises. International Review of Financial Analysis 25,
1–17.
35

Appendix
Table A.1: Description of variables and their data sources
Variable Description Data sourcesSynchronicity, ηi(t) Calculated using formula (1) for total, non-
financial business, and mortgage credit cyclesCentral banks’statistics
Similarity, θi(t) Calculated using formula (2) for total, non-financial business, and mortgage credit cycles
Central banks’statistics
Mortgage share Share of household mortgage credit in totalbank credit to private sector (in %)
Central banks’statistics
Net capital flows Net financial account (gross inflows - grossoutflows) in % of nominal GDP
IMF BoP Statis-tics, Eurostat
Real stock pricechange
Annual change (in %) in the stock market in-dex (deflated by CPI)
OECD
Real house pricechange
Annual change (in %) in house price (deflatedby CPI)
BIS
Long-term interestrate
Interest rate on 10-year government bonds Datastream
Trade openness Sum of export and import of goods and ser-vices as % of nominal GDP
IFS IMF
Income growth Growth rate of GDP per capita (in 2005 USD) WDI World BankCapital account lib-eralization
Chinn-Ito index of capital account openness.The index uses information on restrictions oncross-border financial transactions reportedby the IMF Annual Report on Exchange Ar-rangements and Exchange Restrictions. Theindex takes values from -1.88 to 2.42
Chinn and Ito(2008)
Credit marketderegulation
Index consists of 3 components: owner-ship of banks (percentage of deposits heldin privately owned banks), extension ofcredit (share of private sector credit in to-tal bank credit), presence of interest rate con-trols/negative interest rates. The credit dereg-ulation index is an average of the components.The index takes values from 1 to 10.
Fraser Institute’sEconomic Free-dom Indicators
EMU membership Dummy, 1 — a country is an EMU member inyear t, 0 otherwise
Own construction
Financial crisis Dummy, 1 — from 2008 onwards, 0 otherwise Own constructionGlobal volatility VIX index (Chicago Board Options Exchange
Market Volatility Index)BIS
36
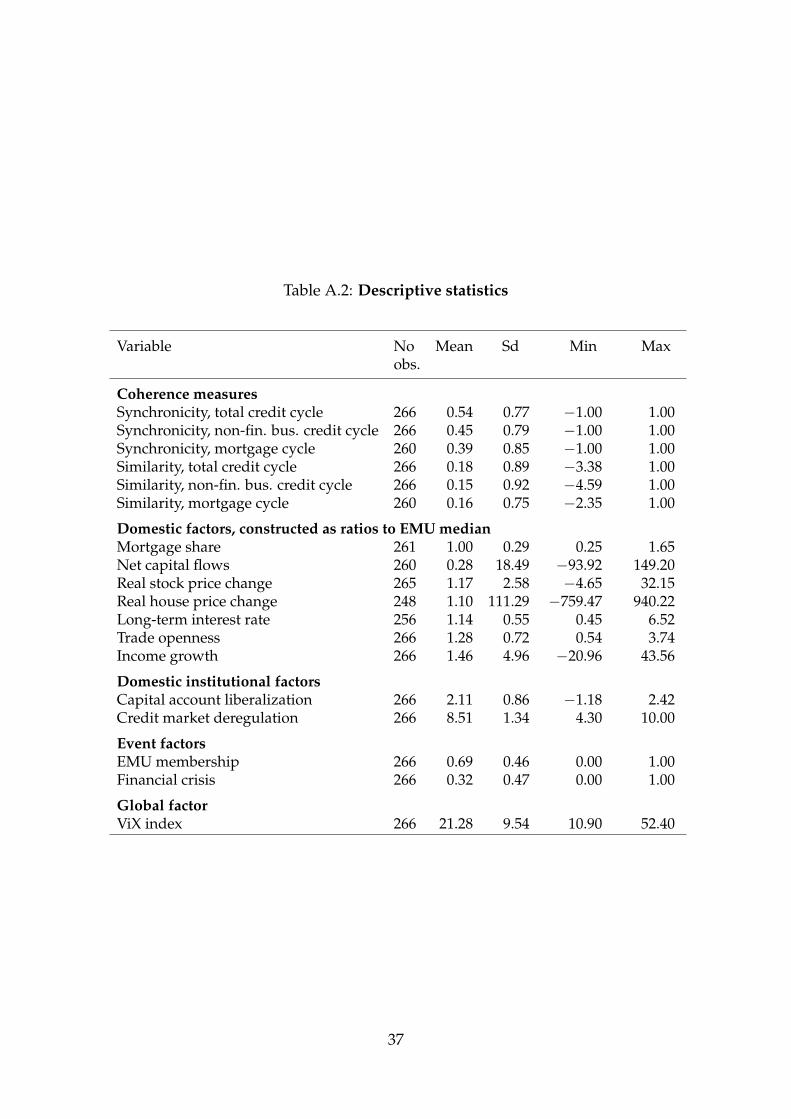
Table A.2: Descriptive statistics
Variable No Mean Sd Min Maxobs.
Coherence measuresSynchronicity, total credit cycle 266 0.54 0.77 −1.00 1.00Synchronicity, non-fin. bus. credit cycle 266 0.45 0.79 −1.00 1.00Synchronicity, mortgage cycle 260 0.39 0.85 −1.00 1.00Similarity, total credit cycle 266 0.18 0.89 −3.38 1.00Similarity, non-fin. bus. credit cycle 266 0.15 0.92 −4.59 1.00Similarity, mortgage cycle 260 0.16 0.75 −2.35 1.00
Domestic factors, constructed as ratios to EMU medianMortgage share 261 1.00 0.29 0.25 1.65Net capital flows 260 0.28 18.49 −93.92 149.20Real stock price change 265 1.17 2.58 −4.65 32.15Real house price change 248 1.10 111.29 −759.47 940.22Long-term interest rate 256 1.14 0.55 0.45 6.52Trade openness 266 1.28 0.72 0.54 3.74Income growth 266 1.46 4.96 −20.96 43.56
Domestic institutional factorsCapital account liberalization 266 2.11 0.86 −1.18 2.42Credit market deregulation 266 8.51 1.34 4.30 10.00
Event factorsEMU membership 266 0.69 0.46 0.00 1.00Financial crisis 266 0.32 0.47 0.00 1.00
Global factorViX index 266 21.28 9.54 10.90 52.40
37

Figure A.1: Credit cycle synchronicity and similarity
(a) Synchronicity, total credit cycle
−.5
0.5
1
DEU PRT AUT NLD MLT GRC FRA LUX FIN ITA BEL EST IRE ESP
(b) Similarity, total credit cycle
−2
−1
01
EST IRE LUX ESP PRT GRC DEU AUT BEL FRA FIN NLD ITA MLT
(c) Synchronicity, non-fin. business credit cycle
−.5
0.5
1
DEU FIN EST AUT ITA IRE MLT ESP FRA PRT NLD GRC BEL LUX
(d) Similarity, non-fin. business credit cycle
−2
−1
01
EST IRE ESP PRT FIN DEU MLT GRC AUT NLD LUX ITA BEL FRA
(e) Synchronicity, mortgage credit cycle
−1
−.5
0.5
1
AUT PRT DEU FIN FRA MLT NLD LUX ITA BEL GRC IRE ESP EST
(f) Similarity, mortgage credit cycle
−2
−1
01
EST MLT IRE GRC FIN PRT AUT DEU ESP BEL FRA ITA LUX NLD
38
1
List of research reports 12001-HRM&OB: Veltrop, D.B., C.L.M. Hermes, T.J.B.M. Postma and J. de Haan, A Tale of Two Factions: Exploring the Relationship between Factional Faultlines and Conflict Management in Pension Fund Boards 12002-EEF: Angelini, V. and J.O. Mierau, Social and Economic Aspects of Childhood Health: Evidence from Western-Europe 12003-Other: Valkenhoef, G.H.M. van, T. Tervonen, E.O. de Brock and H. Hillege, Clinical trials information in drug development and regulation: existing systems and standards 12004-EEF: Toolsema, L.A. and M.A. Allers, Welfare financing: Grant allocation and efficiency 12005-EEF: Boonman, T.M., J.P.A.M. Jacobs and G.H. Kuper, The Global Financial Crisis and currency crises in Latin America 12006-EEF: Kuper, G.H. and E. Sterken, Participation and Performance at the London 2012 Olympics 12007-Other: Zhao, J., G.H.M. van Valkenhoef, E.O. de Brock and H. Hillege, ADDIS: an automated way to do network meta-analysis 12008-GEM: Hoorn, A.A.J. van, Individualism and the cultural roots of management practices 12009-EEF: Dungey, M., J.P.A.M. Jacobs, J. Tian and S. van Norden, On trend-cycle decomposition and data revision 12010-EEF: Jong-A-Pin, R., J-E. Sturm and J. de Haan, Using real-time data to test for political budget cycles 12011-EEF: Samarina, A., Monetary targeting and financial system characteristics: An empirical analysis 12012-EEF: Alessie, R., V. Angelini and P. van Santen, Pension wealth and household savings in Europe: Evidence from SHARELIFE 13001-EEF: Kuper, G.H. and M. Mulder, Cross-border infrastructure constraints, regulatory measures and economic integration of the Dutch – German gas market 13002-EEF: Klein Goldewijk, G.M. and J.P.A.M. Jacobs, The relation between stature and long bone length in the Roman Empire 13003-EEF: Mulder, M. and L. Schoonbeek, Decomposing changes in competition in the Dutch electricity market through the Residual Supply Index 13004-EEF: Kuper, G.H. and M. Mulder, Cross-border constraints, institutional changes and integration of the Dutch – German gas market

2
13005-EEF: Wiese, R., Do political or economic factors drive healthcare financing privatisations? Empirical evidence from OECD countries 13006-EEF: Elhorst, J.P., P. Heijnen, A. Samarina and J.P.A.M. Jacobs, State transfers at different moments in time: A spatial probit approach 13007-EEF: Mierau, J.O., The activity and lethality of militant groups: Ideology, capacity, and environment 13008-EEF: Dijkstra, P.T., M.A. Haan and M. Mulder, The effect of industry structure and yardstick design on strategic behavior with yardstick competition: an experimental study 13009-GEM: Hoorn, A.A.J. van, Values of financial services professionals and the global financial crisis as a crisis of ethics 13010-EEF: Boonman, T.M., Sovereign defaults, business cycles and economic growth in Latin America, 1870-2012 13011-EEF: He, X., J.P.A.M Jacobs, G.H. Kuper and J.E. Ligthart, On the impact of the global financial crisis on the euro area 13012-GEM: Hoorn, A.A.J. van, Generational shifts in managerial values and the coming of a global business culture 13013-EEF: Samarina, A. and J.E. Sturm, Factors leading to inflation targeting – The impact of adoption 13014-EEF: Allers, M.A. and E. Merkus, Soft budget constraint but no moral hazard? The Dutch local government bailout puzzle 13015-GEM: Hoorn, A.A.J. van, Trust and management: Explaining cross-national differences in work autonomy 13016-EEF: Boonman, T.M., J.P.A.M. Jacobs and G.H. Kuper, Sovereign debt crises in Latin America: A market pressure approach 13017-GEM: Oosterhaven, J., M.C. Bouwmeester and M. Nozaki, The impact of production and infrastructure shocks: A non-linear input-output programming approach, tested on an hypothetical economy 13018-EEF: Cavapozzi, D., W. Han and R. Miniaci, Alternative weighting structures for multidimensional poverty assessment 14001-OPERA: Germs, R. and N.D. van Foreest, Optimal control of production-inventory systems with constant and compound poisson demand 14002-EEF: Bao, T. and J. Duffy, Adaptive vs. eductive learning: Theory and evidence 14003-OPERA: Syntetos, A.A. and R.H. Teunter, On the calculation of safety stocks 14004-EEF: Bouwmeester, M.C., J. Oosterhaven and J.M. Rueda-Cantuche, Measuring the EU value added embodied in EU foreign exports by consolidating 27 national supply and use tables for 2000-2007

3
14005-OPERA: Prak, D.R.J., R.H. Teunter and J. Riezebos, Periodic review and continuous ordering 14006-EEF: Reijnders, L.S.M., The college gender gap reversal: Insights from a life-cycle perspective 14007-EEF: Reijnders, L.S.M., Child care subsidies with endogenous education and fertility 14008-EEF: Otter, P.W., J.P.A.M. Jacobs and A.H.J. den Reijer, A criterion for the number of factors in a data-rich environment 14009-EEF: Mierau, J.O. and E. Suari Andreu, Fiscal rules and government size in the European Union 14010-EEF: Dijkstra, P.T., M.A. Haan and M. Mulder, Industry structure and collusion with uniform yardstick competition: theory and experiments 14011-EEF: Huizingh, E. and M. Mulder, Effectiveness of regulatory interventions on firm behavior: a randomized field experiment with e-commerce firms 14012-GEM: Bressand, A., Proving the old spell wrong: New African hydrocarbon producers and the ‘resource curse’ 14013-EEF: Dijkstra P.T., Price leadership and unequal market sharing: Collusion in experimental markets 14014-EEF: Angelini, V., M. Bertoni, and L. Corazzini, Unpacking the determinants of life satisfaction: A survey experiment
14015-EEF: Heijdra, B.J., J.O. Mierau, and T. Trimborn, Stimulating annuity markets 14016-GEM: Bezemer, D., M. Grydaki, and L. Zhang, Is financial development bad for growth? 14017-EEF: De Cao, E. and C. Lutz, Sensitive survey questions: measuring attitudes regarding female circumcision through a list experiment 14018-EEF: De Cao, E., The height production function from birth to maturity 14019-EEF: Allers, M.A. and J.B. Geertsema, The effects of local government amalgamation on public spending and service levels. Evidence from 15 years of municipal boundary reform 14020-EEF: Kuper, G.H. and J.H. Veurink, Central bank independence and political pressure in the Greenspan era 14021-GEM: Samarina, A. and D. Bezemer, Do Capital Flows Change Domestic Credit Allocation? 14022-EEF: Soetevent, A.R. and L. Zhou, Loss Modification Incentives for Insurers Under ExpectedUtility and Loss Aversion

4
14023-EEF: Allers, M.A. and W. Vermeulen, Fiscal Equalization, Capitalization and the Flypaper Effect. 14024-GEM: Hoorn, A.A.J. van, Trust, Workplace Organization, and Comparative Economic Development. 14025-GEM: Bezemer, D., and L. Zhang, From Boom to Bust in de Credit Cycle: The Role of Mortgage Credit. 14026-GEM: Zhang, L., and D. Bezemer, How the Credit Cycle Affects Growth: The Role of Bank Balance Sheets. 14027-EEF: Bružikas, T., and A.R. Soetevent, Detailed Data and Changes in Market Structure: The Move to Unmanned Gasoline Service Stations. 14028-EEF: Bouwmeester, M.C., and B. Scholtens, Cross-border Spillovers from European Gas Infrastructure Investments. 14029-EEF: Lestano, and G.H. Kuper, Correlation Dynamics in East Asian Financial Markets. 14030-GEM: Bezemer, D.J., and M. Grydaki, Nonfinancial Sectors Debt and the U.S. Great Moderation. 14031-EEF: Hermes, N., and R. Lensink, Financial Liberalization and Capital Flight: Evidence from the African Continent. 14032-OPERA: Blok, C. de, A. Seepma, I. Roukema, D.P. van Donk, B. Keulen, and R. Otte, Digitalisering in Strafrechtketens: Ervaringen in Denemarken, Engeland, Oostenrijk en Estland vanuit een Supply Chain Perspectief. 14033-OPERA: Olde Keizer, M.C.A., and R.H. Teunter, Opportunistic condition-based maintenance and aperiodic inspections for a two-unit series system. 14034-EEF: Kuper, G.H., G. Sierksma, and F.C.R. Spieksma, Using Tennis Rankings to Predict Performance in Upcoming Tournaments 15001-EEF: Bao, T., X. Tian, X. Yu, Dictator Game with Indivisibility of Money 15002-GEM: Chen, Q., E. Dietzenbacher, and B. Los, The Effects of Ageing and Urbanization on China’s Future Population and Labor Force 15003-EEF: Allers, M., B. van Ommeren, and B. Geertsema, Does intermunicipal cooperation create inefficiency? A comparison of interest rates paid by intermunicipal organizations, amalgamated municipalities and not recently amalgamated municipalities 15004-EEF: Dijkstra, P.T., M.A. Haan, and M. Mulder, Design of Yardstick Competition and Consumer Prices: Experimental Evidence 15005-EEF: Dijkstra, P.T., Price Leadership and Unequal Market Sharing: Collusion in Experimental Markets

5
15006-EEF: Anufriev, M., T. Bao, A. Sutin, and J. Tuinstra, Fee Structure, Return Chasing and Mutual Fund Choice: An Experiment 15007-EEF: Lamers, M., Depositor Discipline and Bank Failures in Local Markets During the Financial Crisis 15008-EEF: Oosterhaven, J., On de Doubtful Usability of the Inoperability IO Model 15009-GEM: Zhang, L. and D. Bezemer, A Global House of Debt Effect? Mortgages and Post-Crisis Recessions in Fifty Economies 15010-I&O: Hooghiemstra, R., N. Hermes, L. Oxelheim, and T. Randøy, The Impact of Board Internationalization on Earnings Management 15011-EEF: Haan, M.A., and W.H. Siekman, Winning Back the Unfaithful while Exploiting the Loyal: Retention Offers and Heterogeneous Switching Costs 15012-EEF: Haan, M.A., J.L. Moraga-González, and V. Petrikaite, Price and Match-Value Advertising with Directed Consumer Search 15013-EEF: Wiese, R., and S. Eriksen, Do Healthcare Financing Privatisations Curb Total Healthcare Expenditures? Evidence from OECD Countries 15014-EEF: Siekman, W.H., Directed Consumer Search 15015-GEM: Hoorn, A.A.J. van, Organizational Culture in the Financial Sector: Evidence from a Cross-Industry Analysis of Employee Personal Values and Career Success 15016-EEF: Te Bao, and C. Hommes, When Speculators Meet Constructors: Positive and Negative Feedback in Experimental Housing Markets 15017-EEF: Te Bao, and Xiaohua Yu, Memory and Discounting: Theory and Evidence 15018-EEF: Suari-Andreu, E., The Effect of House Price Changes on Household Saving Behaviour: A Theoretical and Empirical Study of the Dutch Case 15019-EEF: Bijlsma, M., J. Boone, and G. Zwart, Community Rating in Health Insurance: Trade-off between Coverage and Selection 15020-EEF: Mulder, M., and B. Scholtens, A Plant-level Analysis of the Spill-over Effects of the German Energiewende 15021-GEM: Samarina, A., L. Zhang, and D. Bezemer, Mortgages and Credit Cycle Divergence in Eurozone Economies

6