147 open graded drainage layer performance in illinois · open graded drainage layer performance in...
TRANSCRIPT

147
Open Graded Drainage Layer Performance in Illinois
FINAL REPORT PHYSICAL RESEARCH REPORT NO. 147 AUGUST 2004

Technical Report Documentation Page 1. Report No.
FHWA/IL/PRR 147
2. Government Accession No. 3. Recipient's Catalog No.
4. Title and Subtitle 5. Report Date
August 2004 Open Graded Drainage Layer Performance in Illinois 6. Performing Organization Code
8. Performing Organization Report No. 7. Author(s)
Thomas J. Winkelman, P.E.
Physical Research No. 147 9. Performing Organization Name and Address
Illinois Department of Transportation
10. Work Unit ( TRAIS)
Bureau of Materials and Physical Research 126 East Ash Street Springfield, Illinois 62704-4766
11. Contract or Grant No.
IHR – R07
12. Sponsoring Agency Name and Address
Illinois Department of Transportation Bureau of Materials and Physical Research 126 East Ash Street
13. Type of Report and Period Covered
Final Report January 1991 – August 2003
Springfield, Illinois 62704-4766
14. Sponsoring Agency Code
15. Supplementary Notes
16. Abstract The sustained presence of free water in the foundation layers of a pavement can be detrimental to the entire pavement structure. The presence of water can lead to a loss of substructure support, fatigue cracking, stripping, faulting, pumping, and various other surface distresses. The challenge of removing this water from the foundation layers of a pavement has confronted pavement designers and engineers since the construction of the first hard surfaced road. Many concepts and materials have been produced to address the issue of water in pavement structures. Pipe underdrains, french drains, impermeable subbase materials, geotextile fabrics, pavement sealers, and other products have been developed to try and keep water out of the pavement structure. In addition to these products, the concept of an open graded drainage layer was developed as a foundation layer that could effectively move water from beneath the pavement and into an underdrain system. Illinois experimented with the use of open graded drainage layers during the late 1980’s and early 1990’s. Four projects were constructed to monitor the effectiveness of the drainage layer and the performance of the pavement. Five additional projects were constructed based on the early performance of the monitored projects. However, continued monitoring of the initial projects, and additional projects, indicated two of the pavements were quickly deteriorating. Superficial pavement distress, severe lane to shoulder settlement, and high pavement deflections for these two projects indicated a failure of the pavement structure. Based on the performance of these projects, a moratorium on the construction of open graded drainage layers was issued for Illinois in January of 1996. This report covers the construction, performance, and rehabilitation for six of the nine projects. In addition, the project costs, traffic volumes, modes of failure, and maintenance activities will be addressed. Finally, conclusions on the performance of these pavement sections and recommendations for future projects are included. 17. Key Words
Pavement, Subbase Materials, Open Graded Drainage Layer, Underdrains
18. Distribution Statement No Restrictions. This document is available to the public through the National Technical Information Service, Springfield, Virginia 22161
19. Security Classif. (of this report) Unclassified
20. Security Classif. (of this page) Unclassified
21. No. of Pages
59
22. Price
Form DOT F 1700.7 (8-72) Reproduction of completed page authorized

Final Report
Open Graded Drainage Layer Performance in Illinois
By:
Thomas J. Winkelman, P.E. Research Engineer
Illinois Department of Transportation Bureau of Materials and Physical Research
Springfield, Illinois 62704
August 2004

ABSTRACT
The sustained presence of free water in the foundation layers of a pavement can be
detrimental to the entire pavement structure. The presence of water can lead to a loss of
substructure support, fatigue cracking, stripping, faulting, pumping, and various other
surface distresses. The challenge of removing this water from the foundation layers of a
pavement has confronted pavement designers and engineers since the construction of the
first hard surfaced road.
Many concepts and materials have been produced to address the issue of water in
pavement structures. Pipe underdrains, french drains, impermeable subbase materials,
geotextile fabrics, pavement sealers, and other products have been developed to try and
keep water out of the pavement structure. In addition to these products, the concept of an
open graded drainage layer was developed as a foundation layer that could effectively
move water from beneath the pavement and into an underdrain system.
Illinois experimented with the use of open graded drainage layers during the late 1980’s
and early 1990’s. Four projects were constructed to monitor the effectiveness of the
drainage layer and the performance of the pavement. Five additional projects were
constructed based on the early performance of the monitored projects. However,
continued monitoring of the initial projects, and additional projects, indicated two of the
pavements were quickly deteriorating. Superficial pavement distress, severe lane to
shoulder settlement, and high pavement deflections for these two projects indicated a
failure of the pavement structure. Based on the performance of these projects, a
moratorium on the construction of open graded drainage layers was issued for Illinois in
January of 1996.
This report covers the construction, performance, and rehabilitation for six of the nine
projects. In addition, the project costs, traffic volumes, modes of failure, and maintenance
activities will be addressed. Finally, conclusions on the performance of these pavement
sections and recommendations for future projects are included.
ii

TABLE OF CONTENTS
CONTENTS PAGE
Abstract………………………………………………………………………………. ii
Disclaimer / Acknowledgements…………………………………………………… v
List of Figures……………………………………………………………………….. vi
List of Tables………………………………………………………………………… vii
Introduction………………………………………………………………………….. 1
Construction…………………………………………………………………………. 4
Interstate 39 at Bloomington……………………………………………… 4
Interstate 39 at Lostant……………………………………………………. 4
Interstate 39 at El Paso…………………………………………………… 5
Illinois Route 161…………………………………………………………… 6
Interstate 80………….…………………………………………………….. 6
Macon County Highway 1…….…………………………….……………. 11
Performance………………………………………………………………………… 13
Interstate 39 at Bloomington……………………………………………… 14
Interstate 39 at Lostant……………………………………………………. 16
Interstate 39 at El Paso…………………………………………………… 20
Illinois Route 161…………………………………………………………… 25
Interstate 80………….…………………………………………………….. 27
Macon County Highway 1………………………..………………………. 30
Rehabilitation and Maintenance………………………………………………….. 32
Interstate 39 at Bloomington……………………………………………… 32
Interstate 39 at Lostant……………………………………………………. 32
Interstate 39 at El Paso…………………………………………………… 33
Illinois Route 161…………………………………………………………... 35
Interstate 80………………………………………………………………… 35
Macon County Highway 1………………………………………………… 36

Modes of Failure…………………………………………………………………… 38
Material Costs………………………………………………..…………………….. 41
Traffic Volumes…………………………………………………………………….. 43
Summary……………………………………………………………………………. 47
Conclusions…………………………………………………………………………. 50
Recommendations…………………………………………………………………. 51
References…………………………………………………………………………. 52
Appendix A: Project Location Maps…………………………………………….. 53

DISCLAIMER
The contents of this paper reflect the views of the author who is responsible for the facts
and accuracy of the data presented herein. The contents do not necessarily reflect the
official views, or policies, of the Illinois Department of Transportation, or the Federal
Highway Administration. This report does not constitute a standard, specification, or
regulation.
ACKNOWLEDGEMENTS
The author gratefully acknowledges the assistance of Ms. Christine Reed for her work
with the construction documentation and early performance documentation for these
projects. The author would also like to recognize the assistance of Matthew Mueller,
LaDonna Rowden, and Amy Schutzbach for manuscript review.
v

LIST OF FIGURES
FIGURE PAGE
Figure 1. Uniform (Open) Graded versus Well Graded Aggregate…….….. 2
Figure 2. Interstate 80 Reconstruction Project Location……………………. 7
Figure 3. Broken Pavement Prior to Removal……………………………….. 8
Figure 4. Application of Dry Hydrated Lime……….…………………………. 8
Figure 5. Geotextile Wrap of Underdrain Trench……………………………. 9
Figure 6. Shallow Median Ditch with Underdrain Headwall……………….. 9
Figure 7. CMI Autograde Machine…………….……………………………… 11
Figure 8. Macon County Highway 1 Construction Project Location………. 12
Figure 9. Minor Joint Spalling…………………………..…………………….. 14
Figure 10. Average FWD Deflections for I-39 at Bloomington.……………… 15
Figure 11. Average IRI Values for I-39 at Bloomington…….……………….. 16
Figure 12. Average FWD Deflections of CTOGDL for I-39 at Lostant ……. 18
Figure 13. Average FWD Deflections of ATOGDL for I-39 at Lostant…….. 19
Figure 14. Average IRI Values for I-39 at Lostant…………………………… 21
Figure 15. Average FWD Deflections for I-39 at El Paso…………………… 23
Figure 16. Average IRI Values for I-39 at El Paso………………………….. 24
Figure 17. Average FWD Deflections for Illinois Route 161……………….. 25
Figure 18. Average IRI Values for Illinois Route 161……………………….. 26
Figure 19. Average FWD Deflections for I-80……………………………….. 28
Figure 20. Average IRI Values for I-80……………………………………….. 29
Figure 21. Average FWD Deflections for Macon County Highway 1……… 31
Figure 22. Sealed Median Underdrain Outlet on I-39 at El Paso..……….... 33
Figure 23. Patching on I-39 at El Paso………………………………………. 34
Figure 24. Bituminous Patch on I-80…………………..…………………….. 36
vi

LIST OF TABLES
TABLE PAGE
Table 1. Coarse Aggregate 07 Gradation…………………………………… 10
Table 2. CRS Values for I-39 at Bloomington…………..………………….. 16
Table 3. Average Pavement Crack Spacing for I-39 at Lostant……..…… 17
Table 4. Average Pavement Crack Spacing for I-39 at El Paso……..….. 22
Table 5. CRS Values for I-39 at El Paso………….……………………….. 24
Table 6. CRS Values for Illinois Route 161..………………………………. 26
Table 7. Average Pavement Crack Spacing for I-80…………..…………. 27
Table 8. CRS Values for I-80………………………………………………… 29
Table 9. Material Costs for Open Graded Drainage Layers……………… 41
Table 10. Traffic Volumes for I-39 at Bloomington……………..………….. 44
Table 11. Traffic Volumes for I-39 at Lostant…………..…………………… 44
Table 12. Traffic Volumes for I-39 at El Paso……………………..………… 45
Table 13. Traffic Volumes for Illinois Route 161……………………..……… 45
Table 14. Traffic Volumes for I-80………………………..………………….. 46
Table 15. Traffic Volumes for Macon County Highway 1…………..……… 46
vii

1
INTRODUCTION
It is no great mystery to the construction industry that one of the largest contributors to the
destruction of our buildings and highways are the natural elements. The action of
moisture, freezing and thawing, sunlight and heat, and ultra-violet radiation can be
detrimental to some of the most sophisticated construction materials. Millions of dollars
are spent each year in an attempt to counteract the effects of these natural elements.
Significant importance in the highway construction industry is placed on surface and
subsurface drainage of water. If the water is not effectively removed from the foundation
layers of the pavement, significant damage will result and the life of the pavement will be
reduced. In addition, rain water must be effectively removed from the surface of the
pavement to avoid ponding and hydroplaning. These concepts were recognized as early
as 1824 by John MacAdam, “…after having secured the soil from under water (subsurface
water) the roadmaker should then secure it from rainwater.”
Many concepts and materials have been produced to address the issue of free water in
pavement structures. Pipe underdrains, french drains, impermeable subbase materials,
geotextile fabrics, and pavement sealers have all been developed to try and keep water
out of the pavement structure. In addition to these products, the concept of an open
graded drainage layer (OGDL) was developed as a pavement layer that could effectively
move water from beneath the pavement and into an underdrain system.
The OGDL consists of a uniform size aggregate that may be bound together as a lean
concrete mixture or low asphalt cement content bituminous mixture. The concept of an
open graded aggregate consists of only the coarse fraction of a gradation. Removal of
the finer fractions creates an interconnected pore structure that allows free water to flow
through the material. Figure 1 illustrates the concept of an open graded aggregate versus
a well graded aggregate.

2
Figure 1(1)
Uniform (Open) Graded versus Well Graded Aggregate
The bound OGDL mixtures, both cement treated and asphalt treated, are produced by
conventional means of producing normal concrete or bituminous mixtures. The material is
placed as one layer between 3 and 6 inches thick. Conventional paving equipment and
steel drum rollers for compaction can be used. The layer is allowed to cure for a specified
amount of time before subsequent layers of the pavement structure are constructed.
Illinois experimented with the use of OGDLs during the late 1980’s and early 1990’s. Two
experimental projects and two demonstration projects were constructed for monitoring
purposes. Three of these projects were incorporated into the construction of Interstate 39
between Bloomington and LaSalle, while the fourth was constructed on Illinois State
Route 161 east of St. Louis. The construction information and early performance data for
these four projects may be found in Physical Research Report No. 114 (2).
Following these four projects, five additional projects were constructed with an OGDL.
Two of those projects will be expanded upon within this report, while the remaining three
were all non-highway applications such as rest area ramps and parking lots. The two
projects that will be expanded upon were constructed on Interstate 80 near Morris and
Macon County Highway 1 near Decatur.
The construction activities and performance of these projects has been periodically
monitored by the Illinois Department of Transportation. Construction documentation
included construction sequencing, mixture designs, problems encountered, and early

3
performance problems. Performance monitoring has included Falling Weight
Deflectometer (FWD) measurements, International Roughness Index (IRI) values, visual
distress surveys, and Condition Rating Survey (CRS) values.

4
CONSTRUCTION
The Illinois Department of Transportation (IDOT) constructed four projects with OGDLs
between 1989 and 1992. These projects were monitored extensively during construction
and for early performance. Monitoring included pavement distress surveys, FWD
analysis, pressure transducers, and tipping bucket water outflow data for the underdrains.
Physical Research Report Number 114 was written in 1993 to document the construction
and early performance of these four projects. Complete construction details and initial
performance results are summarized in the 1993 report. A summary of each project
location and the typical cross section is listed below as a quick reference for the purposes
of this final report.
INTERSTATE 39 AT BLOOMINGTON
The first experimental section with an OGDL in Illinois was constructed as part of
Interstate 39, three miles north of Bloomington. The test and control sections are both
located in the northbound lanes. The control section is 1,000 feet long, while the test
section is 1,220 feet long. This project was constructed in the fall of 1989. A complete
project location map may be found in Appendix A.
The typical cross section for this project consists of a 16-inch lime modified subgrade
beneath a 4-inch lean concrete base and a 10.75-inch hinge jointed plain concrete
pavement. The cross section of the OGDL section included the same 16-inch lime
modified subgrade beneath a 6-inch cement treated OGDL (CTOGDL) and the 10.75-inch
hinge jointed plain concrete pavement. The OGDL extends 18 inches out under the tied
plain concrete shoulders. Geocomposite underdrains were placed at the shoulder to
mainline joint with outlet drains every 500 feet.
INTERSTATE 39 AT LOSTANT
The second experimental section with an OGDL was also constructed as part of Interstate
39, near the town of Lostant. The test and control sections are located in both the

5
northbound and southbound lanes. The monitored sections are all 500 feet in length. The
total experimental project length is approximately 4,000 feet in each lane. This project
was constructed in the fall of 1990. A complete project location map may be found in
Appendix A.
The typical cross section for the control section consists of a 16-inch lime modified
subgrade beneath a 4-inch lean concrete base and a 10-inch continuously reinforced
concrete (CRC) pavement. Plastic pipe underdrains were placed at the shoulder to
mainline joint with outlet drains every 500 feet.
This project experimented with the thickness and type of OGDL used under the pavement.
The northbound lanes used an asphalt treated OGDL (ATOGDL), while the southbound
lanes used a CTOGDL. Test sections with 4-inch and 5-inch OGDLs were used in both
directions and placed directly on the 16-inch lime modified subgrade. An additional
section in each direction included a 4-inch OGDL placed directly on 3 inches of dense
graded aggregate material, atop the 16 inches of lime modified subgrade. A 10-inch CRC
pavement was used in both directions. Plastic pipe underdrains were placed 1 foot in
from the outside shoulder edge with drains every 500 feet.
INTERSTATE 39 AT EL PASO
The first demonstration project was constructed in 1992 on Interstate 39 near El Paso.
This is the first OGDL project with considerable length, as the project extends for 9.5 miles
in the northbound and southbound lanes. Due to the length of this project, eighteen 500-
foot test sections were randomly selected for the visual distress surveys. There is no
control section associated with this project.
The limits of this project are roughly from the town of Kappa on the south to the town of
Panola on the north. The project was divided into two different test sections, with the
dividing line falling just south of the intersection between Interstate 39 and U.S.
Highway 24. A complete project location map may be found in Appendix A.
The typical cross section for the southern section consists of a 16-inch lime modified
subgrade beneath a 3-inch layer of aggregate material, a 4-inch CTOGDL, and a 10-inch
6
CRC pavement. This cross section was used in both the northbound and southbound
lanes. The typical cross section for the northern section consists of a 16-inch lime
modified subgrade beneath a 4-inch CTOGDL and the 10-inch CRC pavement. This
cross section was also used in both the northbound and southbound lanes. Plastic pipe
underdrains were placed 1 foot in from the outside shoulder edge with drain outlets every
500 feet.
ILLINOIS ROUTE 161
The second demonstration project was constructed in 1992 near Fairview Heights on
Illinois State Route 161. The project is located in the westbound lanes only. A complete
project location map may be found in Appendix A. This project is three miles in length;
however, it is divided into two different cross sections. Six randomly selected monitoring
sections of 500-feet in length were selected for the visual distress surveys. There is no
control section with this project.
The typical cross section for this project consists of a 12-inch lime modified subgrade
beneath a 4-inch ATOGDL and a 14-inch full-depth HMA pavement. The second test
section consists of the 12-inch lime modified subgrade beneath a 3-inch aggregate layer,
the 4-inch ATOGDL, and the 14-inch full-depth HMA pavement. Plastic pipe underdrains
were placed 1.0 foot in from the outside edge of the shoulder with drain outlets every 250
feet.
INTERSTATE 80
Interstate 80 is a major east-west route across the northern half of the United States. In
Illinois, this interstate stretches from Chicago on the east to Moline on the west. The
majority of this interstate, in Illinois, was originally constructed in the early 1960’s as a
10-inch jointed concrete pavement. By the early 1990’s, several sections of the interstate
were in need of rehabilitation or reconstruction.
One such section was located between mileposts 105 and 111 just west of Morris as
shown in Figure 2. This section of Interstate 80 was originally constructed in 1960 as a
10-inch jointed concrete pavement on a 6-inch aggregate base. Prior to the 1993

7
reconstruction, a minor maintenance contract for concrete pavement restoration was
completed in 1983. In addition, two patching contracts were awarded in 1985 and 1988.
Figure 2
Interstate 80 Reconstruction Project Location
The decision was made to completely reconstruct this section of Interstate 80 in 1993. In
addition, this project would utilize a CTOGDL for subsurface drainage. The typical cross
section for this project consists of a 12-inch lime modified subgrade beneath the 4-inch
CTOGDL and an 11.5-inch CRC pavement.
Pavement break-up and removal started in May of 1993. All traffic was routed to the
westbound lanes as the eastbound lanes were reconstructed, and vice versa for the
reconstruction of the westbound lanes. Figure 3 illustrates the broken pavement prior to
removal. The entire existing pavement structure was removed down to the subgrade
soils. The existing pavement was crushed and stockpiled for use as the coarse aggregate
in the OGDL.

8
Figure 3
Broken Pavement Prior to Removal
Reconstruction began with the lime modification of the subgrade soils to a depth of
12 inches. The eastbound lanes were modified with lime slurry, while the westbound
lanes were modified with dry hydrated lime. The application of dry hydrated lime and the
condition of the subgrade soils may be seen in Figure 4. Several wet spots were
encountered during the lime modification process. Approximately one mile of the
eastbound lanes and nearly 1.5 miles of the westbound lanes were lime modified at least
twice. The wet spots occurred along the entire length of the project. The only
concentrated area of multiple applications of the lime was at the west end of the
westbound lanes. This area is approximately one mile in length.
Figure 4
Application of Dry Hydrated Lime

9
Following the lime modification process, the plastic pipe underdrains were trenched into
place. The pipe underdrains were placed two feet from the outside edge of the shoulder
under both the median and outside shoulders. The underdrain trench was wrapped in a
geotextile fabric as shown in Figure 5.
Figure 5
Geotextile Wrap of Underdrain Trench
The median through this section of Interstate 80 is very shallow and very flat. To help
compensate for this, the underdrain system was raised from the standard 30-inch depth to
22 inches below the pavement surface. However, several of the median underdrain outlet
pipes and headwalls were still placed at the bottom of the median ditch with a zero
percent slope on the outlet pipe. Figure 6 illustrates the shallow median ditch and
placement of the headwall at the bottom of the ditch.
Figure 6
Shallow Median Ditch with Underdrain Headwall

10
The CTOGDL was placed directly on the lime modified subgrade. The decision was made
not to use a separation layer of aggregate or geotextile fabric between the OGDL and the
subgrade. This decision was based on initial material cost and no documentation of the
long term benefits of the separation layer. As mentioned previously, the existing
pavement was crushed and recycled as the coarse aggregate in the OGDL. The
gradation of the recycled concrete used in the OGDL was an Illinois CA 07. This
gradation is outlined in Table 1 below.
Table 1
Coarse Aggregate 07 Gradation
Sieve Size 1 ½” 1” ½” No. 4
Percent Passing 100 95 ± 5 45 ± 15 5 ± 5
The contract mixture specifications outlined a cement content of not less than 200 pounds
per cubic yard, and not more than 280 pounds per cubic yard, while maintaining a water-
cement ratio of 0.50. The majority of the OGDL placed on this project had 240 pounds of
cement per cubic yard and a water-cement ratio of 0.60. The increased water-cement
ratio was necessary to account for the high absorption rate (5.0%) of the recycled
concrete pavement.
The OGDL was placed 4 inches thick with a CMI Autograde machine. This machine was
equipped with an auger and screed extension to cover the median shoulder along with the
two traveling lanes in one pass. In addition, vibrating pans on the rear of the machine
were used to seat the material. Placement of the material with this machine worked well.
Placement of the outside shoulder was done as a separate operation. Figure 7 illustrates
the autograde machine and the process used to place the material.

11
Figure 7
CMI Autograde Machine
The 11.5-inch CRC pavement was placed directly on the OGDL. Two spreading
machines and one paving machine were used to pave the two lanes full-width. This
process did not work very well, as the first spreading machine did not leave a uniform
thickness for the second spreading machine. Also, the second spreading machine and
paving machine could not keep the same pace as the first spreading machine. Paving of
the CRC pavement was completed by late summer.
MACON COUNTY HIGHWAY 1
County Highway 1 in Macon County connects Illinois State Route 48 with Faries Parkway
on the east side of Decatur as shown in Figure 8. This county highway serves as a major
tractor-trailer truck entrance for the Archer Daniels Midland (ADM) facility located in
Decatur on County Highway 1. The Macon County Highway Engineer stated that, “If ADM
is the Supermarket to the World, then County Highway 1 is the front door. (3)”

12
Figure 8
Macon County Highway 1 Construction Project Location
This 3-mile project was constructed as three sections between the years of 1994 and
1997. The pavement cross section for each section, however, is the same. The cross
section includes a 12-inch lime modified subgrade beneath a 4-inch ATOGDL. The 12-
inch jointed reinforced concrete pavement was constructed with a doweled joint spacing of
40-feet, and 6-inch by 12-inch welded wire fabric pavement reinforcement.
The majority of this project is five lanes with curb and gutter to control drainage. A short
section at the north end of the project is four lanes. Due to the curb and gutter cross
section, no underdrains were placed on this project.
Construction details for this project are limited. The project was constructed in three
stages, and over the course of three years as three separate contracts. Due to the length
of the construction process, and that this is a county highway, construction records and
documentation for this project were not kept for this research effort.

13
PERFORMANCE
The performance of these OGDL projects has been periodically monitored since the
construction of each one. The monitoring process included visual distress surveys, FWD
measurements, IRI values, and CRS values.
The visual distress surveys were performed on the entire project for smaller projects, and
on randomly selected short sections for larger projects. The objective of these surveys is
to document the distress that is present, assign it a severity level, and monitor the
deterioration throughout the life of the project. The type of distress and severity of the
distress are based on the “Distress Identification Manual for the Long-Term Pavement
Performance Project.” (4) Details of the results from the 2003 visual distress surveys are
included within this report.
FWD measurements were taken to monitor the pavement deflection, subgrade support
rating, and the load transfer efficiency for each project. The FWD data was monitored to
determine if the OGDL has provided adequate pavement support, and to determine if the
underlying subgrade has migrated up into the OGDL.
The IRI is an indication of the deviation of a given pavement surface from an ideal smooth
pavement. (5) This value is measured in inches per mile, with higher IRI values indicating
increased pavement roughness. Statewide data is collected using digital collection
vehicles and sorted from smoothest to roughest pavements. An average of all the data is
found, and comparisons to this statewide average may be used.
The CRS is a computerized mathematical model used to rate the pavement based on the
type, severity, and extent of the visual pavement distress. Statewide data is collected
using the digital collection vehicles and rated manually before entry into the computer
model. The following scale is used to categorize the current condition of the pavement
based on the pavement distress. (5) A CRS rating of 6.5 or less for an interstate
pavement generally indicates that it will be programmed for rehabilitation. The CRS rating
for interstates and state primary routes is performed on a biennial basis in opposing years.

14
CRS Range Category
1.0 to 4.5 Poor
4.6 to 6.0 Fair
6.1 to 7.5 Satisfactory
7.6 to 9.0 Excellent
INTERSTATE 39 AT BLOOMINGTON
The project on Interstate 39 at Bloomington is a 10.75-inch hinge jointed plain concrete
pavement on a 6.0-inch CTOGDL built in 1989. This project has performed very well to
date. The 2003 visual distress survey indicated that three joints showed some minor
spalling, as shown in Figure 9, and two joints indicated an adjacent crack. Approximately
50 percent of the joints also exhibited a fault of 0.13 inch, or less. There are a total of 81
pavement joints in the test section.
Figure 9
Minor Joint Spalling
The control section for this project is also a 10.75-inch hinge jointed plain concrete
pavement. However, the control section was constructed on top of a 4.0-inch lean
concrete base material. The 2003 visual distress survey indicated no joints with spalling
or cracking present. Approximately 10 percent of the joints exhibited a fault of 0.13 inch
or less. There are a total of 66 pavement joints in the control section.

15
The underdrain outlets were all open and flowing with minor sediment accumulations
noted at some of the outlets. There has been no patching performed for either the control
or test sections.
The FWD data for this project indicates that the pavement deflections at the center of
each panel have remained constant between 2.0 and 3.0 mils for both the test and control
sections. Figure 10 illustrates the FWD test results and a two point moving average trend
line for those results. In addition, the load transfer efficiencies for the pavement joints
have remained constant between 85.0 and 90.0 percent since construction for both
sections.
Figure 10
Average FWD Deflections for I-39 at Bloomington
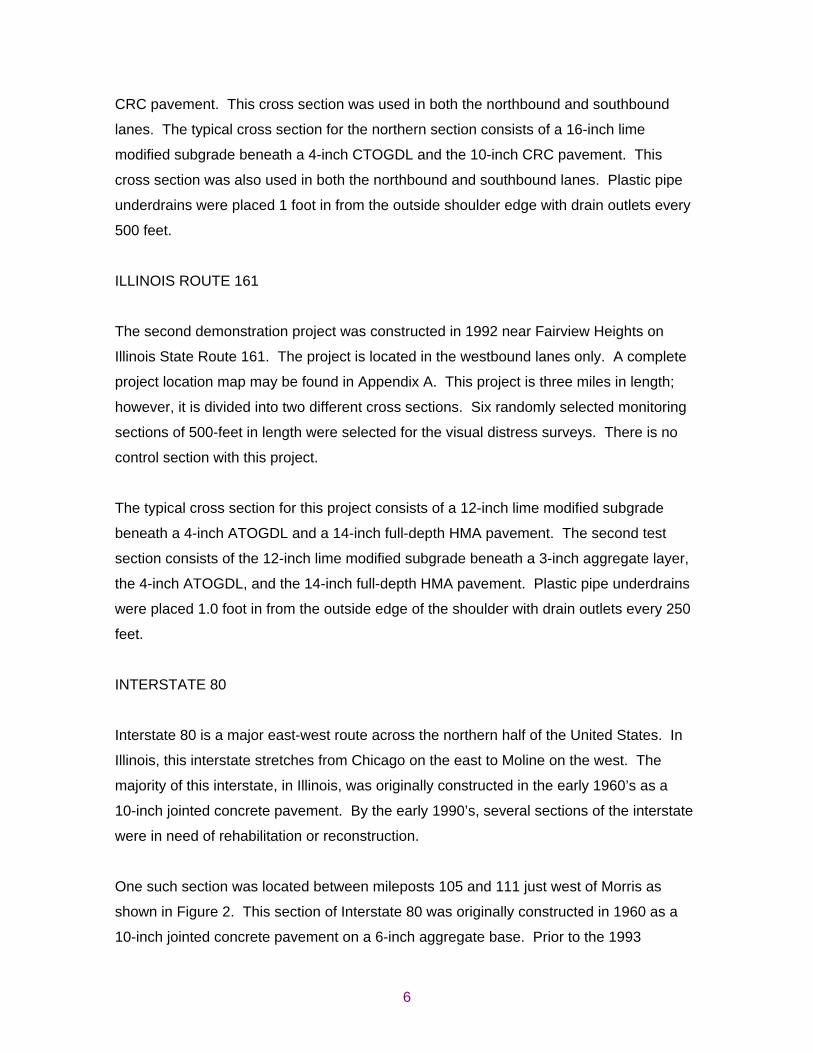
The IRI data for this project indicates a general increase in roughness for the test section
compared to a relatively consistent value of roughness for the control section. When
compared to the statewide average, both sections were less than the statewide average
after construction but since have increased to a level greater than the statewide average.
The graph below in Figure 11 indicates these trends.
10.75" Hinge Jointed PCC on 6" CTOGDL
0.0
1.0
2.0
3.0
4.0
5.0
6.0
7.0
8.0
1990 1992 1994 1996 1998 2000 2002 2004
Ye a r of Te st i ng
Def lect ion 2 per. Mov. Avg. (Def lect ion)
10.75" Hinge Jointed PCC on 4" CAM II Base
0.0
1.0
2.0
3.0
4.0
5.0
6.0
7.0
8.0
1990 1992 1994 1996 1998 2000 2002 2004
Ye a r of Te st i ng
Def lect ion 2 per. Mov. Avg. (Def lect ion)
16
0
20
40
60
80
100
120
140
1992
1993
1994
1995
1996
1997
1998
1999
2000
2001
2002
2003
Year of Testing
Ave
rage
IRI V
alue
Control Section 4" CTOGDL Statewide Average
Figure 11
Average IRI Values for I-39 at Bloomington
The CRS data indicates a general decline in the overall condition of the pavement since
construction. However, this decline is well within the limits of normal decline for a hinge-
jointed concrete pavement with a 20-year design life. The CRS value remained within the
“Excellent” category for the first 10 years. The CRS values given in Table 2 illustrate the
rate of decline.
Table 2
CRS Values for I-39 at Bloomington
Year 1994 1996 1998 2000 2002
CRS
Value 8.7 8.4 7.6 7.5 7.1
INTERSTATE 39 AT LOSTANT
The experimental pavement section at Lostant is a 10.0-inch CRC pavement constructed
over various OGDL sections. The project was completed in 1990. The northbound lanes
utilized a 4.0-inch and 5.0-inch asphalt treated open graded drainage layer (ATOGDL)
constructed directly on the lime modified soil, and a 4.0-inch ATOGDL constructed on a
3.0-inch aggregate separation layer. The southbound lanes were constructed with the
17
same thickness of OGDL for each test section, however a CTOGDL was used for these
lanes. The control section for this project consists of the same 10.0-inch CRC pavement;
however, it was constructed on a 4.0-inch lean concrete base over a lime modified soil.
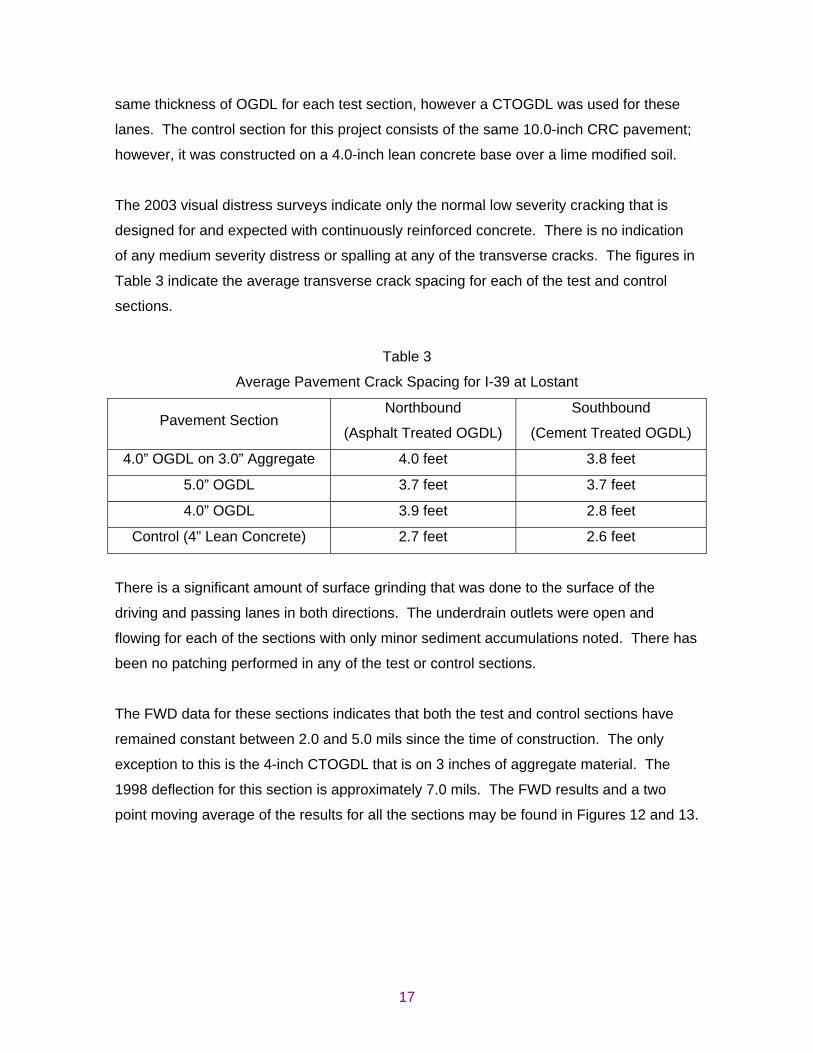
The 2003 visual distress surveys indicate only the normal low severity cracking that is
designed for and expected with continuously reinforced concrete. There is no indication
of any medium severity distress or spalling at any of the transverse cracks. The figures in
Table 3 indicate the average transverse crack spacing for each of the test and control
sections.
Table 3
Average Pavement Crack Spacing for I-39 at Lostant
Pavement Section Northbound
(Asphalt Treated OGDL)
Southbound
(Cement Treated OGDL)
4.0” OGDL on 3.0” Aggregate 4.0 feet 3.8 feet
5.0” OGDL 3.7 feet 3.7 feet
4.0” OGDL 3.9 feet 2.8 feet
Control (4” Lean Concrete) 2.7 feet 2.6 feet
There is a significant amount of surface grinding that was done to the surface of the
driving and passing lanes in both directions. The underdrain outlets were open and
flowing for each of the sections with only minor sediment accumulations noted. There has
been no patching performed in any of the test or control sections.
The FWD data for these sections indicates that both the test and control sections have
remained constant between 2.0 and 5.0 mils since the time of construction. The only
exception to this is the 4-inch CTOGDL that is on 3 inches of aggregate material. The
1998 deflection for this section is approximately 7.0 mils. The FWD results and a two
point moving average of the results for all the sections may be found in Figures 12 and 13.

18
Figure 12
Average FWD Deflections of CTOGDL for I-39 at Lostant
10" CRCP on 4" CTOGDL
0.0
1.0
2.0
3.0
4.0
5.0
6.0
7.0
8.0
1990 1992 1994 1996 1998 2000 2002 2004
Ye a r of Te st i ng
Def lect ion 2 per. Mov. Avg. (Def lect ion)
10" CRCP on 5" CTOGDL
0.0
1.0
2.0
3.0
4.0
5.0
6.0
7.0
8.0
1990 1992 1994 1996 1998 2000 2002 2004
Ye a r of Te st i ng
Def lect ion 2 per. Mov. Avg. (Def lect ion)
10" CRCP on 4" CAM II Base
0.0
1.0
2.0
3.0
4.0
5.0
6.0
7.0
8.0
1990 1992 1994 1996 1998 2000 2002 2004
Ye a r of Te st i ng
Def lect ion 2 per. Mov. Avg. (Def lect ion)
10" CRCP on 4" CTOGDL and 3" Aggregate
0.0
1.0
2.0
3.0
4.0
5.0
6.0
7.0
8.0
1990 1992 1994 1996 1998 2000 2002 2004
Ye a r of Te st i ng
Def lect ion 2 per. Mov. Avg. (Def lect ion)

19
Figure 13
Average FWD Deflections of ATOGDL for I-39 at Lostant
The FWD results for these sections indicate that there is no significant difference between
the CTOGDL, the ATOGDL, and the control section. The results also indicate that there is
no significant difference based on the thickness of the OGDL, or the addition of an
aggregate separation layer below the OGDL. The load transfer efficiency of the
transverse cracks has also remained consistently above 90 percent for all of the test
sections at Lostant. The FWD results for this project may be biased, however, due to the
short length (500 feet) of the test sections.
10" CRCP on 4" ATOGDL
0.0
1.0
2.0
3.0
4.0
5.0
6.0
7.0
8.0
1990 1992 1994 1996 1998 2000 2002 2004
Ye a r of Te st i ng
Def lect ion 2 per. Mov. Avg. (Def lect ion)
10" CRCP on 5" ATOGDL
0.0
1.0
2.0
3.0
4.0
5.0
6.0
7.0
8.0
1990 1992 1994 1996 1998 2000 2002 2004
Ye a r of Te st i ng
Def lect ion 2 per. Mov. Avg. (Def lect ion)
10" CRCP on 4" CAM II Base
0.0
1.0
2.0
3.0
4.0
5.0
6.0
7.0
8.0
1990 1992 1994 1996 1998 2000 2002 2004
Ye a r of Te st i ng
Def lect ion 2 per. Mov. Avg. (Def lect ion)
10" CRCP on 4" ATOGDL and 3" Aggregate
0.0
1.0
2.0
3.0
4.0
5.0
6.0
7.0
8.0
1990 1992 1994 1996 1998 2000 2002 2004
Ye a r of Te st i ng
Def lect ion 2 per. Mov. Avg. (Def lect ion)

20
The IRI data for these test and control sections indicates a wide variety of trends. The
best performing (smoothest) sections are the 4- and 5-inch CTOGDL sections. The worst
performing (roughest) sections are the 4-inch ATOGDL and 4-inch CTOGDL on aggregate
material. Also, it is clearly shown that the 4- and 5-inch CTOGDL sections are smoother
than the 4- and 5-inch ATOGDL sections. Finally, the ATOGDL sections tend to follow the
statewide average IRI values, while the CTOGDL sections are well below the statewide
average. The exception to this is the 4-inch CTOGDL on aggregate material section.
Figure 14 on page 21 illustrates the IRI values for the various test and control sections.
The CRS data for this project is misleading due to the short length of the test sections.
Individual CRS values were not determined for each test section. The CRS value was
determined for the entire pavement project which encompassed several miles on either
side of the experimental test locations. Therefore, the CRS values have not been
included for this project.
INTERSTATE 39 AT EL PASO
The 1992 El Paso project on Interstate 39 is divided into two separate test sections. The
northern section consists of a 10.0-inch CRC pavement over a 4.0-inch CTOGDL and lime
modified soil. The southern section also consists of the 10.0-inch CRC pavement and
4.0-inch CTOGDL; however, there is a 3.0-inch aggregate separation layer present
between the OGDL and the lime modified soil. Both test sections are approximately 4.5
miles in length, and there is no control section for this project.
Due to the extended length of this experimental project, random sections were selected
for the 2003 visual distress survey. Eight 500-foot sections were selected for the
pavement cross section with the aggregate separation layer beneath the OGDL. Ten
500-foot sections were selected for the pavement cross section with the OGDL placed
directly on the lime modified soil.
Normal low severity transverse cracking was noted throughout all 18 of the surveyed
continuously reinforced concrete pavement sections. No medium severity cracks were
noted in any of the selected test sections, and no spalling at the transverse cracks was

21
020406080100
120
140
160
1992
1993
1994
1995
1996
1997
1998
1999
2000
2001
2002
2003
Year
of T
estin
g
Average IRI Value
Con
trol S
ectio
n4"
ATO
GD
L5"
ATO
GD
L4"
ATO
GD
L on
Agg
.4"
CTO
GD
L5"
CTO
GD
L4"
CTO
GD
L on
Agg
.S
tate
wid
e Av
erag
e
Figu
re 1
4 A
vera
ge IR
I Val
ues
for I
-39
at L
osta
nt

22
found. The figures in Table 4 indicate the average transverse crack spacing for the two
different test pavement cross sections.
Table 4
Average Pavement Crack Spacing for I-39 at El Paso
Pavement Section Northbound Southbound
4” OGDL 3.9 feet 4.4 feet
4” OGDL on 3” Aggregate 5.3 feet 4.3 feet
Several areas of lane to shoulder settlement (lane lower than shoulder) were noted
throughout the project; however, it was especially apparent in the southbound lanes of the
OGDL placed directly on the lime modified soil. In 1999 the southbound lanes of this
section were undersealed to try and correct this phenomenon. The undersealing process
was designed to fill in the voids of the OGDL and prevent the settling of the pavement
cross section into the subgrade. The process of undersealing the pavement also resulted
in the filling of the median underdrain outlets. The underdrains on the outside of the
pavement lanes were not filled and continue to function.
The FWD deflections for this project are relatively high for both of the test sections. There
was no control section on this project, so no comparison can be made to standard
construction practice. Figure 15 illustrates the average FWD deflections and a two point
moving average for both the test sections. Comparison of the results indicates that the
CTOGDL on the aggregate separation layer performed better than the CTOGDL placed
directly on the modified subgrade. The reduction in deflection values that occurs after
1998 is due to the undersealing of the pavement and extensive patching efforts for both
sections. The load transfer efficiency of the cracks has remained between 90 and 95
percent for the entire project even with the high deflections.

23
10" CRCP on 4" CTOGDL and 3" Aggregate
0.0
1.0
2.0
3.0
4.0
5.0
6.0
7.0
8.0
1990 1992 1994 1996 1998 2000 2002 2004
Ye a r of Te st i ng
Def lect ion 2 per. Mov. Avg. (Def lect ion)
10" CRCP on 4" CTOGDL
0.0
1.0
2.0
3.0
4.0
5.0
6.0
7.0
8.0
9.0
10.0
1990 1992 1994 1996 1998 2000 2002 2004
Ye a r of Te st i ng
Def lect ion 2 per. Mov. Avg. (Def lect ion)
Figure 15
Average FWD Deflections for I-39 at El Paso
The average IRI values for this project indicate that both test sections were well below the
statewide average after construction. This trend continued for most of the last eight years;
however, in 2002 the average IRI for the test sections did surpass the statewide average.
Additionally, the OGDL test section that was placed on the aggregate separation layer
was less rough than the OGDL test section placed on lime modified soil in all years except
1992. Figure 16 below indicates the average IRI values for these test sections as well as
the statewide average.

24
0
20
40
60
80
100
120
140
1992
1993
1994
1995
1996
1997
1998
1999
2000
2001
2002
2003
Year of Testing
Ave
rage
IRI V
alue
4" CTOGDL on Agg. 4" CTOGDL Statewide Average
Figure 16
Average IRI Values for I-39 at El Paso
The CRS data for this project indicates a general decline in the overall condition of the
pavement since construction. The decline of the CRS value has been very gradual,
except for a large step down between 1994 and 1996. It was during this time frame that
initial patches were placed and the lane to shoulder settlement was discovered. However,
the project remained in the “Excellent” category for the first seven years of the 20-year
design life. The CRS values given in Table 5 illustrate the rate of decline.
Table 5
CRS Values for I-39 at El Paso
1994 1996 1998 2000 2002
Northbound
CRS Value 8.9 8.2 8.0 7.6 7.4
Southbound
CRS Value 8.9 8.3 8.0 7.6 7.4

25
ILLINOIS ROUTE 161
The experimental project on Illinois Route 161 is three miles in length, and is located in
the westbound lanes only. There is no control section with this 1992 project. The first
cross section for this project is a 14-inch HMA pavement on a 4-inch ATOGDL and lime
modified soil. The second cross section includes all of the above items as well as a 3-inch
aggregate separation layer between the OGDL and the lime modified soil. This second
cross section encompasses the center mile of this three mile project.
The visual distress survey performed in 2003 revealed no major distress. There has been
no patching and only minor maintenance activities performed on this project to date. The
majority of the distress that was found included low severity block cracking and low
severity longitudinal cracking at the centerline joint and the center of the driving lane. The
underdrain outlets were open and free of debris or buildup.
The FWD deflections for this project are very consistent between the two test sections.
There is no control section for this project, so no comparison can be made to standard
construction practice. Figure 17 illustrates the average deflections and a two point moving
average of the results for the two test sections.
Figure 17
Average FWD Deflections for Illinois Route 161
14" Full-Depth HMA on 4" ATOGDL and 3" Aggregate
0.0
1.0
2.0
3.0
4.0
5.0
6.0
7.0
8.0
1990 1992 1994 1996 1998 2000 2002 2004
Ye a r of Te st i ng
Def lect ion 2 per. Mov. Avg. (Def lect ion)
14" Full-Depth HMA on 4" ATOGDL
0.0
1.0
2.0
3.0
4.0
5.0
6.0
7.0
8.0
1990 1992 1994 1996 1998 2000 2002 2004
Ye a r of Te st i ng
Def lect ion 2 per. Mov. Avg. (Def lect ion)

26
The IRI data for this project was only collected during the even numbered years, as is
standard for the state primary routes. Also, the IRI data was not separated for the two
different pavement cross sections. The IRI data that is available indicates this project was
constructed smooth and has remained smooth compared to the statewide average IRI
values. This trend is displayed in the following figure, Figure 18.
0
20
40
60
80
100
120
140
1996 1997 1998 1999 2000 2001 2002
Year of Testing
Ave
age IR
I Value
4" ATOGDL Statewide Average IRI
Figure 18
Average IRI Values for Illinois Route 161
The CRS data for this project was also collected for the same even numbered years. The
CRS values have remained within the “Excellent” category since construction of the
project. The values in Table 6 indicate the CRS values since 1996 and the very slow
decline in the condition of the pavement.
Table 6
CRS Values for Illinois Route 161
Year 1996 1998 2000 2002
CRS Value 8.9 8.5 8.4 8.4

27
INTERSTATE 80
The Interstate 80 project was constructed in 1993 and incorporated the use of recycled
concrete as the coarse aggregate in the OGDL. The project is approximately 6.5 miles in
length and there is no control section with this project. A complete project location map
may be found in Appendix A. The typical cross section for this project includes an 11.5-
inch CRC pavement constructed over a 4-inch CTOGDL and lime modified soil.
Due to the extended length of this experimental project, random sections were selected
for the 2003 visual distress survey. Six 500-foot sections were selected for both the
eastbound and westbound directions.
The visual distress survey indicated normal, low severity, transverse cracking throughout
all of the surveyed sections. However, in the westbound direction approximately
10 percent of the transverse cracks were moderate severity with between 10 and 50
percent of the joint spalled. The eastbound direction displayed approximately 20 percent
moderate severity cracking. The average transverse crack spacing for the eastbound and
westbound lanes may be found in Table 7. In addition to the transverse cracking, a
pattern of regular longitudinal cracking was also noted in every section. The longitudinal
cracking was spaced at approximately 3.0 feet across both the driving and passing lanes.
Table 7
Average Pavement Crack Spacing for I-80
Pavement Section Eastbound Westbound
4” CTOGDL 2.5 feet 3.2 feet
Approximately half of the underdrains in the westbound lanes were plugged with debris,
and foreign materials. However, the eastbound underdrains were open and free of debris
build up.
The average FWD deflections for this project jumped from 3.4 to 6.4 mils within the first
year after construction. Due to the sudden increase in pavement deflection, the
eastbound and westbound lanes were undersealed to arrest the deflection problems. The
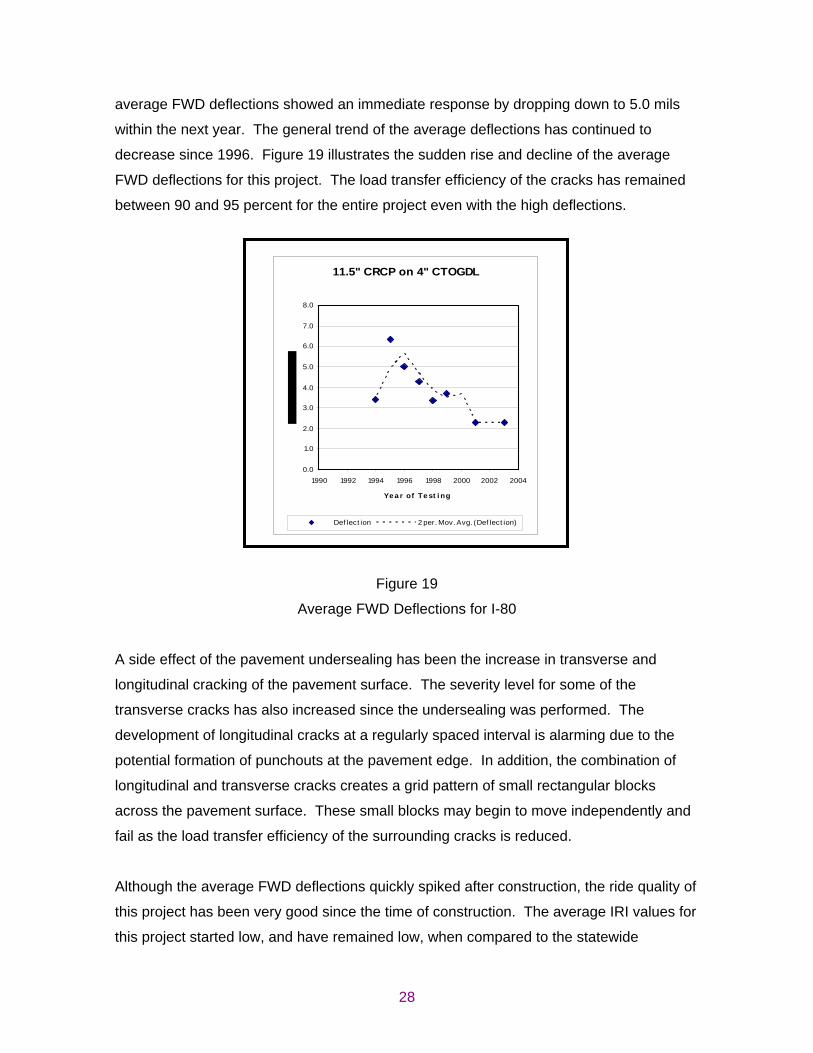
28
average FWD deflections showed an immediate response by dropping down to 5.0 mils
within the next year. The general trend of the average deflections has continued to
decrease since 1996. Figure 19 illustrates the sudden rise and decline of the average
FWD deflections for this project. The load transfer efficiency of the cracks has remained
between 90 and 95 percent for the entire project even with the high deflections.
Figure 19
Average FWD Deflections for I-80
A side effect of the pavement undersealing has been the increase in transverse and
longitudinal cracking of the pavement surface. The severity level for some of the
transverse cracks has also increased since the undersealing was performed. The
development of longitudinal cracks at a regularly spaced interval is alarming due to the
potential formation of punchouts at the pavement edge. In addition, the combination of
longitudinal and transverse cracks creates a grid pattern of small rectangular blocks
across the pavement surface. These small blocks may begin to move independently and
fail as the load transfer efficiency of the surrounding cracks is reduced.
Although the average FWD deflections quickly spiked after construction, the ride quality of
this project has been very good since the time of construction. The average IRI values for
this project started low, and have remained low, when compared to the statewide
11.5" CRCP on 4" CTOGDL
0.0
1.0
2.0
3.0
4.0
5.0
6.0
7.0
8.0
1990 1992 1994 1996 1998 2000 2002 2004
Ye a r of Te st i ng
Def lect ion 2 per. Mov. Avg. (Def lect ion)

29
average. Only recently, has the average IRI value reached the level of the statewide
average. This trend is displayed in Figure 20.
0
20
40
60
80
100
120
140
1993 1994 1995 1996 1997 1998 1999 2000 2001 2002 2003
Year of Testing
Ave
rage
IRI V
alue
4" CTOGDL Statewide Average
Figure 20
Average IRI Values for I-80
The CRS values for this project also made a sharp decline soon after construction was
complete. The CRS value dropped from a perfect 9.0 to a 7.8 for both the eastbound and
westbound lanes within the first two years after construction. However, after the large
initial decline the CRS values stabilized and have only slightly declined in the last six
years. Table 8 below displays the CRS value for both lanes since the time of
construction.
Table 8
CRS Values for I-80
Year 1994 1996 1998 2000 2002
Eastbound
CRS Value 9.0 7.8 7.7 7.3 7.0
Westbound
CRS Value 9.0 7.8 7.7 7.3 7.0

30
MACON COUNTY HIGHWAY 1
The Macon County Highway 1 project was constructed in three stages between 1994 and
1997. The project is approximately three miles in length, and there is no control section.
A complete project location map may be found in Appendix A. The typical cross section
for this project consists of a 12-inch jointed reinforced concrete pavement. The doweled
joint spacing is 40 feet, and the reinforcement includes a 6-inch by 12-inch welded wire
fabric. The pavement was constructed over a 4-inch ATOGDL and a lime modified soil.
The visual distress survey performed in 2003 indicated that 99 percent of the 40-foot slabs
had a mid-panel crack. Nine percent of those mid-panel cracks were considered medium
severity. The remaining cracks were all low severity. Five percent of the mid-panel
cracks had positive faulting of at least 0.25 inch and some low severity spalling. The
doweled joints were in good condition with no spalling or faulting present. The design of
jointed pavements with a 40-foot joint spacing has been abandoned since the time of this
project. The current IDOT standard is to construct jointed pavements with a 15-foot joint
spacing.
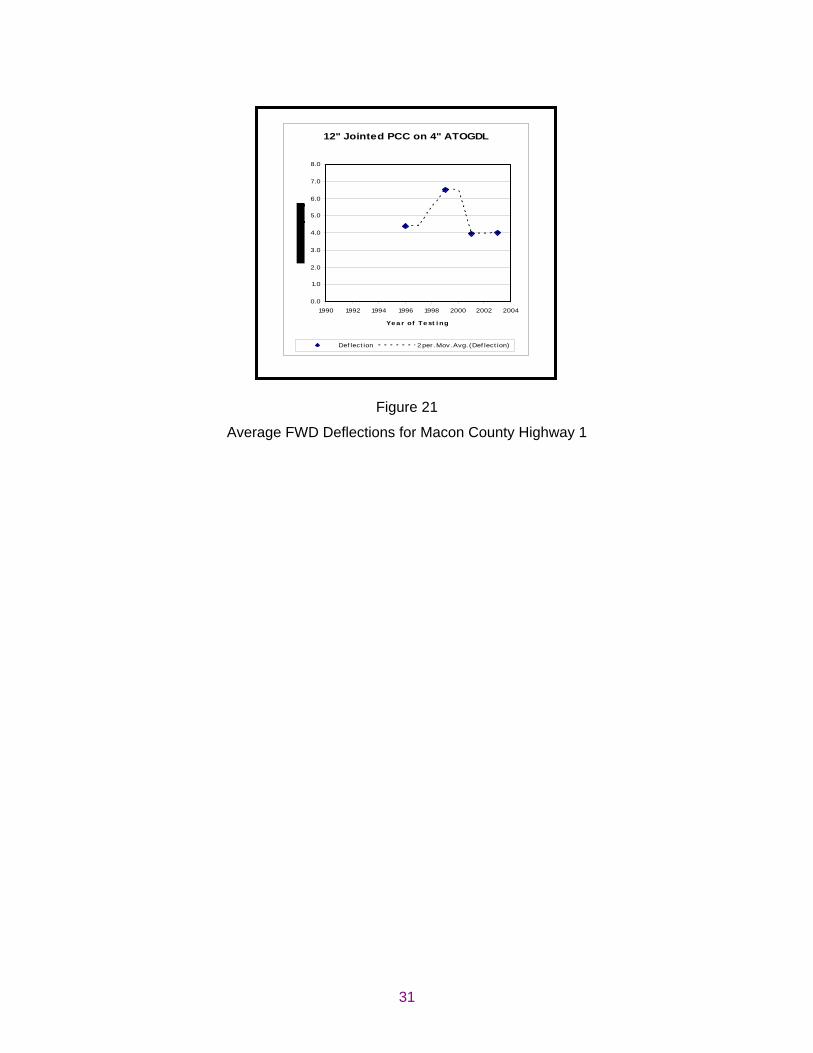
The FWD data for this project is limited. IDOT does not routinely test county highways for
investigative FWD deflections, IRI, or CRS values. Figure 21 illustrates the data that is
available and a two point moving average for the limited FWD deflection results. The data
indicates that the average deflection has fluctuated between 4.0 and 7.0 mils. The
majority of the average values fall within the 4.0 to 5.0 mils range, except for the spike
value of 6.5 mils in 1999. This outlying average test value may be attributed to poor
conditions during the actual testing, and a limited number of tests.
31
Figure 21
Average FWD Deflections for Macon County Highway 1
12" Jointed PCC on 4" ATOGDL
0.0
1.0
2.0
3.0
4.0
5.0
6.0
7.0
8.0
1990 1992 1994 1996 1998 2000 2002 2004
Ye a r of Te st i ng
Def lect ion 2 per. Mov. Avg. (Def lect ion)

32
REHABILITATION AND MAINTENANCE
INTERSTATE 39 AT BLOOMINGTON
The 14 year old OGDL experimental project on Interstate 39 at Bloomington has received
no rehabilitation or maintenance to date. The 2003 visual distress survey indicated three
spalled joints, two transverse cracks, and approximately 50 percent of the joints with some
degree of faulting. These items are not severe enough at this time to require maintenance
activities. The survey of the control section indicated no joints with spalling or cracking,
and only 10 percent of the joints with some degree of faulting. There has been no
patching in either section.
The underdrain outlets at the median and outside shoulders are open and flowing as
designed. There were some minor sediment accumulations at the underdrain outlets;
however, it was not impeding the flow of water from the underdrain. Also, there was some
vegetation growth around the underdrain outlets; however, this was trimmed with the
annual mowing of the interstate shoulders and median.
INTERSTATE 39 AT LOSTANT
The 13 year old experimental project on Interstate 39 at Lostant has received no
rehabilitation or maintenance to date. Only normal low severity transverse cracking of the
CRC pavement was noted during the 2003 visual distress survey. The same observation
was made for the control section on this project. Low severity, normal transverse cracking
was noted throughout the section.
The underdrain outlets at the median and outside shoulders are open and flowing as
designed. There were some minor sediment accumulations at the underdrain outlets;
however, it was not impeding the flow of water from the underdrain. Also, there was some
vegetation growth around the underdrain outlets. This was trimmed with the annual
mowing of the interstate shoulders and median.

33
INTERSTATE 39 AT EL PASO
The experimental project on Interstate 39 at El Paso has had numerous rehabilitation and
maintenance activities since construction in 1992. The 2003 visual distress survey
indicated normal low severity transverse cracking throughout the surveyed sections.
However, a review of the entire project length indicated extensive undersealing of the
southbound lanes as well as numerous full-depth concrete patches. In addition, several
areas of lane to shoulder settlement were noted.
In 1999 a large portion of the southbound lanes in the area of CTOGDL placed directly on
lime modified subgrade was undersealed. The undersealing process was aimed at filling
the voids of the OGDL to prevent further intrusion of the subgrade fines. At the same
time, the undersealing was used to lift the pavement and correct the lane to shoulder
settlement which had occurred in several areas. In all, nearly 2,300 square yards of
pavement were undersealed in the southbound lanes, and 150 square yards in the
northbound lanes. The pavement was raised an average of 0.80 inch, and as much as
1.75 inches in one location, to correct the settlement. One side effect to undersealing the
pavement was the filling of the underdrain system and the outlets. Several of the median
underdrain outlets of the southbound lanes were filled as shown in Figure 22. Ironically,
the outside shoulder underdrain outlets at the same locations were not filled.
Figure 22
Sealed Median Underdrain Outlet on I-39 at El Paso

34
In addition to the undersealing, numerous full-depth concrete patches have been placed
throughout the project in the driving lane. All of the patches for the entire project length
were recorded as part of the 2003 visual distress survey. These patches were placed
between the years of 1994 and 2002, with the majority of the patches placed in 2001.
Figure 23 illustrates an area of the southbound lanes that has been patched several
times.
Figure 23
Patching on I-39 at El Paso
The OGDL section placed on the 3-inch aggregate separation layer has had
approximately 468 square yards patched, or roughly 0.42 percent of the total pavement
area. The OGDL section placed directly on the lime modified subgrade has had
approximately 2,240 square yards patched, or roughly 1.43 percent of the total pavement
area. There are several areas within this OGDL section that have been patched and re-
patched several times over the last eight years.
There was no control section constructed with this experimental project. Therefore,
comparison cannot be made to a control section for this project, only comparison between
the two different types of subbase.

35
ILLINOIS ROUTE 161
The 11 year old experimental project on Illinois Route 161 has experienced only minor
maintenance activities. Maintenance activities included routing and sealing of some
longitudinal and transverse cracks. The longitudinal cracking occurred predominantly at
the centerline joint and at the center of the driving lane. The crack at the center of the
lane may be attributed to the location of the gear box on the screed of the paving machine
during construction. The transverse cracking was very infrequent and low severity in
nature where it did occur.
The underdrain outlets at the outside shoulder are open and flowing as designed. There
was no sediment accumulation at the underdrain outlets.
There was no control section constructed with this experimental project. The overlay of
the adjacent eastbound lanes exhibited similar distresses and received the same
maintenance activities as the experimental sections.
INTERSTATE 80
The experimental project on Interstate 80 has had numerous rehabilitation and
maintenance activities since construction in 1993. The 2003 visual distress survey
indicated normal low severity transverse cracking as well as 10 and 20 percent moderate
severity transverse cracking for the westbound and eastbound lanes, respectively. The
entire project length in the eastbound lanes has been undersealed, as well as several
areas of the westbound lanes. There was no evidence of broken steel, faulting, or
pavement settlement noted during the survey.
In 1995, a small portion of the pavement at the east end of the project was undersealed in
both directions to reduce the chance of pavement failures under two-way traffic during an
adjacent construction project. Based on FWD deflection improvements for these areas,
the entire eastbound direction was undersealed in 1996. At the same time, specific areas
of high deflection in the westbound direction, as determined by FWD analysis, were also
undersealed.

36
In addition to the undersealing, several full-depth concrete patches have been placed
throughout the project. All of the patches for the entire project length were recorded as
part of the 2003 visual distress survey. The westbound lanes have had approximately 35
square yards patched, or merely 0.04 percent of the total westbound pavement area. The
eastbound lanes have had approximately 309 square yards patched, or roughly 0.35
percent of the total eastbound pavement area. Figure 24 illustrates a bituminous patch
that has been placed within an area of depression in the eastbound driving lane. Lane-to-
shoulder and lane-to-lane settlement was noted at this area during the final distress
survey.
Figure 24
Bituminous Patch on I-80
There was no control section constructed with this experimental project. Comparisons to
a typical pavement cross section of the same age are not available for this project in this
geographic area.
MACON COUNTY HIGHWAY 1
The 9 year old project constructed on Macon County Highway 1 has had no maintenance
or rehabilitation work completed since construction. Mid-panel cracking of the 40-foot
slabs, as well as some minor spalling and faulting of the cracks and joints were noted
during the 2003 visual distress survey. The majority of these cracks and spalls do not
require maintenance attention at this time. Approximately 10 percent of the cracks were
considered medium severity and will require attention in the near future.
37
There are no underdrains on this project for inspection due to the curb and gutter
configuration. The gutter drop inlets were open and free of debris build up.
There was no control section constructed with this experimental project. Again, there is
not a typical pavement cross section of the same age within this geographic area that
comparisons can be made too.

38
MODES OF FAILURE
The poor performance of the projects on Interstate 39 at El Paso and Interstate 80 has
presented many questions about the modes of failure for a pavement cross section with
an OGDL. More specifically, questions have surfaced about the performance of an OGDL
under a CRC pavement. The isolation of one cause for the poor performance is not
possible. It is believed that the combination of several small contributing factors has led to
the poor performance on these two projects.
One of the largest known contributing factors to failure is the infiltration of fines into the
OGDL, or the settlement of the OGDL into the subgrade. The most common practice of
subgrade preparation in Illinois is lime modification. Dry, by-product or hydrated, lime is
added and worked into the soil with a disc at the optimum moisture content. The modified
soil is then compacted and trimmed to the proper grade. This modified soil provides a
good stable platform on which to construct the new pavement. However, questions
remain about the longevity of the lime modification to the subgrade soils.
Continuous exposure to a wet environment, either through surface water runoff or the
presence of a high ground water elevation, will alter the lime modified soil. Eventually, the
presence of water and the working action of traffic loads will move the subgrade fines
either into the OGDL or out from under the pavement structure. This is especially true in
extremely wet areas and areas with a soil composition that is not highly reactive with the
lime modification.
Core samples and Shelby tube samples were taken from failed areas of Interstate 80.
The core samples revealed that subgrade fines were indeed migrating up and into the
OGDL. The Shelby tube soil samples were tested for pH and the results indicated that the
lime was not reacting with the subgrade soils. Samples were also taken from the area of
Interstate 39 at El Paso with the aggregate separation layer. Cores in this area indicated
that the subgrade fines were also infiltrating the aggregate separation layer beneath the
OGDL.

39
In order for the subgrade fines to migrate up and into the OGDL, or aggregate separation
layer, there needs to be a carrier such as water. The objective of the OGDL is to move
water quickly and effectively to the underdrain system and away from the pavement
substructure. Tipping bucket results from earlier research (2) indicated that the OGDL
does effectively move water. However, results also indicated that the OGDL did not move
the water as fast as the control sections did. In fact, it is reasonable to believe that the
“open” structure of the OGDL actually traps more water and holds it within the pavement
substructure for longer amounts of time than a dense graded or stabilized subbase. The
trapping and extended duration of water exposure provides the means for migration of the
subgrade fines.
A second mode of failure is centered on the bond between the pavement and the open
graded drainage layer. The pavement design for the Interstate 39 and 80 projects details
a CRC pavement constructed on top of the OGDL. The assumption is that the pavement
will not fully bond to the underlying OGDL due to the cold joint that is formed from different
paving dates. However, the “open” surface structure of the open graded drainage layer
allows for the fresh pavement concrete to flow down and into some of the voids within the
OGDL. The core samples pulled from the pavement surface, and all of the patching work
that has been done on both projects, revealed that the OGDL was fully bonded to the
underside of the pavement. Therefore, the design of a CRC pavement on top of the
OGDL became a full-depth CRC pavement constructed on a lime modified soil.
The third suspected mode of failure is a side effect of the bonding between the open
graded drainage layer and the pavement. The bond of the OGDL and the pavement
simulates a full-depth pavement, which in turn changes the depth of steel placement and
the effective percentage of steel for a CRC pavement. The CRC pavement is designed to
perform independently of any supporting layer.
In Illinois, the longitudinal steel is typically placed at a depth of 3.0 inches for pavements
8.0 inches or less in thickness, and at a depth of 3.5 inches for pavements greater than
8.0 inches. The CRC pavement design thickness for Interstate 39 was 10.0 inches and
11.5 inches for Interstate 80. The combined pavement thickness with the OGDL for the
Interstate 39 project was 14.0 inches, and for the Interstate 80 project was 15.5 inches.
The general effects of steel placement include the quantity and severity of transverse

40
cracks in the pavement surface. Placing the steel low in the pavement cross section will
result in fewer cracks, however the crack opening will be increased. Placing the steel high
in the pavement cross section will result in more cracks, however the crack opening will
be reduced. The optimum crack spacing for a continuously reinforced concrete pavement
is between three and five feet. A short crack spacing will eventually lead to poor load
transfer and punchouts. The visual distress surveys of both projects indicate a crack
spacing in areas that is below three feet.
The percentage of steel in the pavement cross section of a continuously reinforced
concrete pavement also plays a role in the pavement performance. The longitudinal steel
works to control the width and spacing of transverse cracks as they appear. IDOT design
standards indicate a minimum steel percentage of 0.70 percent for CRC pavements. The
Interstate 39 and Interstate 80 projects were both designed with 0.70 percent longitudinal
steel. However, if the OGDL was fully bonded to the pavement during construction, the
Interstate 39 and Interstate 80 steel percentages effectively become 0.51 percent. The
reduction in steel percentage allows for the severity of the cracks that do develop to
increase rapidly.

41
MATERIAL COSTS
The cost effectiveness of any experimental material is a major factor in the decision to
continue using the material. The experimental material must be able to perform as
specified, while at the same time be economical to the construction industry. The material
cost must be comparable to the current alternative, or the superior performance must
outweigh any additional cost when compared to current alternatives.
The figures in Table 9 outline the costs for furnishing and placing the OGDLs on five of the
six projects. Material costs were not available for the Macon County Highway 1 project.
Table 9
Material Costs for Open Graded Drainage Layers
Project Pay Item Quantity (sq. yds.) Unit PriceCT OGDL 6" 4,500 $11.24
Stabilized Subbase 4" 142,561 $4.25ATOGDL 4" 8,975 $7.17ATOGDL 5" 4,578 $8.15CTOGDL 4" 8,975 $4.10CTOGDL 5" 4,578 $4.88
Aggregate Separation Layer 8,680 $1.54Stabilized Subbase 4" 396,950 $3.45
ATOGDL 4" 87,151 $7.05Aggregate Separation Layer 27,632 $2.50
Lime Modified Soil 12" 101,614 $1.60CTOGDL 4" 441,533 $5.16
Aggregate Separation Layer 169,184 $2.18CTOGDL 4" 299,282 $3.33
Lime Modified Soil 12" 306,572 $1.00
Interstate 39 at Bloomington
Interstate 80
Interstate 39 at Lostant
Interstate 39 at El Paso
Illinois Route 161
Several observations can be made from the values presented in Table 9. First, the unit
price for an ATOGDL is typically higher than for a CTOGDL. This relationship is
expected, as the price for a unit of asphalt cement is typically higher than for a unit of
portland cement. In addition, the procedure for production of an ATOGDL is more
complex than for a CTOGDL.

42
Second, the unit price for the materials decreased as more projects were completed and
more construction knowledge was gained. In addition, the unit price decreased as the
quantity of the material placed increased. This is especially true for the CTOGDL
projects.
Finally, the price of an OGDL is typically higher than the price of a stabilized subbase, and
much higher than the price for lime modification of subgrade soils. A stabilized subbase
or lime modified subgrade currently are the accepted construction platforms for both
portland cement concrete and HMA pavements.

43
TRAFFIC VOLUMES
The successful performance of any pavement cross section is ultimately dependent on
two variables, the environment and traffic loading. The OGDLs constructed in Illinois
cover a wide range of values for both variables, especially traffic loading. The extreme
cases are Interstate 80 on the high end of the scale, and Illinois Route 161 on the low end
of the scale.
The tables presented below represent the estimated traffic loadings for each project
based on actual traffic counts taken at various times. The highlighted rows in each table
represent the years in which an actual traffic count was performed and Equivalent Single
Axle Loading (ESAL) values were calculated. The remaining values were interpolated
based on the actual traffic data.
The 18-kip ESAL for each year, expressed in millions, has been calculated using the
following equations for rigid and flexible pavement design. The cumulative ESAL value for
each project through the end of 2002 is also presented.
Rigid Pavement Design (5)
TF = DP (0.15 * P * PV) + (143.81 * S * SU) + (696.42 * M * MU)
1,000,000
Flexible Pavement Design (5)
TF = DP (0.15 * P * PV) + (132.50 * S * SU) + (482.53 * M * MU)
1,000,000
Where:
TF = Traffic Factor (18-kip ESAL expressed in millions)
DP = Design Period (Equals 1.0 for this calculation)
P, S, M = percent of PV, SU, and MU vehicles in the design lane expressed as a
decimal

44
PV, SU, MU = structural design traffic expressed as the number of Passenger
Vehicles, Single Unit vehicles, and Multiple Unit vehicles.
Interstate 39 was constructed in multiple sections along the existing alignment of U.S.
Highway 51 from Bloomington to Rockford. Therefore, some of the early traffic figures for
the projects on Interstate 39 may have been taken from traffic counts on U.S. Highway 51.
The following tables, Tables 10, 11, and 12, represent the traffic and ESAL calculations
for the three projects constructed on Interstate 39.
Table 10
Traffic Volumes for I-39 at Bloomington
Year ADT SU MU PV Year's ESALs
Cum. ESALs
1990 10350 120 500 9730 0.16 0.16 1991 10100 125 450 9525 0.15 0.31 1992 12350 130 570 11650 0.19 0.50 1993 14400 285 1265 12850 0.42 0.91 1994 15500 440 1950 13110 0.64 1.55 1995 16600 595 2650 13355 0.87 2.42 1996 17300 750 3350 13200 1.10 3.52 1997 18000 840 3750 13410 1.23 4.75 1998 18800 925 4125 13750 1.35 6.10 1999 19600 1010 4500 14090 1.48 7.58 2000 20500 1100 4900 14500 1.61 9.19 2001 21400 1000 5400 15000 1.76 10.95 2002 22200 1050 5950 15200 1.93 12.88
Table 11
Traffic Volumes for I-39 at Lostant
Year ADT SU MU PV Year's ESALs
Cum. ESALs
1991 8200 335 2400 5465 0.77 0.77 1992 9900 370 2630 6900 0.85 1.62 1993 11600 410 2915 8275 0.94 2.56 1994 12950 450 3200 9300 1.03 3.59 1995 14300 490 3485 10325 1.12 4.72 1996 15250 530 3770 10950 1.22 5.93 1997 16200 600 4275 11325 1.38 7.31 1998 17150 670 4780 11700 1.54 8.85 1999 18100 740 5285 12075 1.70 10.56 2000 17950 810 5790 11350 1.87 12.43 2001 17800 800 5700 11300 1.84 14.26 2002 17500 780 5600 11120 1.81 16.07

45
Table 12
Traffic Volumes for I-39 at El Paso
Year ADT SU MU PV Year's ESALs
Cum. ESALs
1993 11500 365 2885 8250 0.93 0.93 1994 12725 400 3150 9175 1.01 1.94 1995 13950 435 3415 10100 1.10 3.04 1996 14775 470 3680 10625 1.18 4.23 1997 15600 510 4010 11080 1.29 5.52 1998 16000 555 4340 11105 1.40 6.91 1999 16400 595 4670 11135 1.50 8.42 2000 17025 640 5010 11375 1.61 10.03 2001 17650 700 5500 11450 1.77 11.80 2002 18250 750 6025 11475 1.94 13.73
As can be seen from the tables, the cumulative 18-kip ESALs for each of the projects is
very near the same. In addition, it should be noted that the 10-year cumulative ESAL
values are low for an interstate facility in Illinois. The good performance of the projects at
Bloomington and Lostant can be attributed, in part, to the low traffic volumes.
The project constructed on Illinois Route 161 between Fairview Heights and Belleville is
an urban section. This four-lane facility predominately carries passenger vehicles and a
few light trucks. Table 13 summarizes the traffic volumes for this project. The ESAL
values in Table 13 indicate very light traffic on this facility. The low ESAL volume has
aided in the excellent performance of this project.
Table 13
Traffic Volumes for Illinois Route 161
Year ADT SU MU PV Year's ESALs
Cum. ESALs
1994 16150 410 160 15580 0.06 0.06 1995 17900 420 170 17310 0.06 0.12 1996 18800 430 170 18200 0.06 0.19 1997 19700 610 240 18850 0.09 0.28 1998 20250 790 310 19150 0.12 0.39 1999 20800 970 380 19450 0.14 0.53 2000 19150 1140 460 17550 0.17 0.70 2001 17500 500 200 16800 0.07 0.77 2002 16600 450 180 15970 0.07 0.84
Interstate 80 is a major east-west shipping and travel route across northern Illinois. The
OGDL project on Interstate 80 has carried more ESALs in a shorter amount of time than

46
any of the other OGDL projects. This rural section of interstate has averaged more than
two million ESALs per year over the life of the project. Table 14 below illustrates the
traffic volumes for the project. These extremely high traffic volumes have contributed to
the early problems and poor performance of this project.
Table 14
Traffic Volumes for I-80
Year ADT SU MU PV Year's ESALs
Cum. ESALs
1994 19550 1400 5600 12550 1.85 1.85 1995 20300 1420 5680 13200 1.87 3.72 1996 21050 1440 5760 13850 1.90 5.62 1997 22000 1610 6440 13950 2.12 7.74 1998 22900 1780 7120 14000 2.35 10.09 1999 23800 1950 7800 14050 2.57 12.66 2000 24350 2120 8480 13750 2.80 15.46 2001 24900 1600 7900 15400 2.58 18.04 2002 25500 1750 7000 16750 2.31 20.35
The project on Macon County Highway 1 has a surprising amount of traffic, especially
tractor-trailer traffic, due to the ADM facility. This highway project was constructed over
the course of three years, however the traffic values have been given since the
completion of the first section. The high number of tractor-trailers has resulted in an
average annual ESAL value of nearly one million. Table 15 outlines the traffic volumes for
the Macon County Highway 1 project.
Table 15
Traffic Volumes for Macon County Highway 1
Year ADT SU MU PV Year's ESALs
Cum. ESALs
1995 9100 200 2300 6600 0.73 0.73 1996 9000 200 2375 6425 0.76 1.49 1997 8900 210 2450 6240 0.78 2.27 1998 8700 220 2525 5955 0.81 3.08 1999 8500 220 2600 5680 0.83 3.90 2000 8800 230 2675 5895 0.85 4.76 2001 10000 240 2760 7000 0.88 5.64 2002 11500 280 2900 8320 0.93 6.57

47
SUMMARY
The Illinois Department of Transportation experimented with the use of an OGDL as part
of the pavement cross section during the late 1980’s and early 1990’s. Two experimental
projects and two demonstration projects were constructed to monitor the construction and
early performance of the drainage layer. The two experimental projects were constructed
on Interstate 39 at Bloomington and Lostant. Both projects are short in length, and the
Lostant project compares the two types of OGDLs in different configurations. The first
demonstration project was constructed on Interstate 39 near El Paso with a CTOGDL.
The second demonstration project was constructed on Illinois Route 161 near Fairview
Heights with an ATOGDL.
Based on the initial performance of these projects, five additional projects were
constructed throughout the state. Two of these projects were monitored as part of this
research, while the remaining three were non-highway related applications. The first
monitored project was constructed on Interstate 80 near Morris with a CTOGDL. The
second project was constructed on Macon County Highway 1 near Decatur with an
ATOGDL.
Performance monitoring was continued through the fall of 2003 for these projects.
Monitoring included visual distress surveys, FWD testing, IRI values, and CRS values. A
final visual distress survey was conducted for each project in 2003. The entire project
was surveyed for the shorter projects, and random test sections were selected for the
longer projects. Normal low severity distresses were recorded for the majority of the
projects. Moderate severity distress was noted on the Interstate 80 and Macon County
Highway 1 projects. Patch quantities were recorded for the Interstate 39 at El Paso and
Interstate 80 projects.
FWD testing was conducted on a routine basis for the majority of the projects. Deflection
trends for the Interstate 39 at Bloomington and Lostant, Illinois Route 161, and Macon
County Highway 1 projects have been consistent and steady since the time of
construction. Deflection trends for the Interstate 39 at El Paso and Interstate 80 projects

48
both spiked shortly after construction. Maintenance activities and some minor
rehabilitation have corrected the deflection problems.
Annual testing for IRI was conducted on the interstate projects, and biennially for the
project on Illinois Route 161. The same general trend was common among all of the
projects. The projects were constructed very smooth when compared to the statewide
average; however, as time and traffic impacted the projects the IRI values have slowly
risen to the level of the statewide average and slightly beyond.
The CRS value was compounded every two years for all of the projects except
Interstate 39 at Lostant and Macon County Highway 1. The project on Illinois Route 161
has remained in the “Excellent” category since construction. The projects on Interstate 39
at Bloomington and El Paso have gradually declined since construction, but both still
remain in the top of the “Satisfactory” category. The project on Interstate 80 quickly
declined after construction, but with the undersealing and patching efforts, the pavement
remains in the “Satisfactory” category.
The CRC pavements for the Interstate 39 at El Paso and Interstate 80 projects both
experienced problems shortly after construction. Relatively high FWD test results and
physical evidence of pavement settlement were observed. Pavement undersealing was
used to arrest the pavement settlement and correct the pavement profile. Areas with
moderate to severe distress were patched with full-depth concrete patches. Repeat
patching operations have continued for both of these projects. Based on the poor
performance of these two projects, a moratorium on the construction of OGDLs under
state maintained highways was issued in January of 1996.
There are several contributing factors to the premature failure of these two interstate
projects. The largest contributor to the pavement failure was the intrusion of subgrade
fines into the pore structure of the OGDL. In conjunction with this process were the
pavement settlement and the increased pavement deflections. Material testing indicated
the presence of silty soils that were non-reactive to the lime modification process.
Another contributing factor was the unexpected bond between the OGDL and the CRC
pavement. The open structure of the OGDL allowed for the plastic concrete to filter in and

49
permanently bond to the OGDL. The side effects of this bond include a decreased
effective steel percentage and a variation in the design steel placement depth. The
decreased steel percentage for the pavement cross section decreases the CRC crack
spacing. The unexpected high steel placement also decreases the CRC crack spacing
resulting in low severity cracks at the surface and higher severity cracks at the bottom of
the pavement cross section.
The material costs were also evaluated as part of the research. In general, the bid price
for a unit of ATOGDL is more expensive than the same unit of CTOGDL. Also, the bid
price for OGDL materials was significantly higher than the prices for stabilized subbase
and lime modification of subgrade soils.
Finally, the traffic volumes and ESAL quantities for all of the projects was collected and
analyzed for the life of each project to date. Very low ESAL quantities were noted for the
urbanized project on Illinois Route 161. Typical traffic and ESAL volumes were recorded
for the three projects on Interstate 39. Higher than normal volumes were recorded for the
Macon County Highway 1 project, and very high ESAL volumes were noted on the
Interstate 80 project.

50
CONCLUSIONS
Nine experimental projects with an OGDL were constructed in Illinois to investigate the
use and effectiveness of the OGDL as a pavement substructure drainage material. Six of
these nine were monitored periodically since the time of their construction. The remaining
three projects were not pavement related, and therefore were not evaluated. Of the six,
three used a CTOGDL, two used an ATOGDL, and one project used both materials. Also
of those six, three of the projects were constructed on a lime modified subgrade; and the
remaining three were constructed over sections of lime modified subgrade with an
aggregate separation layer.
The following conclusions were made after monitoring the construction and performance
of these OGDL projects:
1) The use of an OGDL is more expensive than the use of a standard stabilized base
material or lime modified soil.
2) The intrusion of fines from the subgrade and the aggregate separation layer into
the OGDL resulted in settlement, faulting, and eventually premature failure.
3) An unexpected permanent bond between the CRC pavement and the OGDL,
which reduced the steel depth with regards to the total pavement cross section,
and reduced the effective steel percentage within the pavement aided in the
premature CRC pavement failures.
4) The benefits of using either type of OGDL (cement treated or asphalt treated) over
the other could not clearly be determined.
5) The limited benefits of using an OGDL do not outweigh the increased costs,
construction difficulties, and maintenance requirements on CRC pavements.
51
RECOMMENDATIONS
The following recommendations are made concerning the construction and performance
of OGDLs:
1) It is recommended to properly select projects for use of an OGDL. Consideration
should be given to subgrade soil analysis, topography and surface drainage, and
pavement type.
2) The use of an OGDL under a CRC pavement is not recommended.
3) The use of a geotextile fabric or dense graded aggregate filter under the OGDL to
prevent the intrusion of subgrade fines is recommended.
4) The use of an autograde machine for placement of a CTOGDL is recommended
due to the coarse texture of the mixture.
5) The use of a bond breaker between a CTOGDL and a concrete pavement is
recommended.

52
REFERENCES
1. Herubin, C.A., Marotta, T.W., “Basic Construction Materials,” Fifth Edition,
Prentice-Hall Inc., Copyright 1997, Page 45, Figure 2-16.
2. Reed, C.M., “Design and Construction of Open-Graded Base Courses,” Physical
Research Report No. 114, Illinois Department of Transportation, 1993.
3. Byrd, B., Macon County Highway Engineer, 2003.
4. Strategic Highway Research Program, “Distress Identification Manual for the Long-
Term Pavement Performance Project, Stategic Highway Research Program,
Publication No. SHRP-P-338, Washington, D.C., 1993.
5. Illinois Department of Transportation, Bureau of Design and Environment,
Pavement Design Manual, November 1999.

53
APPENDIX
A
PROJECT LOCATION
MAPS

54
Interstate 39 at Bloomington
Project Location
This project is located on Interstate 39 just north of Bloomington-Normal. The
experimental sections are located in the northbound lanes between mileposts 2 and 3.

55
Interstate 39 at Lostant
Project Location
This project is located on Interstate 39 just north of the intersection between Interstate 39
and Illinois Route 18, near Lostant. The experimental sections are located in the
northbound and southbound lanes between mileposts 41.9 and 42.5.

56
Interstate 39 at El Paso
Project Location
This project is located on Interstate 39 around the intersection of Interstate 39 and U.S.
Highway 24, near El Paso. The experimental sections are located in the northbound and
southbound lanes between mileposts 9.7 and 19.3.

57
Illinois Route 161
Project Location
This project is located on Illinois Route 161 between Illinois Routes 157 and 159 in
Fairview Heights. The experimental sections are located in the westbound lanes only.

58
Interstate 80
Project Location
This project is located on Interstate 80 near Morris. The experimental sections are
located in the eastbound and westbound lanes between mileposts 105.3 and 111.6.

59
Macon County Highway 1
Project Location
This project is located on Macon County Highway 1 (Brush College Road) on the east
side of Decatur. The experimental sections are located in the northbound and
southbound lanes between the intersections with Illinois Route 48 and Faries Parkway.