14 december 2009 using business tendency surveys to reduce revisions jan-egbert sturm
TRANSCRIPT

14 December 2009
Using business tendency surveys to reduce revisionsJan-Egbert Sturm

14 December 2009
2International Seminar on Early Warning and Business Cycle Indicators
Underlying papers
Jacobs, J.P.A.M. and J.-E. Sturm (2005), “Do ifo indicators help explain revisions in German industrial production?”, in: Ifo Survey Data in Business Cycle and Monetary Policy Analysis, editors J.-E. Sturm and T. Wollmershäuser, Physica Verlag, 93-114.
Jacobs, J.P.A.M. and J.-E. Sturm (2008), The information content of KOF indicators on Swiss current account data revisions, Journal of Business Cycle Measurement and Analysis, 4:2, 163-183.
Graff, M. and J.-E. Sturm (2009), “The output gap revisited: Can survey data on capacity utilisation improve output gap estimates in real time?”, mimeo.

14 December 2009
3International Seminar on Early Warning and Business Cycle Indicators
Outline
Motivation Increase the information contained in preliminary data
by predicting future revisions Real-time data sets
Industrial production in Germany (time series) Current account statistics in Switzerland (system / time series) Output gap estimates of the OECD (panel data)
Business tendency surveys Ifo indicators for Germany KOF indicators for Switzerland Capacity utilisation rates in the OECD countries
Modelling strategy and empirical results
Concluding remarks

14 December 2009
4International Seminar on Early Warning and Business Cycle Indicators
Evaluation
Real-time data
Final
Partly revised
First-released
Vintage
Final data
Economic forecastPolitical decisions
Final data Partly revised
First-released
Time

14 December 2009
5International Seminar on Early Warning and Business Cycle Indicators
Real-time data sets
German industrial production (source: Statistisches Bundesamt)“Indizes der Produktion und der Arbeitsproduktivität im Produzierenden Gewerbe”, Fachserie 4, Reihe 2.1
Monthly real growth rates (for entire Germany) Vintages: 1996:3–2003:10, Coverage: 1995:12–2003:8
Swiss current account statistics (source: Swiss National Bank, Oct. 2006) Monthly vintages with quarterly (nominal) series
– Income (exports) and Expenditures (imports) categories Vintages: 1995:8–2006:9 (& 2007:7), Coverage 1995:Q2–2006:Q2
OECD output gap data (source: OECD Main Economic Indicators) Bi-annual vintages with annual or quarterly series
(for resp. 25 or 18 countries)– Estimates based on a production function approach– Output gap = (Y – Y*)/Y* ≈ y – y*
Vintages: 1995:6–2009:6, Coverage: 1996–2008 or 1995Q4–2009Q2

14 December 2009
6International Seminar on Early Warning and Business Cycle Indicators
‘Final’ release data
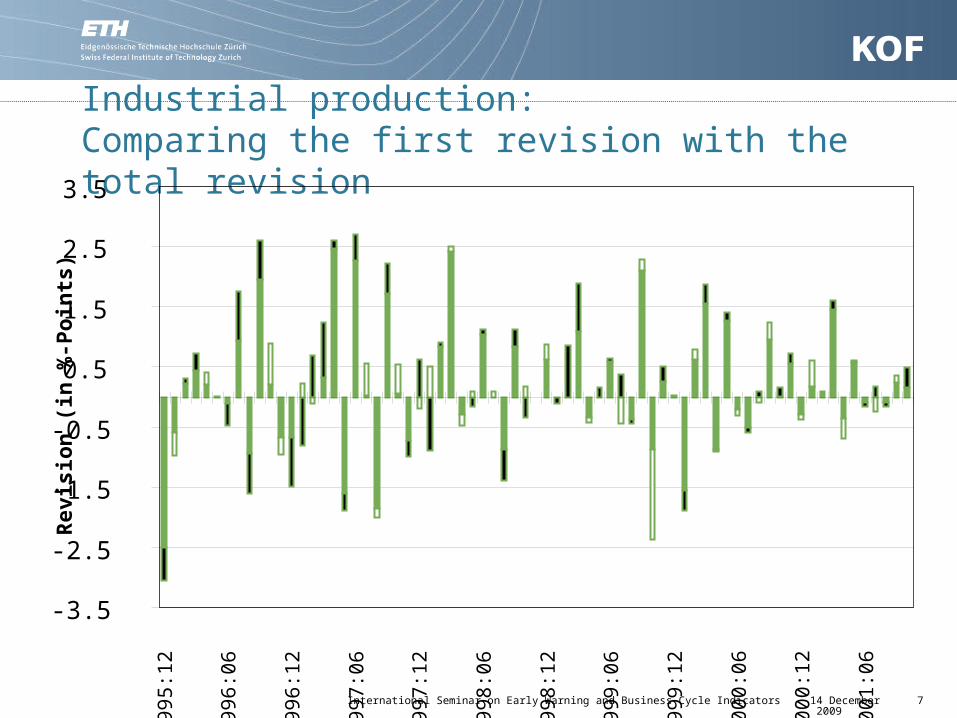
Besides analysing first revisions, we concentrate on the final/total revision The latter is conceptually more important
Will we ever have true final data? Industrial production
– Take most recent vintage as final release
– Allow for at least two years between first and final release Current account
– Take most recent vintage as final release
– Distinguish between different types of revisions
• Benchmark / Summer / Winter / Early / Other revisions Output gap
– Revisions do not appear to die out – no final release
14 December 2009
7International Seminar on Early Warning and Business Cycle Indicators
Industrial production:Comparing the first revision with the total revision
Rev
isio
n (
in %
-Po
ints
)
-3.5
-2.5
-1.5
-0.5
0.5
1.5
2.5
3.51
99
5:1
2
19
96
:06
19
96
:12
19
97
:06
19
97
:12
19
98
:06
19
98
:12
19
99
:06
19
99
:12
20
00
:06
20
00
:12
20
01
:06

14 December 2009
9International Seminar on Early Warning and Business Cycle Indicators
Current account:Data set up and revision processes
J F M A M J J A S O N D J F M A M J J A S O N D J F M A M J J A S O N D J F M A M J J A S...2000 I2000 II2000 III2000 IV2001 I2001 II2001 III2001 IV2002 I2002 II2002 III2002 IV2003 I2003 II2003 III2003 IV2004 I2004 II2004 III2004 IV
1st revision To be revised next summer2nd revision 2nd winter revision 2nd summer revision To be revised next winter3rd revision 3rd winter revision 3rd summer revision
2004 2005 20062003. . Jun
2007
1st summer revision1st winter revision
FF
FF
FF
FF
F
F First release
Other revisionsBenchmark revisionFinal data

14 December 2009
10
International Seminar on Early Warning and Business Cycle Indicators
Current account:Significant biases? Looking at averages
Mean Sign. Mean Sign. Mean Sign.
Total revisionsEarly revisionsSummer revisionsWinter revisionsBenchmark revisionsOther revisions
Total revisionsEarly revisionsSummer revisionsWinter revisionsBenchmark revisionsOther revisions
Relative to first release (in perc.)
Income side Expenditures sideCurrent account
Levels in millions of CHF371.61 0.29-27.87 0.88656.17 0.06
-4.12 0.95-325.46 0.00
75.69 0.39
5.2% 0.120.2% 0.927.9% 0.020.1% 0.83
-3.4% 0.000.5% 0.54
1'795.71 0.00292.87 0.10
1'800.39 0.00119.02 0.14
-723.09 0.00314.03 0.02
3.0% 0.000.4% 0.113.0% 0.000.2% 0.14
-1.2% 0.000.5% 0.01
1'424.10 0.00320.75 0.01
1'072.20 0.00123.13 0.18
-327.41 0.00238.34 0.02
2.7% 0.000.6% 0.012.1% 0.000.2% 0.18
-0.6% 0.000.4% 0.02

14 December 2009
12
International Seminar on Early Warning and Business Cycle Indicators
Output gaps:Revision process of annual output gaps: avg.bal.panel
Source: OECD, calculations KOF
-1.0
-0.5
0.0
0.5
1.0
1.5
1996 1997 1998 1999 2000 2001 2002 2003 2004 2005
rev. 1 rev. 2 rev. 3 rev. 4 rev. 5 rev. 6 rev. 7
%-points

14 December 2009
13
International Seminar on Early Warning and Business Cycle Indicators
Business Tendency Survey data
Business Tendency Survey data is not revised over time Ifo Business Tendency Survey for Germany
Monthly survey covering 7,000 firms
– “We judge our current business situation for product group X to be”
• Good / Satisfactorily / Bad KOF Business Tendency Surveys for Switzerland
Monthly/Quarterly surveys covering 11,000 firms
– Hotel nights foreigners (compared to last year & expectations)
– Wholesale trade business situation
– Industry business situation & stock of intermediate inputs Capacity utilisation rates
Sources: European Commission, OECD, national sources “The current level of capacity utilisation”
14 December 2009
14
International Seminar on Early Warning and Business Cycle Indicators
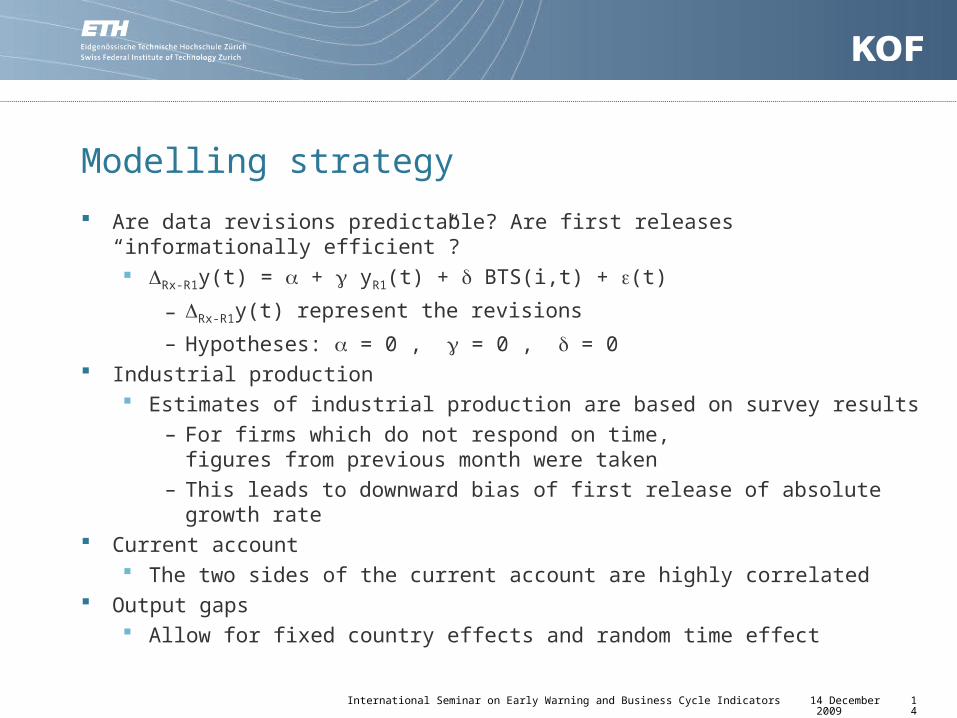
Modelling strategy
Are data revisions predictable? Are first releases “informationally efficient”? Rx-R1y(t) = + yR1(t) + BTS(i,t) + (t)
– Rx-R1y(t) represent the revisions
– Hypotheses: = 0 , = 0 , = 0 Industrial production
Estimates of industrial production are based on survey results
– For firms which do not respond on time, figures from previous month were taken
– This leads to downward bias of first release of absolute growth rate Current account
The two sides of the current account are highly correlated Output gaps
Allow for fixed country effects and random time effect
14 December 2009
15
International Seminar on Early Warning and Business Cycle Indicators
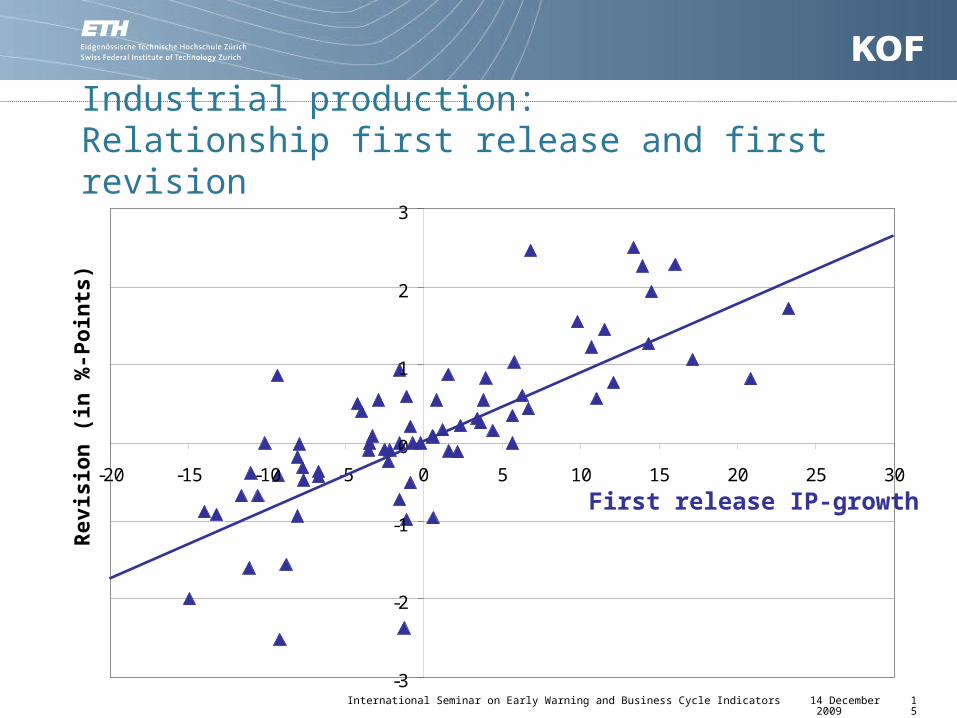
Industrial production:Relationship first release and first revision
-3
-2
-1
0
1
2
3
-20 -15 -10 -5 0 5 10 15 20 25 30
Rev
isio
n (
in %
-Po
ints
)
First release IP-growth

14 December 2009
17
International Seminar on Early Warning and Business Cycle Indicators
Current account: Goodness of fit (adj. R2)
Whole-sale
Whole-sale
Exp
ecte
d ho
tel n
ight
s
by f
orei
gner
s
Cha
nge
in h
otel
nig
hts
by f
orei
gner
s (Y
-o-Y
)
Bus
ines
s si
tuat
ion
Bus
ines
s si
tuat
ion
Sto
ck o
f in
term
edia
te
inpu
ts
Exp
ecte
d ho
tel n
ight
s
by f
orei
gner
s
Cha
nge
in h
otel
nig
hts
by f
orei
gner
s (Y
-o-Y
)
Bus
ines
s si
tuat
ion
Bus
ines
s si
tuat
ion
Sto
ck o
f in
term
edia
te
inpu
ts
Hotels IndustryW
itho
ut a
ny K
OF
indi
cato
rsHotels Industry
Wit
hout
any
KO
F in
dica
tors
Cur.acc. 0.01 0.02 0.03 -0.02 0.05 -0.02 0.01 -0.01 0.01 0.04 0.04 -0.01
Income -0.03 0.15 0.14 0.08 0.04 -0.03 0.00 0.00 -0.02 -0.01 -0.03 0.15Expend. 0.01 0.23 0.16 0.26 0.00 0.12 0.00 0.07 0.06 0.11 0.03 0.09
Total revisions Early revisions
Cur.acc. -0.02 -0.04 -0.04 -0.03 -0.04 -0.04 0.00 0.00 -0.01 0.06 0.00 -0.02
Income -0.03 0.25 0.20 0.16 0.07 0.05 0.02 0.17 0.18 0.06 0.14 0.24Expend. -0.02 0.41 0.34 0.53 0.09 0.24 -0.02 0.16 0.16 0.07 0.10 0.08
Summer revisions Winter revisions
Cur.acc. 0.01 0.00 -0.01 -0.01 0.02 0.01 0.02 -0.01 0.00 -0.01 -0.01 0.05 Income 0.35 0.37 0.36 0.36 0.39 0.34 0.01 -0.01 -0.02 0.00 -0.01 0.09Expend. 0.40 0.38 0.38 0.39 0.38 0.43 0.04 0.01 0.02 0.06 0.04 0.02
Benchmark revisions Other revisions

14 December 2009
19
International Seminar on Early Warning and Business Cycle Indicators
Output gaps:Regression results: Annual data
Revision 1Cumulative Revision 2Cumulative Revision 3 Cumulative Revision 4 Cumulative Revision 5 Cumulative Revision 6 Cumulative Revision 7
Revision 1Cumulative Revision 2 Cumulative Revision 3 Cumulative Revision 4 Cumulative Revision 5 Cumulative Revision 6 Cumulative Revision 7
gam
ma
gam
ma=
0
-0.22 0.00
-0.30 0.00
-0.43 0.00
-0.37 0.00
-0.42 0.00
-0.37 0.00
-0.39 0.00
-0.17 0.00
-0.27 0.00
-0.39 0.00
-0.40 0.00
-0.46 0.00
-0.41 0.00
-0.41 0.00
delta
delta
=0
0.06 0.010.08 0.01
0.14 0.00
0.10 0.01
0.13 0.00
0.12 0.00
0.13 0.00
0.03 0.180.09 0.010.14 0.00
0.13 0.00
0.15 0.00
0.15 0.00
0.16 0.00
Hau
sman
LR-T
est
0.00 0.000.00 0.000.00 0.000.01 0.000.00 0.00
0.02 0.000.01 0.00
0.00 0.140.00 0.120.00 0.000.01 0.000.00 0.000.01 0.000.00 0.00
Adj
.R2
0.260.360.500.420.540.420.49
0.210.270.340.350.450.440.50
Significant at a 1% level
#Obs
.
279
254
229
200
200
200
304
279
254
229
200
200
200
200

14 December 2009
20
International Seminar on Early Warning and Business Cycle Indicators
Conclusions
German industrial production growth: Especially the first revisions have considerable size Carry-over effect explains large part of first revision Ifo indicator helps explain initial revisions
Swiss current account statistics: Since end of the 1990s, revisions have increased in absolute size We distinguish between benchmark, summer, winter, early and other revisions
– Summer revisions are the most important KOF indicators contain information on revisions
OECD Output gaps: Revisions are of a similar magnitude as the output gap itself During the period 1995-2005 output gaps
have overall been revised towards their mean– Hence, revisions appear to be predictable
BTS data on capacity utilisation can partly explain revisions

14 December 2009
30th CIRET Conference, New York Economic Tendency Surveys and the Services SectorHosted by The Conference Board, New York, NY

14 December 2009
22
International Seminar on Early Warning and Business Cycle Indicators
Centre for International Research on Economic Tendency Surveys (CIRET)
The overall aim of CIRET conferences is to encourage and improve communication, exchange and co-operation between academics and practitioners who conduct economic surveys, analyse survey data and develop or make use of cyclical indicators
30th CIRET Conference in New York: October 13 – October 16, 2010 Economic Tendency Surveys and the Services Sector
– Special Topic: Economic Tendency Surveys and Financial Markets
Submission Procedure Abstracts deadline: February 28, 2010 Papers deadline: June 30, 2010
Further information to be found on: http://www.ciret.org