13 oganizar tional performance measurement
TRANSCRIPT

T h e D e v e l o p m e n t C o m p e n d i u m 2 0 1 2 I X I I I - 1
13■ Organizational Performance Measurement
Introduction
Information on the results from investing in programmes, policies and projects is essential to sound decision-making.
This chapter of the Development Compendium is primarily concerned with performance measurement in the context of the
organization as a whole. It is prudent to also point out that the environmental context of the organization itself is the manage-
ment of goods, people and conveyances across borders. Together with other key buildings blocks outlined in
− the WCO’s Customs in the 21st Century strategic vision;
− the Standards and guidelines contained in the revised Kyoto Convention; and
− the SAFE Framework of Standards,
performance measurement is a necessary practice that underpins all modern Customs administrations.
Customs performance measurement is most effective when it takes into account the aims unique to the Customs service and
the specific political, social, economic and administrative conditions in the respective country1.
The discussion, models and tools are prepared from the perspective of managing resources holistically for the purpose of
achieving organizational goals. Chapter 9 on Human Resource Management and Leadership provides guidance on incentive
management and managing underperformance of individuals, for example.
In order to enable senior decision-makers to be aware of what is working well and identifying better ways to deliver services
that are not working as well, it is necessary to develop measures for performance. The sub-sections of this chapter illustrate
ways to develop performance measures. Annex 1 illustrates examples of quantitative and qualitative Customs indicators that
practitioners can draw on or use to develop their own measures to manage and report on performance.
1 Ireland, R., Cantens, T. and Yasui, T. 2011, An Overview of Performance Measurement in Customs Administrations: WCO Research Paper No. 13, WCO, Brussels

2 - X I I I I T h e D e v e l o p m e n t C o m p e n d i u m 2 0 1 2
Performance Measurement
The term “performance measurement” usually refers to the continuous gathering of data from specific functional areas. It con-
cerns the ongoing monitoring and reporting of a Customs administration’s progress towards reaching its organizational goals.
It is made up of an internal system that collects, collates and reports on workflows, outputs and outcomes.
The purpose of performance measurement is to assist making decisions and to understand progress towards meeting the
outcomes of the Strategic Plan and Action Plans. Strategic Plans and Action Plans typically have associated objectives. One of
the more difficult tasks for managers is identifying indicators that demonstrate progress towards achieving objectives. Moving
towards this outcomes-based approach is no easy task. A recent Organization for Economic Cooperation and Development
(OECD) report showed that even countries that have been using this approach for over 15 years continue to struggle with issues
of measurement and target setting2. This is especially the case for “outcomes”. A key challenge for all Customs administrations is
obtaining good quality information which is valid, reliable and timely.
A performance indicator is a detailed quantitative and/or qualitative descriptor. It describes what the organization is doing or
has done. There can be more than one indicator for each performance measure. In order to assist with the discussion of organi-
zational performance measurement, use of the following nomenclature is recommended3:
Input is the resource required to complete activities, for example, people, equipment, technology, legislation and
budget;
Activity is the process undertaken, for example, it can be daily, weekly, monthly and would include collecting import
documentation, screening and questioning people moving across the border, boarding arriving vessels, numbers of
vehicles inspected, etc;
For clarification of the use of the term process, according to the International Organization for Standardization (ISO) a
process can be characterized as “a set of interrelated resources (e.g. personnel, finance, IT facilities, equipment, methods)
and activities (working steps) which transform inputs into outputs4”.
Output is a result achieved, for example, an annual report, as well as effective and efficient use of resources, management
of, and the ability to report on the cost to deliver Customs services, revenue collected, enforcement seizures, permits
issued, training courses conducted, etc.
Outcome is the impact, benefit or change as a result of Customs’ activities.
Diagram 1 is an illustration of this model and an actual Customs example of applying the model can be found at Annex 2.
2 Tax administration in OECD and selected non-OECD countries: 2010 3 Based on references at Annex 5. 4 ISO, 1994, Quality Management and Quality Assurance: Vocabulary, International Standard ISO 8402, International Organization for Standardization: Geneva, p.2.

T h e D e v e l o p m e n t C o m p e n d i u m 2 0 1 2 I X I I I - 3
Strategic Plan Action Plan Inputs Outputs Outcomes Customs Goal
Diagram 1: Outcomes-based Performance Measurement model
Baseline Data and Benchmarking
When developing a performance measurement management system (design, policy, procedures and technology support), it is
important to capture baseline information from the outset. Baseline information or baseline data is the initial collection of data,
which is then used to compare the same data collected/reported in future years.
The baseline performance measure data provides the basis for assessing improvements (or change) over time. Without baseline
data to establish the pre-reform and modernization situation, it is difficult to demonstrate to government, stakeholders or do-
nors whether or not progress at the “outcome” level can be shown to have taken place.
Over time, the baseline data will evolve into simply being a component of the historical performance data that accumulates.
The performance reports are used weekly, monthly and annually for decision-making and may ultimately evolve for use as a
benchmark. Benchmarking can improve Customs performance by identifying best practices of other administrations that per-
form similar activities, such as Customs release times or effective risk management techniques, for example. Benchmarking can
also be used internally, for example, to compare when there are two or more port operations in a country that are similar in size
and perform similar activities. The objective of benchmarking is to find examples of superior performance and to understand
the processes and practices driving that performance. Companies then improve their performance by tailoring and incorporat-
ing these best practices into their own operations. Chapter 6 of this Compendium looks at the benchmarking process in more
detail.
Most Customs organizations measure performance in terms of effectiveness and efficiency.
Effectiveness refers to the extent to which the organization is achieving the outcome. Efficiency refers to the ratio of relevant
outputs to relevant inputs and can include costs, steps in a process or time, for example.

4 - X I I I I T h e D e v e l o p m e n t C o m p e n d i u m 2 0 1 2
There are numerous methods to measure organizational performance. Table 1 below lists approaches favoured by a number
of WCO Members. Common to these models are that they premised on the existence of organizational goals and regularly
monitoring of progress towards those goals. The intention for each is that the process of collection and reporting becomes
integrated into the overall management system of the organization.
All of the models listed can improve organizational performance provided that they are implemented comprehensively and
remain focused on organizational results. The list below is not exhaustive. Many of the administrations from which examples of
performance measurement have been gathered, have customized their approach.
Table 1: Organizational Performance Measurement Methods5
Balanced Scorecard Focuses on four perspectives, including customer perspective, internal-business processes, learning and growth and financials, to monitor progress towards the
organization's strategic goals
Benchmarking Uses standard measurements in a service or industry for comparison with other
organizations in order to gain perspective on organizational performance. In
and of itself, this is not an overall comprehensive process assured to improve
performance, rather, the results from benchmark comparisons can be used in
more overall processes. Benchmarking is often perceived as a quality initiative
Business Process Reengineering Aims to increase performance by radically redesigning the organization's struc-
tures and processes, including by starting over from the ground up
ISO9000 Is an internationally recognized standard of quality, and includes guidelines to
accomplish the ISO9000 standard. Organizations can be optionally audited to
earn ISO9000 certification
Knowledge Management Focuses on collection and management of critical knowledge in an organiza-
tion to increase its capacity for achieving results. Knowledge management of-
ten includes extensive use of computer technology. In and of itself, this is not an
overall comprehensive process assured to improve performance. Its effective-
ness towards reaching overall results for the organization depends on how well
the enhanced, critical knowledge is applied in the organization.
Management by Objectives Aims to align goals and subordinate objectives throughout the organization.
Ideally, employees get strong input to identifying their objectives, time lines for
completion, etc. Includes ongoing tracking and feedback in process to reach
objectives. MBO is often perceived as a form of planning.
Total Quality Management Set of management practices imposed throughout the organization to ensure
that it consistently meets or exceeds customer requirements. Strong focus on
process measurement and controls as a means of achieving continuous im-
provement.
5 UK Audit Commission, 2000, Aiming to improve the principles of performance measurement, ISBN 1 86240 227 2

T h e D e v e l o p m e n t C o m p e n d i u m 2 0 1 2 I X I I I - 5
Programme Evaluation
Two terms that sometimes cause organizational performance measurement to be confused with the measurement of other,
more specific management interests are “project or programme measurement” and “performance management”. A simple dis-
tinction is that performance measurement concerns ongoing monitoring and reporting of the whole organization, while pro-gramme evaluation concerns individual systematic studies conducted periodically (or on an ad hoc basis) to identify gaps in
original plans and assess how well a project or programme is working. Additionally, the term “performance management” is
more commonly associated with human resource management.
Programme Evaluations can be categorized into four types:
1. Implementation Evaluation
Assesses the extent to which a programme is operating as it was intended, it typically assesses programme conform to statutory
and regulatory requirements, standards, programme design or stakeholder expectations.
2. Outcome Evaluation
Assesses the extent to which a programme achieves its outcome-oriented objectives, focusing on outputs and outcomes to cri-
tique the effectiveness of systems and programmes, but may also assess programme process/workflow in order to understand
how outcomes are produced and identify gaps.
3. Impact Evaluation
Assesses the net effect of a programme by comparing programme outcomes with an estimate of what would have happened
in the absence of the programme, used when external factors are known to influence the programme’s outcomes in order to
isolate the programme’s contribution to the achievement of its objectives.
4. Cost-Benefit Evaluation
Compares a programme’s outputs or outcomes with the cost of producing them, cost-effectiveness analysis assesses the cost
of achieving a single goal or objective and can be used to identify the most cost-effective alternative to meet that goal, usually
expressed in monetary terms.
Performance Indicators
An observation that can be made based on many annual reports published by a number of Customs administrations is that
performance indicators are mainly quantitative reports of inputs and outputs. A more accurate and comprehensive definition is
that “a performance indicator should define the relevant measure of a critical component about the performance of a Customs
core function, expressed as a percentage, index, rate, or other tangible or evidence-based comparison, which is monitored at
regular intervals”.
The information collected and provided concerning Customs performance indicators is premised around:
■ The Customs in the 21st Century blueprint;
■ Aligning the metrics to each of the roles identified to the WCO Diagnostic Framework; and
■ The inclusion of organizational level indicators and some work flow indicators.
The roles identified in the Customs in the 21st Century strategy are:
a) Promoting socio-economic development;
b) Creating the conditions for economic growth;
c) Controlling borders;
d) Providing security; and
e) Protecting citizens.
6 - X I I I I T h e D e v e l o p m e n t C o m p e n d i u m 2 0 1 2
The WCO Diagnostic Framework consists of the following sections:
1. Strategic Management
2. Resources
3. Customs Systems and Procedures
4. Legal Framework
5. Information and Communication Technology
6. External Cooperation, Communication and Partnership
7. Governance
Using the above structure, examples of indicators that illustrate various types of metrics that can be applied for Customs pro-
grammes are listed in Annex 1. Annex 1 summarizes key and common indicators used by many WCO Members in each of the
six WCO regions. The collation is a list of examples of performance indicators submitted or identified during a research period
from June to December 2011. The annex is not an exhaustive list of indicators used by Customs administrations around the
world, although it is quite comprehensive.
Annex 1 should be regarded as a “living document”. The WCO Secretariat will continue to collect information from Members
on their inputs, outputs, possible target methodologies and possible sources, for example, with the matrix being reviewed and
improved regularly.
Many examples of Customs quantitative indicators are available in the more established “service delivery” roles, such as the time
release study, selection and examination, document lodgement, etc. However, in other “softer” intervention areas, such as good
governance, policy reform or institutional capacity-building, the nature of progress leads managers towards more qualitative
indicators6. Table 2 below lists six principles to consider when designing or choosing performance indicators.
The appropriateness of quantitative as opposed to qualitative indicators depends upon the type of performance issue. For
example, quantitative indicators lend themselves to measuring efficiency, whereas something like new legislation passing
through the government, for example, or a customer satisfaction survey, implies using a qualitative approach.
For the qualitative approach, ideally the indicator and/or standard would be designed in consultation with a representative of
the population who will be the subject of the questionnaire or survey. This would include the desired level of performance. The
results of the questionnaire/survey (conducted yearly or perhaps every two years) should be augmented with data held within
Customs information technology systems.
The results of analysis or any score derived from responses would illustrate areas where policies, systems and processes are
working well, together with areas for improvement. Note that the indicators can also be weighted to further identify and prior-
itize the areas for improvement. Weighting is a method of assigning a relative importance of a particular indicator to an output.
This can be useful when dealing with multi-role functional organizations such as Customs (e.g. revenue, security, trade facilita-
tion, community protection from prohibited substances, etc.).
6 UNDP, Selecting Key Results Indicators, May 1999.

T h e D e v e l o p m e n t C o m p e n d i u m 2 0 1 2 I X I I I - 7
Table 2: Principles for Identifying Performance Indicators 7
Clarity of purpose It is important to understand who will use the information, and how and why it
will be used. Managers need indicators which help them make better decisions
or answer their questions.
Focus Performance information should be focused in the first instance on the pri-
orities of the organization – its core objectives and service areas in need of
improvement. This should be complemented by information on day-to-day
operations. Organizations should learn how indicators affect behaviour, and
build this knowledge into the choice and development of their performance
indicators.
Alignment The performance measurement system should be aligned with the objective-
setting and performance review processes of the organization. There should
be links between the performance indicators used by managers for operational
purposes and the indicators used to monitor corporate performance. Manag-
ers and staff should understand and accept the validity of corporate or national
targets.
Balance The overall set of indicators should give a balanced picture of the organization’s
performance, reflecting the main aspects including outcomes and the users’
perspective. The set should also reflect a balance between the cost of collecting
the indicator and the value of the information provided.
Regular refinement The performance indicators should be kept up-to-date to meet changing cir-
cumstances. A balance should be struck between having consistent informa-
tion to monitor changes in performance over time, taking advantage of new or
improved data, and reflecting current priorities.
Robust The indicators used should be sufficiently robust and intelligible for their in-
tended use. Independent scrutiny, whether internal or external, helps to ensure
that the systems for producing the information are sound. Careful, detailed
definition is essential; where possible, the data required should be quickly and
electronically available.
An important message which emerges from the information in the above table is that designing Customs performance indica-
tors should not be guided by what inputs or outputs are easy to measure, neither should indicators be used simply because
they have been used previously. Performance indicators and performance measurement is about collecting meaningful in-
formation on outcomes related to organizational objectives so that managers can make better decisions. A number of other
examples of principles to follow when developing performance indicators are at Annex 3.
7 UK Audit Commission, 2000, Aiming to improve the principles of performance measurement, ISBN 1 86240 227 2

8 - X I I I I T h e D e v e l o p m e n t C o m p e n d i u m 2 0 1 2
Scrutiny of current Customs indicators shows that there are many types of indicators. For example, there are “leading and lag-
ging” types of indicators. There are also financial/non-financial, internal/external, short/long-term, etc. Leading indicators pro-
vide information about the results of performance at a later date. Leading indicators focus on the future and are meant to be
“performance drivers” that create conditions for future success. Examples of leading indicators, as found in the Dutch Customs’
Balanced Scorecard, include :
− activities dealing with AEOs, concerning the AEO status for companies;
− activities dealing with the support of new businesses/companies (as this will help to show them the right way to
deal with Customs and hopefully make them act in a compliant way);
− prevention and reduction of IT-system failures;
− amount of time (or money) spent on educating and training of staff.
Lagging indicators show what has happened after an event. These are the most common indicators recorded and reported
by WCO Member administrations. They typically include the amount of revenue collected, the number of seizures, etc. When
designing performance indicators, it is important to have a good mixture of different types of indicators.
Performance indicators should be developed in perspective. A useful mantra is that “indicators only indicate”. Performance in-
dicators will only be as good as the Customs performance management methodology in which they are embedded. Investing
time and resources in developing indicators, but then being unable to collect data against them will not assist in making better,
more informed decisions or demonstrating Customs’ contribution to border management.
An emphasis on what outcomes are being achieved is important. However, to actually improve performance many other things
besides performance indicators are needed. Performance indicators contribute to improving service delivery, but Customs also
needs to continue developing institutional arrangements to actually provide quality services. This includes harnessing politi-
cal will and support, as well as creating opportunities for future leaders and managers to question and improve systems and
processes. It also includes creating an environment where staff are willing and encouraged to ask questions about what they
do and why they do it. Other relevant institutional arrangements are maintaining organizational support services, for example,
training, equipment and administrative support systems, and building strong partnerships with other agencies and the private
sector.
Coordinated Border Management Performance Measurement
Border management authorities around the world all face the same predicament, which is how to deal with increasing volumes
of people, conveyances and goods, rarely with any corresponding increase in resources. The mission commonly identified with
Customs is to develop and implement an integrated set of policies and procedures that ensure increased safety and security,
as well as effective trade facilitation and revenue collection. For WCO Members, the question of whether or not priority is given
to security, trade facilitation or revenue collection will vary as they are derived from the mandate that Customs receives from
its government.
Customs often takes the lead role in balancing trade facilitation, on the one hand, with trade security on the other—allowing
legitimate goods and travellers to pass through borders unimpeded while protecting the international trade supply chain from
threats posed by organized crime and criminals, smugglers and commercial fraudsters, terrorists and associated goods that can
cause harm. This is achieved through efficient and effective use of tools and information in dealing with the international move-
ment of goods, conveyances and people connected with the goods.
Coordinated Border Management (CBM) is now recognized by the Customs community as a potential solution for the chal-
lenges that the 21st Century presents, especially with respect to border control and administration. A coordinated approach
by border management agencies lies at the heart of the CBM concept. The term gives prominence to the general principle of
coordination of policies, programmes and delivery among cross-border regulatory agencies, rather than favouring any single
solution.

T h e D e v e l o p m e n t C o m p e n d i u m 2 0 1 2 I X I I I - 9
There are numerous examples of WCO Members acting on behalf of other government agencies. For those who do not exercise
ex-officio authority, for example, it is still not uncommon for them to detain prohibited goods (e.g., narcotics, agricultural goods,
firearms) and hand them over to other law enforcement bodies or responsible agency. One liability of this situation is that while
Customs is the lead agency, it cannot always control the actions and requirements of other border management agencies,
which often results in Customs bearing the blame for clearance delays. This situation also impacts on both undertaking and
reporting on this aspect of organizational performance.
To date, there are very few examples of “three-dimensional” performance indicators, i.e., Customs-Other Government Agencies
(OGA)-Private Sector8. It is a worthwhile goal to capture all stakeholder inputs and outputs in order to analyse border manage-
ment and identify where efficiency and effectiveness initiatives can be introduced. The most familiar supply chain performance
model to Customs is the WCO Time Release Study (TRS). There are a number of other models that provide some measurement
of border management processes. Some of these approaches include the World Bank’s “Doing Business” surveys and “Logistics
Performance Index”. So while there are existing comprehensive models, there is no single set of performance measures for use
by Customs, OGA’s and the private sector in combination.
The key to integrating border management performance measures is to develop high-level outcomes that are relevant to
government and private sector objectives9. The design of indicators will need to take into account what other border control
agencies are doing and the information they are already collecting and reporting on. The ultimate goal would be to develop
a “set” of border control and administration indicators that reflect the whole-of-government approach and policies for border
management. Undertaking this challenge in itself will require creative coordinated border management negotiations, as well as
the previously identified institutional framework such as high-level political support, appropriate resourcing and private sector
involvement.
Service Charters
Changes to government services are influenced by market forces, new government policies, programmes that compare or part-
ner with the private sector, and liberalization (of traded goods and movement across borders, for example). Customs adminis-
trations are not exempt from these changes in policies and practices of public administration. In the past, many government
organizations have been criticized for lack of delivery service quality10. This changed with the movement termed new public management (NPM), which occurred in most developed nations around 199011.
NPM has been called many things and there is no single agreement on a definition, however, in the context of this Compendium
it is regarded as a term to describe a spectrum of administrative changes and reform programmes.
Service Charters are an NPM strategy intended to change the culture of public service delivery. Service Charters can be used
to link Customs reforms and governance initiatives with improving private sector (and traveller) confidence in Customs service
delivery. The objectives often include specific standards for service delivery. The Canadian Border Services Agency describes
Service Charters standards as “Public commitments of standards of service that a client, customer or stakeholder can normally ex-pect, including such elements as descriptions of the service to be provided, service pledges or principles, delivery targets and complaint and redress mechanisms.” 12
In the same way that there is no definitive description of NPM, there is no model example that governments and Customs
administrations can follow to develop and promote Service Charters. Table 3 below lists some examples of Members that have
Service Charters. A selection of more detailed examples, drawn from the list below, can be found at Annex 4.
8 Holloway, S. 2010, ‘Measuring the Effectiveness of Border Management: designing KPIs for outcomes’, World Customs Journal, Volume 4, Number 2, September 2010; ISSN 1834-6707
9 Ibid.10 Hughes, O., 2003, Public Management and Administration: An Introduction, 3rd ed., Bassingstoke: Palgrave11 Ibid.12 http://cbsa-asfc.gc.ca/

1 0 - X I I I I T h e D e v e l o p m e n t C o m p e n d i u m 2 0 1 2
Table 3: Examples of Service Charters 13
Angola Service Standards www.alfandegas.gv.ao/servicos.aspx
Australia Client Service Charter & Standards
and Practice Statements
www.customs.gov.au/webdata/resources/files/ClientService-
CharterDL-WEB.pdf
Belgium At Your Service http://fiscus.fgov.be/interfdanl/downloads/at_your_service.pdf
Canada CBSA Service Standards www.cbsa-asfc.gc.ca/services/serving-servir/
standards-normes-eng.html
Cyprus Citizen Charter http://www.moi.gov.cy/moi/citizenscharter/citizenscharter.nsf/
dmlindex_en/dmlindex_en
France You May be Controlled By Customs http://www.douane.gouv.fr/page.asp?id=111
India Citizens Charter www.cbec.gov.in/whoweare/citzn-chtr-e.pdf
Ireland Customer Service Charter http://www.revenue.ie/en/about/custservice/customer-charter.
html
Italy Electronic Helpdesk Answer to Customs query provided in 8 days for simple ques-
tions,
15 days for complex ones. http://www.agenziadogane.it/wps/
wcm/connect/Internet/ed/Servizi
/URP+telematico/URPEn
Kenya Taxpayers Charter https://docs.google.com/viewer?a=v&q=cache:roQeArAgFVwJ
Korea Customs Service Charter http://english.customs.go.kr/kcsweb/user.tdf?a=common.
H t m l A p p & c = 1 5 0 1 & p a g e = / e n g l i s h / h t m l / k o r / a b o u t /
about_06_01.
html&mc=ENGLISH_ABOUT_CUSTOMS_010
New Zealand Statement of Intent www.customs.govt.nz/library/Accountability+documents/
default.htm
Singapore Customs Service Charter www.customs.gov.sg/NR/rdonlyres/0107DA14-34A8-4629-
AE6A-9D7F745C1AB8/0/ServiceCharter_Feb2011_.pdf
United Kingdom Your Charter http://www.hmrc.gov.uk/charter/
Improving the delivery of border management services in the context of the trade supply chain and international traveller rout-
ing is a familiar goal of many Customs administrations. A key strategic outcome is establishing confidence in Customs and an
aid to building confidence is the statement of clear service standards in the form of Service Charters.
Many Customs Service Charters have aspirational as well as quantitative targets. Whether or not as part of legal obligations
or best practice governance, transparency and accountability, most Members publish their results against the service targets
in annual reports. A number of Members also publish specific performance indicators and/or standards monthly or quarterly.
The combination of well-designed performance indicators and achievable service targets will produce valuable management
information. This information assists the Customs administration to make better decisions, deliver services more efficiently,
deploy resources more effectively and consolidate its position as the lead border management agency within government.
Conclusion
Measuring the performance of Customs is an important part of improving organizational development and border manage-
ment. The performance measurement of border control and administration functions against targets, indicators and standards
has been widely adopted. Members and the WCO Secretariat, in cooperation with academic partners, have worked to gather
and consolidate the latest knowledge on performance measurement into this chapter.
13 Annex 3 contains some examples of the different approaches to designing a Service Charter.

T h e D e v e l o p m e n t C o m p e n d i u m 2 0 1 2 I X I I I - 1 1
Many examples of performance measurement and performance indicators in use by WCO Members and international institu-
tions are included in Annex 1. It is recognized that it may be difficult for some Members to move from measuring inputs and
outputs to measuring outcomes, as well as with moving to measuring performance where multiple border control agencies and
the private sector operate.
It is not possible to provide a single example of best or better practices of performance measurement, because Members’ Mis-
sion Statements and priorities vary based on their environment. It is also not possible to provide an exhaustive list of all possible
Customs performance indicators. Annex 1 attempts to provide a comprehensive list that will assist Members to develop perfor-
mance indicators appropriate to their environment, however, continuing contributions to the WCO to augment the Annex will
result in an even more robust reference.
Performance measurement should include both quantitative and qualitative information on performance. The performance
measurement results, and the evaluation of those results, will guide Customs strategic decision-making. When published week-
ly, monthly, quarterly or annually, the reporting of performance against agency outcomes is a transparent communication tool
that garners confidence from the government and the public. An important part of performance measurement is to include a
review component of the indicators to ensure that they remain valid in terms of agency priorities.
The benefits of an adaptable, strategically focused Customs administration are immense. The use of performance measurement
as part of its institutional arrangements can provide benefits such as reduced compliance costs for legitimate traders, more
effective and efficient targeting of high-risk movements, and greater confidence and mutual recognition among Customs ad-
ministrations of each other’s programmes and controls.
Further, countries which need to source assistance in the form of expertise or financing of reform and modernization pro-
grammes can more clearly demonstrate progress where there are relevant and accurate performance indicators to report. De-
signing relevant performance indicators, such as the examples in Annex 1, are useful for illustrating reform and modernization
efforts and improvements when preparing and discussing capacity building business cases with donors, for example. Perfor-
mance measurement reporting is also useful for evaluating reform and modernization progress under Phase 3 of the WCO
Columbus Programme.

1 2 - X I I I I T h e D e v e l o p m e n t C o m p e n d i u m 2 0 1 2
ANNEX 1 Examples of Customs Performance Indicators following the WCO Diag-nostic Framework Format
The WCO Diagnostic Framework consists of the following sections:
1. Strategic Management
2. Resources
3. Customs Systems and Procedures
4. Legal Framework
5. Information and Communication Technology
6. External Cooperation, Communication and Partnership
7. Governance
For the purpose of these examples, the organizational mission is:
“The Customs Administration is to be the lead border agency that protects the safety, security and international commercial
trade interests of the country”

T h e D e v e l o p m e n t C o m p e n d i u m 2 0 1 2 I X I I I - 1 3
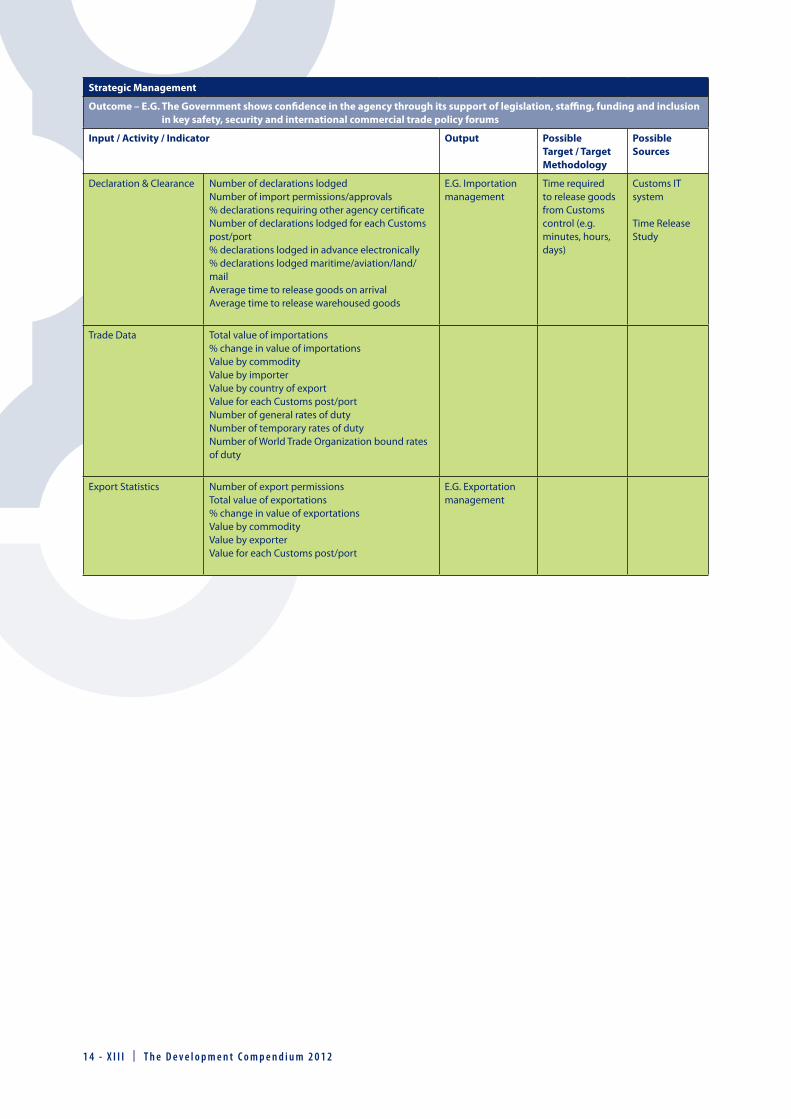
Strategic Management
Outcome – E.G. The Government shows confidence in the agency through its support of legislation, staffing, funding and inclusion in key safety, security and international commercial trade policy forums
Input / Activity / Indicator Output Possible Target / Target Methodology
Possible Sources
Cost of collecting duty, taxes and excise
Cost to collect revenue by Customs post/portAverage cost for collecting (an amount) of taxes and duties Cost of trade facilitation resourcesRatio cost to collect revenueCompleting assessment of provisional taxable values of imported vehicles within 5 working days upon receipt of applications
E.G. Efficient and effective Customs revenue collec-tion and border management
Minimal disrup-tion to the com-panies’ logistics
Set a target of average cost to lodge/process each declaration
Survey/ques-tionnaire
Import declara-tion IT system programme
Overall workload andcontinuity of Customs services
Number of vessels arrivedAverage time in portNumber of aircraft arrivedAverage time at airportNumber of vehicles arrivedAverage time at border crossingNumber of passenger and crew arrivalsAverage time spent by travellers in Customs controlled areaNumber and type of advance rulings issued% of advanced rulings replied to within a specific periodAverage time for goods to go through CustomsAverage time to issue licencesAverage time to issue import/export licences or permitsAverage time to complete registration of import-ers/distributors of motor vehiclesAverage time to conduct registration and re-registration inspectionsProviding Customs attendance in respect of excise operations within X working daysNumber of Customs licensed premises (warehous-es, storage and examination facilities, etc.)Value of warehoused goods (import and export and free zones)Days or hours of external disruption (e.g. unsched-uled IT outage, strike, natural disaster, etc.)
E.G. Facilitation Services
Target time to deliver particu-lar service (e.g. minutes, hours, days)
Customs IT systems
Time Release Study
External Scrutiny Perception of taxpayers regarding: - Risk of detection of non-compliance
and severity of consequences. - Quality of assistance provided to en-
able importers/exporters to comply with their legal obligations.
- Effectiveness of resolving importer/exporter problems
Public perception regarding the degree of corrup-tion
E.G. Professional and consistent Customs service
View of stake-holders believing decision-making is reliable and consistent
Target to increase compliments (number or per-centage)
Target to reduce complaints (num-ber or percent-age)
Complaints & Compliments system
Survey/ques-tionnaire
Ministerial/Government feedback
Press Monitor-ing
1 4 - X I I I I T h e D e v e l o p m e n t C o m p e n d i u m 2 0 1 2
Strategic Management
Outcome – E.G. The Government shows confidence in the agency through its support of legislation, staffing, funding and inclusion in key safety, security and international commercial trade policy forums
Input / Activity / Indicator Output Possible Target / Target Methodology
Possible Sources
Declaration & Clearance Number of declarations lodgedNumber of import permissions/approvals% declarations requiring other agency certificateNumber of declarations lodged for each Customs post/port% declarations lodged in advance electronically% declarations lodged maritime/aviation/land/mailAverage time to release goods on arrivalAverage time to release warehoused goods
E.G. Importation management
Time required to release goods from Customs control (e.g. minutes, hours, days)
Customs IT system
Time Release Study
Trade Data Total value of importations% change in value of importationsValue by commodityValue by importerValue by country of exportValue for each Customs post/portNumber of general rates of dutyNumber of temporary rates of dutyNumber of World Trade Organization bound rates of duty
Export Statistics Number of export permissionsTotal value of exportations% change in value of exportations Value by commodityValue by exporterValue for each Customs post/port
E.G. Exportation management

T h e D e v e l o p m e n t C o m p e n d i u m 2 0 1 2 I X I I I - 1 5
Customs Systems and Procedures
Outcome – E.G. The border is managed efficiently and proactively and high-risk travellers, conveyances and consignments are identified
Input / Activity / Indicator Output Possible Target / Target Methodology
Possible Sources
Compliance and Enforcement
Number of HS lines importedIndex of pre-declaration screening for sea cargoIndex of inspection by large scale x-ray inspection system% import consignments inspected% export consignments inspected % transit and transhipment consignments inspected% travellers (passengers and crew) inspectedNumber of post clearance auditsNumber of risk-based post clearance auditsNumber of depot, warehouse, freight terminal, etc. compliance checks undertakenNumber of vessels boardedNumber of vessels searchedNumber of vessels seizedNumber of aircraft boardedNumber of aircraft searchedNumber of aircraft seizedNumber of vehicles stopped by typeNumber of vehicles searchedNumber of vehicles seized
E.G. Intelli-gence-driven, multi-layered border man-agement that encourages compliant trav-eller and trader behaviour
Inspection and seizure databases
Customs IT system
Surveillance Planned surveillance vs. Surveillance completed Days land patrolsDays maritime patrolsDays aerial surveillanceCoverage satellite surveillanceDays satellite surveillanceCoverage satellite surveillanceNumber of reported sightings from land/maritime/aerial/satellite surveillance# CCTV days
Prohibited Goods Number of unlawful detectionsNumber and type of detentions and seizures: (drugs, laundering, IPR, firearms, revenue etc.)Number of significant infringements per 1000 Cus-toms declarationsRatio for weight of illicit drugs seizures per total weight of seizures (past 5 years)
E.G. Protect the community from high-risk travellers and consignments
Target amount of intelligence-led selections that result in unde-clared interdic-tion (number, or percentage, or percentage change from previous years, quantity, weight, value)
Seizure/Deten-tion Notices and/or IT sys-tem

1 6 - X I I I I T h e D e v e l o p m e n t C o m p e n d i u m 2 0 1 2
Customs Systems and Procedures
Outcome – E.G. The border is managed efficiently and proactively and high-risk travellers, conveyances and consignments are identified
Input / Activity / Indicator Output Possible Target / Target Methodology
Possible Sources
Revenue Collection Forecast revenue vs. actual collected amount% revenue split by import duty, tax and excise% revenue collected for each: red, amber, green imports% revenue collected exports% revenue collected post-clearance audit and excise audit% revenue collected import processing charges% revenue collected passenger movement charge% revenue collected levies (marine, navigation, pol-lution, etc.)% revenue collected on behalf of other agencies (transport, quarantine, etc.)
Customs Import/Export Management System
Trade Statistics
ExciseValue and volume : beer, wine, spiritsValue and volume : oils, petrol, etc.Number of fuel and oil samples testedValue and amount : tobaccoNumber of licensed premises auditedNumber of detections (laundering, mixing, illicit bio, etc.)
Cigarettes : maintain “tax gap” downward trend
Manufacturers’ illicit product report
% revenue collected resulting from Court actionValue of additional duty, tax or excise collected due to PCA Value of auctioned goods (seized, forfeited, aban-doned)Value of anti-dumping safeguard actionTotal revenue forgone Value of tariff concessions issuedValue of refundsValue of drawbackValue of carnet goods duty, otherwise payableValue of bounties paidValue of deferred paymentsNumber of anti-dumping/countervailing requests receivedNumber of anti-dumping/countervailing requests investigatedNumber of anti-dumping/countervailing requests finalizedRecognition rate on specific import/export proce-dures (Advance ruling system, etc.)Recognition rate on enforcement activities by ques-tionnaire

T h e D e v e l o p m e n t C o m p e n d i u m 2 0 1 2 I X I I I - 1 7
Resources
Outcome – E.G. Foster a skilled, service-oriented workforce that is adequately equipped to undertake Customs role
Input / Activity / Indicator Output Possible Target / Target Methodology
Possible Sources
Human Resources Number of staffOrganizational demographic# Vacant positionsTime taken to recruit% officers trained during reporting periodTraining hours per officer during reporting periodDays taken for unscheduled absence per officerAttrition rate and reasonStaff morale
E.G Appropriate human resource policies to deliver Customs goals and objectives Overall organiza-tional structure Number of offic-ers and Customs Houses at the regional and local levels
Create a mini-mum or average time taken to recruit
Develop a mini-mum or average or maximum number of train-ing hours/days per employee
Develop a minimum or maximum or av-erage amount of expenditure per employee to be spent on training and professional development
Human Re-source Informa-tion Manage-ment System
Scheduled staff surveys
Performance feedback inter-views
Exit interview/ survey
Financial Management Information System
Financial Allocation Budget allocation% budget on salary% budget on travel% budget on property% budget on technology & equipment% budget on IT
E.G Responsible use of public money
A target of man-aging budget within specified ratio (amount or percentage, by month, quarterly, six monthly or yearly)
Financial Management Information System
Documented procurement, contract management, maintenance and disposal guidelines
Accounts Summary Value of physical assetsTechnology & equipment value and maintenance costsProperty running costsOperating costsTransport value and running costs (vehicles, mo-bile x-ray, vessels)
E.G. Responsible use and mainte-nance of public property
Documented procurement, contract management, maintenance and disposal procedures

1 8 - X I I I I T h e D e v e l o p m e n t C o m p e n d i u m 2 0 1 2
Legal Framework
Outcome – E.G. Contribute to operating in a fair, understandable and accessible compliance and enforcement environment
Input / Activity / Indicator Output Possible Target / Target Methodology
Possible Sources
Administrative Review Number of internal formal rulingsAverage time of advance ruling decisionNumber of formal ruling decisions subject to review/appealAverage time of internal or administrative review of ruling decisions
Number of analyses of significant regulatory proposals Impact on compliance costs have been assessedNumber of consultation forums and meetings on significant regulatory issues A public regulatory plan to inform stakeholders about regulatory proposals is published each year
E.G. Apply and create relevant Customs laws predictably and consistently
Target to decrease requests for review of Customs decisions (number or percentage)
Aim to increase proportion of Customs decisions upheld (number or percentage)
Internal database and register
Judicial Review Number of cases commencedNumber of cases completed (with and without prosecution)Type of prosecutions [section or article of law/code]% of successful prosecutionsAverage time of case investigation and prosecu-tionCourt decisions [punitive, incarceration, warning, etc.]
E.G. Detect deliberate non-compliance with Customs laws
Aim to increase successful prosecution of significant/major/commercial breaches, for example (number or percentage)
Internal database and/or register

T h e D e v e l o p m e n t C o m p e n d i u m 2 0 1 2 I X I I I - 1 9
Information and Communication Technology
Outcome – E.G. Internal systems, as well as interaction with the public and other revenue and law enforcement agencies, are reli-able and secure, leading to the capability to be globally networked
Input / Activity / Indicator Output Possible Target / Target Methodology
Possible Sources
Continuity of IT services Days or hours scheduled outageDays or hours unscheduled outage
Overall rate of computerization of Customs decla-rations and accompanying documentsNumber of systems, applications and databases managed by CustomsOperating ratio of electronic Customs clearance system
E.G. Provide a robust electronic environment
Target to have a minimum downtime period of automated Customs systems
Aim to have a period of ‘Accessibility of the Customs administration website’ (e.g. days, weeks, months over a calendar year)
System informationClient survey/questionnaire
Corporate Knowledge Management
Number of archive reviewsCost of storage of documentation heldTime taken to find information and provide docu-mentation to internal requesterTime taken to find information and provide docu-mentation to external requesterTime taken to respond to requests for statistics
E.G. Manage corporate knowledge effectively and efficiently
Target a minimal response time (e.g. hours, days)
Target a minimal cost to create records and to retrieve records over a period (e.g. monthly, annual)
2 0 - X I I I I T h e D e v e l o p m e n t C o m p e n d i u m 2 0 1 2
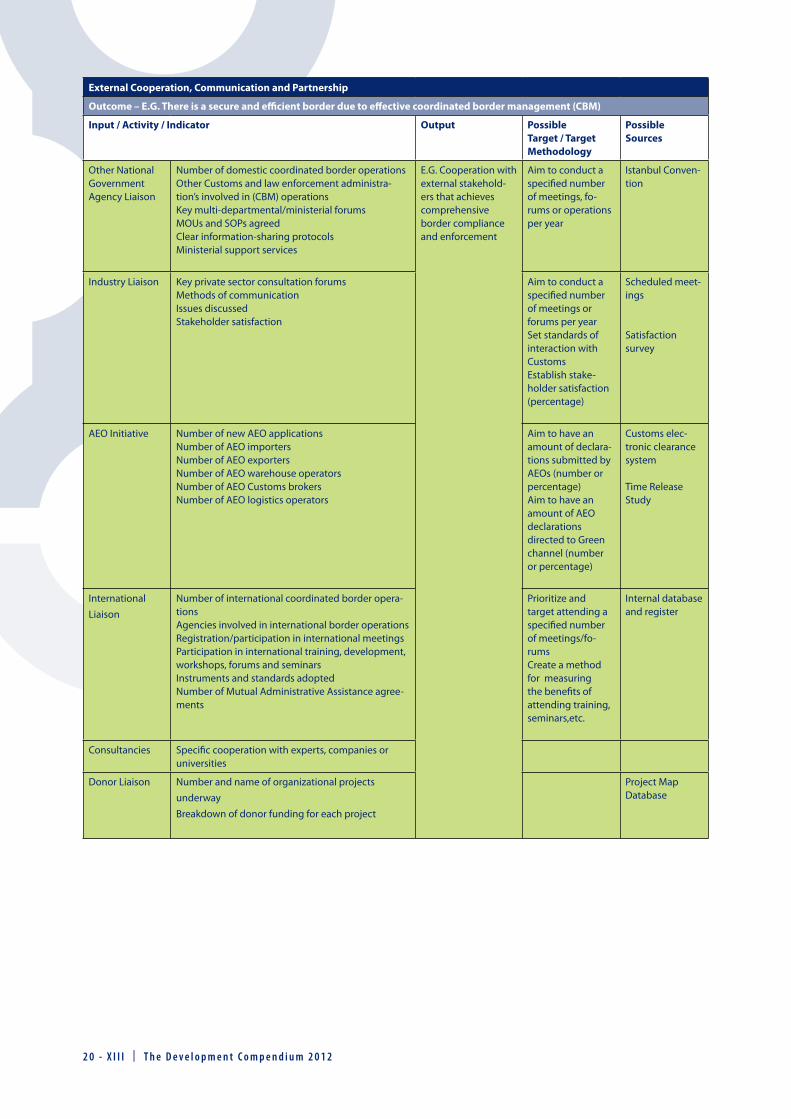
External Cooperation, Communication and Partnership
Outcome – E.G. There is a secure and efficient border due to effective coordinated border management (CBM)
Input / Activity / Indicator Output Possible Target / Target Methodology
Possible Sources
Other National Government Agency Liaison
Number of domestic coordinated border operations Other Customs and law enforcement administra-tion’s involved in (CBM) operationsKey multi-departmental/ministerial forums MOUs and SOPs agreedClear information-sharing protocolsMinisterial support services
E.G. Cooperation with external stakehold-ers that achieves comprehensive border compliance and enforcement
Aim to conduct a specified number of meetings, fo-rums or operations per year
Istanbul Conven-tion
Industry Liaison Key private sector consultation forums Methods of communicationIssues discussed Stakeholder satisfaction
Aim to conduct a specified number of meetings or forums per yearSet standards of interaction with CustomsEstablish stake-holder satisfaction (percentage)
Scheduled meet-ings
Satisfaction survey
AEO Initiative Number of new AEO applicationsNumber of AEO importersNumber of AEO exportersNumber of AEO warehouse operators Number of AEO Customs brokersNumber of AEO logistics operators
Aim to have an amount of declara-tions submitted by AEOs (number or percentage)Aim to have an amount of AEO declarations directed to Green channel (number or percentage)
Customs elec-tronic clearance system
Time Release Study
International
Liaison
Number of international coordinated border opera-tionsAgencies involved in international border operationsRegistration/participation in international meetingsParticipation in international training, development, workshops, forums and seminarsInstruments and standards adoptedNumber of Mutual Administrative Assistance agree-ments
Prioritize and target attending a specified number of meetings/fo-rums Create a method for measuring the benefits of attending training, seminars,etc.
Internal database and register
Consultancies Specific cooperation with experts, companies or universities
Donor Liaison Number and name of organizational projects
underway
Breakdown of donor funding for each project
Project Map Database

T h e D e v e l o p m e n t C o m p e n d i u m 2 0 1 2 I X I I I - 2 1
Good Governance
Outcome – E.G. The government, public, business and global community consider that Customs undertakes its role in line with international standards and best practices
Input / Activity / Indicator Output Possible Target / Target Methodology
Possible Sources
Access to Customs information
Service Charter is up-to-dateNumber of seminars held to inform stakeholders of new and current Customs proceduresPublication of strategy and policiesNumber of visits to websiteNumber of Customs website accesses with Cus-toms’ answer (FAQ)% of forms and regulations available on-lineDays toll-free contact number activeNumber and type of enquiriesNumber of complaints and number of compli-ments
E.G. Transparent and professional information and services
Customs Information Management System
Integrity Ethics Statement & Code of Conduct publishedNumber and type of investigations% change in investigations
E.G. Community has confidence in Customs adminis-tration
Target to reduce the number of reports of officer misconduct
Target to reduce the number of disciplinary ac-tions/dismissals
Complaints and Compliments System
Stakeholder interviews/ questionnaires

2 2 - X I I I I T h e D e v e l o p m e n t C o m p e n d i u m 2 0 1 2
ANNEXE 2
CASE STUDY
South African Revenue Service (SARS) Measurement Approach
SARS must align its performance management approach to its government’s planning, performance monitoring and evaluation
approach. This approach emphasises the need to set and achieve against clear outcomes measures. To align with the Govern-
ment’s planning and performance approach, and to bring itself in line with international best practice, SARS has developed
three sets of measures. These are:
1. Outcome measures: At an overall level, SARS will develop outcome measures against each of its four core outcomes of in-
creasing customs compliance, increasing tax compliance, increasing the ease and fairness of doing business with SARS and
increasing cost-effectiveness and internal efficiency.
2. Strategic priority measures: A set of strategic priority measures will be developed and used to monitor SARS’s delivery against
its three-year strategic priorities. The strategic priorities are always in support of one or more of the core outcomes and the
strategic priority measures will be used to track and evaluate key outputs that will indicate if SARS is making progress in
delivering the outcomes.
3. Divisional measures: These input-, activity-, and output-based measures will be used to track progress against divisional
objectives that are in support of SARS’s strategic priorities and outcomes.
SARS researched the measurement and reporting approaches of global revenue administrations to develop their approach
and subsequent outcome goals. Lessons from this research were used to inform the planning and performance management
approach. Key lessons included:
■ Historically, revenue administrations have tended to focus their reporting for accountability purposes on “outputs”
(e.g. number of returns filed, audits completed, etc.) more so than “outcomes”
■ Many revenue bodies have now taken steps to increase the focus of their planning and performance evaluation
towards the “outcomes” to be achieved from their administration
■ A number of revenue administrations derive a comprehensive performance management framework that includes
the practice of setting “targets” that focus on the outcomes to be achieved and which are made public, against
which progress is reported in annual performance reports
■ Finding accurate measures of performance
■ Establishing and maintaining systems of data collection
■ Setting and using performance targets
◆ ◆ ◆
◆
◆
◆
➜ ➜ ➜
◆
◆
Measurement Approach
How much do we need to invest in resources to achieve the desired outcomes?
What activities is SARS going to do to achieve the outputs?
Which priority outputs would SARS measure to achieve the outcomes?
Measure key outputs that will show if SARS is making progress in delivering the outcomes
What are the key outcomes that SARS needs to achieve its organisational goals?
Measure delivery of key activitiesDetermine optimal
allocation of inputs given desired outputs
Reallocate inputs if necessary
Inputs Activities Outputs Outcomes
T h e D e v e l o p m e n t C o m p e n d i u m 2 0 1 2 I X I I I - 2 3
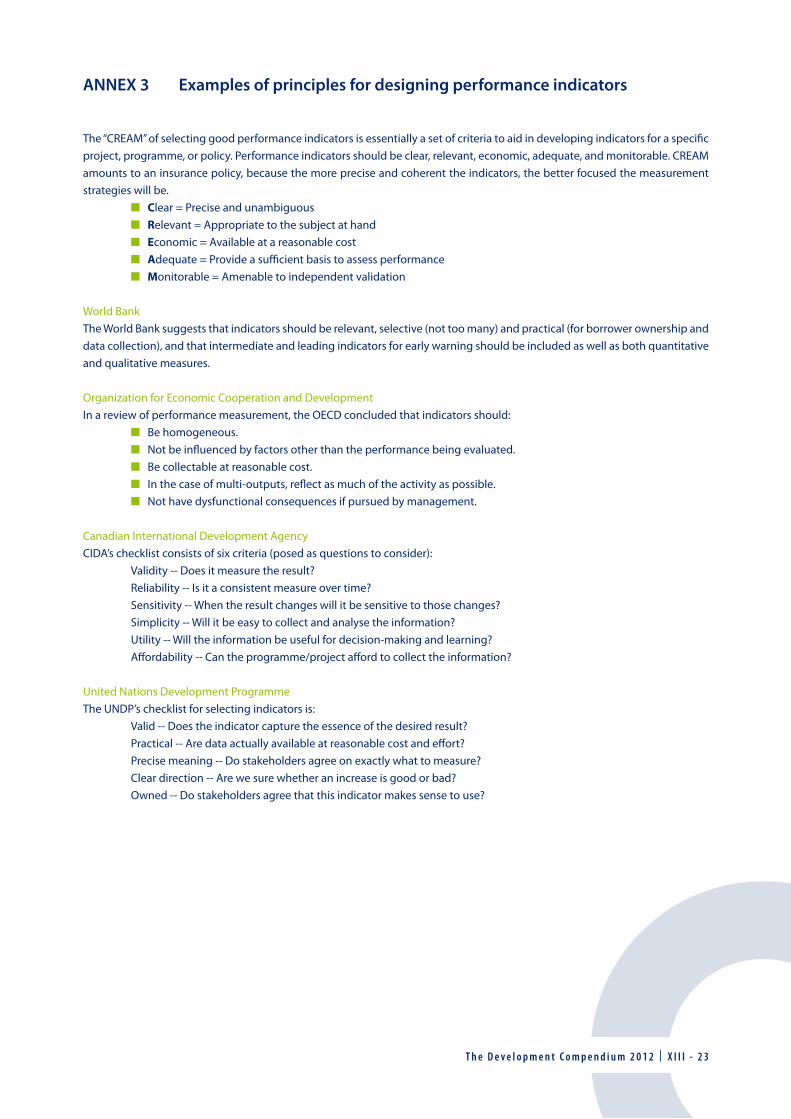
ANNEX 3 Examples of principles for designing performance indicators
The “CREAM” of selecting good performance indicators is essentially a set of criteria to aid in developing indicators for a specific
project, programme, or policy. Performance indicators should be clear, relevant, economic, adequate, and monitorable. CREAM
amounts to an insurance policy, because the more precise and coherent the indicators, the better focused the measurement
strategies will be.
■ Clear = Precise and unambiguous
■ Relevant = Appropriate to the subject at hand
■ Economic = Available at a reasonable cost
■ Adequate = Provide a sufficient basis to assess performance
■ Monitorable = Amenable to independent validation
World Bank
The World Bank suggests that indicators should be relevant, selective (not too many) and practical (for borrower ownership and
data collection), and that intermediate and leading indicators for early warning should be included as well as both quantitative
and qualitative measures.
Organization for Economic Cooperation and Development
In a review of performance measurement, the OECD concluded that indicators should:
■ Be homogeneous.
■ Not be influenced by factors other than the performance being evaluated.
■ Be collectable at reasonable cost.
■ In the case of multi-outputs, reflect as much of the activity as possible.
■ Not have dysfunctional consequences if pursued by management.
Canadian International Development Agency
CIDA’s checklist consists of six criteria (posed as questions to consider):
Validity -- Does it measure the result?
Reliability -- Is it a consistent measure over time?
Sensitivity -- When the result changes will it be sensitive to those changes?
Simplicity -- Will it be easy to collect and analyse the information?
Utility -- Will the information be useful for decision-making and learning?
Affordability -- Can the programme/project afford to collect the information?
United Nations Development Programme
The UNDP’s checklist for selecting indicators is:
Valid -- Does the indicator capture the essence of the desired result?
Practical -- Are data actually available at reasonable cost and effort?
Precise meaning -- Do stakeholders agree on exactly what to measure?
Clear direction -- Are we sure whether an increase is good or bad?
Owned -- Do stakeholders agree that this indicator makes sense to use?

2 4 - X I I I I T h e D e v e l o p m e n t C o m p e n d i u m 2 0 1 2
United States Agency International Development
USAID’s criteria for assessing performance indicators include:
Direct (valid) -- closely represents the result it is intended to measure.
Objective -- unambiguous about what is being measured; has a precise operational definition that ensures compara-
bility over time.
Practical -- data can be collected on a timely basis and at reasonable cost.
Adequate -- only the minimum number of indicators necessary to ensure that key dimensions of a result are suffi-
ciently captured.
Reliable -- data are of sufficient quality for confident decision-making.
Disaggregated where possible -- by characteristics such as sex, age, economic status and location, so that equitable
distribution of results can be assessed.
Price Waterhouse
Price Waterhouse developed criteria for good performance measures for several United States government agencies as follows:
Objective-linked – directly related to clearly stated objectives for the programme.
Responsibility-linked – matched to specific organizational units that are responsible for, and capable of, taking action
to improve performance.
Organizationally acceptable – valued by all levels in the organization, used as a management tool, and viewed as be-
ing “owned” by those accountable for performance.
Comprehensive – Inclusive of all aspects of programme performance; for example, measuring quantity but not quality
provides incentives to produce quickly, but not well.
Credible – Based on accurate and reliable data sources and methods not open to manipulation or distortion.
Cost-effective – acceptable in terms of cost to collect and process.
Compatible – integrated with existing information systems.
Comparable with other data – useful in making comparisons; for example, performance can be compared from period
to period, with peers, to targets, etc.
Easy to interpret – presented graphically and accompanied by commentary.
Information Training and Agricultural Development (United Kingdom)
ITAD developed a popular code for remembering the characteristics of good indicators, namely SMART:
■ S – Specific
■ M – Measurable
■ A – Attainable
■ R – Relevant
■ T – Trackable
Federal Customs Service of Russia
1) The real ability to perform the indicator.
2) The capability to measure the rate of delivery.
3) The values of indicators and rules for the calculation of them, must be clear to all subordinate Customs offices.
4) There must be uniform understanding of the rules of calculation and estimation in all subordinate Customs offices.
5) There must be objectivity supporting the estimations.
T h e D e v e l o p m e n t C o m p e n d i u m 2 0 1 2 I X I I I - 2 5
ANNEX 4 Service Charter Examples
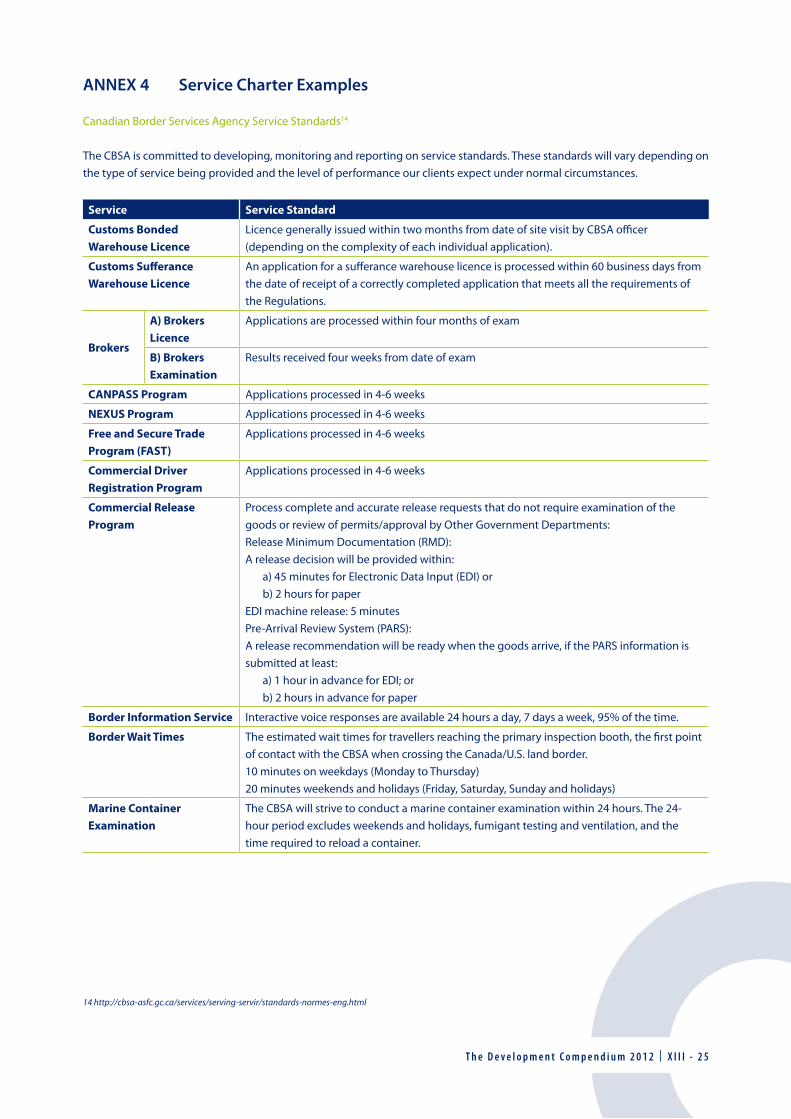
Canadian Border Services Agency Service Standards14
The CBSA is committed to developing, monitoring and reporting on service standards. These standards will vary depending on
the type of service being provided and the level of performance our clients expect under normal circumstances.
Service Service Standard
Customs Bonded
Warehouse Licence
Licence generally issued within two months from date of site visit by CBSA officer
(depending on the complexity of each individual application).
Customs Sufferance
Warehouse Licence
An application for a sufferance warehouse licence is processed within 60 business days from
the date of receipt of a correctly completed application that meets all the requirements of
the Regulations.
Brokers
A) Brokers
Licence
Applications are processed within four months of exam
B) Brokers
Examination
Results received four weeks from date of exam
CANPASS Program Applications processed in 4-6 weeks
NEXUS Program Applications processed in 4-6 weeks
Free and Secure Trade
Program (FAST)
Applications processed in 4-6 weeks
Commercial Driver
Registration Program
Applications processed in 4-6 weeks
Commercial Release
Program
Process complete and accurate release requests that do not require examination of the
goods or review of permits/approval by Other Government Departments:
Release Minimum Documentation (RMD):
A release decision will be provided within:
a) 45 minutes for Electronic Data Input (EDI) or
b) 2 hours for paper
EDI machine release: 5 minutes
Pre-Arrival Review System (PARS):
A release recommendation will be ready when the goods arrive, if the PARS information is
submitted at least:
a) 1 hour in advance for EDI; or
b) 2 hours in advance for paper
Border Information Service Interactive voice responses are available 24 hours a day, 7 days a week, 95% of the time.
Border Wait Times The estimated wait times for travellers reaching the primary inspection booth, the first point
of contact with the CBSA when crossing the Canada/U.S. land border.
10 minutes on weekdays (Monday to Thursday)
20 minutes weekends and holidays (Friday, Saturday, Sunday and holidays)
Marine Container
Examination
The CBSA will strive to conduct a marine container examination within 24 hours. The 24-
hour period excludes weekends and holidays, fumigant testing and ventilation, and the
time required to reload a container.
14 http://cbsa-asfc.gc.ca/services/serving-servir/standards-normes-eng.html
2 6 - X I I I I T h e D e v e l o p m e n t C o m p e n d i u m 2 0 1 2
Australian Customs and Border Protection Service Practice Statements15
Australian Customs has introduced a new framework to define its national policies. Practice Statements outline Customs’ policy,
while providing a greater opportunity for engagement with industry and the public. Their purpose is to ensure that Customs’
operations are transparent and consistent.
There are seven categories of Practice Statements:
■ Corporate
■Information
■Law administration
■Money, accounting and assets
■Operational procedures
■People
■Technology
Practice Statements should be read in conjunction with its “Client Service Charter and Standards”16. This brochure describes:
■ Australian Customs & Border Protection service commitment;
■Australian Customs & Border Protection expectations of commercial operators and the public;
■Specific service standards for, inter alia, –
•Contactwithofficials
•Arrivinganddepartingtravellers
•Compliancemonitoringactivity(Customspostclearanceaudit)
•Respondingtovariouscommercialapplications(e.g.tariffconcessions,advancerulings,licenses)
•Importandexportprocessingstandards;
■Availability of IT systems; and,
■Where more information can be found (including in several languages).
15 http://customs.gov.au/site/page5820.asp 16 http://customs.gov.au/webdata/resources/files/ClientServiceCharter

T h e D e v e l o p m e n t C o m p e n d i u m 2 0 1 2 I X I I I - 2 7
ANNEX 5 Bibliography
Bledsoe, K. and Graham, J., 2005, The Use of Multiple Evaluation Approaches in Program Evaluation, American Journal of Evalua-
tion, Vol. 26, No. 3, September, pp.302-319.
Bourne M., Mills J., Wilcox M., Neely A. and Platts, K., 2000, Designing, implementing and updating performance measurement systems, International Journal of Operations & Production Management, Vol. 20 No. 7, pp. 754-771.
Bourne, M., Neely, A., Mills, J. and Platts, K., 2003, Implementing performance measurement systems: a literature review, Interna-
tional Journal of Business Performance Management, Vol. 5, No. 1, pp.1-24.
Brignall, S. and Modell, S., 2000, An institutional perspective on performance measurement and management in the ‘new public sec-tor’, Management Accounting Research, 2000, 11, pp281–306.
Dahler-Larsen, P., 2001, From Programme Theory to Constructivism On Tragic, Magic and Competing Programmes, SAGE Publica-
tions, Vol. 7, No. 3, pp. 331–349.
De Toni, A. and Tonchia, S., 2001, Performance Measurement Systems: Models, Characteristics and Measures, International Journal
of Operations & Production Management, Vol. 21, No. 1-2, pp. 46-70.
Gubin, A., 2011, Developing performance measurement for the Russian Customs Service, World Customs Journal, Volume 5, Num-
ber 2, September 2011, ISSN 1834-6715
Hanberger, A., 2001, Policy and Program Evaluation, Civil Society, and Democracy, American Journal of Evaluation, Vol. 22, No. 2,
pp. 211–228.
Holloway, S. , 2010, Measuring the Effectiveness of Border Management: designing KPIs for outcomes, World Customs Journal, Vol-
ume 4, Number 2, September 2010, ISSN 1834-6707
Horton, D., Alexaki, A., Bennett-Lartey, S., Noële Brice, K., Campilan, D., Carden, F. José de Souza Silva, Le Thanh Duong, Ibrahim
Khadar, Albina Maestrey Boza, Imrul Kayes Muniruzzaman, Jocelyn Perez, Matilde Somarriba Chang, Ronnie Vernooy, and Jamie
Watts, 2003, Evaluating Capacity Development Experiences from Research and Development Organizations around the World, Inter-
national Service for National Agricultural Research, The Hague.
http://www.idrc.ca/en/ev-27701-201-1-DO_TOPIC.html
Hughes, O., 2003, Public Management and Administration: An Introduction, 3rd ed. Bassingstoke: Palgrave
Imbens, G. and Wooldridge, J., Recent Developments in the Econometrics of Program Evaluation, Journal of Economic Literature
2009, 47:1, 5–86.
Ireland, R., Cantens, T. and Yasui, T. 2011, An Overview of Performance Measurement in Customs Administrations: WCO Research Paper No. 13, WCO: Brussels
ITAD, 1996, Monitoring and the Use of Indicators: Consultancy report to DG VIII, European Commission: Brussels.
ISO, 1994, Quality Management and Quality Assurance: Vocabulary, International Standard ISO 8402, International Organization
for Standardization: Geneva.
Ittner, C. and Larcker, D, 2003, Coming Up Short on Nonfinancial Performance Measurement, Harvard Business Review, November
2003, pp. 1-8.
Ittner, C., Larcker, D. and Randall, T., 2003, Performance implications of strategic performance measurement in financial services firms, Accounting, Organizations and Society, Vol. 28, pp. 715–741.

2 8 - X I I I I T h e D e v e l o p m e n t C o m p e n d i u m 2 0 1 2
Kennerley, M. and Neely, A., 2002, A framework of the factors affecting the evolution of performance measurement systems, Inter-
national Journal of Operations & Production Management, Vol. 22 No. 11, 2002, pp. 1222-1245.
Knack, S. and Keefer, P., 1995, Institutions and economic performance: Cross country tests using alternative institutional measures,
Centre for Institutional Reform and the Informal Sector, The World Bank: Washington DC.
Kueng, P., Process performance measurement system: a tool to support process-based organizations, Total Quality Management,
Vol. 11, No. 1, 2000, pp. 67-85.
Modell, S., 2001, Performance measurement and institutional processes: a study of managerial responses to public sector reform,
Management Accounting Research, Vol 12, pp. 437–464.
Orlitzky, M., Schmidt, F., Rynes, S., 2003, Corporate Social and Financial Performance: A Meta-analysis, Organization Studies, Vol.
24, No. 3: pp.403–441.
Owen, J., 2006, Program Evaluation: Forms and Approaches, 3rd edn., The Guildford Press: New York.
Pollitt, C., 1994, The Citizen’s Charter: A Preliminary Analysis, Public Money and Management, Blackwell Publishers: Oxford
PUMA, 1994, Performance Management in Government: Performance Measurement and Results-oriented Management, OECD: Paris
Rossi, P., Lipsey, M and Freeman, H., 2004, Evaluation: A systematic approach, 7th edn, Sage Productions, Thousand Oaks: USA.
Price Waterhouse, 1993, Who Will Bell the Cat?: A Guide to Performance Measurement in Government, PriceWaterhouse: Washington,
D.C.
Royse, D., Thyer, B. and Padgett, D., 2006, Program Evaluation: An Introduction, Wadsworth: Belmont, USA.
United Kingdom Audit Commission, 2000, Aiming to improve the principles of performance measurement, ISBN 1 86240 227 2.
United Nations Development Programme, 1997, Results Oriented Monitoring and Evaluation, United Nations: New York.
United Nations Development Programme, May 1999, Selecting Key Results Indicators, United Nations: New York.
Worthen, B. (1990). Program evaluation. in H. Walberg & G. Haertel (Eds.), The international encyclopaedia of educational evalu-
ation, pp. 42-47, Pergammon Press: Toronto.
Zall-Kusek, J. and Rist, R.C., 2004, Ten steps to a results-based monitoring and evaluation system : a handbook for development practitioners, World Bank: New York.