12. the stable oxygen isotope signal in shallow …€¦ · the stable oxygen isotope signal in...
TRANSCRIPT

McKenzie, J.A., Davies, R.J., Palmer-Julson, A., et al., 1993Proceedings of the Ocean Drilling Program, Scientific Results, Vol. 133
12. THE STABLE OXYGEN ISOTOPE SIGNAL IN SHALLOW-WATER, UPPER-SLOPESEDIMENTS OFF THE GREAT BARRIER REEF (HOLE 820A)1
F.M. Peerdeman,2 PJ. Davies,3 and A.R. Chivas2
ABSTRACT
Oxygen-isotope ratio measurements are presented for the planktonic species Globigerinoides ruber collected from shallow-water, upper-slope sediments from Holes 820A and 820B in 280 m of water, on the seaward edge of the Great Barrier Reef.Correlation of the Site 820 isotope curve with deep-sea reference curves of the Pacific Ocean (Core V28-238, Hole 677A, Hole607A) permits the definition of isotope stages 1 to 19 in the top 145 m of Holes 820A and 820B. However, paleontological dataindicate that stages 4 and 7 might be missing and that two hiatuses occur at a depth of 8.05 to 12.1 and 34.55 to 35.8 mbsf. Usingdeep-sea Hole 677A as a reference for ice-volume variations, we determine the difference in isotopic signature between it andSite 820. We propose that this difference is a regional signal representing a progressive 4°C increase in surface-water temperatureat Site 820. The proposed temperature change was initiated at about 400 k.y. and corresponds to a change from high-to-lowfrequency variations in Pleistocene isotope signals. We postulate that these changes may have catalyzed the growth of the GreatBarrier Reef. The shift also coincides with changes in seismic character and some physical and chemical sediment characteristics.
INTRODUCTION
Since the innovative work of Shackleton and Opdyke (1973) andBroecker (1974), oxygen-isotope signals in deep-sea cores have beenused both to define a Pliocene-Pleistocene stratigraphy at scales ofthousands to hundreds of thousands of years and to invoke climaticand sea-level oscillations in the Quaternary and late Cenozoic (Ruddi-man et al, 1989; Shackleton and Hall, 1989). Comprehensive oxygen-isotope curves have been established for the Pliocene and Pleistocenefrom deep-sea records that indicate fluctuations in global ice volume,which are generally accepted as approximating changes in sea level(Chappell and Shackleton, 1986). Detailed spectral analyses of thesedeep-sea isotope records also indicate that the mode of isotopic changehas varied with time, such that high-frequency, low-amplitude vari-ations dominated between 2.47 and 0.735 Ma, while low-frequency,high-amplitude variations dominated since 0.735 Ma (Prell, 1982;Imbrie, 1985; Imbrie et al., 1984; Ruddiman et al., 1986, 1989; andMaasch, 1988). Invariably, most published studies have emphasizedthe completeness and the high-resolution nature of the deep-sea record.
In spite of the fact that accumulation rates on continental shelvesand slopes have the potential to produce a far higher resolution recordthan those in the deep sea, few have attempted to define a coherentisotope signal from such environments. The conventional argumentsagainst the utility of such environments are that (1) the sedimentationrates vary substantially between intervals of high and low sea level;(2) hiatuses are common, and (3) bioturbation may destroy or down-grade any potential signals. Here, we examine such suggestions bydefining an isotope signal for the late Quaternary, the resolution ofwhich is equal to or greater than that found in deep-sea signals. Thesedata were obtained from Holes 820A and 820B in 280 m of water onthe upper slope of the Great Barrier Reef (Fig.l).
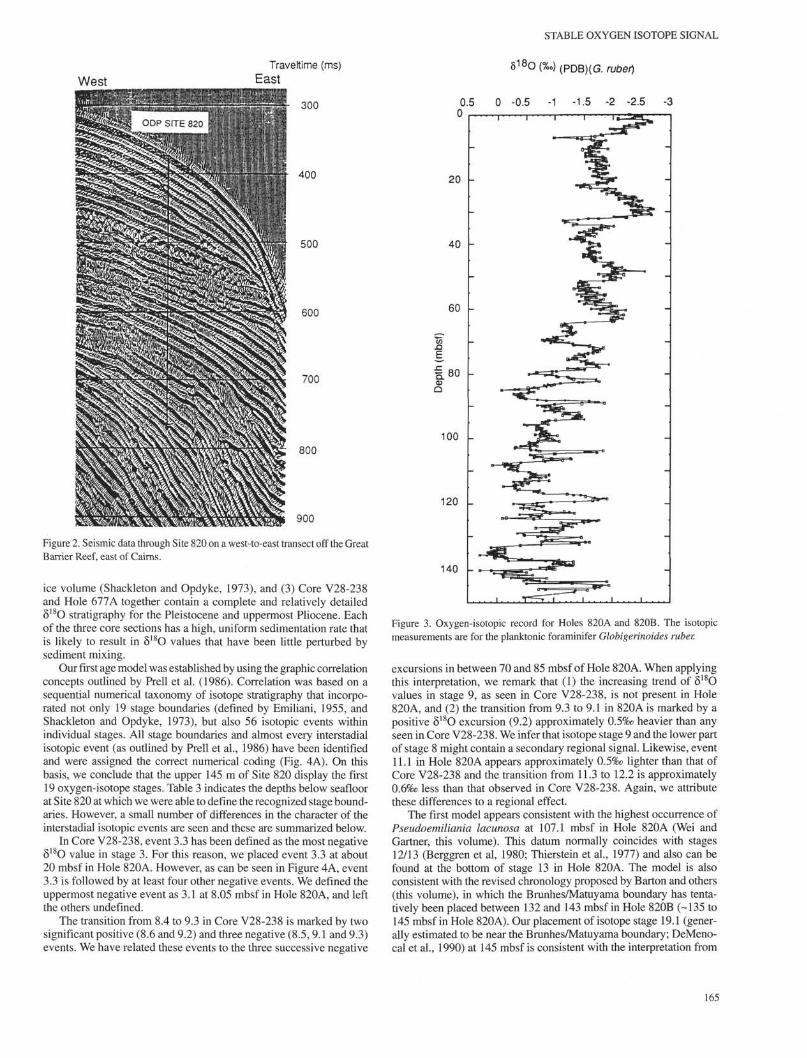
Earlier studies in the region defined the seismic structure of thecontinental slope in front of the outer reefs of the Great Barrier Reef(Davies et al., 1988,1989; Feary et al., 1990). Part of the seismic dataset on which the drilling was based is presented in Figure 2, which
1 McKenzie, J.A., Davies, PJ., Palmer-Julson, A., et al, 1993. Proc. ODP, Sci. Results,133: College Station, TX (Ocean Drilling Program).
2 Research School of Earth Sciences, The Australian National University, CanberraACT 0200, Australia.
3 Department of Geology and Geophysics, University of Sydney, Sydney NSW 2006,Australia.
shows a west-to-east line, for which our pre-drilling scenario empha-sized (1) an extremely high-resolution section in the top 80 m (ap-proximately 500 ms), thought to represent the late Pleistocene; (2) alarge-scale change in geometry from prograding to aggrading (ap-proximately 560 ms), thought to relate to global climate changesaround the Brunhes/Matuyama boundary; and (3) a seismic characterfor the aggrading section that suggested cyclic lithologic changes tiedto sea level and climatic oscillations (Harris et al., 1990).
Lithologic analyses performed on board the JO1DES Resolutiontogether with determinations of CaCO3 variations, whole-core mag-netic susceptibility, and physical property measurements combinedwith paleontological age determinations substantiate these conclu-sions and underlie our rationale for sampling Holes 820A and 820Bat closely spaced intervals. This rationale emphasizes the establish-ment and use of a high-resolution, stable oxygen-isotope signal inreference to a deep-sea isotope record to relate lithological, sedimen-tological, and large-scale seismic geometric changes on the slope ofthe Great Barrier Reef to fluctuations in glacio-eustatic sea level andpaleoclimatic changes. Site 820 was drilled to a depth of 400 m andbottomed at an age of less than 1.4 Ma. Therefore, it represents anextremely high-resolution section for the middle and late Pleistocene.
METHODS
Sampling densities throughout Holes 820A and 820B were typi-cally one sample every 20 cm, with the exception of the section from130.75 to 121.5 mbsf in Hole 820A, in which a poorly sorted bioclas-tic wackestone to floatstone, underlain by an unconsolidated clayeywackestone, did not allow for regular sampling intervals.
From each sample, 10 specimens of Globigerinoides ruber werecarefully hand-picked from the 250- to 350-µm fraction. Each set offoraminifers was cleaned in Milli-Q(TM) ultra-pure H2O by using anultrasonic bath for approximately 1 min to remove fine-fraction con-tamination. The water was then siphoned off with a pipette, and theforaminifers rinsed over a 125-µm nylon mesh, again with Milli-Qwater. After inspecting the foraminifers for internal contamination intranslucent light, we analyzed stable oxygen isotopes of the calciticforaminifers at the stable-isotope laboratory of the Research School ofEarth Sciences of the Australian National University. For this, we usedan automated "acid-on-individual carbonate" (or Kiel) preparationdevice attached to a Finnigan MAT 251 mass-spectrometer. Analysesare expressed as per mil deviation (δ) from the PDB standard (Epsteinet al., 1953).
163
RM. PEERDEMAN, PJ. DAVIES, A.R. CHIVAS
15°S -
• Reef811/825
\<f rCoringa
(BankFlinders
145°E 150°
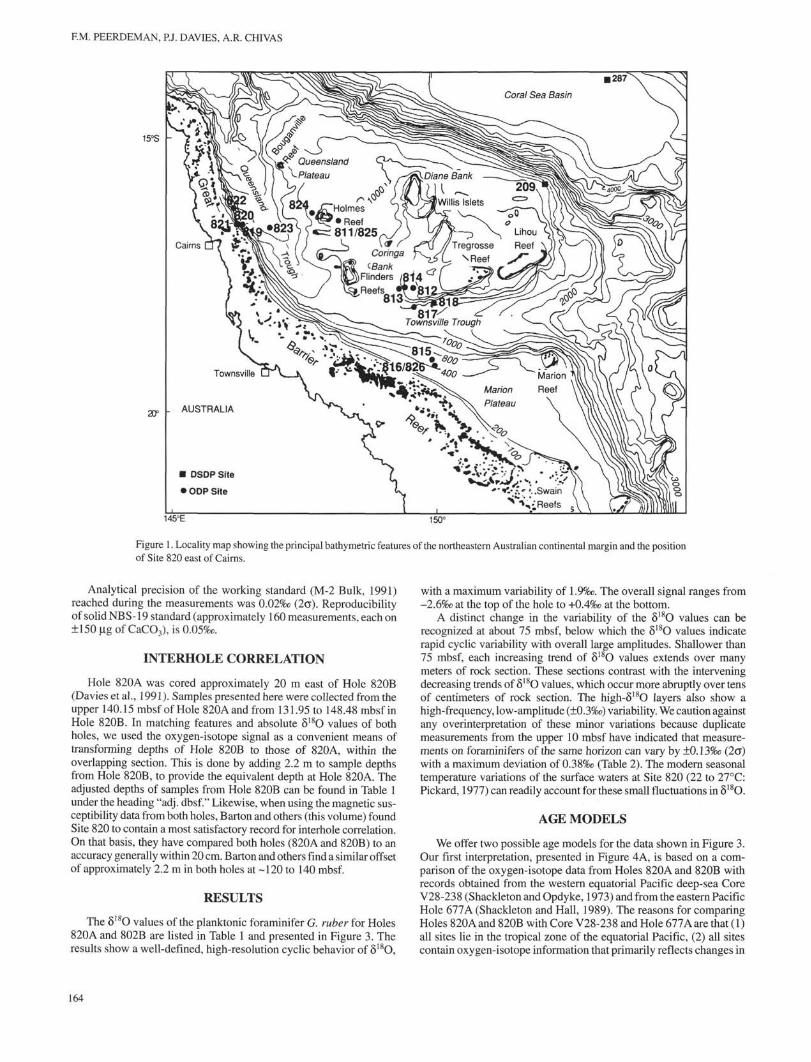
Figure 1. Locality map showing the principal bathymetric features of the northeastern Australian continental margin and the positionof Site 820 east of Cairns.
Analytical precision of the working standard (M-2 Bulk, 1991)reached during the measurements was 0.02%e (2σ). Reproducibilityof solid NBS-19 standard (approximately 160 measurements, each on±150 µg of CaCO3), is 0.05‰.
INTERHOLE CORRELATION
Hole 820A was cored approximately 20 m east of Hole 820B(Davies et al., 1991). Samples presented here were collected from theupper 140.15 mbsf of Hole 820Aand from 131.95 to 148.48 mbsf inHole 820B. In matching features and absolute δ 1 8 θ values of bothholes, we used the oxygen-isotope signal as a convenient means oftransforming depths of Hole 820B to those of 820A, within theoverlapping section. This is done by adding 2.2 m to sample depthsfrom Hole 820B, to provide the equivalent depth at Hole 820A. Theadjusted depths of samples from Hole 820B can be found in Table 1under the heading "adj. dbsf." Likewise, when using the magnetic sus-ceptibility data from both holes, Barton and others (this volume) foundSite 820 to contain a most satisfactory record for interhole correlation.On that basis, they have compared both holes (820A and 820B) to anaccuracy generally within 20 cm. Barton and others find a similar offsetof approximately 2.2 m in both holes at -120 to 140 mbsf.
RESULTS
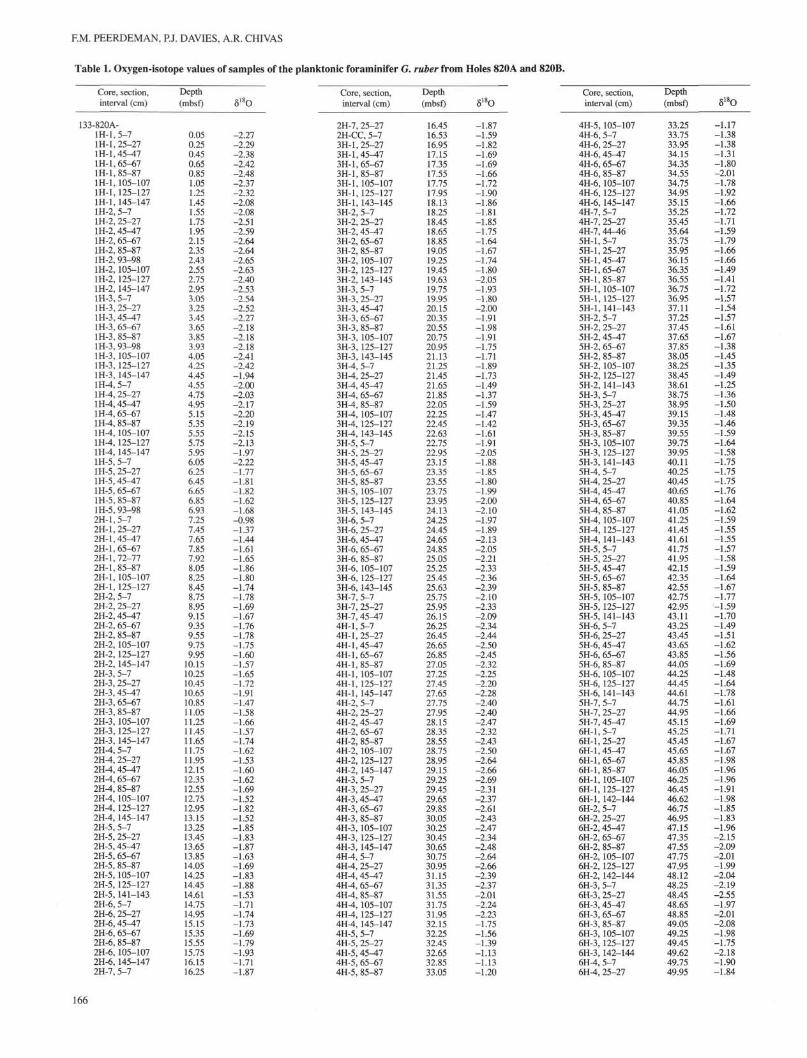
The δ 1 8 θ values of the planktonic foraminifer G. ruber for Holes820A and 802B are listed in Table 1 and presented in Figure 3. Theresults show a well-defined, high-resolution cyclic behavior of δ 1 8 θ,
with a maximum variability of 1.9‰. The overall signal ranges from-2.6‰ at the top of the hole to +0.4‰ at the bottom.
A distinct change in the variability of the δ I 8O values can berecognized at about 75 mbsf, below which the δ 1 8 θ values indicaterapid cyclic variability with overall large amplitudes. Shallower than75 mbsf, each increasing trend of δ 1 8 θ values extends over manymeters of rock section. These sections contrast with the interveningdecreasing trends of δ 1 8 θ values, which occur more abruptly over tensof centimeters of rock section. The high-δ18θ layers also show ahigh-frequency, low-amplitude (±0.3‰) variability. We caution againstany overinterpretation of these minor variations because duplicatemeasurements from the upper 10 mbsf have indicated that measure-ments on foraminifers of the same horizon can vary by ±0.13‰ (2σ)with a maximum deviation of O.38‰ (Table 2). The modern seasonaltemperature variations of the surface waters at Site 820 (22 to 27°C:Pickard, 1977) can readily account for these small fluctuations in δ 1 8 θ.
AGE MODELS
We offer two possible age models for the data shown in Figure 3.Our first interpretation, presented in Figure 4A, is based on a com-parison of the oxygen-isotope data from Holes 820A and 820B withrecords obtained from the western equatorial Pacific deep-sea CoreV28-238 (Shackleton and Opdyke, 1973) and from the eastern PacificHole 677A (Shackleton and Hall, 1989). The reasons for comparingHoles 820A and 820B with Core V28-238 and Hole 677A are that (1)all sites lie in the tropical zone of the equatorial Pacific, (2) all sitescontain oxygen-isotope information that primarily reflects changes in
164
Traveltime (ms)
West East
300
400
500
600
700
800
900
Figure 2. Seismic data through Site 820 on a west-to-east transect off the GreatBarrier Reef, east of Cairns.
ice volume (Shackleton and Opdyke, 1973), and (3) Core V28-238and Hole 677A together contain a complete and relatively detailedδ 1 8 θ stratigraphy for the Pleistocene and uppermost Pliocene. Eachof the three core sections has a high, uniform sedimentation rate thatis likely to result in δ 1 8 θ values that have been little perturbed bysediment mixing.
Our first age model was established by using the graphic correlationconcepts outlined by Prell et al. (1986). Correlation was based on asequential numerical taxonomy of isotope stratigraphy that incorpo-rated not only 19 stage boundaries (defined by Emiliani, 1955, andShackleton and Opdyke, 1973), but also 56 isotopic events withinindividual stages. All stage boundaries and almost every interstadialisotopic event (as outlined by Prell et al., 1986) have been identifiedand were assigned the correct numerical coding (Fig. 4A). On thisbasis, we conclude that the upper 145 m of Site 820 display the first
19 oxygen-isotope stages. Table 3 indicates the depths below seafloorat Site 820 at which we were able to define the recognized stage bound-aries. However, a small number of differences in the character of theinterstadial isotopic events are seen and these are summarized below.
In Core V28-238, event 3.3 has been defined as the most negativeδ 1 8 θ value in stage 3. For this reason, we placed event 3.3 at about20 mbsf in Hole 820A. However, as can be seen in Figure 4A, event3.3 is followed by at least four other negative events. We defined theuppermost negative event as 3.1 at 8.05 mbsf in Hole 820A, and leftthe others undefined.
The transition from 8.4 to 9.3 in Core V28-238 is marked by twosignificant positive (8.6 and 9.2) and three negative (8.5, 9.1 and 9.3)events. We have related these events to the three successive negative
STABLE OXYGEN ISOTOPE SIGNAL
δ 1 8 O ( % o ) ( P D B ) ( G . rubet)
0.5 0 -0.5 -1 -1.5 -2 -2.5 -3
140 -
Figure 3. Oxygen-isotopic record for Holes 820A and 820B. The isotopicmeasurements are for the planktonic foraminifer Globigerinoides ruber.
excursions in between 70 and 85 mbsf of Hole 820A. When applyingthis interpretation, we remark that (1) the increasing trend of δ*18Ovalues in stage 9, as seen in Core V28-238, is not present in Hole820A, and (2) the transition from 9.3 to 9.1 in 820A is marked by apositive δ 1 8 θ excursion (9.2) approximately 0.5‰ heavier than anyseen in Core V28-238. We infer that isotope stage 9 and the lower partof stage 8 might contain a secondary regional signal. Likewise, event11.1 in Hole 820A appears approximately 0.5‰ lighter than that ofCore V28-238 and the transition from 11.3 to 12.2 is approximately0.6‰ less than that observed in Core V28-238. Again, we attributethese differences to a regional effect.
The first model appears consistent with the highest occurrence ofPseudoemiliania lacunosa at 107.1 mbsf in Hole 820A (Wei andGartner, this volume). This datum normally coincides with stages12/13 (Berggren et al, 1980; Thierstein et al., 1977) and also can befound at the bottom of stage 13 in Hole 820A. The model is alsoconsistent with the revised chronology proposed by Barton and others(this volume), in which the Brunhes/Matuyama boundary has tenta-tively been placed between 132 and 143 mbsf in Hole 820B (-135 to145 mbsf in Hole 820A). Our placement of isotope stage 19.1 (gener-ally estimated to be near the Brunhes/Matuyama boundary; DeMeno-cal et al., 1990) at 145 mbsf is consistent with the interpretation from
165
EM. PEERDEMAN, PJ. DAVIES, A.R. CHIVAS
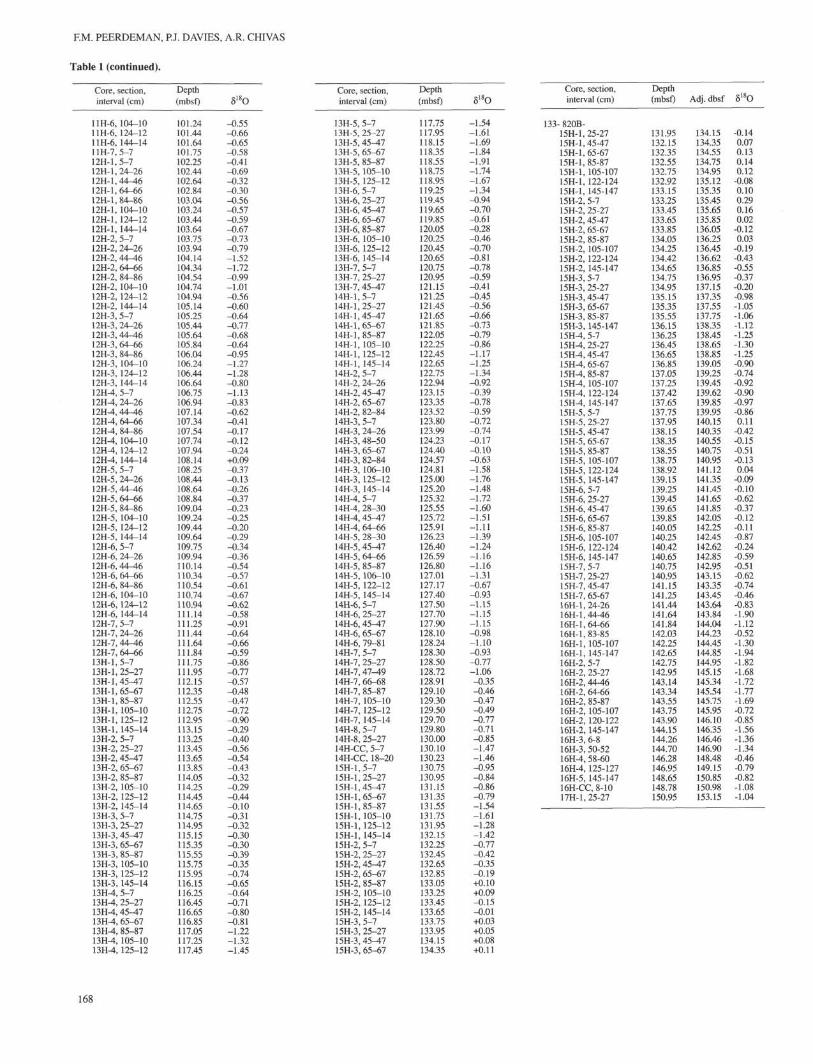
Table 1. Oxygen-isotope values of samples of the planktonic foraminifer G. ruber from Holes 820A and 820B.
Core, section,interval (cm)
133-820A-1H-1H-1H-1H-1H-1H-1H-1H-
,5-7,25-27,45^7,65-67,85-87, 105-107, 125-127, 145-147
1H-2, 5-71H-2, 25-271H-2,45-471H-2, 65-671H-2, 85-871H-2, 93-981H-2, 105-1071H-2, 125-1271H-2, 145-1471H-3, 5-71H-3, 25-271H-3,45^71H-3, 65-671H-3, 85-871H-3, 93-981H-3, 105-1071H-3, 125-1271H-3, 145-1471H-4, 5-71H-4, 25-271H-4, 45^71H-4, 65-671H-4, 85-871H-4,105-1071H-4,125-1271H-4,145-1471H-5, 5-71H-5, 25-271H-5,45-171H-5, 65-671H-5, 85-871H-5, 93-982H-1,5-72H-1, 25-272H-1,45^72H-1, 65-672H-1, 72-772H-1, 85-872H-1, 105-1072H-1, 125-1272H-2, 5-72H-2, 25-272H-2, 45-472H-2, 65-672H-2, 85-872H-2, 105-1072H-2, 125-1272H-2,145-1472H-3, 5-72H-3, 25-272H-3,45-472H-3, 65-672H-3, 85-872H-3, 105-1072H-3, 125-1272H-3, 145-1472H-4, 5-72H-4, 25-272H-4,45^72H-4, 65-672H-4, 85-872H-4, 105-1072H-4, 125-1272H-4, 145-1472H-5, 5-72H-5, 25-272H-5,45^72H-5, 65-672H-5, 85-872H-5,105-1072H-5,125-1272H-5,141-1432H-6, 5-72H-6, 25-272H-6,45-472H-6, 65-672H-6, 85-872H-6, 105-1072H-6, 145-1472H-'',5-7
Depth
(mbsf)
0.050.250.450.650.851.051.251.451.551.751.952.152.352.432.552.752.953.053.253.453.653.853.934.054.254.454.554.754.955.155.355.555.755.956.056.256.456.656.856.937.257.457.657.857.928.058.258.458.758.959.159.359.559.759.95
10.1510.2510.4510.6510.8511.0511.2511.4511.6511.7511.9512.1512.3512.5512.7512.9513.1513.2513.4513.6513.8514.0514.2514.4514.6114.7514.9515.1515.3515.5515.7516.1516.25
δ 1 8 θ
-2.27-2.29-2.38-2.42-2.48-2.37-2.32-2.08-2.08-2.51-2.59-2.64-2.64-2.65-2.63-2.40-2.53-2.54-2.52-2.27-2.18-2.18-2.18-2.41-2.42-1.94-2.00-2.03-2.17-2.20-2.19-2.15-2.13-1.97-2.22-1.77-1.81-1.82-1.62-1.68-0.98-1.37-1.44-1.61-1.65-1.86-1.80-1.74-1.78-1.69-1.67-1.76-1.78-1.75-1.60-1.57-1.65-1.72-1.91-1.47-1.58-1.66-1.57-1.74-1.62-1.53-1.60-
__-
_
.62
.69
.52
.821.52.85.83.87.63.69.83.88.53
-1.71-1.74-1.73-1.69-1.79-1.93-1.71_ .87
Core, section,interval (cm)
2H-7, 25-272H-CC, 5-73H-1, 25-273H-1,45^*73H-1,65-673H-1,85-873H-1, 105-1073H-1, 125-1273H-1, 143-1453H-2, 5-73H-2, 25-273H-2, 4 5 ^ 73H-2, 65-673H-2, 85-873H-2, 105-1073H-2, 125-1273H-2, 143-1453H-3, 5-73H-3, 25-273H-3,45-473H-3, 65-673H-3, 85-873H-3, 105-1073H-3, 125-1273H-3, 143-1453H-4, 5-73H-4, 25-273H-4, 45-473H-4, 65-673H-4, 85-873H-4, 105-1073H-4, 125-1273H-4, 143-1453H-5, 5-73H-5, 25-273H-5,45-473H-5, 65-673H-5, 85-873H-5, 105-1073H-5, 125-1273H-5, 143-1453H-6, 5-73H-6, 25-273H-6, 4 5 ^ 73H-6, 65-673H-6, 85-873H-6, 105-1073H-6, 125-1273H-6, 143-1453H-7, 5-73H-7, 25-273H-7, 4 5 ^ 74H-4H-4H-4H-4H-4H-4H-4H-
,5-7I, 25-27,45^7,65-67, 85-87,105-107, 125-127,145-147
4H-2, 5-74H-2, 25-274H-2,45^74H-2, 65-674H-2, 85-874H-2, 105-1074H-2, 125-1274H-2, 145-1474H-3, 5-74H-3, 25-274H-3, 4 5 ^ 74H-3, 65-674H-3, 85-874H-3, 105-1074H-3, 125-1274H-3, 145-1474H-4, 5-74H-4, 25-274H-4,45-t74H-4, 65-674H-4, 85-874H-4, 105-1074H-4, 125-1274H-4,145-1474H-5, 5-74H-5, 25-274H-5,45^74H-5, 65-674U-ij , 85-87
Depth
(mbsf)
16.4516.5316.9517.1517.3517.5517.7517.9518.1318.2518.4518.6518.8519.0519.2519.4519.6319.7519.9520.1520.3520.5520.7520.9521.1321.2521.4521.6521.8522.0522.2522.4522.6322.7522.9523.1523.3523.5523.7523.9524.1324.2524.4524.6524.8525.0525.2525.4525.6325.7525.9526.1526.2526.4526.6526.8527.0527.2527.4527.6527.7527.9528.1528.3528.5528.7528.9529.1529.2529.4529.6529.8530.0530.2530.4530.6530.7530.9531.1531.3531.5531.7531.9532.1532.2532.4532.6532.8533.05
δ 1 8 θ
-1.87-1.59-1.82-1.69-1.69-1.66-1.72-1.90-1.86-1.81-1.85-1.75-1.64-1.67-1.74-1.80-2.05-1.93-1.80-2.00-1.91-1.98-1.91-1.75-1.71-1.89-1.73-1.49-1.37-1.59-1.47-1.42-1.61-1.91-2.05-1.88-1.85-1.80-1.99-2.00-2.10-1.97-1.89-2.13-2.05-2.21-2.33-2.36-2.39-2.10-2.33-2.09-2.34-2.44-2.50-2.45-2.32-2.25-2.20-2.28-2.40-2.40-2.47-2.32-2.43-2.50-2.64-2.66-2.69-2.31-2.37-2.61-2.43-2.47-2.34-2.48-2.64-2.66-2.39-2.37-2.01-2.24-2.23-1.75-1.56-1.39-1.13-1.13-1.20
Core, section,interval (cm)
4H-5, 105-1074H-6, 5-74H-6, 25-274H-6,45^74H-6, 65-674H-6, 85-874H-6, 105-1074H-6, 125-1274H-6, 145-1474H-7, 5-74H-7, 25-274H-7, 44-465H-1, 5-75H-1,25-275H-1,45^75H-1, 65-675H-1, 85-875H-1, 105-1075H-1, 125-1275H-1, 141-1435H-2, 5-75H-2, 25-275H-2, 45-475H-2, 65-675H-2, 85-875H-2, 105-1075H-2, 125-1275H-2, 141-1435H-3, 5-75H-3, 25-275H-3, 45^175H-3, 65-675H-3, 85-875H-3, 105-1075H-3, 125-1275H-3, 141-1435H-4, 5-75H-4, 25-275H-4,45^75H-4, 65-675H-4, 85-875H-4, 105-1075H-4, 125-1275H-4, 141-1435H-5, 5-75H-5, 25-275H-5, 45^75H-5, 65-675H-5, 85-875H-5, 105-1075H-5, 125-1275H-5, 141-1435H-6, 5-75H-6, 25-275H-6, 45^75H-6, 65-675H-6, 85-875H-6, 105-1075H-6, 125-1275H-6, 141-1435H-7, 5-75H-7, 25-275H-7,45-176H-6H-6H-6H-6H-6H-6H-6H-
1,5-7I, 25-271, 45^7,65-67, 85-87, 105-107, 125-127, 142-144
6H-2, 5-76H-2, 25-276H-2,45-476H-2, 65-676H-2, 85-876H-2, 105-1076H-2, 125-1276H-2, 142-1446H-3, 5-76H-3, 25-276H-3,45^76H-3, 65-676H-3, 85-876H-3, 105-1076H-3, 125-1276H-3, 142-1446H-4, 5-76H-4, 25-27
Depth(mbsf)
33.2533.7533.9534.1534.3534.5534.7534.9535.1535.2535.4535.6435.7535.9536.1536.3536.5536.7536.9537.1137.2537.4537.6537.8538.0538.2538.4538.6138.7538.9539.1539.3539.5539.7539.9540.1140.2540.4540.6540.8541.0541.2541.4541.6141.7541.9542.1542.3542.5542.7542.9543.1143.2543.4543.6543.8544.0544.2544.4544.6144.7544.9545.1545.2545.4545.6545.8546.0546.2546.4546.6246.7546.9547.1547.3547.5547.7547.9548.1248.2548.4548.6548.8549.0549.2549.4549.6249.7549.95
δ 1 8 o
-1.17-1.38-1.38-1.31-1.80-2.01-1.78-1.92-1.66-1.72-1.71-1.59-1.79-1.66-1.66-1.49-1.41-1.72-1.57-1.54-1.57-1.61-1.67-1.38-1.45-1.35-1.49-1.25-1.36-1.50-1.48-1.46-1.59-1.64-1.58-1.75-1.75-1.75-1.76
-:
.64
.62
.59
.551.55L.571.58.59
-1.64-1.67-1.77-1.59-1.70-1.49-1.51-1.62-1.56-1.69-1.48-1.64-1.78-1.61-1.66-1.69-1.71-1.67-1.67-1.98-1.96-1.96-1.91-1.98-1.85-1.83-1.96-2.15-2.09-2.01-1.99-2.04-2.19-2.55-1.97-2.01-2.08-1.98-1.75-2.18-1.90- .84
166
STABLE OXYGEN ISOTOPE SIGNAL
Table 1 (continued).
Core, section,interval (cm)
6H-4,45^176H-4, 65-676H-4, 85-876H-4, 105-1076H-4,125-1276H-4,142-1446H-5, 5-76H-5, 25-276H-5,45^76H-5, 65-676H-5, 85-876H-5, 105-1076H-5, 125-1276H-5, 142-1446H-6, 5-76H-6, 25-276H-6,45^76H-6, 65-676H-6, 85-876H-6,105-1076H-6, 125-1276H-6,142-1446H-7, 5-76H-7, 25-276H-7,45^77H-l,5-77H-1, 25-277H-1, 4 5 ^ 77H-1,65-677H-1, 85-877H-1,105-1077H-1,125-1277H-1, 145-1477H-2, 5-77H-2, 25-277H-2, 45-477H-2, 65-677H-2, 85-877H-2, 105-1077H-2, 125-1277H-2, 145-1477H-3, 5-77H-3, 25-277H-3,45^77H-3, 65-677H-3, 85-877H-3,105-1077H-3,125-1277H-3,145-1477H-4, 5-77H-4, 25-277H-4,45^177H-4, 65-677H-4, 85-877H-4,105-1077H-4, 125-1277H-4, 145-1477H-5, 5-77H-5, 25-277H-5, 4 5 ^ 77H-5, 65-677H-5, 85-877H-5,105-1077H-6, 5-77H-6, 25-277H-6,45^77H-6, 65-677H-6, 85-877H-6,105-1077H-6,125-1277H-7, 5-78H-1, 5-78H-1,25-278H-1,45^78H-1,65-678H-1,85-878H-1,105-1078H-1,125-1278H-1,145-1478H-2, 5-78H-2, 25-278H-2,45^t78H-2, 65-678H-2, 85-878H-2,105-1078H-2,125-1278H-2,145-1478H-3, 5-78H-3, 25-27
Depth
(mbsf)
50.1550.3550.5550.7550.9551.1251.2551.4551.6551.8552.0552.2552.4552.6252.7552.9553.1553.3553.5553.7553.9554.1254.2554.4554.6554.7554.9555.1555.3555.5555.7555.9556.1556.2556.4556.6556.8557.0557.2557.4557.6557.7557.9558.1558.3558.5558.7558.9559.1559.2559.4559.6559.8560.0560.2560.4560.6560.7560.9561.1561.3561.5561.7562.2562.4562.6562.8563.0563.2563.4563.7564.2564.4564.6564.8565.0565.2565.4565.6565.7565.9566.1566.3566.5566.7566.9567.1567.2567.45
δ 1 8 θ
-1.96-2.05-2.14-1.94-1.93-2.00-2.05-1.83-1.44-1.54-1.39-1.48-1.46-1.49-1.57-1.47-1.39-1.40-1.77-1.32-1.33-1.61-1.52-1.41
.55
.63
.741.53L.53.37.86.86
-1.45-1.68-1.71-1.54-1.52-1.84-1.77-1.59-1.41-1.78-1.68-1.95-1.54-1.50-1.71-1.69-2.05-1.99-1.89-1.83-1.98-1.63-1.77-2.22-2.06-1.96-2.05-2.08-2.04-1.77-2.18-2.08-2.01-1.98-2.07-2.17-1.95-2.02-2.00-1.52
-
-
.17
.21
.11
.16
.11
.28
.22
.28
.26
.26
.26
.27
.13
.23L.36[.33
-1.25
Core, section,interval (cm)
8H-3,45^78H-3, 65-678H-3, 85-878H-3, 105-1078H-3, 125-1278H-3, 145-1478H-4, 5-78H-4, 25-278H-4, 4 5 ^ 78H-4, 65-678H-4, 85-878H-4, 105-1078H-4, 125-1278H-4, 145-1478H-5, 5-78H-5, 25-278H-5,45-478H-5, 65-678H-5, 85-878H-5, 105-1078H-5, 125-1278H-6, 5-78H-6, 25-278H-6, 4 5 ^ 78H-6, 65-678H-6, 85-878H-6, 105-1078H-6, 125-1278H-6, 145-1478H-7, 5-78H-7, 25-278H-7,45-478H-7, 65-679H-1, 5-79H-1, 25-279H-1, 45-479H-1,65-679H-1, 85-879H-1, 105-1079H-1, 125-1279H-1, 145-1479H-2, 5-79H-2, 25-279H-2,45-479H-2, 65-679H-2, 85-S79H-2, 105-1079H-2, 125-1279H-2, 145-1479H-3, 5-79H-3, 25-279H-3, 4 5 ^ 79H-3, 65-679H-3, 85-879H-3,105-1079H-3, 125-1279H-3, 145-1479H-4, 5-79H-4, 25-279H-4,45^79H-4, 65-679H-4, 85-879H-4, 105-1079H-4, 125-1279H-5, 5-79H-5, 25-279H-5,45-479H-5, 65-679H-5, 85-879H-5, 105-1079H-5, 125-1279H-6, 5-79H-6, 25-279H-6,45^79H-6, 65-679H-6, 85-879H-6,105-1079H-6, 125-1279H-6, 145-1479H-7, 5-79H-7, 25-279H-7,45-4710H-1, 5-710H-1, 24-2610H-1,44-4610H-1, 64-6610H-1, 85-8710H-1, 105-1010H-1, 125-12
Depth
(mbsf)
67.6567.8568.0568.2568.4568.6568.7568.9569.1569.3569.5569.7569.9570.1570.2570.4570.6570.8571.0571.2571.4571.7571.9572.1572.3572.5572.7572.9573.1573.2573.4573.6573.8573.7573.9574.1574.3574.5574.7574.9575.1575.2575.4575.6575.8576.0576.2576.4576.6576.7576.9577.1577.3577.5577.7577.9578.1578.2578.4578.6578.8579.0579.2579.4579.7579.9580.1580.3580.5580.7580.9581.2581.4581.6581.8582.0582.2582.4582.6582.7582.9583.1583.2583.4483.6483.8484.0584.2584.45
δ 1 8 o
-1.29-1.30-1.30-1.21-1.03-0.96-1.00-1.04-0.86-0.78-1.13-0.81-1.01-0.99-1.24-0.92-1.31-1.31-1.61-1.33-1.59-1.66-1.83-1.83-1.78-1.66-1.69-1.76-1.72-1.66-1.67-1.57-1.57-1.51-1.42-1.51-1.34-1.50-1.51-1.37-1.31-1.39-1.22-1.23-1.56-1.51-1.45-1.66-1.53-1.55-1.93-1.53-1.74-1.70-1.72-1.77-1.39-1.21-1.38-1.51-1.51-1.03-0.96-0.68-0.68-0.55-0.95-0.84-1.03-1.05-1.22-1.24-1.29-1.33-1.72-1.71-1.76-1.63-1.49-1.42-1.09-0.99-0.88-0.94-0.81-0.86-0.63-0.54-0.71
Core, section,interval (cm)
10H-1,145-1410H-2, 5-710H-2, 24-2610H-2,44-4610H-2, 64-6610H-2, 85-8710H-2,105-1010H-2,125-1210H-2,145-1410H-3, 5-710H-3, 24-2610H-3,44-4610H-3, 64-6610H-3, 85-8710H-3, 105-1010H-3, 125-1210H-3, 145-1410H4, 5-710H4, 24-2610H4,44-4610H4, 64-6610H4, 85-8710H4, 105-1010H4, 125-1210H4, 145-1410H-5, 5-710H-5, 24-2610H-5,44-4610H-5, 64-6610H-5, 85-8710H-5, 105-1010H-5, 125-1210H-6, 5-710H-6, 24-2610H-6, 44-4610H-6, 64-6610H-6, 85-8710H-6,105-1010H-6, 125-1210H-6, 145-1410H-7, 5-710H-7, 24-2610H-7,44-4610H-7, 64-66HH-1,5-711H-1, 24-26HH-1, 44-4611H-1, 64-6611H-1, 84-8611H-1, 104-1011H-1, 124-1211H-1, 144-1411H-2, 5-711H-2, 24-2611H-2,44-4611H-2, 64-6611H-2, 84-8611H-2, 104-1011H-2, 124-1211H-2, 144-14HH-3,5-711H-3, 24-2611H-3,44-4611H-3, 64-6611H-3, 84-8611H-3, 104-1011H-3, 124-1211H-3, 144-1411H4, 5-711H-4, 24-26HH-4,44-4611H4, 64-6611H4, 84-8611H4, 104-1011H-4,124-1211H4, 144-14HH-5,5-711H-5, 24-2611H-5,44-4611H-5, 64-6611H-5, 84-8611H-5,104-1011H-5, 124-1211H-5, 144-14HH-6,5-711H-6, 24-2611H-6,44-4611H-6, 64-6611H-6, 84-86
Depth
(mbsf)
84.6584.7584.9485.1485.3485.5585.7585.9586.1586.2586.4486.6486.8487.0587.2587.4587.6587.7587.9488.1488.3488.5588.7588.9589.1589.2589.4489.6489.8490.0590.2590.4590.7590.9491.1491.3491.5591.7591.9592.1592.2592.4492.6492.8492.7592.9493.1493.3493.5493.7493.9494.1494.2594.4494.6494.8495.0495.2495.4495.6495.7595.9496.1496.3496.5496.7496.9497.1497.2597.4497.6497.8498.0498.2498.4498.6498.7598.9499.1499.3499.5499.7499.94100.14100.25100.44100.64100.84101.04
δ 1 8 θ
-0.30-0.38-0.08-0.55-0.56-0.64-0.54-0.40-0.28-0.38-0.43-0.33-0.47-0.35-0.40-0.45-0.50-0.48-0.69-0.84-1.17-1.59-1.74-1.70-1.85-1.47-0.99-0.69-0.91-0.78-0.83-1.11-0.92-1.14-0.96-0.82-1.08-0.98-1.42-1.16-1.22-1.26-1.33-1.37-1.13-1.42-1.47-1.34-1.32-1.42-1.30-1.51-1.01-0.89-0.83-0.87-0.78-0.83-0.89-0.46-0.51-0.70-0.72-0.69-0.67-0.78-0.73-0.77-0.77-0.67-0.86-0.76-0.78-0.86-0.90-0.75-0.82-0.65-1.05-0.74-0.89-0.92-0.96-0.86-0.85-0.71-1.00-1.07-0.69
167
RM. PEERDEMAN, PJ. DAVIES, A.R. CHIVAS
Table 1 (continued).
Core, section,interval (cm)
11H-6, 104-1011H-6, 124-12HH-6, 144-1411H-7, 5-712H-1,5-712H-1,24-2612H-1,44-^612H-1,64-6612H-1, 84-8612H-1, 104-1012H-1, 124-1212H-1, 144-1412H-2, 5-712H-2, 24-2612H-2, 44-4612H-2, 64-6612H-2, 84-8612H-2, 104-1012H-2, 124-1212H-2, 144-1412H-3, 5-712H-3, 24-2612H-3, 44-4612H-3, 64-6612H-3, 84-8612H-3, 104-1012H-3, 124-1212H-3, 144-1412H-4, 5-712H-4, 24-2612H-4, 44-4612H-4, 64-6612H-4, 84-8612H-4, 104-1012H-4, 124-1212H-4, 144-1412H-5, 5-712H-5, 24-2612H-5, 44-4612H-5, 64-6612H-5, 84-8612H-5, 104-1012H-5, 124-1212H-5, 144-1412H-6, 5-712H-6, 24-2612H-6, 44-^612H-6, 64-6612H-6, 84-8612H-6, 104-1012H-6, 124-1212H-6, 144-1412H-7, 5-712H-7, 24-2612H-7, 44-4612H-7, 64-6613H-1.5-713H-1, 25-2713H-1, 45-4713H-1, 65-6713H-1, 85-8713H-1, 105-1013H-1, 125-1213H-1, 145-1413H-2, 5-713H-2, 25-2713H-2, 4 5 ^ 713H-2, 65-6713H-2, 85-8713H-2, 105-1013H-2, 125-1213H-2, 145-1413H-3, 5-713H-3, 25-2713H-3, 45-4713H-3, 65-6713H-3, 85-8713H-3, 105-1013H-3, 125-1213H-3, 145-1413H-4, 5-713H-4, 25-2713H-4, 45-4713H-4, 65-6713H-4, 85-8713H-4, 105-1013H-4, 125-12
Depth
(mbsf)
101.24101.44101.64101.75102.25102.44102.64102.84103.04103.24103.44103.64103.75103.94104.14104.34104.54104.74104.94105.14105.25105.44105.64105.84106.04106.24106.44106.64106.75106.94107.14107.34107.54107.74107.94108.14108.25108.44108.64108.84109.04109.24109.44109.64109.75109.94110.14110.34110.54110.74110.94111.14111.25111.44111.64111.84111.75111.95112.15112.35112.55112.75112.95113.15113.25113.45113.65113.85114.05114.25114.45114.65114.75114.95115.15115.35115.55115.75115.95116.15116.25116.45116.65116.85117.05117.25117.45
δ 1 8 θ
-0.55-0.66-0.65-0.58-0.41-0.69-0.32-0.30-0.56-0.57-0.59-0.67-0.73-0.79-1.52-1.72-0.99-1.01-0.56-0.60-0.64-0.77-0.68-0.64-0.95-1.27-1.28-0.80-1.13-0.83-0.62-0.41-0.17-0.12-0.24+0.09-0.37-0.13-0.26-0.37-0.23-0.25-0.20-0.29-0.34-0.36-0.54-0.57-0.61-0.67-0.62-0.58-0.91-0.64-0.66-0.59-0.86-0.77-0.57-0.48-0.47-0.72-0.90-0.29-0.40-0.56-0.54-0.43-0.32-0.29-0.44-0.10-0.31-0.32-0.30-0.30-0.39-0.35-0.74-0.65-0.64-0.71-0.80-0.81-1.22-1.32-1.45
Core, section,interval (cm)
13H-5, 5-713H-5, 25-2713H-5,45^713H-5, 65-6713H-5, 85-8713H-5, 105-1013H-5, 125-1213H-6, 5-713H-6, 25-2713H-6,45^713H-6, 65-6713H-6, 85-8713H-6, 105-1013H-6, 125-1213H-6, 145-1413H-7, 5-713H-7, 25-2713H-7, 4 5 ^ 714H-1, 5-714H-1,25-2714H-1,45-4714H-1,65-6714H-1, 85-8714H-1, 105-1014H-1, 125-1214H-1, 145-1414H-2, 5-714H-2, 24-2614H-2,45-4714H-2, 65-6714H-2, 82-8414H-3, 5-714H-3, 24-2614H-3, 48-5014H-3, 65-6714H-3, 82-8414H-3, 106-1014H-3, 125-1214H-3, 145-1414H-4, 5-714H-4, 28-3014H-4, 4 5 ^ 714H-4, 64-6614H-5, 28-3014H-5, 4 5 ^ 714H-5, 64-6614H-5, 85-8714H-5, 106-1014H-5, 122-1214H-5, 145-1414H-6, 5-714H-6, 25-2714H-6,45^714H-6, 65-6714H-6, 79-8114H-7, 5-714H-7, 25-2714H-7,47-4914H-7, 66-6814H-7, 85-8714H-7, 105-1014H-7, 125-1214H-7, 145-1414H-8, 5-714H-8, 25-2714H-CC, 5-714H-CC, 18-2015H-1,5-715H-1,25-2715H-1, 4 5 ^ 715H-1, 65-6715H-1, 85-8715H-1, 105-1015H-1, 125-1215H-1, 145-1415H-2, 5-715H-2, 25-2715H-2,45-4715H-2, 65-6715H-2, 85-8715H-2, 105-1015H-2, 125-1215H-2, 145-1415H-3, 5-715H-3, 25-2715H-3, 4 5 ^ 715H-3, 65-67
Depth
(mbsf)
117.75117.95118.15118.35118.55118.75118.95119.25119.45119.65119.85120.05120.25120.45120.65120.75120.95121.15121.25121.45121.65121.85122.05122.25122.45122.65122.75122.94123.15123.35123.52123.80123.99124.23124.40124.57124.81125.00125.20125.32125.55125.72125.91126.23126.40126.59126.80127.01127.17127.40127.50127.70127.90128.10128.24128.30128.50128.72128.91129.10129.30129.50129.70129.80130.00130.10130.23130.75130.95131.15131.35131.55131.75131.95132.15132.25132.45132.65132.85133.05133.25133.45133.65133.75133.95134.15134.35
δ 1 8 θ
-1.54-1.61-1.69-1.84-1.91-1.74-1.67-1.34-0.94-0.70-0.61-0.28-0.46-0.70-0.81-0.78-0.59-0.41-0.45-0.56-0.66-0.73-0.79-0.86-1.17-1.25-1.34-0.92-0.39-0.78-0.59-0.72-0.74-0.17-0.10-0.63-1.58-1.76----—-
-
.48
.72
.60
.51
.11
.39
.24
.16
.16-1.31-0.67-0.93-1.15-1.15-1.15-0.98-1.10-0.93-0.77-1.06-0.35-0.46-0.47-0.49-0.77-0.71-0.85-1.47-1.46-0.95-0.84-0.86-0.79-1.54-1.61-1.28-1.42-0.77-0.42-0.35-0.19+0.10+0.09-0.15-0.01+0.03+0.05+0.08+0.11
Core, section,interval (cm)
133- 820B-15H-1, 25-2715H-1,45-4715H-1,65-6715H-1, 85-8715H-1, 105-10715H-1, 122-12415H-1, 145-14715H-2, 5-715H-2, 25-2715H-2,45-4715H-2, 65-6715H-2, 85-8715H-2, 105-10715H-2, 122-12415H-2, 145-14715H-3, 5-715H-3, 25-2715H-3, 45-4715H-3, 65-6715H-3, 85-8715H-3, 145-14715H-4, 5-715H-4, 25-2715H-4, 45-4715H-4, 65-6715H-4, 85-8715H-4, 105-10715H-4, 122-12415H-4, 145-14715H-5, 5-715H-5, 25-2715H-5, 45-4715H-5, 65-6715H-5, 85-8715H-5, 105-10715H-5, 122-12415H-5, 145-14715H-6, 5-715H-6, 25-2715H-6,45-4715H-6, 65-6715H-6, 85-8715H-6, 105-10715H-6, 122-12415H-6, 145-14715H-7, 5-715H-7, 25-2715H-7,45-4715H-7, 65-6716H-1, 24-2616H-1,44-4616H-1, 64-6616H-1, 83-8516H-1, 105-10716H-1, 145-14716H-2, 5-716H-2, 25-2716H-2, 44-4616H-2, 64-6616H-2, 85-8716H-2, 105-10716H-2, 120-12216H-2, 145-14716H-3, 6-816H-3, 50-5216H-4, 58-6016H-4, 125-12716H-5, 145-14716H-CC, 8-1017H-1, 25-27
Depth(mbsf)
131.95132.15132.35132.55132.75132.92133.15133.25133.45133.65133.85134.05134.25134.42134.65134.75134.95135.15135.35135.55136.15136.25136.45136.65136.85137.05137.25137.42137.65137.75137.95138.15138.35138.55138.75138.92139.15139.25139.45139.65139.85140.05140.25140.42140.65140.75140.95141.15141.25141.44141.64141.84142.03142.25142.65142.75142.95143.14143.34143.55143.75143.90144.15144.26144.70146.28146.95148.65148.78150.95
Adj. dbsf
134.15134.35134.55134.75134.95135.12135.35135.45135.65135.85136.05136.25136.45136.62136.85136.95137.15137.35137.55137.75138.35138.45138.65138.85139.05139.25139.45139.62139.85139.95140.15140.35140.55140.75140.95141.12141.35141.45141.65141.85142.05142.25142.45142.62142.85142.95143.15143.35143.45143.64143.84144.04144.23144.45144.85144.95145.15145.34145.54145.75145.95146.10146.35146.46146.90148.48149.15150.85150.98153.15
δ 1 8 o
-0.140.070.130.140.12
-0.080.100.290.160.02
-0.120.03
-0.19-0.43-0.55-0.37-0.20-0.98-1.05-1.06-1.12-1.25-1.30-1.25-0.90-0.74-0.92-0.90-0.97-0.860.11
-0.42-0.15-0.51-0.130.04
-0.09-0.10-0.62-0.37-0.12-0.11-0.87-0.24-0.59-0.51-0.62-0.74-0.46-0.83-1.90-1.12-0.52-1.30-1.94-1.82-1.68-1.72-1.77-1.69-0.72-0.85-1.56-1.36-1.34-0.46-0.79-0.82-1.08-1.04
168
STABLE OXYGEN ISOTOPE SIGNAL
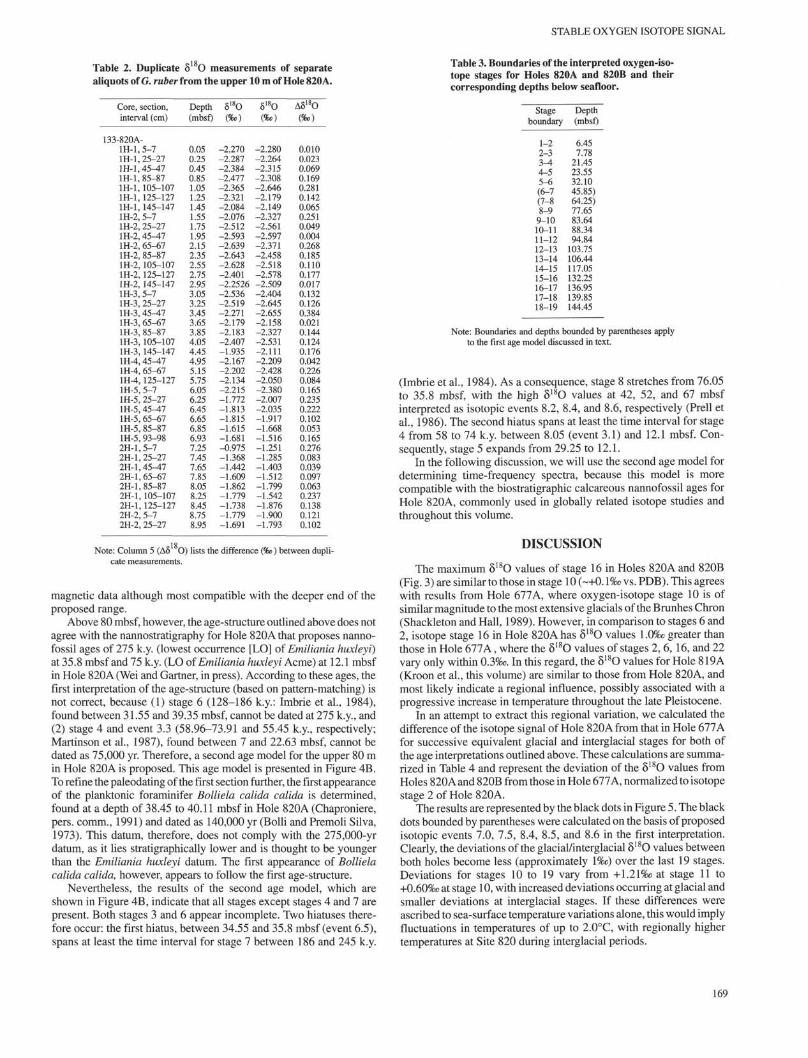
Table 2. Duplicate δ O measurements of separate
aliquots of G. ruber from the upper 10 m of Hole 820A.
Table 3. Boundaries of the interpreted oxygen-iso-
tope stages for Holes 820A and 820B and their
corresponding depths below seafloor.
Core, section,interval (cm)
133-820A-1H-1, 5-71H-1, 25-27lH-1,45^71H-1,85-871H-1,105-1071H-1, 125-1271H-1,145-1471H-2, 5-71H-2, 25-271H-2,45-471H-2, 65-671H-2, 85-871H-2,105-1071H-2, 125-1271H-2, 145-1471H-3, 5-71H-3, 25-271H-3,45^71H-3, 65-671H-3, 85-871H-3, 105-1071H-3, 145-1471H-4, 4 5 ^ 71H-4, 65-671H-4,125-1271H-5, 5-71H-5, 25-271H-5,45-471H-5, 65-671H-5, 85-871H-5, 93-982H-1, 5-72H-1, 25-272H-1, 4 5 ^ 72H-1, 65-672H-1,85-872H-1,105-1072H-1,125-1272H-2, 5-72H-2, 25-27
Depth(mbsf)
0.050.250.450.851.051.251.451.551.751.952.152.352.552.752.953.053.253.453.653.854.054.454.955.155.756.056.256.456.656.856.937.257.457.657.858.058.258.458.758.95
δ 1 8 θ
(‰)
-2.270-2.287-2.384-2.477-2.365-2.321-2.084-2.076-2.512-2.593-2.639-2.643-2.628-2.401-2.2526-2.536-2.519-2.271-2.179-2.183-2.407-1.935-2.167-2.202-2.134-2.215-1.772-1.813-1.815-1.615-1.681-0.975-1.368-1.442-1.609-1.862-1.779-1.738-1.779-1.691
δ 1 8 θ
(‰)
-2.280-2.264-2.315-2.308-2.646-2.179-2.149-2.327-2.561-2.597-2.371-2.458-2.518-2.578-2.509-2.404-2.645-2.655-2.158-2.327-2.531-2.111-2.209-2.428-2.050-2.380-2.007-2.035-1.917-1.668-1.516-1.251-1.285-1.403-1.512-1.799-1.542-1.876-1.900-1.793
Δδ18O
(‰)
0.0100.0230.0690.1690.2810.1420.0650.2510.0490.0040.2680.1850.1100.1770.0170.1320.1260.3840.0210.1440.1240.1760.0420.2260.0840.1650.2350.2220.1020.0530.1650.2760.0830.0390.0970.0630.2370.1380.1210.102
Note: Column 5 ( δ O) lists the difference (‰) between dupli-cate measurements.
magnetic data although most compatible with the deeper end of theproposed range.
Above 80 mbsf, however, the age-structure outlined above does notagree with the nannostratigraphy for Hole 820A that proposes nanno-fossil ages of 275 k.y. (lowest occurrence [LO] of Emiliania huxleyi)at 35.8 mbsf and 75 k.y. (LO of Emiliania huxleyi Acme) at 12.1 mbsfin Hole 820A (Wei and Gartner, in press). According to these ages, thefirst interpretation of the age-structure (based on pattern-matching) isnot correct, because (1) stage 6 (128-186 k.y.: Imbrie et al., 1984),found between 31.55 and 39.35 mbsf, cannot be dated at 275 k.y., and(2) stage 4 and event 3.3 (58.96-73.91 and 55.45 k.y., respectively;Martinson et al., 1987), found between 7 and 22.63 mbsf, cannot bedated as 75,000 yr. Therefore, a second age model for the upper 80 min Hole 820A is proposed. This age model is presented in Figure 4B.To refine the paleodating of the first section further, the first appearanceof the planktonic foraminifer Bolliela calida calida is determined,found at a depth of 38.45 to 40.11 mbsf in Hole 820A (Chaproniere,pers. comm., 1991) and dated as 140,000 yr (Bolli and Premoli Silva,1973). This datum, therefore, does not comply with the 275,000-yrdatum, as it lies stratigraphically lower and is thought to be youngerthan the Emiliania huxleyi datum. The first appearance of Bollielacalida calida, however, appears to follow the first age-structure.
Nevertheless, the results of the second age model, which areshown in Figure 4B, indicate that all stages except stages 4 and 7 arepresent. Both stages 3 and 6 appear incomplete. Two hiatuses there-fore occur: the first hiatus, between 34.55 and 35.8 mbsf (event 6.5),spans at least the time interval for stage 7 between 186 and 245 k.y.
Stageboundary
1-22-33 ^4-55-6(6-7(7-88-9
9-1010-1111-1212-1313-1414-1515-1616-1717-1818-19
Depth(mbsf)
6.457.78
21.4523.5532.1045.85)64.25)77.6583.6488.3494.84
103.75106.44117.05132.25136.95139.85144.45
Note: Boundaries and depths bounded by parentheses applyto the first age model discussed in text.
(Imbrie et al., 1984). As a consequence, stage 8 stretches from 76.05to 35.8 mbsf, with the high δ'8O values at 42, 52, and 67 mbsfinterpreted as isotopic events 8.2, 8.4, and 8.6, respectively (Prell etal., 1986). The second hiatus spans at least the time interval for stage4 from 58 to 74 k.y. between 8.05 (event 3.1) and 12.1 mbsf. Con-sequently, stage 5 expands from 29.25 to 12.1.
In the following discussion, we will use the second age model fordetermining time-frequency spectra, because this model is morecompatible with the biostratigraphic calcareous nannofossil ages forHole 820A, commonly used in globally related isotope studies andthroughout this volume.
DISCUSSION
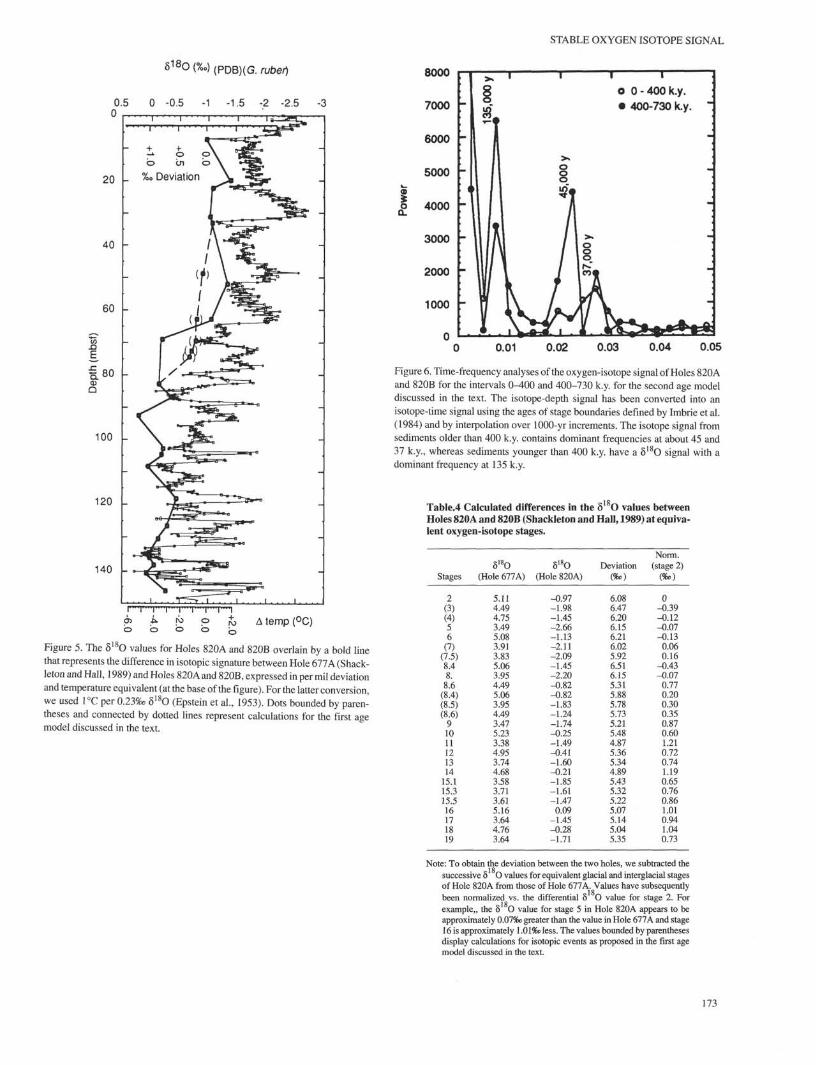
The maximum δ 1 8 θ values of stage 16 in Holes 820A and 820B(Fig. 3) are similar to those in stage 10 (~+O. l‰ vs. PDB). This agreeswith results from Hole 677A, where oxygen-isotope stage 10 is ofsimilar magnitude to the most extensive glacials of the Brunhes Chron(Shackleton and Hall, 1989). However, in comparison to stages 6 and2, isotope stage 16 in Hole 820Ahas δ'8O values l.O‰ greater thanthose in Hole 677A, where the δ 1 8 θ values of stages 2, 6, 16, and 22vary only within 0.3‰. In this regard, the δ 1 8 θ values for Hole 819A(Kroon et al., this volume) are similar to those from Hole 820A, andmost likely indicate a regional influence, possibly associated with aprogressive increase in temperature throughout the late Pleistocene.
In an attempt to extract this regional variation, we calculated thedifference of the isotope signal of Hole 820A from that in Hole 677Afor successive equivalent glacial and interglacial stages for both ofthe age interpretations outlined above. These calculations are summa-rized in Table 4 and represent the deviation of the δ 1 8 θ values fromHoles 820Aand 820B from those in Hole 677 A, normalized to isotopestage 2 of Hole 820A.
The results are represented by the black dots in Figure 5. The blackdots bounded by parentheses were calculated on the basis of proposedisotopic events 7.0, 7.5, 8.4, 8.5, and 8.6 in the first interpretation.Clearly, the deviations of the glacial/interglacial δ 1 8 θ values betweenboth holes become less (approximately l‰) over the last 19 stages.Deviations for stages 10 to 19 vary from +1.21‰ at stage 11 to+0.60‰ at stage 10, with increased deviations occurring at glacial andsmaller deviations at interglacial stages. If these differences wereascribed to sea-surface temperature variations alone, this would implyfluctuations in temperatures of up to 2.0°C, with regionally highertemperatures at Site 820 during interglacial periods.
169

FM. PEERDEMAN, P.J. DAVIES, A.R. CHIVAS
Hole 820A
(PDB) (G. rubet)
Core V28-238
(PDB) (G. sacculifβr)
Hole 677A
δ % ( ‰ ) Dbsf<m.)(PDB) (Uvigβrina spp.)
+ 5.5 +5.0 +4.5 +4.0 +3.5 +3.0+ 0.5 0.0 -0.5 -1.0 -1.5 -2.0 -2.5 -3.0 -1.0 -1.5 -2.0
Figure 4. A. Age model 1—Oxygen-isotope stratigraphy for Holes 820A and 820B, interpreted through correlation with Core V28-238 (Shackleton
and Opdyke, 1973) and Hole 677A (Shackleton and Hall, 1989), using the graphic correlation concept outlined by Prell et al. (1986). B. Age model
2—Oxygen-isotope stratigraphy of Holes 82OA and 820B in comparison to the isotope chronostratigraphy of Hole 607A (Ruddiman et al., 1989) and
677A (Shackleton, et al., 1990). The paleontological ages (75, 275,465 k.y.) in Hole 820A are based on calcareous nannofossil stratigraphy determined
by Wei and Gartner (this volume). In addition, the ages of 120,000 and 140,000 yr were determined by shore-based studies on the basis of the last
appearance of Globigerinoides ruber pink and first appearance of Bolliela calida calida, respectively (Chaproniere, pers. comm., 1991). The 730,000
yr datum is based on the position of the Brunhes/Matuyama reversal boundary, proposed by Barton et al. (this volume).
Furthermore, the transition from stages 10 to 9, for both ageinterpretations, is marked by a progressive decrease in deviation ofδ 1 8 θ between the two holes from stage 10, through stage 9 to the earlypart of stage 8. This change in deviation, from +0.77 to -0.43‰,suggests a possible increase of 4°C in sea-surface temperature.
Finally, deviations between Holes 820A and 667A for glacial andinterglacial values of stages 6 to 1 suggest coherent δ 1 8 θ values ofapproximately -0. l‰ for the upper part of Hole 820A. An exceptionis stage 3, which displays a deviation that is approximately 0.25‰lower than the δ 1 8 θ value of isotope stage 3 in Hole 677'A.
The proposed increase of 4°C in sea-surface temperature at Site820, which occurs from approximately 400 k.y. (-80 mbsf) coincideswith changes in seismic character (Feary et al., this volume), litholo-gies (Feary and Jarrard, this volume; Barton et al., this volume), logcharacteristics (Davies et al., 1991), and geochemical variables (Fearyand Jarrard, this volume) at Site 820.
Also, coincident with the proposed increase in surface temperaturewe observe a change in the frequency of the δ 1 8 θ signal in Hole 820A.To investigate these observations further, we established time-fre-quency spectra for the δ 1 8 θ record for the two identified intervals (Fig.6). In the time interval from 0 to 400 k.y. (stages 1 to 10; Imbrie et al.,1984), the dominant power occurs at 135 k.y. with little power at higherfrequencies. Between 400 and 730 k.y. (B/M boundary or stage 19.1),the power is most significant at 45 and 37 k.y., with 45 k.y. slightly
dominant over the 37 k.y. frequency. Clearly, differences exist for theintervals above and below the boundary having an age of approxi-mately 400 k.y. younger than which, the 135 k.y. frequency dominatesalmost totally, and older than which, frequencies of 45 and 37 k.y.dominate. These are apparently not the Milankovitch periodicitiesthat are normally observed in deep-sea sediments (Imbrie et al., 1984).However, their divergence from the Milankovitch cycles may be theresult of variations in sedimentation rates and the relatively poor timecontrol for such a high-resolution section. Nevertheless, the obtainedspectra support a major difference in the cyclic behavior of the isotopesignal of Hole 820A for intervals younger and older than 400 k.y.
Changes in the frequency of isotopic variation of middle and latePleistocene sections have been noted by other researchers and inter-preted in one of two ways: (1) Prell (1982) and Maasch (1988)proposed a rapid change in frequency at about 900,000 yr; (2) Imbrie(1985) and Ruddiman (1986, 1989) favored a gradual change infrequency between 780 and 400 k.y., with an acceleration between700 and 600 k.y. Our data (indicating a marked change in frequencyfor intervals younger and older than 400,000 yr) thus accord in generalwith both the above interpretations. Furthermore, we postulate thatthe frequency change was accompanied by a progressive temperatureincrease over a maximum time interval between 400 and 275,000 yr.
We are unclear as to how the frequency variation in the isotopesignal, possible temperature change, and changes in sediment patterns
170

Hole 820A
)(PDB) (G. rubβi)
Hole 607A
(PDB) (Cibiádoidθs spp.)
STABLE OXYGEN ISOTOPE SIGNAL
Hole 677A
(PDB) (Uvigβriπa spp.)
+ 0.5 0.0 -0.5 -1.0 -1.5 -2.0 -2.5 -3.0 +5.5 +5.0 +4.5 +4.0 +3.5 +3.0 +2.5 +5.5 +5.0 +4.5 +4.0 +3.5 +3.00
- 0.1 Ma -
0.2 Ma -
0.3 Ma -
0.4 Ma -
0.5 Ma -
0.6 Ma -
0.7 Ma -
0.8 Ma -
0.9 Ma -
1.0 Ma
0.1 Ma -
0.2 Ma -
0.3 Ma
0.4 Ma
- 0.5 Ma
- 0.6 Ma -
, 0.7 Ma
0.8 Ma
.. 0.9 Ma
1.0 Ma150
Figure 4 (continued).
are related. However, the fact that they appear seems beyond coinci-dence. Therefore, we suggest that a climatic or regional factor raisedsea-surface temperatures over northeastern Australia about 400 k.y.ago, which in turn catalyzed the growth of the Great Barrier Reef.Such a system would then have had a profound effect on sedimentpatterns and geometries thereafter.
Despite these suggestions, we cannot exclude the possible effectsof diagenesis on the obtained δ 1 8 θ signal. Although foraminifers havebeen cleaned and chosen carefully, diagenetic alterations, may haveoccurred. Feary and Jarrard (this volume) report on the developmentof cemented aggregates, particularly between 100 and 150 mbsf, whileDavies and others (1991) described a downward increase in Sr2"1"content and decrease in Mg2+ and Ca2+ contents in the pore waters inthe upper 100 m of Site 820, probably associated with the formationof authigenic calcite and dolomite. However, considering (1) thecoherence of the isotope signal of Holes 820Aand 820B; (2) the sameisotopic shift seen in Hole 819 A at approximately the same time (Kroonet al., this volume); and (3) the occurrence of cemented aggregates,mostly below 100 mbsf, we think that diagenesis is less important thanthe climate signal in the isotope record of Hole 820A and that it doesnot affect our findings and conclusions. Trace-element studies inprogress (Ca, Mg, and Sr) on the foraminifers themselves may increaseour knowledge about the subject of diagenesis at Site 820.
CONCLUSIONS
A coherent, high-resolution, oxygen-isotope signal has been estab-lished from planktonic foraminifers for the upper 145 m of Site 820 in280 m of water off the northeastern Australian margin.
Isotope stages 1 to 19 have been interpreted on the basis ofpattern-matching with other deep-sea cores and have been guided by
the paleontological datums from Hole 820A that were establishedduring drilling. On these bases, we think that isotope stages 4 and 7are missing and are represented by two hiatuses at depths of 8.02 to12.1 and 34.55 and 35.8 mbsf.
Using isotope data from Hole 677 A as a reference curve, a regionalisotopic change for the northeastern Australian margin has beencalculated that, if interpreted in terms of local temperature variations,indicates an increase in sea-surface temperatures of approximately4°C during isotope stages 11 to 8.
Visual examination of the isotope curve indicates a marked changein amplitude and frequency of the isotope signal at about 80 mbsf.Frequency analyses confirm a major change in frequency of δ 1 8 θvalues for intervals younger and older than 400 k.y., that correspondsto both a marked temperature change and changes in depositionalstyles at Site 820. We suggest that these phenomena are related andmay have catalyzed the growth of the Great Barrier Reef.
ACKNOWLEDGMENTS
The assistance of Joe Cali at the Research School of Earth Sciences,The Australian National University, and Paul Attenborough at BMR'sMarine Sedimentology Laboratory is gratefully acknowledged.
REFERENCES*
Berggren, W.A., Burckle, L.H., Cita, M.B., Cooke, H.B.S., Funnell, B.M.,Gartner, S., Hays, J.D., Kennett, J.P., Opdyke, N.D., Pastouret, L.,
Abbreviations for names of organizations and publication titles in ODP reference listsfollow the style given in Chemical Abstracts Service Source Index (published byAmerican Chemical Society).
171
RM. PEERDEMAN, PJ. DAVIES, A.R. CHIVAS
Shackleton, NJ., and Takayanagi, Y., 1980. Towards a Quaternary timescale. Quat. Res. (N.Y.), 13:277-302.
Bolli, H.M., and Premoli-Silva, I., 1973. Oligocene to Recent planktonicforaminifera and stratigraphy of the Leg 15 Sites in the Caribbean Sea. InEdgar, N.T., Saunders, J.B., et al., Init. Repts. DSDP, 15: Washington (U.S.Govt. Printing Office), 475-497.
Broecker, W.S., 1974. Chemical Oceanography: New York (Harcourt BraceJovanovich).
Chappell, J., and Shackleton, NJ., 1986. Oxygen isotopes and sea level.Nature, 324:137-140.
Davies, PJ., McKenzie, J.A., Palmer-Julson, A., et al., 1991. Proc. ODP, Init.Repts., 133: College Station, TX (Ocean Drilling Program).
Davies, PJ., Symonds, P.A., Feary, D.A., and Pigram, C.J., 1988. Faciesmodels in exploration: the carbonate platforms of northeast Australia.APEAJ., 28:123-43.
, 1989. The evolution of the carbonate platforms of northeast Aus-tralia. In Crevello, P.D., Wilson, J.L., Sarg, J.F., Read, J.F. (Eds.), Controlson Carbonate Platform and Basin Development. Spec. Publ.—Soc. Econ.Paleontol. Mineral., 44:233-258.
DeMenocal, RB., Ruddiman, W.F., and Kent, D.V., 1990. Depth of post-depo-sitional remanence acquisition in deep-sea sediments: a case study of theBrunhes-Matuyama reversal and oxygen isotopic Stage 19.1. Earth Planet.Sci. Lett., 99:1-13.
Emiliani, C, 1955. Pleistocene temperatures. J. Geol, 63:539-578.Epstein, S., Buchsbaum, S.R., Lowenstam, H.A., and Urey, H.C., 1953.
Revised carbonate-water isotopic temperature scale. Geol. Soc. Am. Bull.,64:1315-1326.
Feary, D.A., Pigram, C.J., Davies, PJ., Symonds, P.A., Droxler, A.W., andPeerdeman, F, 1990. Ocean Drilling Program—Leg 133—Northeast Aus-tralia safety package. Bur. Miner. Resour. Aust. Rec, 1990/6.
Harris, P.T., Davies, PJ., and Marshall, J.F, 1990. Late Quaternary sedimen-tation on the Great Barrier Reef continental shelf and slope east ofTownsville, Australia. Mar. Geol., 94:55-77.
Imbrie, J., 1985. A theoretical framework for the Pleistocene ice ages. J. Geol.Soc. London, 142:417^32.
Imbrie, J., Shackleton, NJ., Pisias, N.G., Morley, J.J., Prell, W.L., Martinson,D.G., Hays, J.D., Mclntyre, A., and Mix, A.C., 1984. The orbital theory ofPleistocene climate: support from a revised chronology of the marine δ 1 8 θrecord. In Berger, A.L., Imbrie, J., Hays, J., Kukla, G., and Saltzman, B.(Eds.), Milankovitch and Climate (Pt. 2): Dordrecht (D. Reidel), 269-305.
Killingley, J.S., Johnson, R.F., and Berger, W.H., 1981. Oxygen and carbonisotopes of single shells of planktonic foraminifera from Ontong-JavaPlateau. Palaeogeogr, Palaeoclimatol., Palaeoecol., 33:193-204.
Maasch, K.A., 1988. Statistical detection of the mid-Pleistocene transition.Clim.Dyn., 2:133-143.
Martinson, D.G., Pisias, N.G., Hays, J.D., Imbrie, I., Moore, T C , Jr., andShackleton, NJ., 1987. Age dating and the orbital theory of the ice-ages:development of a high-resolution 0 to 300,000-year chronostratigraphy.Quat. Res. NY, 27:1-29.
Pickard, G.L., Donguy, J.R., Henin, C, and Rougerie, E, 1977. A Review ofthe Physical Oceanography of the Great Barrier Reef and western CoralSea. Aust. Inst. Mar. Sci. Monogr. Sen, 2.
Prell, W.L., 1982. Oxygen and carbon isotope stratigraphy for the Quaternaryof Hole 502B: evidence for two modes of isotopic variability. In Prell,W.L., Gardner, J.V., et al., Init. Repts. DSDP, 68: Washington (U.S. Govt.Printing Office), 455-^64.
Prell, W.L., Imbrie, J., Martinson, D.G., Morley, J J., Pisias, N.G., Shackleton,NJ., and Streeter, H.F., 1986. Graphic correlation of oxygen isotope stratig-raphy: application to the late Quaternary. Paleoceanography, 1:137-162.
Ruddiman, W.F., Mclntyre, A., andRaymo, M., 1986. Matuyama 41,000-yearcycles: North Atlantic Ocean and northern hemisphere ice sheets. EarthPlanet. Sci. Lett., 80:117-129.
Ruddiman, W.F., Raymo, M.E., Martinson, D.G., Clement, B.M., and Back-man, J., 1989. Pleistocene evolution: Northern Hemisphere ice sheets andNorth Atlantic Ocean. Paleoceanography, 4:353-412.
Shackleton, NJ., Berger, A., and Peltier, W.R., 1990. An alternative astronomi-cal calibration of the lower Pleistocene time scale based on ODP Site 677.Trans. R. Soc. Edinburgh, Earth Sci., 81:251—261.
Shackleton, NJ., and Hall, M.A., 1989. Stable isotope history of the Pleisto-cene at ODP Site 677. In Becker, K., Sakai, H., et al., Proc. ODP, Sci.Results, 111: College Station, TX (Ocean Drilling Program), 295-316.
Shackleton, NJ., and Opdyke, N.D., 1973. Oxygen isotope and paleomagneticstratigraphy of equatorial Pacific core V28-238: oxygen isotope tempera-tures and ice volumes on a I05 year and I0 6 year scale. Quat. Res. (N.Y.),3:39-55.
Thierstein, H.R., Geitzenauer, K., Molfino, B., and Shackleton, NJ., 1977.Global synchroneity of late Quaternary coccolith datum levels: validationby oxygen isotopes. Geology, 5:400-404.
Date of initial receipt: 20 April 1992Date of acceptance: 8 February 1993Ms 133SR-288
172
STABLE OXYGEN ISOTOPE SIGNAL
(PDB)(G. ruber)
0.5 0 -0.5 -1 -1.5 -2 -2.5 -3O 0-400 k.y.• 400-730 k.y.
1000
0.01 0.02 0.03 0.04 0.05
120
140
Figure 6. Time-frequency analyses of the oxygen-isotope signal of Holes 820Aand 820B for the intervals 0-400 and 400-730 k.y. for the second age modeldiscussed in the text. The isotope-depth signal has been converted into anisotope-time signal using the ages of stage boundaries defined by Imbrie et al.(1984) and by inteΦolation over 1000-yr increments. The isotope signal fromsediments older than 400 k.y. contains dominant frequencies at about 45 and37 k.y., whereas sediments younger than 400 k.y. have a δ 1 8 θ signal with adominant frequency at 135 k.y.
Table.4 Calculated differences in the δ O values betweenHoles 820A and 820B (Shackleton and Hall, 1989) at equiva-lent oxygen-isotope stages.
temp(°C)
Figure 5. The δ 1 8 θ values for Holes 820A and 820B overlain by a bold linethat represents the difference in isotopic signature between Hole 677 A (Shack-leton and Hall, 1989) and Holes 820Aand 820B, expressed in per mil deviationand temperature equivalent (at the base of the figure). For the latter conversion,we used 1°C per 0.23‰ δ 1 8 θ (Epstein et al., 1953). Dots bounded by paren-theses and connected by dotted lines represent calculations for the first agemodel discussed in the text.
Stages
2(3)(4)56
(7)(7.5)8.48.8.6
(8.4)(8.5)(8.6)
91011121314
15.115.315.516171819
δ 1 8 o(Hole 677 A)
5.114.494.753.495.083.913.835.063.954.495.063.954.493.475.233.384.953.744.683.583.713.615.163.644.763.64
δ1 8θ(Hole 820A)
-0.97-1.98-1.45-2.66-1.13-2.11-2.09-1.45-2.20-0.82-0.82-1.83-1.24-1.74-0.25-1.49-0.41-1.60-0.21-1.85-1.61-1.47
0.09-1.45-0.28-1.71
Deviation(‰)
6.086.476.206.156.216.025.926.516.155.315.885.785.735.215.484.875.365.344.895.435.325.225.075.145.045.35
Norm.(stage 2)
(‰)
0-0.39-0.12-0.07-0.13
0.060.16
-0.43-0.07
0.770.200.300.350.870.601.210.720.741.190.650.760.861.010.941.040.73
Note: To obtain the deviation between the two holes, we subtracted the18successive δ O values for equivalent glacial and interglacial stages
of Hole 820A from those of Hole 677A. Values have subsequently18been normalized vs. the differential δ O value for stage 2. For
example,, the δ O value for stage 5 in Hole 820A appears to beapproximately 0.07‰ greater than the value in Hole 677A and stage16 is approximately 1.01‰ less. The values bounded by parenthesesdisplay calculations for isotopic events as proposed in the first agemodel discussed in the text.
173