stable carbon‐isotope record of shallow‐marine evaporative...
TRANSCRIPT

Stable carbon-isotope record of shallow-marine evaporativeepicratonic basin carbonates, Ordovician Williston Basin,North America
ANTUN HUSINEC* and STIG M. BERGSTR €OM†*Department of Geology, St. Lawrence University, 23 Romoda Drive, Canton, NY 13617, USA (E-mail:[email protected])†Division of Earth History, School of Earth Sciences, The Ohio State University, 125 S. Oval Mall,Columbus, OH 43210, USA
Associate Editor – Adrian Immenhauser
ABSTRACT
Secular variations in stable carbon-isotope values of marine carbonates are
used widely to correlate successions that lack high-resolution index fossils.
Various environmental processes, however, commonly may affect and alter
the primary marine carbon-isotope signal in shallow epicratonic basins. This
study focuses on the marine carbon-isotope record from the carbonate–evapo-rite succession of the upper Katian (Upper Ordovician) Red River Formation of
the shallow epicratonic Williston Basin, USA. It documents the carbon-isotope
signal between the two major Ordovician positive shifts in d13C, the early
Katian Guttenberg and the Hirnantian excursions. Eight d13C stages are identi-
fied based on positive excursions, shifts from positive to negative values and
relatively uniform d13Ccarb values. A correlation between carbon-isotope trends
and the relative sea-level changes based on gross facies stacking patterns
shows no clear relation. Based on the available biostratigraphy and d13Ctrends, the studied Williston Basin curves are tied to the isotope curves from
the North American Midcontinent, Qu�ebec (Anticosti Island) and Estonia,
which confirm the Late Katian age (Aphelognathus divergens Conodont Zone)
of the upper Red River Formation. The differences in the d13C overall trend
and absolute values, coupled with the petrographic and cathodoluminescence
evidence, suggest that the carbon-isotope record has been affected by the syn-
depositional environmental processes in the shallow and periodically isolated
Williston Basin, and stabilized by later burial diagenesis under reducing
conditions and the presence of isotopically more negative fluids.
Keywords d13C chemostratigraphy, carbonate diagenesis, Ordovician,sequence stratigraphy, Williston Basin.
INTRODUCTION
The Ordovician has traditionally been consi-dered to have been dominated by greenhouseconditions (Fischer, 1982; Frakes et al., 1992)with warm temperatures, high sea-level, and anatmospheric pCO2 level estimated to be betweeneight and 22 times higher than today (Yapp &Poths, 1992; Berner, 1994; Berner & Kothavala,
2001; Herrmann et al., 2004; Vandenbrouckeet al., 2010). Such a relatively ice-free world ofthe Early Ordovician underwent cooling in thelate Middle and early Late Ordovician (Pope &Read, 1998; Trotter et al., 2008), culminating inthe Hirnantian glaciation episode (Frakes, 1979;Brenchley et al., 1994, 2003; Qing & Veizer,1994; Paris et al., 1995; Marshall et al., 1997;Finnegan et al., 2011) and mass extinction
314 © 2014 The Authors. Sedimentology © 2014 International Association of Sedimentologists
Sedimentology (2015) 62, 314–349 doi: 10.1111/sed.12152

DU
NN
WAR
D
CAS
S
MC
LEA
N
MC
KEN
ZIE
GR
ANT
WIL
LIAM
S
MO
RTO
N
STU
TSM
AN
STA
RK
WE
LLS
KID
DE
R
MC
HEN
RY
WAL
SH
BAR
NE
S
SLO
PE
SIO
UX
EMM
ON
S
BEN
SON
MO
UN
TRA
IL
BUR
LEIG
H
CAV
ALI
ER
RAM
SEY
DIC
KEY
BOTT
INEA
U
LOG
AN
PIE
RC
E
RIC
HLA
ND
ADA
MS
MER
CE
R
BOW
MAN
TRA
ILL
PEM
BIN
A
NEL
SO
N
TOW
NE
R
LAM
OU
RE
EDD
Y
RO
LETT
E
OLI
VER
RAN
SOM
GR
AND
FO
RKS
SHE
RID
AN
HET
TIN
GE
R
MC
INTO
SH
STEE
LE
REN
VILL
E
SAR
GEN
T
GR
IGG
SFO
STE
R
BILL
ING
S
GO
LDEN
VAL
LEY
BUR
KE
DIV
IDE
Farg
o
Min
ot
Bism
arck
Will
isto
n
Dick
inso
n
Gra
nd F
orks
030
6090
120
15M
iles
City
Wel
l
#801
0
#910
3
#980
0
100 10
0 0
100
200
300
Kilo
met
res
0 10
0 20
0 M
iles
ALBE
RTA
S
AS
KAT
CH
EW
AN
M
ANIT
OBA
CA
LGA
RY
RE
GIN
A W
INN
IPE
G
BIL
LIN
GS
MO
NTA
NA
WY
OM
ING
BIS
MA
RK
N
OR
TH
DA
KO
TA
SO
UTH
D
AK
OTA
PIE
RR
E
WIL
LIST
ON
BA
SIN
1
2
1 - C
edar
Cre
ek a
ntic
line
2 - N
esso
n an
ticlin
e
BA
Fig.1.Location
map.(A
)Map
ofcentralNorth
Americash
owingoutlineofW
illiston
Basin
(modified
from
Carlson
&Anderson,1965).(B)Map
ofNorth
Dakota
showinglocationsofthethreewellsusedin
this
study.
© 2014 The Authors. Sedimentology © 2014 International Association of Sedimentologists, Sedimentology, 62, 314–349
Carbon-isotope record of an epicratonic basin 315

events (Sepkoski, 1995; Sheehan, 2001; Alroyet al., 2008; Bergstr€om et al., 2014). The Hirnan-tian glaciation was preceded by enhancedorganic carbon burial during the Chatfieldianthat resulted in the Guttenberg excursion, whichwas associated with lowered atmospheric pCO2
to levels near the threshold for ice buildup(Saltzman & Young, 2005). Both of these epi-sodes are marked by significant positive shifts incarbon-isotope values (Saltzman & Young, 2005,and references therein). Interestingly, althoughexamined in detail in Baltoscandia (e.g. Kaljoet al., 2008; Ainsaar et al., 2010; Bergstr€omet al., 2010b), relatively little is known in NorthAmerica about the d13C trend in the intervalbetween these prominent excursions. The onlyavailable d13C curves from North America thatpartially cover this interval are the Midcontinentcomposite curve (Bergstr€om et al., 2007, 2010d),the Anticosti Island curve (Young et al., 2010)and the Monitor Range composite curve fromcentral Nevada that was constructed by Saltz-man & Young (2005) based partly on data fromKump et al. (1999). To study the carbon-isotopesignal of this interval in more detail, threecontinuously cored wells through the UpperOrdovician Williston Basin shallow-marinecarbonate–evaporite Red River Formation wereused.The objectives of this study were to: (i) esta-
blish a detailed carbon-isotope stratigraphy forthe Upper Ordovician study interval of the Will-iston Basin and thus provide a reference curvefor the Late Katian interval between Guttenbergand the Hirnantian excursions; (ii) assess theinfluence of various environmental processesaffecting and potentially altering the primarymarine d13C signal in a shallow, evaporativeepicratonic basin; as well as (iii) evaluate laterdiagenetic processes related to burial diagenesis,potentially resetting the d13C signal; and (iv) testwhether the relation between carbon-isotopetrends and sequence stratigraphy in the basincan be established.
GEOLOGICAL SETTING
The Williston Basin of North Dakota, SouthDakota, Montana, Wyoming and south-centralCanada is a kidney-shaped, Phanerozoic epicra-tonic depression in the western distal CanadianShield (Fig. 1). An approximately 4900 m(16 000 ft) thick succession of sedimentary rocksspans the Cambrian through to Quaternary (e.g.
Carlson & Anderson, 1965; Gerhard et al., 1982)and includes all the classic Sloss’ (1963) uncon-formity bounded sequences in North America.The Palaeozoic sequences are mostly carbonates,which were deposited in dominantly shallowmarine environments (Porter & Fuller, 1959;Carlson & Anderson, 1965; Gerhard et al., 1982),occupying equatorial latitudes (Jin et al., 2013)in a region of high evaporation as inferred fromthick evaporite deposits. Of the several majorepeirogenic structures within the basin, theCedar Creek (Clement, 1987) and Nesson anti-clines (Gerhard et al., 1987; LeFever et al., 1987)are the best known. Basin subsidence began inthe Chatfieldian (early Katian) with the deposi-tion of the Winnipeg Group (Oberg, 1966; Sweet,1982) when the initial depression with seawayconnections to the west was formed (Sandberg,1964). During its Phanerozoic evolution, thebasin has subsided ca 4900 m (16 000 ft) with-out undergoing severe orogenic deformation orsignificant peripheral tectonic distortion (Ger-hard et al., 1982).
Lithostratigraphy
The Upper Ordovician Red River Formation ispresent throughout the Williston Basin, reachinga maximum thickness of slightly more than210 m (700 ft) in the central part of the basin inDunn County, North Dakota (Fig. 2). The RedRiver Formation sharply overlies a series ofargillaceous layers of predominantly siliciclasticdeposits of the underlying early Katian (Chatfiel-dian) Winnipeg Group. The upper boundary ofthe Red River Formation with overlying carbo-nates and shales of the Stony Mountain Forma-tion is also conformable, but sharp (Carroll,1979; Fig. 2).The Red River Formation consists primarily of
shallow water limestone and dolomite, the latterhaving major oil reservoirs, and traditionally ithas been subdivided into a lower and an upperunit (Sinclair, 1959; Fuller, 1961; Ballard, 1963;Carroll, 1979). The lower unit ranges from 120 to170 m (400 to 550 ft) in thickness and is domi-nated by fossiliferous, bioturbated and selectivelydolomitized wackestone (Porter & Fuller, 1959;Carroll, 1979). The upper 40 to 90 m (120 to270 ft) thick unit is characterized by the presenceof extensive evaporite capping cycles consistingof the basal fossiliferous limestone and fine-grained dolomite (Porter & Fuller, 1959; Carroll,1979). In addition, thin argillaceous beds overly-ing nodular anhydrite are traceable basinwide on
© 2014 The Authors. Sedimentology © 2014 International Association of Sedimentologists, Sedimentology, 62, 314–349
316 A. Husinec and S. M. Bergstr€om
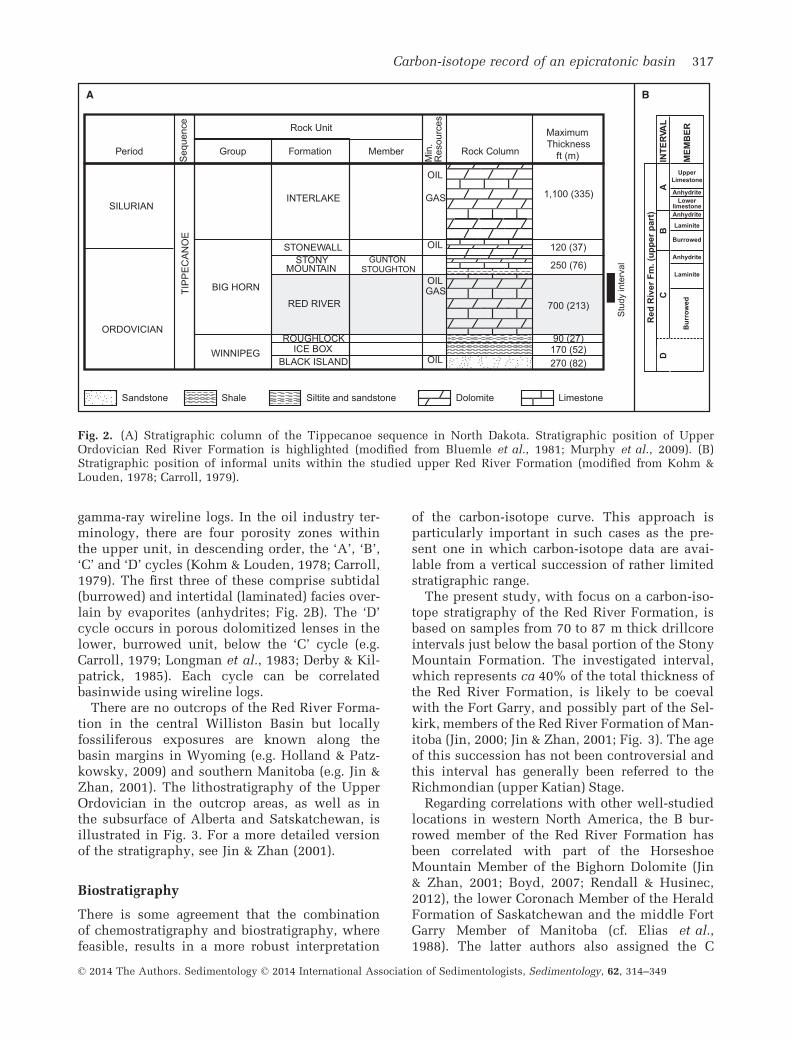
gamma-ray wireline logs. In the oil industry ter-minology, there are four porosity zones withinthe upper unit, in descending order, the ‘A’, ‘B’,‘C’ and ‘D’ cycles (Kohm & Louden, 1978; Carroll,1979). The first three of these comprise subtidal(burrowed) and intertidal (laminated) facies over-lain by evaporites (anhydrites; Fig. 2B). The ‘D’cycle occurs in porous dolomitized lenses in thelower, burrowed unit, below the ‘C’ cycle (e.g.Carroll, 1979; Longman et al., 1983; Derby & Kil-patrick, 1985). Each cycle can be correlatedbasinwide using wireline logs.There are no outcrops of the Red River Forma-
tion in the central Williston Basin but locallyfossiliferous exposures are known along thebasin margins in Wyoming (e.g. Holland & Patz-kowsky, 2009) and southern Manitoba (e.g. Jin &Zhan, 2001). The lithostratigraphy of the UpperOrdovician in the outcrop areas, as well as inthe subsurface of Alberta and Satskatchewan, isillustrated in Fig. 3. For a more detailed versionof the stratigraphy, see Jin & Zhan (2001).
Biostratigraphy
There is some agreement that the combinationof chemostratigraphy and biostratigraphy, wherefeasible, results in a more robust interpretation
of the carbon-isotope curve. This approach isparticularly important in such cases as the pre-sent one in which carbon-isotope data are avai-lable from a vertical succession of rather limitedstratigraphic range.The present study, with focus on a carbon-iso-
tope stratigraphy of the Red River Formation, isbased on samples from 70 to 87 m thick drillcoreintervals just below the basal portion of the StonyMountain Formation. The investigated interval,which represents ca 40% of the total thickness ofthe Red River Formation, is likely to be coevalwith the Fort Garry, and possibly part of the Sel-kirk, members of the Red River Formation of Man-itoba (Jin, 2000; Jin & Zhan, 2001; Fig. 3). The ageof this succession has not been controversial andthis interval has generally been referred to theRichmondian (upper Katian) Stage.Regarding correlations with other well-studied
locations in western North America, the B bur-rowed member of the Red River Formation hasbeen correlated with part of the HorseshoeMountain Member of the Bighorn Dolomite (Jin& Zhan, 2001; Boyd, 2007; Rendall & Husinec,2012), the lower Coronach Member of the HeraldFormation of Saskatchewan and the middle FortGarry Member of Manitoba (cf. Elias et al.,1988). The latter authors also assigned the C
SILURIAN
Period Rock Column
MaximumThickness
ft (m)Group
Seq
uenc
e
Min
.R
esou
rces
Formation
Rock Unit
Member
ORDOVICIAN
WINNIPEGBLACK ISLAND
ICE BOXROUGHLOCK
RED RIVER
STONEWALL
INTERLAKE 1,100 (335)
120 (37)
250 (76)
700 (213)
90 (27)170 (52)270 (82)
OIL
GAS
GAS
OIL
OIL
OIL
STONYMOUNTAIN
GUNTONSTOUGHTON
BIG HORNTIP
PE
CA
NO
E
Sandstone Dolomite LimestoneShale Siltite and sandstone
Stu
dy in
terv
al
Red
Riv
er F
m. (
uppe
r par
t)C
D
Bur
row
ed
Anhydrite
Laminite
Laminite
Burrowed
Anhydrite
Lowerlimestone
Anhydrite
Upper Limestone
BA
INTE
RVA
L
MEM
BER
BA
Fig. 2. (A) Stratigraphic column of the Tippecanoe sequence in North Dakota. Stratigraphic position of UpperOrdovician Red River Formation is highlighted (modified from Bluemle et al., 1981; Murphy et al., 2009). (B)Stratigraphic position of informal units within the studied upper Red River Formation (modified from Kohm &Louden, 1978; Carroll, 1979).
© 2014 The Authors. Sedimentology © 2014 International Association of Sedimentologists, Sedimentology, 62, 314–349
Carbon-isotope record of an epicratonic basin 317

laminite, the C anhydrite and the B burrowedmembers to the middle–upper RichmondianAphelognathus divergens Conodont Zone thatcorresponds to the middle part of the Amorpho-gnathus ordovicicus Conodont Zone.In summary, because the sampled interval
herein is in the upper half of the Red River For-mation, it is likely to be coeval with an intervalwell above the base of the type Richmondian,probably above the Waynesville Formation inthe Richmondian type area in the Cincinnatiregion. This conclusion is important for theinterpretation of excursions in the d13C curves.
STUDY METHODS
This study is based on a detailed bed by bedanalysis of three cores through the subsurfaceupper Red River Formation along the north–south transect in western North Dakota (Fig. 1).This transect includes the Simpson #1 corelocated roughly in the centre of the WillisonBasin, as well as the Federal #10-1 and UrlacherState Unit #1 cores, the sites of which are located104 km and 243 km, respectively, to the southfrom that of Simpson #1 (Appendix Table A1).
The cores were logged using a binocularmicroscope and stratigraphic position, poretypes, mineralogy, sedimentary structures, tex-tures, Dunham rock types, dolomite crystal sizesand fossils were recorded. Samples were taken atirregular intervals for petrographic and cathodo-luminescence analyses as part of a larger studyon high-resolution sequence stratigraphy and dia-genesis of the Red River Formation. The abovecores were selected because they were the thick-est and stratigraphically most complete cores ofthe Red River Formation available at the WilsonM. Laird North Dakota Geological Survey’s CoreLaboratory in Grand Forks, which is the majorcore storage facility in the study region. No coreswere available from the lower Red River Forma-tion because that part of the formation is not apetroleum reservoir and, consequently, has notbeen the target of the drilling companies.Two hundred and twenty-three samples of
shallow-water carbonates from the upper RedRiver Formation were collected at intervals ofbetween 30 cm and 90 cm from the three coresdiscussed above (Appendix Table A2). Freshchips free of calcite veins, large fossil fragmentsand stylolites were drilled to obtain 0.5 gpowdered bulk rock using a 1.8 mm regular car-
GLOBAL NORTH AMERICA NORTH
DAKOTANORTH
DAKOTA
STONEWALL
WINNIPEG WINNIPEG WINNIPEG WINNIPEG LANDER
STONY MTN. STONY MTN.
FORT GARRY
“A”
“B”“C”“D”?
?
SELKIRK
DOG HEAD
CAT HEAD
HERALD
TAOBMAETSNAMOEYPOINT
LEIGH
HORSESHOE MOUNTAIN
RED RIVER
RE
D R
IVE
R
LOW
ER
BIG
HO
RN
A. g
rand
is?
A. d
iver
gens
A.
shat
.C
ON
OD
ON
T ZO
NE
U. B
IGH
OR
N
RE
D R
IVE
R
RE
D R
IVE
R
RIC
HM
ON
DIA
N
CIN
CIN
NAT
IAN
KAT
IAN
KAT
IAN
MO
-H
AWK
IAN
CH
AT-
FIE
LDIA
N
LATE
OR
DO
VIC
IAN
STONY MTN. ST. MTN. STONY MTN.
STONEWALL STONEWALLSTONEWALL
SOUTHERN MANITOBA
SASKATCH-EWAN
BIGHORN MTS.WYOMINGALBERTA
SERIES SERIESSTAGE
HIR.
STAGE
WHITE-WATER
ELK
-H
OR
N
–1 0–3 –2δ13C (‰ VPDB)
1 2
This study(#9800, Williams Co.)
Fig. 3. Diagram illustrating global and North American series, formations and members recognized in the Willis-ton Basin and adjacent areas. Note the prominent unconformity between the top of the Chatfieldian WinnipegGroup and the base of overlying Richmondian strata that corresponds to at least the entire Edenian and Maysvil-lian stages. Red River d13C curve (three-point moving average, core #9800, Williams County) with Cincinnati posi-tive d13C excursions (Bergstr€om et al., 2007, 2010c) is on the right side of the figure. Abbreviation: Hir.,Hirnantian.
© 2014 The Authors. Sedimentology © 2014 International Association of Sedimentologists, Sedimentology, 62, 314–349
318 A. Husinec and S. M. Bergstr€om

bide bur on a Dremel 400XPR rotary tool (RobertBosch Tool Corporation, Mount Prospect, IL,USA). Bulk carbonate powders were analysedfor stable isotopes (d13C and d18O) using a com-mon acid bath interfaced to a Finnigan-MAT251 mass spectrometer (Finnigan-MAT, Bremen,Germany) at RSMAS/MGG Stable Isotope Labo-ratory of Peter Swart, University of Miami. Theresults are reported in permil relative to theVPDB (Vienna PeeDee Belemnite) standard.Reproducibility on replicate analyses was betterthan 0.1& for both carbon and oxygen isotopes.Twelve non-covered thin sections representa-
tive of major facies from the studied cores wereexamined at the St. Lawrence Carbonate Sedi-mentology Laboratory using cathodolumine-scence (CL) microscopy with a Technosyn cold-cathodoluminescence unit (Reliotron controlconsole; Reliotron Industries, Bedford, MA,USA) attached to an Olympus SZX-10 stereomi-croscope (Olympus Corporation, Tokyo, Japan)equipped with an Olympus DP72 12.8MP digitalcolour camera. Operating conditions were 7 to8 kV beam voltage and 0.6 to 0.8 mA beamcurrent and chamber pressure 80 to 90 mTorr.
RESULTS
Depositional sequence framework
The facies in the upper Red River Formation inNorth Dakota are described and interpreted inTable 1. A generalized outline of the upper RedRiver sequence stratigraphy based on the threestudied cores (Figs 4 to 6) is presented here to facil-itate the discussion of: (i) the intrabasinal and ex-trabasinal correlation; and (ii) the relation betweenthe carbon-isotope trends, relative sea-level andsequence stratigraphy. The sequence stratigraphicterminology in this paper follows the definitions ofVan Wagoner et al. (1988) and Weber et al. (1995)for naming sequence stratigraphic depositionalunits and their component parasequences.
Long-term (third-order) depositionalsequencesThe upper part of the Red River Formation inWilliston Basin, North Dakota, is made up ofthree complete longer term transgressive–regres-sive sequences (RR1, RR2 and RR3; Husinec,2013) composed of lowstand (LST), transgressive(TST) and highstand systems tracts (HST); thetop of the formation, i.e. the section stratigraphi-cally above the A anhydrite (or A laminite
where anhydrite is not present), probably repre-sents a TST of the overlying sequence SM1 com-prising shales of the Stony Mountain Formation.The absence of radiometric age data, and the dif-ficulties in establishing precise intercontinentalcorrelation based on established conodont, grap-tolite and brachiopod zones make estimation ofthe chronological duration of the sequences RR1to RR3 difficult. Each of the upper Red Riversequences RR1 to RR3 is characterized byunique, regionally correlative lithological prop-erties, and by using neutron porosity and bulkdensity logs, these sequences can be tracedregionally over North Dakota. Subaqueous anhy-drites within each sequence probably formedduring relative sea-level lows that lead to theprecipitation of anhydrite in a quiet, lagoonalenvironment (e.g. Tucker, 1991; Sarg, 2001; andreferences therein). That the Red River anhy-drites, which are restricted to central portion ofthe Williston Basin, are not lowstand wedges issuggested by their stratigraphic position insequences RR1 to RR3, where they conformablyoverlie, are interbedded with and laterally pinchout against tidal flat laminites. In contrast, therestricted evaporite lowstand wedges overliehighstand systems tracts comprised of foreslopeand basinal carbonate rocks (for example, theParadox Basin: Hite & Buckner, 1981; Weberet al., 1995). Within sequences, transgressivesystems tracts are commonly thin and composedof subtidal, lagoonal facies of predominantlyskeletal mudstone to wacke-packstone withabundant burrow mottling. The basal TST is atmany locations characterized by a thin microbiallaminite that probably formed during the onsetof regional transgression associated with dissolu-tion of anhydrite. This, in turn, raised the incom-ing ocean-water salinities and locally facilitatedcyanobacterial blooms and preservation of strati-form stromatolitic structures (cf. Husinec & Read,2011). Highstand system tracts are generallythicker than TSTs and composed of peritidal,porous laminated dolomite. Sequence bound-aries are characterized by onlap of shallow sub-aqueous evaporites (cf. Sarg, 1988), with locallydeveloped subaerial and submarine erosionaltruncation marked by intraclast breccia interbed-ded with dololaminites below sequence bound-aries. Consequently, all sequence boundaries,except the lower sequence boundary of RR1,were picked at the base of shallow subaqueousto supratidal anhydrite. The tops of evaporitepackages represent transgressive surfaces thatare easily traceable basinwide in cores, and
© 2014 The Authors. Sedimentology © 2014 International Association of Sedimentologists, Sedimentology, 62, 314–349
Carbon-isotope record of an epicratonic basin 319

Table
1.
UpperKatianRedRiverFacies,
WillistonBasin,NorthDakota,USA.
Lithology
(depositional
environment)
Anhydrite
(shallow
hypersaline
subaqueous
tosu
pratidal)
Intraform
ational
breccia/conglomerate
(shallow
subtidalto
intertidal)
Microbial
laminite,
planar
laminite,
dololaminite
(tidalflat)
Thrombolite
(shallow
subtidalto
low
intertidal)
Ooid
dolograinstone-
packstone
(shallow
subtidal/
intertidal
shoal)
Skeletal
grainstone-
packstone
(high-energy
bank,sh
eet,
andsh
oal)
Skeletalwackestone-
packstone(m
oderately
shallow
subtidal
alongthedowndip
margin
oftidalflats
orlow-energytidal
channel)
Burrowedmuddy
carbonates:
lime
mudstoneto
skeletal
wackestone-floatstone,
dolomudstone/w
ackestone
(low-energysu
btidal)
Thickness
and
stratigraphic
occurrence
0.1–5
mthick
unitscommonly
interbedded
with
dololaminite;
onlapsor
pinchesout
against
tidal
flatunits
Units2–3
to30cm
thickoccuratbases
ofsomesh
allowing-
upward
cycles;
associatedwith
pyritized
hardgroundsat
MFS,orlaminites
inlate
HST
0.05–7
.50m
thickunitsoccurin
HSTsofsequences
RR1-RR3or
interbeddedwith
anhydrite
inLSTs
Units0.1–1
.20
mthick
30–4
0cm
thick
unitsoccur
only
inlate
HST
of
sequenceRR1
andlatest
LST
ofRR2
Units0.1–
1.20m
thickoccur
throughoutsections;
absentin
sequence
SM1
0.15–2
.0m
units
commonly
capburrowed
muddycarbonatesin
sequencesRR0andRR1
Units0.15–7
.50m
thick
occurthroughout
sections;
predominate
inTST
ofsequences
RR1–R
R3
Colour
Whiteto
dark
grey
Dark
grey
Alternationof
lightgreyand
dark
greylaminae
Lightto
dark
grey
Dark
grey
Brownto
dark
grey
Brownorbrownwith
greymottlesifburrowed
Colourmottling:lighter,
brown(m
atrix),anddarker,
greymottles(burrows)
Sedim
entary
structures
Massiveto
nodularwith
chicken-w
ire
fabric,flat
lamination,
less
common
convolute
laminae
Sharp
base
and
gradationaltopin
subtidalsetting;
laminationin
intertidal
Wavyandflat
lamination,
desiccation
cracks;
anhydrite
nodulesand
crystallaths,
rare
silicified
nodules
Cryptalgal
clotted
structure
lacking
lamination
Structureless
Structureless
Structureless
orburrowed;
rare
cross-
lamination
Extensivebioturbation
(burrow
mottling),
abundantpyrite
staining
onhardgrounds,
common
stylolitesandwispy
kerogenousseams,
nodular
fabric,anhydrite
crystals,
rare
mudcracks
Depositional
texture
and
grain
types
Anhydrite
nodulesfrom
5mm
toseveral
centimetresin
diameter
Severalmillimetreto
centimetre-long
angularclasts
ingrainstone
matrix.Intraclasts
reworkedfrom
tidalflats
orsh
allow
offsh
ore
areas
Poorlysorted,
mudto
granule-
sized.Skeletal
grains,
rare
intraclasts
Millimetreto
centimetre-scale
micrite
clots
surrounded
byskeletal
mudstone
towacke-
packstone
Well-sorted,
medium
tocoarsesand-
sizeooids
Rangefrom
well-sorted
topoorlysorted,fine
sandto
granule-sized.
Skeletalfragments,
scarceintraclasts
Poorlysorted,
mudmatrix
withsand-
sizedto
rare
granule-
sizedgrains.
Skeletalfragments,
scarceintraclasts
Poorlysortedmudswith
finesandto
granule-sized
grains.
Skeletalfragments,
rare
micrite
intraclasts
Biota
None
None
Calcified
cyanobacteria
(Girvanella?),
rare
ostracods
andbrachiopods
Calcified
cyanobacteria,
crinoids,
brachiopods,
corals
None
Commoncrinoids,
brachiopods,
gastropods,
corals,less
common
ostracodsandbryozoans
Commoncrinoids
andbrachiopods,
less
commongastropods,
bryozoansandgreen
algae
Commonbrachiopods,
crinoids,
trilobites,
less
commoncorals,ostracods
andgreenalgae,
scarcebryozoans
MFS,maxim
um
floodingsu
rface;HST,highstandsystemstract;LST,lowstandsystemstract;TST,transgressivesystemstract.
© 2014 The Authors. Sedimentology © 2014 International Association of Sedimentologists, Sedimentology, 62, 314–349
320 A. Husinec and S. M. Bergstr€om

–1 0–3 –2δ13C (‰ VPDB)
1 2D
epth
m (f
t)
Min
eral
com
posi
tion
Stru
ctur
esTe
xtur
e &
gr
ain
type
Cyc
le to
p
M GPW R
T
13300
13350
13400
13450
13500
4100
4080
4090
4070
4060
4050
4110
PyPy
Py
Py
I
II
III
IV
V
VI
VII
VIII
Sequ
ence
RR
3Se
quen
ce S
M1
Sequ
ence
RR
2Se
quen
ce R
R1
MFS
MFS
MFS
MFS
HST
HST
HST
TST
TST
LST
LST
LST
TST
HST
TST
δ13C
-der
ived
sy
stem
s tra
cts
TST
TST
HST
HST
HST
?
?
LST
LST
LST
Fig. 4.
© 2014 The Authors. Sedimentology © 2014 International Association of Sedimentologists, Sedimentology, 62, 314–349
Carbon-isotope record of an epicratonic basin 321

especially on gamma ray logs, where they arecharacterized by a slightly positive excursion.These excursions are probably due to the pres-ence of a very thin shale bed overlying the anhy-drite. The shale was not recovered from any ofthe studied cores, so it can only be speculated ifit represents an aeolian silt at the top of allobserved LST deposits; alternatively, it can beinterpreted to have been formed during initialinvasion of marine waters into the shallow hy-persaline Williston Basin during regional relativerises in sea-level (Weber et al., 1995). Actualmaximum flooding surfaces were difficult tolocate in any of the cores and could only arbi-trarily be picked based on broad characteristics,for example, above upward-decreasing andbelow upward-increasing shallow-water facies,beneath skeletal grainstones-packstones cappingburrow-mottled muddy carbonates, or aboverepeated pyrite-encrusted hardgrounds.
Dolomite petrography andcathodoluminescence
Given the abundance and distribution of dolo-mite within the Red River Formation (Figs 4 to6), to use the bulk carbonate matrix at 30 to90 cm intervals for carbon and oxygen stableisotope analysis, both muddy limestone andlaminated dolomite were sampled. To betterunderstand the Red River dolomite diagene-
sis, its petrography is summarized below, andaugmented with petrographic and cathodolumi-nescence (CL) observations reported herein.Unlike the laminated members that are dolo-
mitized pervasively, the burrowed members ofthe Red River Formation exhibit a complex andregionally discontinuous pattern of dolomitiza-tion (Kendall, 1976; Longman et al., 1983; Holm-den, 2009). Most commonly, as is the case in thestudy area, the burrows are dolomitized and thematrix is not; however, in other parts of the Will-iston Basin, both the burrows and the matrix canbe dolomitized, or they both remain as limestone(Kendall, 1976; Longman et al., 1983; Neese,1985; Canter, 1998; Qing et al., 2001; Gingraset al., 2004). Dolomite is predominantly replaciveand in laminated members occurs as non-planar,bimodal (5 to 50 lm) crystals in completely do-lomitized intervals, or as 25 to 50 lm rhombsfloating in lime mudstone or associated with styl-olites (Zenger, 1996). In burrowed members, dolo-mite is composed of 20 to 160 lm, primarily non-planar crystals in the largely replaced burrowfills. It also occurs as crystals disseminated alongstylolites, or less commonly as large crystalsreplacing echinoderm fragments, or as late-stage,void-filling saddle dolomite (Zenger, 1996). In thestudied area, the two types of dolomite make upthe bulk of the dolomite succession: aphanocrys-talline to finely crystalline tidal-flat dolomite andfinely to medium crystalline burrow-fill dolomite.
Fenestrae (irregular and tubular)
SEDIMENTARY STRUCTURESMINERAL COMPOSITION
PARASEQUENCEINTERPRETATION
Planar laminationMicrobial lamination
Sharp, planar contactBurrows
Scoured contactBurrowed hardgroundErosional contactDesiccation cracksNodular fabric
Silicified nodule
Millimetre-thick kerogenous laminae
Thrombolite
GRAIN TYPES
OoidPeloid
Intraclast
Ostracods
Bryozoan
Coral
CrinoidBrachiopod
Trilobite
Pyrite
Gastropod
Py
Anhydrite needles/lathsSi
T
Breccia (supratidal)Shale
Anhydrite
Dolomite
Limestone
Pore space
Upward shallowing
Upward deepening
FACIES
Microbial and planarmicrobial laminites (tidal flat)
Skeletal packstone and grainstone (shoal-water)
Skeletal wacke-packstone(moderately shallow subtidal)
Burrowed skeletal mudstone-wackestone ("deeper" subtidal)Kerogenous limestone (deeper shelf withstratified water column)
Ooid grainstone (tidal bars and channels)
Anhydrite (supratidal, subaqueous)
Fig. 4. Detailed stratigraphic column of core #9800 (Simpson #1, Williams County, North Dakota) showing min-eral composition, sedimentary structures, Dunham rock types, parasequences and long-term depositionalsequences. Upward-deepening units are shown by upward-narrowing triangles; upward-shallowing units areshown by upward-widening triangles. TST = transgressive systems tract, MFS = maximum flooding surface,HST = highstand systems tract, LST = lowstand systems tract. Carbon-isotope curve, carbon-isotope stages (Romannumerals) and d13C-derived systems tracts are on the right side of the figure. For well location, see Fig. 1.
© 2014 The Authors. Sedimentology © 2014 International Association of Sedimentologists, Sedimentology, 62, 314–349
322 A. Husinec and S. M. Bergstr€om

–1 0δ13C (‰ VPDB)
1 2
Dep
thm
(ft)
Min
eral
com
posi
tion
Stru
ctur
esTe
xtur
e &
gr
ain
type
Cyc
le to
p
M GPW R
13800
13850
13900
13950
14000
4250
4240
4230
4220
4210
4200
4260
T
T
T
T
T
TT
TT
Py
Py
Py
Py
Py
v
Py
Py
I
II
III
IV
?
Sequ
ence
RR
2R
R3
Sequ
ence
RR
1Se
quen
ce R
R0
MFS
HST
HST
LST
LST
TST
Fig. 5. Detailed stratigraphiccolumn of core #9103 (Federal#10-1, Dunn County, North Dakota)showing mineral composition,sedimentary structures, Dunhamrock types, parasequences and long-term depositional sequences.Upward-deepening units are shownby upward-narrowing triangles;upward-shallowing units are shownby upward-widening triangles.TST = transgressive systems tract,MFS = maximum flooding surface,HST = highstand systems tract,LST = lowstand systems tract.Carbon-isotope curve and carbon-isotope stages (Roman numerals) areon the right side of the figure. Forkey to symbols, see Fig. 4. For welllocation, see Fig. 1.
© 2014 The Authors. Sedimentology © 2014 International Association of Sedimentologists, Sedimentology, 62, 314–349
Carbon-isotope record of an epicratonic basin 323

–2 –1 0δ13C (‰ VPDB)
1 2
Dep
thm
(ft)
Min
eral
com
posi
tion
Stru
ctur
esTe
xtur
e &
gr
ain
type
Cyc
le to
p
δ13C
-der
ived
sy
stem
s tra
cts
M GPW R
?
10350
10300
10250
10200
10150
10100
3130
3120
3110
3100
3090
3080
3070
3140
3150
v
v
v v
v
Py
Py
I
II
III
IV
V
VI
VII
VIII
Sequ
ence
RR
3Se
quen
ce S
M1
Sequ
ence
RR
2Se
quen
ce R
R1
Sequ
ence
RR
0
MFS
MFS
MFS
MFS
HST
HST
HST
HST
LST
LSTTST
TST
TST
TST
TST
TST
TST
HST
HST
HST
HST
?
LST
LST
LST
Fig. 6. Detailed stratigraphiccolumn of core #8010 (UrlacherState #1, Hettinger County, NorthDakota) showing mineralcomposition, sedimentarystructures, Dunham rock types,parasequences and long-termdepositional sequences. Upward-deepening units are shown byupward-narrowing triangles;upward-shallowing units are shownby upward-widening triangles.TST = transgressive systems tract,MFS = maximum flooding surface,HST = highstand systems tract,LST = lowstand systems tract.Carbon-isotope curve, carbon-isotope stages (Roman numerals),and d13C-derived systems tracts areon the right side of the figure. Forkey to symbols, see Fig. 4. For welllocation, see Fig. 1.
© 2014 The Authors. Sedimentology © 2014 International Association of Sedimentologists, Sedimentology, 62, 314–349
324 A. Husinec and S. M. Bergstr€om

Tidal-flat dolomite (Fig. 7A to D) makes up thebulk of the laminated members in the study area.This early diagenetic replacement dolomitereplaces tidal-flat, microbial lithofacies and formsporous replacement mosaics of interlocking ap-hanocrystalline to finely crystalline dolomites (<1to 30 lm). Individual crystals are anhedral to sub-hedral, relatively clear to slightly hazy withoutzonation. Lamination is best visible in polishedcores, while in thin sections, it is vaguely dis-cernible as fine alternation of millimetre-scalelaminae with different dolomite crystal sizes.Cathodoluminescence imaging yields the darkorange to red colour of these dolomites.Fine to medium crystalline (2.5 to 80 lm) dolo-
mite replaces the burrow-fill lithofacies (mostlyskeletal wackestone, less commonly packstone)of the burrowed members (Fig. 7E to H). The do-lomitized burrows show relatively sharp burrow-matrix boundaries, resulting in a clear burrow-mottled fabric. Elsewhere, these boundaries areless sharp, exhibiting thin dolomitized haloessurrounding the burrows, with floating, isolatedfine dolomite crystals decreasing in abundancefrom dolomitized burrows into the non-burrowedmicrite matrix. These relatively ‘dirty’ crystals aresubhedral to euhedral. These dolomites exhibit adark orange to red cathodoluminescence coloursimilar to tidal flat dolomite. Locally, zoned crys-tals with dark, cloudy nuclei and clear rims arevisible in plain polarized light. Under cathodolu-minescence, these crystals show somewhatbrighter rims and darker orange to red cores(Fig. 7F and H).Other dolomite types are subordinate and
comprise only a minor fraction of the entiredolomite succession. These include medium-grained dolomites that are associated mostlywith stylolites, voids and minor fractures, andcoarse-grained zoned euhedral dolomite that israrely found in localized larger voids.
Carbon-isotope chemostratigraphy
In this paper, the stable carbon-isotope signal issplit into stages to facilitate discussion and
enable correlation with the North Americancarbon-isotope stratigraphy in the RichmondianStage (Bergstr€om et al., 2010c). Stable carbon-isotope stages (Table 2) are identified based onpositive excursions, shifts from positive to nega-tive values and relatively uniform values. Toavoid confusion with depositional sequences (0to 3) and the production interval (D to A) termi-nology, the stable carbon-isotope stages arelabelled with Roman numerals, and aredescribed below for each of the cores used inthis study.
Simpson #1 (#9800; Williams County)Stage I represents an interval of relatively uni-form to gently decreasing d13C values between1.0& and �1.0& (Fig. 4). It is followed by apronounced increase from �1 to +1& (stage II),while the overlying stage III shows stepwisedecreasing values to �1&. The subsequentstage IV is characterized by a stepwise increasein carbon-isotope values up to value of 2.1&.Stage V is defined by a rapid decreasing trendtowards d13C values near �2.5&. During subse-quent stage VI, the carbon-isotope valuesincrease stepwise to 1.1&; the increase is inter-rupted by a negative spike (�1.3 to �3.1&)below the stage top. The overlying stage VII ischaracterized by a stepwise decrease towardsd13C values near �2.8&. In the topmost partof the section, the basal part of stage VIII exhi-bits an increase in carbon-isotope values to�0.9&.
Federal #10-1 (#9103; Dunn County)An interval of relatively uniform d13C valuesscattered from �0.4 to 1.1& characterizes stage I(Fig. 5). The overlying stage II shows a rapidincrease from 0.1 to 1.1&. The d13C value trendsfor stage III and the lower part of stage IVremain unknown due to lack of core material.The upper part of sampled stage IV is characte-rized by an increase in d13C values from 0.3 to1.7&; this is also the topmost cored intervalthrough the Red River Formation from the Fed-eral #10-1 well.
Figure 7. Paired plane light (left) and cathodoluminescent (right) photomicrographs of the main dolomite typesof the Red River Formation. (A), (B), (C) and (D) Crinkly laminated dolomudstone (microbial dololaminite), B lam-inated member. Note the wispy dark laminae representing remains of organic matter forming microbial mats. Thedolomite exhibits replacement mosaics composed of non-zoned, aphanocrystalline to finely crystalline non-planarand planar-s crystals exhibiting dark orange to red luminescence. (E), (F), (G) and (H) Finely to medium-grainedplanar-s dolomite replacing burrow fill in lime mudstone (E) and (F) and skeletal wackestone (G) and (H) matrix.Contact between burrow fill (b) and matrix (m) is marked by dashed lines. Note the similar dark orange to red ca-thodoluminescence colour of burrow fill as in tidal-flat dolomite, and non-luminescent to deep red micrite matrix.
© 2014 The Authors. Sedimentology © 2014 International Association of Sedimentologists, Sedimentology, 62, 314–349
Carbon-isotope record of an epicratonic basin 325

500 μm 500 μm
500 μm 500 μm
500 μm 500 μm
500 μm 500 μm
A B
C D
E F
G H
m
m
m
b
b
m
m
m
b
b
© 2014 The Authors. Sedimentology © 2014 International Association of Sedimentologists, Sedimentology, 62, 314–349
326 A. Husinec and S. M. Bergstr€om

Urlacher State Unit #1 (#8010; HettingerCounty)An interval of relatively uniform d13C valuesbetween 0& and +1.5& characterizes stage I(Fig. 6). This trend is interrupted by a positiveshift from 0& and +1.5& in the upper part of thestage; such a pronounced positive shift has notbeen identified in the other two cores. In the over-lying stage II, the d13C values increase up-sectionfrom 0 to +1.5&, while stage III shows stepwisedecreasing values to �0.7&. Stage IV begins witha sharp increase to ca +1.4&, followed by asequence of relatively uniform values of between+0.7 and +1.1& and a peak of 1.4& at the top.Stage V is characterized by a rapid decrease to�2.1&, the lowest d13C value recorded from theSimpson #1 core. An increase towards �0.1&,interrupted by a negative spike (�0.2 to �1&)below the top characterizes stage VI. During sub-sequent stage VII, carbon-isotope values decreaseto �1.9&. In the overlying stage VIII, carbon-iso-tope values continuously increase, reaching themaximum value of +0.8& at the very top of thesampled interval, which is in the lowermost partof the Stony Mountain Formation.
Stable oxygen isotopes
Stable oxygen-isotope values of limestonerange between �8.0& VPDB and �3.8& VPDB,
and between �6.8& VPDB and �3.9& VPDBin dolomite (Fig. 8). The mean d18O value forlimestone is �6.1& VPDB. The mean value foroxygen isotopes of dolomite whole rock sam-ples is �4.9& VPDB, i.e. on average dolomitesare 1.2& heavier than limestones. The moderndolomite and calcite forming beneath the sab-khas of the United Arab Emirates have anequilibrium fractionation factor (Dd18Odol-cal) of3.2& VPDB at ca 35°C (McKenzie, 1981).Vasconcelos et al. (2005) proposed a slightlylower Dd18Odol-cal value of 2.6& for dolomiteand calcite that formed from isotopically simi-lar fluids at similar temperatures. Thus, asmall positive shift in oxygen-isotope valuesbetween dolomite and limestone suggests thatthe dolomites picked up lighter signature dueto burial at great depth (3 to 4 km). The effectsof late burial diagenetic alteration are alsosuggested by significantly lower values thanOrdovician oxygen-isotope values based onvalid marine proxies (translucent fibrouscalcite, marine equant calcite and bladed cal-cite) which range between �5.8& VPDB and�2.5& VPDB (Tobin & Walker, 1997). Conse-quently, the oxygen-isotope values are notused and discussed in the present paper tofacilitate correlation between the studied wells,or to evaluate the Late Ordovician sea watervalues.
Table 2. Upper Katian carbon-isotope stages, Williston Basin, North Dakota, USA.
C-isotopestage C-isotope trend
C-isotope shiftamplitude(& VPDB)
Intervalthickness(m) Lithostratigraphic unit
VIII Pronounced positive shift 2.7 >5 Red River Formation to Stony MountainFormation transition
VII Stepwise negative shift 1.8–3.9 2.1–8.1 Upper A interval
VI Pronounced positive shiftinterrupted by a negativespike (up to 2&) below thestage top
2–3.6 5.5–12 Lower A interval
V Sharp negative shift 3.5–4.6 5.2–7 Uppermost B laminated member tolowermost A interval
IV Pronounced positive shift 2.1–3.1 4–13.4 B burrowed member to B laminated member
III Stepwise negative shift 2–2.2 10.7–11.9 Uppermost C laminated member to Bburrowed member
II Pronounced positive shift 0.8–2 2.1–6.4 Upper C laminated member
I Relatively uniform values ofbetween �1& and 1.5&
– >48 Upper C burrowed member to lower Claminated member
© 2014 The Authors. Sedimentology © 2014 International Association of Sedimentologists, Sedimentology, 62, 314–349
Carbon-isotope record of an epicratonic basin 327

INTERPRETATION AND DISCUSSION
The potential effect of local environmentalchanges on stable carbon-isotope values
Carbon-isotope values of shallow-marine carbo-nate sediments are influenced by a number ofeffects, including taxonomic variation, diagene-sis, carbonate mineralogy, as well as taphonomicprocesses, and thus should be used cautiouslyand in combination with additional sedimento-logical and palaeontological data for strati-graphic interpretations (Gischler et al., 2009;Oehlert et al., 2012). Use of the d13C record forcorrelation purposes presumes that these valuesretain the original sea water d13C value recordedfrom an isotopically homogenous portion of theocean that is consistent between basins (e.g.Panchuk et al., 2005, 2006; Swart & Kennedy,2012). Due to rapid mixing of carbon within theatmosphere and the ocean surface layer, anddue to exchange between these two carbon reser-voirs, a change in carbon cycle affects the d13Ccomposition of dissolved inorganic carbon (DIC)in the pelagic surface ocean, which is in turnreflected in d13C values of pelagic carbonatesprecipitated from the sea water (Panchuk et al.,2005). An increase in d13C typically results froman increased production and/or burial of organicmatter, while a decrease reflects increased oxi-dation of organic matter and less organic carbonburial (e.g. Veizer & Hoefs, 1976; Schidlowski,1979; Shackleton & Pisias, 1985; Oehlert et al.,
2012). The Ordovician marine d13C record canbe obtained from the bulk carbonate matrix, cal-cite cement or larger skeletal organisms (forexample, brachiopods). However, the studies ofmodern shallow-marine carbonates have shownthat their d13C signature can be very differentfrom, and show no relation with, the variationsin the d13C values of the DIC in the oceans; theplatform d13C record may be either drasticallydepleted (for example, Florida Bay: Loyd, 1964;Patterson & Walter, 1994) or enriched (for exam-ple, the Bahamas: Swart & Eberli, 2005; Swartet al., 2009) with respect to their pelagic equiva-lents. The variations in d13C profiles have alsobeen described for Ordovician epeiric sea car-bonates from different locations (e.g. Ludvigsonet al., 1996, 2004; Patzkowsky et al., 1997; Pan-chuk et al., 2005, 2006; Immenhauser et al.,2008; Ainsaar et al., 2010). These geographicalvariations in the d13C geochemical signature ofepeiric carbonates often reflect restricted seawater circulation in combination with localenvironmental influences (e.g. Panchuk et al.,2005, 2006; Oehlert et al., 2012). Similar tolacustrine carbonates, the negative values ofd13C of epeiric sea carbonates may result fromwater inflow containing dissolved CO2 fromolder rocks, or from respiration processes orhydrosphere to atmosphere CO2 exchange;enrichment in d13C may indicate photosynthesisduring increased basin closure and long waterresidence time (Sarg et al., 2013). Given that theWilliston Basin was periodically isolated from
3·00DolomiteLimestone
2·00
1·00
0·00
–1·00
–9·00 –8·00 –7·00 –6·00 –5·00 –4·00 –3·00
–2·00
–3·00
–4·00δ18O [‰ VPDB]
Ordovician marine calcite cements
δ13C
[‰ V
PDB]
Fig. 8. Carbon and oxygen isotopiccomposition for samples from allthree sampled cores. The blackrectangle marks values ofOrdovician marine calcite cementsfrom Tobin & Walker (1997).
© 2014 The Authors. Sedimentology © 2014 International Association of Sedimentologists, Sedimentology, 62, 314–349
328 A. Husinec and S. M. Bergstr€om

the open ocean, it is possible that the carbonatesthat precipitated from such a large body ofrestricted water mass have unique, inherentlydifferent isotopic composition from that of theopen ocean (Swart & Eberli, 2005).It is generally accepted that photosynthetic
processes increase the d13C value of skeletal car-bonate precipitated by different organisms (e.g.Cummings & McCarthy, 1982; Swart, 1983;McConnaughey, 1989; Swart et al., 2009). InWilliston Basin, the highest d13C values charac-terize tidal-flat dololaminites (C and B laminatedmembers below regional anhydrites; Figs 4 to 6).These laminites formed during the late sea-levelhighstand, when aggradation along the basinmargins resulted in basin restriction, long waterresidence time and subsequent progradation oftidal flats across the basin. Efficient photosyn-thetic activity by flourishing cyanobacteria couldhave enriched surface water with respect to 13C,which then was incorporated in the inorganiccarbonate (cf. Sarg et al., 2013), and resulted inpositive excursions in d13C values recorded intop C and B laminite members.The d13C values of marine algal carbonate
reflect phylogenetic and ontogenetic changes in
photosynthesis that are reflected in the d13Cvalue of the calcifying fluid due to modificationof the photosynthesis/respiration ratio (Lee &Carpenter, 2001). The calcareous green algae areabundant within the C and B burrowed mem-bers of the Red River Formation, the latter withCodiacean Dimorphosiphon being the major car-bonate sediment producer (Rendall & Husinec,2012). The d13C values from the three studiedsections vary between �0.3& and +1.1& for theC burrowed member and between �0.8& and+1.2& for the B burrowed member (Figs 4 to 6),and are overall heavier than the mostly negativevalues recorded from the coeval successions ofthe Cincinnati region, USA (Fig. 9). Thissuggests that the significant carbonate produc-tion by Codiaceans could have affected the d13Cvalues of the Williston Basin, and resulted inisotopically slightly enriched DIC comparedwith the coeval bryomol-dominated, temperate-water carbonate intervals from the mid-conti-nent, the latter are also affected by an enhancedinflux of dissolved organic carbon with low d13Cvalues from rivers and coastal wetlands alongthe Transcontinental Arch (Panchuk et al.,2006).
0
15 m
0 1–2 –1
δ13C (‰ VPDB)2
KAT
IAN
MID
DLE
R
ICH
MO
ND
IAN
L.
RIC
HM
ON
DIA
N
SILURIANW
HIT
EWAT
EREL
KH
OR
N U
ND
IFF.
WAY
NES
VILL
E6
C5
CLI
BER
TYAph
elog
nath
us o
rdov
icic
us
ELKHORN
WHITEWATER
ELKHORN
–2 –1 0
δ13C (‰ VPDB)
#8010, Hettinger Co., North Dakota Cincinnati region, composite section#9800, Williams Co., North Dakota #9103, Dunn Co., North Dakota
1 2–1 0
δ13C (‰ VPDB)1 2–1 0–3 –2
δ13C (‰ VPDB)1 2
I
II
III
IV
V
VI
VII
VIII
RR
1R
R2
“B”
Inte
rval
“C”
Inte
rval
“A”
Inte
rval
RED
RIV
ER
RR
3
STO
NY
MTN
SM1
2R
R1
RR
RR
0“B
” In
terv
al“A
” In
terv
al“C
” In
terv
alR
ED R
IVER
RR
1R
R0
RR
2“B”
Inte
rval
“C”
Inte
rval
“A”
Inte
rval
R
ED R
IVER
RR
3
STO
NY
MTN
SM1
??
?
? ?
?
?
?
Fig. 9. Correlation of carbon-isotope curves of studied Red River cores and proposed correlation with Cincinnatiregion. Roman letters indicate carbon-isotope stages identified in this study. Cincinnati positive d13C excursions(Bergstr€om et al., 2007, 2010d) are on the right side of figure.
© 2014 The Authors. Sedimentology © 2014 International Association of Sedimentologists, Sedimentology, 62, 314–349
Carbon-isotope record of an epicratonic basin 329

Diagenetic overprints
Petrographic evidence from the sampled lami-nated and burrowed Red River members, includ-ing fine crystal size and lack of zoning, suggestsan early, replacive origin for the bulk of thedolomite. Medium-grained dolomites that areassociated mostly with stylolites, voids andmicro-fractures are late diagenetic and formedafter burial at medium depths, probably between500 m and 1500 m (cf. Machel, 1999; Mountjoyet al., 1999). The dolomitization is thorough inthe laminated members and decreases down-wards in the burrowed members, away from theanhydrite members. This suggests that a refluxof dense hypersaline brines associated withevaporative drawdown lead to a penecontempo-raneous replacement of mud in tidal flats andporous burrows of the underlying burrowedlimestone by finely crystalline dolomite. Theearly, replacive dolomitization of the tidal flatfacies resulted in abundant intercrystallineporosity of the Red River laminated members.This initial porosity and permeability have beenwell-preserved and suggest that the tidal flatfacies has not been extensively modified by bur-ial dolomitizing fluids that would have trans-formed porous and permeable early diageneticdolomites into non-porous dolomite mosaics oftightly interlocking crystals (cf. Montanez,1997). Porous intervals are isolated stratigraphi-cally from one another by impermeable anhy-drite beds that also acted as permeabilitybarriers to dolomitization. Anhydrite laths andneedles also occur in the underlying porous sed-iments. In the samples studied, there is no evi-dence of dolomite replacing these minerals,which further suggests that the system musthave been effectively sealed by the evaporitesthat prevented the excessive fluid flow neededfor extensive burial dolomitization (cf. Melim &Scholle, 2002). Thus, the vertical stacking of theRed River units produced a stratified three-dimensional network with three major aquitards(anhydrite members) bracketing fluid flow con-duits (burrowed and laminated members).Cathodoluminescence evidence suggests a
similar dolomitization history for both sampledburrowed and laminated dolomite. The darkorange to red luminescence colour of these dol-omites under the operating conditions suggeststhe presence of Mn2+ and Fe3+ in the burialfluids, although many other elements can alsopotentially serve as activators and quenchers ofCL in carbonates (e.g. Machel & Burton, 1991).
The Mn2+ and Fe3+ can substitute Ca2+ in thecarbonate lattice, but are mobile only underreducing conditions (Garrels & Christ, 1965).Thus, they are suggestive of diagenetic stabiliza-tion within a burial diagenetic environment, orreducing conditions associated with bacterialsulphate reduction in microbial mats (cf. Banneret al., 1988; Moore et al., 1988); the latter is sug-gested by the local presence of disseminatedpyrite in tidal flat facies (cf. Montanez & Read,1992). The uniform, non-patchy luminescence ofboth laminated and burrow-fill dolomite mightalso suggest their early diagenetic origin (cf. To-bin & Walker, 1997).Carbon-isotope values from valid Ordovician
marine proxies appear to range between 0&VPDB to 3& VPDB (Tobin & Walker, 1997). Therange in the d13C composition of the Red Riverlimestone and dolomite is slightly greater(�3.0& VPDB to 2.1& VPDB) which couldreflect diagenetic alteration (e.g. Allan & Mat-thews, 1977; Lohmann, 1988; Immenhauseret al., 2003; Swart & Eberli, 2005). It is impor-tant to stress that both dolomite and limestonefrom the study area have similar d13C values(Fig. 8), suggesting that carbon was rock buf-fered, and thus apparently could represent theoriginal marine d13C record. In addition, therange of the Red River d13C values is within the5& range of modern pore water variation (Pat-terson & Walter, 1994), and thus requires noinput of external sources of carbon (cf. Melim &Scholle, 2002). The values extending into thelower left quadrant (Fig. 8) probably have beenreset either by early diagenetic bacterially medi-ated sulphate reduction (cf. Sass et al., 1991;Chafetz et al., 1999), or by late burial fluids,including input of depleted carbon from hydro-carbons (Anderson & Arthur, 1983). There areseveral shifts to low d13C values that exceed2.0& VPDB between vertically adjacent samples(Figs 4 to 6). Such shifts to negative values arecommon both in ancient limestone and dolomite(e.g. Curtis et al., 1972; Kaufman et al., 1993;Vahrenkamp & Swart, 1994; Chafetz et al., 1999;Railsback et al., 2003), where they presumablyoccur due to either diagenesis associated withdescent of meteoric water beneath a soil horizonand subsequent interaction with the hostcarbonate strata, or diagenesis associated withbacterially mediated sulphate reduction ofextensive microbial mats in sabkha-type dolo-mites (Chafetz et al., 1999). However, typicalnegative shifts in modern carbonates associatedwith subaerial exposure are much greater (6 to
© 2014 The Authors. Sedimentology © 2014 International Association of Sedimentologists, Sedimentology, 62, 314–349
330 A. Husinec and S. M. Bergstr€om

8& VPDB; Allan & Matthews, 1977, 1982) thanthose from the studied succession. Similar tothe Triassic Latemar platform in the Dolomites(Christ et al., 2012), it is very likely that mete-oric diagenesis is not responsible for negativeshifts in d13C values of the Red River Formation,as neither evidence for the existence of soils norevidence to associated negative d13C shifts tosubaerial exposure has been recognized in thestudied cores. The abundant evaporites alsoimply an arid and warm climate not supportiveof vegetation cover that could have supplieddepleted carbon isotopes from soil to the under-lying carbonates. Furthermore, the overall d13Cvalues for laminated dolomite are higher thanthose from the overlying anhydrites (from whichthin dolomitic interbeds were sampled) (Figs 4to 6), suggesting that following dolomitization,the tidal-flat laminite probably was not sub-jected to extensive diagenesis in contact withmeteoric waters.Some of the pronounced (>2& VPDB) negative
excursions occur near hardgrounds or pyriticcrusts, and could be related to bacterial sulphatereduction either within benthic euxinic watersor in shallow-marine phreatic pore fluids at thesediment–water interface (Swart & Melim, 2000;Ludvigson et al., 2004; Dickson et al., 2008;McLaughlin et al., 2011). The negative excur-sions occur at the boundaries between d13C seg-ments VI to VII and VII to VIII in well #9800(Fig. 4), and at the base of the A interval (withinC-segment V) in well #8010 (Fig. 6). Theseexcursions suggest that some of the negativespikes could be related to (or possibly accentu-ated by) local flooding events accompanied byeuxinic waters, and thus do not reflect the con-temporaneous oceanic carbon-isotope signal (cf.Ludvigson et al., 2004). However, both hard-grounds and pyritic crusts are relatively abun-dant within the studied succession, and most ofthem do not show significant negative excur-sions on the d13C curve. This may also be a rem-nant of a relatively spaced sampling interval(3 ft or ca 90 cm); much denser samplingaround these intervals would yield a moredetailed d13C signal and probably more clues totheir driving mechanism.To summarize, petrographic and cathodolu-
minescence evidence, coupled with a stable iso-tope record, suggests an early diagenetic originof the sampled dolomite, with diagenetic stabi-lization under non-oxidizing conditions and thepresence of isotopically more negative burialfluids, probably prior to burial at medium
depths. The lack of major burial overprint andporosity-occluding overdolomitization (Morrow,1982; Lucia & Major, 1994) could have beencaused by the presence of thick anhydrites thatacted as permeability barriers to vertical flow ofburial fluids. This flow may also have beenimpeded by abundant bedding-parallel stylolitesand dissolution seams, similar to the majorLower Cretaceous reservoirs of the United ArabEmirates where the lower porosity and perme-ability values are found associated with thewell-developed stylolites (Alsharhan & Sadd,2000).
Intrabasinal correlation
The three middle to upper Richmondian sec-tions from North Dakota exhibit several similari-ties in the stratigraphic position and magnitudeof d13C stages (Fig. 9). All of these sections showthe highest d13C values in C and B laminatedmembers, and two of the three studied sectionsexhibit minimum values in the A interval (the Ainterval from section #9103 has not been cored).Relative uniformity or a gentle decrease in stablecarbon-isotope values characterizes d13C stage Ithat corresponds to the upper C burrowed andthe lower C laminated members. Three minorpositive d13C excursions can be identified, fromoldest to youngest: (i) d13C stage II is registeredin all three cores within the upper C laminatedmember; (ii) d13C stage IV is also registered inall three cores. Its stratigraphic span variesslightly (upper B burrowed to B laminated in#9800, B burrowed to B laminated in #8010,incomplete record for #9103), but the peak iswithin the B laminated member; and (iii) d13Cstage VI is registered within the lower part ofthe A interval in cores #9800 and #8010; no corewas available from well #9103. These positiveexcursions could be related to local oceano-graphic conditions within the Williston Basinepeiric sea, presumably reflecting one or moreprocesses, including increased organic produc-tivity, increased organic carbon sequestration,changes in relative abundance of different com-ponents in organic matter, or enhanced preser-vation of organic carbon caused by marineanoxia (e.g. Weissert, 1989; Derry et al., 1992;Brasier et al., 1994; Calvert et al., 1996; Glumac& Walker, 1998; Jenkyns et al., 2002); they alsomay represent regional events across the LateOrdovician western passive continental marginof North America, and are potentially useful forcorrelation.
© 2014 The Authors. Sedimentology © 2014 International Association of Sedimentologists, Sedimentology, 62, 314–349
Carbon-isotope record of an epicratonic basin 331

Extrabasinal correlation
The Late Ordovician is characterized by twomajor shifts to positive d13C values; the earlyKatian Guttenberg and the Hirnantian excur-sions. In North America, the Guttenberg excur-sion ranges from the uppermost Phragmodusundatus Midcontinent Conodont Zone to nearthe top of the Plectodina tenuis MidcontinentConodont Zone. Its cause of formation is stillenigmatic (Bergstr€om et al., 2010c, 2014). TheHirnantian excursion begins in the topmostParaorthograptus pacificus graptolite Zone (topof Amorphognathus ordovicicus Conodont Zone)and ends in the lower Normalograptus persculp-tus Graptolite Zone (Bergstr€om et al., 2010c, andreferences therein). The Hirnantian positive shiftmost probably reflects an enhanced ocean circu-lation that increased productivity and sequestra-tion of organic carbon (Brenchley et al., 1994),or increased weathering of carbonates duringeustatically driven sea-level fall (Kump et al.,1999). Besides the Guttenberg and the Hirnan-tian, five positive d13C excursions have beenidentified in the Upper Ordovician between theGuttenberg and the Hirnantian excursions (Ain-saar et al., 2004, 2010; Kaljo et al., 2004; Berg-str€om et al., 2007, 2010a).In North America, Bergstr€om et al. (2007,
2010d) recognized the following positive d13Cexcursions, from oldest to youngest: Kope(upper Diplocanthograptus spiniferus to Genicu-lograptus pygmaeus Graptolite Zones; substan-tial part of Belodina confluens Conodont Zone),Fairview (poorly controlled by graptolites,excursion near the base of Amplexograptusmanitolinensis Graptolite Zone; mostly withinupper part of Oulodus velicuspis ConodontZone); Waynesville (upper part of Amplexograp-tus manitolinensis Graptolite Zone; lower part ofAmorphognathus ordovicicus Conodont Zone),Whitewater (within Dicellograptus complanatusGraptolite Zone; upper, but not uppermost, partof Amorphognathus ordovicicus Conodont Zone)and Elkhorn (upper Amorphognathus ordovici-cus Conodont Zone).If variations in stable carbon-isotope profiles
from the Williston Basin reflect variations in theoriginal marine d13C values, then they should becorrelatable with previously published d13C pro-files from coeval strata of Midcontinent USA(Bergstr€om et al., 2007, 2010d) that were shownto co-vary with coeval d13C profiles from the EastBaltic region (Ainsaar et al., 2004, 2010; Kaljoet al., 2004). Based on the d13C analysis coupled
with the available biostratigraphic data, a Willis-ton Basin to Midcontinent Cincinnati Regioncorrelation is presented in Fig. 9. Besidesmethod-inherent caveats, for example, differentsampling densities or different trends in thick-nesses, the correlation may be further impededby the fact that the Cincinnatian Series curverepresents a composite curve (Bergstr€om et al.,2010a).The oldest three positive d13C excursions from
the Cincinnati Region (Kope, Fairview andWaynesville) are not recorded within the upperRed River Formation. This is in agreement withthe conodont and brachiopod evidence, and fur-ther suggests that the upper Red River Forma-tion is stratigraphically younger than the upperpart of Amplexograptus manitolinensis Grapto-lite Zone (lower part of Amorphognathus ordo-vicicus Conodont Zone); i.e. it is late Katian inage. The upper part of the Cincinnati d13C curveshows an overall gradual positive trend (�2 to+2& VPDB) with two major excursions to posi-tive values (Whitewater and Elkhorn), which isdifferent from an overall gradually negativetrend (ca +1& to ca �2& VPDB) in the Willis-ton Basin. The positive d13C shift within theupper C laminated member of the Red River For-mation (d13C stage II) is interpreted to corre-spond to a minor shift to positive values (ca0.5& VPDB) within the Whitewater d13C excur-sion from the Cincinnati Region, but the abso-lute d13C values from the Williston Basin are ca1.5& higher, and are more similar to those fromcoeval Moe excursion in Estonia (Ainsaar et al.,2004, 2010; Kaljo et al., 2004, 2008). The curvesegment in the Red River B interval (d13C stageIV), with most values between 0& and ca 1&and the heaviest d13C value of ca +2& VPDB(well #9800), shows no corresponding excursionin the Cincinnati region, and can only be bio-stratigraphically correlated with a minor wigglein the curve segment of the upper WhitewaterFormation between the Whitewater and Elkhornexcursions in the Cincinnati curve (Fig. 9). Theyoungest Ordovician excursion in the CincinnatiRegion (Elkhorn excursion, sensu Bergstr€omet al., 2010d) shows a significant ca 3& shift topositive values in that area. Excluding the core#9103, the d13C excursion in the A interval (d13Cstage VI), which starts a little above the base ofsequence RR3 in the Williston Basin cores#9800 and #8010, shows a pronounced excur-sion to negative values below its base (d13C stageV) which is not present in the Cincinnati curve.The d13C stage VI appears to correspond to the
© 2014 The Authors. Sedimentology © 2014 International Association of Sedimentologists, Sedimentology, 62, 314–349
332 A. Husinec and S. M. Bergstr€om

overall positive trend of the Cincinnati d13Ccurve (Elkhorn excursion), but the former ismuch more complex and contains a major excur-sion to negative values (core #9800) that is notpresent in the Cincinnati curve. The remainderof the Williston Basin d13C curve covers a strati-graphic interval that is not preserved in the Cin-cinnati Region and represents the first publishedd13C values from the Stony Mountain Formation.No isotope data are yet known from higher partsof the Stony Mountain Formation, but Demskiet al. (2011) recognized the Hirnantian excur-sion in the Stonewall Formation of Manitoba,indicating the presence of Hirnantian strata inthe margin of the Williston Basin. Finally, giventhe different overall trend and absolute d13Cvalues between the Williston Basin and the Cin-cinnati Region, it seems likely that correlationbased on d13C records would not have been pos-sible without a solid middle–upper Richmondianbiostratigraphic foundation. The differences inthe d13C overall trend and absolute values maybe suggestive of a lack of exchange betweenwaters of the Williston Basin and the Midconti-nent (Rendall & Husinec, 2012, and referencestherein), as well as the influence of differentregional environmental processes or diagenetichistories discussed in the preceding sections.One of the thickest and most studied upper
Katian and Hirnantian successions in NorthAmerica, with detailed d13C chemostratigraphy,is that on Anticosti Island in Qu�ebec. Here, ca360 m of the more than 1 km thick Upper Ordovi-cian succession of dominantly richly fossiliferouscarbonate rocks is exposed well in numerous sec-tions (e.g. Twenhofel, 1929; Lesp�erance, 1982;Copper, 2001). The topmost 60 to 70 m of thisremarkable sequence is classified as the Ellis BayFormation and the underlying, ca 950 m thick,mostly unexposed, succession is referred to asthe Vaur�eal Formation (Fig. 10), the basal part ofwhich contains graptolites of the Pleurograptuslinearis and Dicellograptus complanatus zones(Riva, 1969). This indicates that most of theVaur�eal Formation, as well as most of the EllisBay Formation, belongs to Stage Slice Ka4 ofBergstr€om et al. (2009). The most detailed bio-stratigraphy of this succession is based on chitin-ozoans (e.g. Achab, 1977; Achab et al., 2011) andconodonts (e.g. McCracken & Barnes, 1981; Now-lan & Barnes, 1981).A summary of regional correlations of the
Williston Basin, Anticosti Island and Latviansuccessions based on biostratigraphy andcarbon-isotope chemostratigraphy is presented
in Fig. 11. The d13C chemostratigraphy of theKatian succession on Anticosti Island has beeninvestigated by several authors (e.g. Underwoodet al., 1997; Young et al., 2010; Jones et al.,2011). For a comparison with the WillistonBasin succession, the present study uses thed13C values published by Young et al. (2010)because they cover the entire exposed part ofthe Vaur�eal Formation as well as the whole EllisBay Formation (Figs 10 and 11).As shown in Fig. 10, the d13C values from the
exposed Vaur�eal succession vary between �0.7&and near +1&. Beginning in the middle part ofthe Homard Member, there is a notable increasein d13C values from baseline values between�1& and 0& to values ca +0.5&. With minorvariation, values of this magnitude persist to theupper Joseph Point Member–lower Mill BayMember, where there is a decline that culminatesin values as low as ca +0.5&. This curve segmentwith elevated values, which covers a ca 120 mthick succession, has the biostratigraphic posi-tion of the Elkhorn excursion in the Cincinnatiregion, where it is located between the Hirnan-tian and the Whitewater excursion (Bergstr€omet al., 2009). Compared with the excursion in theRed River Formation identified as the Elkhornexcursion, the excursion in the Vaur�eal Forma-tion has more uniform d13C values, and does notshow a negative spike recorded in core #9800from the Williston Basin. The Anticosti Islandvalues vary between 0& and ca +1&, whereasthose in the Red River Formation range from ca�3& to +1&. The lowermost 50 m of the Vaur�ealcurve shows slightly elevated d13C values, butfurther studies are needed to clarify whether thiscurve segment corresponds to the end of theWhitewater excursion identified in the Red RiverFormation, as suggested by its stratigraphic posi-tion in Fig. 10. The present authors expect that acomplete representation of the Whitewaterexcursion is present in the subsurface portion ofthe Vaur�eal Formation, the isotope chemostratig-raphy of which remains unstudied.In a regional review, Bergstr€om et al. (2010d)
showed that the carbon-isotope excursionsrecognized in the Cincinnati region could becorrelated with excursions occupying the same,or very similar, stratigraphic intervals in Balto-scandia. For instance, the Whitewater excursion,which occupies an interval around the Dicello-graptus complanatus Zone in the Cincinnatiregion (cf. Goldman & Bergstr€om, 1997), corre-sponds to the Baltoscandic Moe excursion,which is located in the lower Jonstorp Forma-
© 2014 The Authors. Sedimentology © 2014 International Association of Sedimentologists, Sedimentology, 62, 314–349
Carbon-isotope record of an epicratonic basin 333

tion in an interval that in Sweden has yieldedgraptolites of the same graptolite zone (Skog-lund, 1963). In some East Baltic successions,there is an excursion between the Hirnantianand the Moe excursions that recently wasrenamed the Parojeva excursion (Ainsaar et al.,2010). One of the most representative succes-sions showing this excursion is the Jurmala R-1drillcore from Latvia (Ainsaar et al., 2010),
which is illustrated in Fig. 10, where it is com-pared with the Elkhorn excursion in the Anti-costi Island and the Williston Basin successions.As shown by the different thickness figures, theLatvian succession is much thinner than the twoothers, and hence this excursion occupies amuch more limited interval than on AnticostiIsland and in the Williston Basin. It should alsobe noted that the Latvian d13C curve lacks the
0
10
20 m
VAU
RE
AL
BE
CS
CIE
ELL
IS B
AYH
IR.
KAT
IAN
SILURIAN
#9800, Williams CountyNorth Dakota, USA
Western Anticosti IslandQuébec, Canada
Jurmala R-1 DrillcoreLatvia
No isotopic data available
ca 700 m to base of Vauréal Fm.
TOW
ER
HO
MA
RD
Seq
uenc
e S
M1
Seq
. RR
3S
eque
nce
RR
2S
eque
nce
RR
1
H. c
rickm
ayi
B. g
amac
hia.
JOS
EP
H P
OIN
TS
GV
PL
LCM
ILL
BAY
δ13Ccarb (‰ VPDB)
KAT
IAN
HIR
NA
NTI
AN
PIR
GU
HIC
E
HIC
E
PO
RK
UN
IJO
NS
TOR
PJE
LGAV
APA
RO
VE
JAK
UL.
KU
LDIG
A S
ALD
US
δ13Ccarb (‰ VPDB)10–1 2 3 4
RE
D R
IVE
R F
OR
MAT
ION
STO
NY
MTN
.STO
NE
WA
LL F
M.
HIC
E
0
50 m
I
II
III
IV
V
VI
VII
VIII
δ13Ccarb (‰ VPDB)–1–2–3 0 1 2
KAT
IAN
HIR
NA
NTI
AN
PIR
GU
PO
RK
UN
IJO
NS
TOR
PJE
LGAV
APA
RO
VE
JAK
UL.
KU
LDIG
A S
ALD
US
SILURIAN
KAT
IAN
HIR
NA
NTI
AN
PIR
GU
PO
RK
UN
IJO
NS
TOR
PJE
LGAV
APA
RO
VE
JAK
UL.
KU
LDIG
A S
ALD
US
SILURIAN
1 2 5
0
10
20 m
3 4
1 2 53 4SILURIAN
ELK
HO
RN
(PA
RO
VEJA
)
ELK
HO
RN
(PA
RO
VEJA
)
ELK
HO
RN
(PA
RO
VEJA
)
MOE
Fig. 10. Comparison of the d13C chemostratigraphy in the Simpson #1 (#9800) well, Williams County, WillistonBasin, that of the composite succession of the Vaur�eal and Ellis Bay formations on western Anticosti Island (afterYoung et al., 2010), and that of the succession in the Jurmala R-1 well in Latvia (after Ainsaar et al., 2010). Notethe correlation of the Elkhorn and Paroveja excursions with that in the upper Red River Formation of the Simpson#1 well. The reference level for the alignment of the successions is the base of the Hirnantian excursion. No iso-tope data are yet available from most of the Stony Mountain and Stonewall formations, although the Hirnantianexcursion has recently been recorded from the middle part of the Stonewall Formation. This correlation amongthe three successions is in good agreement with the biostratigraphy based on conodonts and shelly fossils.
© 2014 The Authors. Sedimentology © 2014 International Association of Sedimentologists, Sedimentology, 62, 314–349
334 A. Husinec and S. M. Bergstr€om

characteristic noisy segment present in theuppermost Katian in the Anticosti Island curve.It is well-known that there is a more or lessprominent stratigraphic gap in many Baltoscan-dian successions below the base of theHirnantian (e.g. Lashkov & Pa�skevicius, 1989;Ainsaar et al., 2010) and the appearance of theJurmala R-1 isotope curve suggests the presenceof a stratigraphic gap in that position, even ifthe succession in this drillcore is more completethan in many other drillcores from the EastBaltic region.
Stable carbon-isotope trends versus sequencestratigraphy
In order to test whether the stable carbon-isotopecurve can be used as a proxy for relative sea-level,the relation between the two is discussed belowusing the correlation between d13C trends as pro-posed by F€ollmi et al. (1994) and Vahrenkamp(1996). These authors suggested that distinct d13Ctrends can be translated to corresponding sea-level trends and stacking patterns in the follow-ing way: (i) a positive d13C trend correlates with
LIBERTY
ELKHORN
ARNHEIM
VAURÉAL
ELLIS BAY
ELLIS BAY
BECSCIE
PIRGU
PORKUNI
?
WHITE-WATER
WAYNES-VILLE
WILLISTON BASIN,
MANITOBA-WYOMING
STAGE CONO-DONT ZONE ANTICOSTI
ISLAND, QUÉBEC
NW OHIO - INDIANA
JURMALA R-1,
ESTONIA
WAY
NE
S-
VIL
LEW
HIT
E-
WAT
ER
PAR
OV
EJA
WH
ITE
-W
ATE
RE
LK-
HO
RN
HIC
E
STO
NE
WA
LLR
ED
RIV
ERBIG
HO
RN
NAIT
NA
NRI
HN
AITAK
HIC
EE
LKH
OR
NW
HIT
E-
WAT
ER
WAY
NE
S-
VIL
LE
GA
MA
CH
IAN
RIC
HM
ON
DIA
N
2iH
1iH
2aK
Ka3
?A
ph. g
rand
isG
amac
hign
. ens
ifer
Oz.
has
siO
z. h
assi
Am
orph
ogna
thus
ord
ovic
icus
P. p
acifi
cus
N. p
ersc
.A
. man
itoul
inen
sis
D. c
ompl
.N
.ex
traN
.as
cens
usD
.orn
atus
A.
supe
rbus
Ka4
RH
UD
DG
LOB
AL
N. A
M.
ATL.
NO
RTH
AM
ERIC
AST
AG
ESL
ICE
GR
APT
OLI
TEZO
NE
C-IS
OTO
PEEX
CU
RSI
ON
?
STO
NY
MTN
.
ELK
-H
OR
N
ELK
HO
RN
PAR
OV
EJA
HIC
E
HIC
E
WH
ITE
-W
ATE
R
MO
E
Fig. 11. Summary diagram showing the proposed correlation between the study successions based on biostratigra-phy and d13C chemostratigraphy. Vertical ruling indicates stratigraphic gaps. The North American upper KatianConodont Zone succession is still unsettled, in that the Williston Basin Aphelognathus divaricatus and A. shat-zeri zones and the Anticosti Island Gamachignathus ensifer Zone appear to cover a broadly similar stratigraphicinterval. Note that based on its stratigraphic position in Ohio-Indiana, the Waynesville d13C excursion is likely tobe present in the lower Red River Formation as well as in the subsurface part of the Vaur�eal Formation. Abbrevia-tions: Aph., Aphelognathus; Gamachign., Gamachignathus; Oz., Ozarkodina; N.Am., North America; Atl., Atlan-tic; A. superbus, Amorphognathus superbus; D. compl., Dicellograptus complanatus; D. ornatus. Dicellograptusornatus; P. pacificus, Paraorthograptus pacificus; N. extra., Normalograptus extraordinarius; N. persc., Normalo-graptus persculptus; N. ascensus, Normalograptus ascensus.
© 2014 The Authors. Sedimentology © 2014 International Association of Sedimentologists, Sedimentology, 62, 314–349
Carbon-isotope record of an epicratonic basin 335

rising sea-level (TST with backstepping and con-densed sections downdip); (ii) a constant d13Ctrend correlates with slack sea-level (HST withhigh carbonate production and aggradation andprogradation); and (iii) a negative d13C trendcorrelates with falling sea-level (forced regressionor LST, may be absent updip due to erosion).Because the core #9103 (Fig. 5) does not cover theupper part of the study succession, only the cores#9800 (Fig. 4) and #8010 (Fig. 6) are used to testthe relation between the isotope trends andsystems tracts within the sequences.Overall, the gross facies stacking patterns and
carbon-isotope trends within the upper Red RiverFormation do not show a clear covariance sugges-tive of a relation between the d13C trends and therelative sea-level changes. The major differencesinclude the following: (i) the onset of drowningcorrelates fairly well with the positive d13C excur-sion at the base of RR1 in well #8010, but pre-dates it in well #9800; (ii) the negative d13C trendof the LST part of RR2 is marked by deposition ofanhydrite and dololaminite (well #8010) but, inwell #9800, the negative trend continues throughthe subtidal TST of sequence RR2; (iii) the subse-quent positive d13C trend (d13C-derived TST) isnot recorded at the same intervals in the twostudied wells; (iv) the late TST and entire HST ofthe sequence RR2 in core #8010 are representedby an overall constant d13C value, while in core#9800, the HST contains a major positive fol-lowed by a negative excursion; and (v) the d13Ctrends from both cores differ in the sequenceSM1, which prevents a breakdown of the SM1 ond13C-derived systems tracts.It should be noted that, when viewed in a global
perspective, the relations between changes insea-level and d13C trends (e.g. F€ollmi et al., 1994;Jenkyns, 1996; Vahrenkamp, 1996; Colombi�eet al., 2011) are more complex than may appearlocally. As shown by several authors (e.g. Berg-str€om et al., 2010c), the prominent Guttenbergexcursion occurs in some areas (for example, Ken-tucky, Oklahoma) in highstand deposits, whereasin other regions (for example, south-eastern Nor-way and Estonia), it is present in lowstand units.The even more conspicuous Hirnantian isotopeexcursion, the largest positive excursion in theentire Ordovician, occurs within a well-knowneustatic lowstand, which is recognized globallyand interpreted to be caused by major glaciationsin Gondwana. In the Cincinnati region, the topportion of the Elkhorn Formation with the begin-ning of the Elkhorn excursion clearly represents aregressive event that is followed by a very long
period of non-marine conditions. In the sameregion, as well as in Illinois, the Whitewaterexcursion is associated with a regressive event(cf. Goldman & Bergstr€om, 1997). Hence, asshown by these and other examples, a clear rela-tion between sea-level highstands and positived13C excursions is not clear, and other factors,including regional environmental effects, coupledwith diagenesis, are likely to be more importantthan vertical changes of the surface of the sea.
CONCLUSIONS
The upper Katian Red River Formation is anoverall shallowing (and ‘brining’) upward super-sequence reaching a thickness of more than210 m in the epicratonic Williston Basin depo-centre in North Dakota. The supersequence iscomposed of at least three long-term (third-order) depositional sequences that formed eastof the very broad and shallow, tropical, arid car-bonate shelf that developed east of the westernpassive margin of North America. The ca 87 mthick investigated interval in the upper part ofthe Red River Formation in North Dakota pro-vides one of the most complete upper Katian(post-Waynesville excursion and pre-Hirnatianexcursion) d13C records available in North Ame-rica. The results of the present study may besummarized as follows:1 d13C values of shallow-marine Red River car-bonates vary from �3& to +1.7& in limestoneand from �0.7& to +2& in dolomite; such simi-lar values suggest that carbon was rock bufferedand could be representing the original marined13C record.2 Fine crystal size, lack of zoning and non-obliterated porosity in the dolomites sampledfor stable isotopes, coupled with their intimateassociation with the overlying evaporites, sug-gest a hypersaline-brine, early replacive originfor the bulk of the dolomite. Dark orange to redluminescence of both laminated and burroweddolomites suggests their similar dolomitizationhistory and diagenetic stabilization under reduc-ing conditions.3 The d13C trend of the study interval from theupper Red River Formation to the lowermost partof the Stony Mountain Formation can be subdi-vided into eight stages, with the Red River Forma-tion being characterized by three majorexcursions to positive d13C values that can be cor-related across the Williston Basin. The first excur-sion (stage II) with an amplitude of up to +2&
© 2014 The Authors. Sedimentology © 2014 International Association of Sedimentologists, Sedimentology, 62, 314–349
336 A. Husinec and S. M. Bergstr€om

occurs in the C laminated member. The secondexcursion (stage IV) reaches an amplitude of +2&within the B burrowed member. Both excursionsoccur within the upper Katian Aphelognathusdivergens Conodont Zone. The third excursion(stage VI) with an amplitude of +2& to +4&occurs in the middle part of the A interval, abovethe A anhydrite or A laminite member.4 With the help of conodont biostratigraphy,
the Williston Basin d13C profiles can be corre-lated with the d13C profile reported from theCincinnati region (Midcontinent, USA), coevalintervals in the Vaur�eal Formation on AnticostiIsland (Qu�ebec) and in the Pirgu Stage of theEast Baltic region. The chemostratigraphic corre-lation suggests that the upper Red River Forma-tion is biostratigraphically above the upper partof Amplexograptus manitolinensis GraptoliteZone (lower part of Amorphognathus ordovici-cus Conodont Zone); i.e. it is Late Katian in age.This is consistent with biostratigraphic evidencefrom shelly fossils and conodonts.5 The different overall trend and absolute d13C
values between the Williston Basin and the Cin-cinnati Region suggest a lack of exchangebetween waters of the Williston Basin and theMidcontinent and, consequently, the influenceof different regional environmental processescharacteristic of a large, periodically isolatedWilliston Basin, coupled with different diage-netic histories.6 No clear relation can be established between
the carbon-isotope trends and the relative sea-level changes based on gross facies stacking pat-terns, which suggests that the magnitude of d13Cvalues was mainly controlled by factors otherthan water depth.
ACKNOWLEDGEMENTS
Acknowledgement is made to the Donors of theAmerican Chemical Society Petroleum ResearchFund for support of this research (High Resolu-tion Sequence Stratigraphy of Ordovician RedRiver Formation, Williston Basin, North Dakota;PRF# 49435 - UNI 8). We are also grateful toEdward C. Murphy, North Dakota State Geolo-gist and the North Dakota Geological SurveyWilson M. Laird Core Library for the access tothe Red River core and thin-section collection.We thank director Julie LeFever for helpful dis-cussions and Kent Hollands for technical assis-tance with the cores. Thanks to Katie Hoskinsonand Kyle Marvinney who assisted with drilling
of the bulk carbonate matrix. Associate EditorAdrian Immenhauser and two anonymousreviewers are gratefully acknowledged for con-structive comments that greatly improved thepaper. Editor Tracy Frank is thanked for edito-rial assistance and helpful suggestions.
REFERENCES
Achab, A. (1977) Les chitinozoires de la zone �a
Climacograptus prominens elongatus de la Formation de
Vaur�eal (Ordovicien sup�erieur), Ile d’Anticosti, Qu�ebec.
Can. J. Earth Sci., 14, 2193–2212.Achab, A., Asselin, E., Desrochers, A., Riva, J. and Farley,
C. (2011) Chitinozoan biostratigraphy of a new Upper
Ordovician stratigraphic framework for Anticosti Island,
Canada. Geol. Soc. Am. Bull., 123, 186–205.Ainsaar, T., Meidla, T. and Martma, T. (2004) The middle
Caradoc facies and faunal turnover in the Late Ordovician
Baltoscandian palaeobasin. Palaeogeogr. Palaeoclimatol.
Palaeoecol., 210, 119–133.Ainsaar, L., Kaljo, D., Martma, T., Meidla, T., M€annik, T.,
N~olvak, J. and Tinn, O. (2010) Middle and Upper Ordovician
carbon isotope chronostratigraphy in Baltoscandia: a
correlation standard and clues to environmental history.
Palaeogeogr. Palaeoclimatol. Palaeoecol., 294, 189–201.Allan, J.R. and Matthews, R.K. (1977) Carbon and oxygen
isotopes as diagenetic and stratigraphic tools: surface and
subsurface data, Barbados, West Indies. Geology, 5, 16–20.Allan, J.R. and Matthews, R.K. (1982) Isotope signatures
associated with early meteoric diagenesis. Sedimentology,
29, 797–817.Alroy, J., Aberhan Bottjer, M.D.J., Foote, M., Fursich, F. T.,
Harries, P. J., Hendy, A. J. W., Holland, S. M., Ivany, L.C., Kiessling, W., Kosnik, M.A., Marshall, C.R.,McGowan, A.J., Miller, A.I., Olszewski, T.D., Patzkowsky,M.E., Peters, S.E., Villier, L., Wagner, P.J., Bonuso, N.,Borkow, P.S., Brenneis, B., Clapham, M.E, Fall, L.M.,Ferguson, C.A., Hanson, V.L., Krug, A.Z., Layou, K.M.,Leckey, E.H., N€urnberg, S., Powers, C.M., Sessa, J.A.,Simpson, C., Tomasovych, A. and Visaggi, C.C. (2008)
Phanerozoic trends in the global diversity of marine
invertebrates. Science, 321, 97–100.Alsharhan, A.S. and Sadd, J.L. (2000) Stylolites in Lower
Cretaceous carbonate reservoirs, U.A.E. In: Middle East
Models of Jurassic/Cretaceous Carbonate Systems (Eds A.S.
Alsharhan and R.W. Scott), SEPM Spec. Publ., 69, 185–207.Anderson, T.F. and Arthur, M.A. (1983) Stable isotopes of
oxygen and carbon and their application to sedimentologic
and environmental problems. In: Stable Isotopes in
Sedimentary Geology (Eds M.A. Arthur, T.F. Anderson,
I.R. Kaplan, J. Veizer and L.S. Land). SEPM Short CourseNotes, 10, 1–151.
Ballard, F.V. (1963) Structural and stratigraphic
relationships in the Paleozoic rocks of eastern North
Dakota. North Dakota Geol. Surv. Bull., 20, 42.Banner, J.L., Hanson, G.N. and Meyers, W.J. (1988) Water-
rock interaction history of regionally extensive dolomites
of the Burlington-Keokuk Formation (Mississippian):
isotopic evidence. In: Sedimentology and Geochemistry of
Dolostones (Eds V. Shukla and P.A. Baker), SEPM Spec.
Publ., 43, 97–114.
© 2014 The Authors. Sedimentology © 2014 International Association of Sedimentologists, Sedimentology, 62, 314–349
Carbon-isotope record of an epicratonic basin 337

Bergstr€om, S.M., Young, S., Schmitz, B. and Saltzman, M.R.(2007) Upper Ordovician (Katian) d13C chemostratigraphy:
a trans-Atlantic comparison. Acta Palaeontol. Sinica, 46(Suppl.), 37–39.
Bergstr€om, S.M., Chen, X., Gutti�errez-Marco, J.C. and
Dronov, A. (2009) The new chronostratigraphic
classification of the Ordovician system and its relations to
major regional series and stages and d13Cchemostratigraphy. Lethaia, 42, 97–107.
Bergstr€om, S.M., Calner, M., Lehnert, O. and Noor, A.(2010a) A new upper Middle Ordovician-Lower Silurian
drillcore standard succession from Borenshult in€Osterg€otland, southern Sweden. 1. Stratigraphical review
with regional comparisons. GFF, 133, 149–171.Bergstr€om, S.M., Lehnert, O., Calner, M. and Joachimski,
M.M. (2010b) A new upper Middle Ordovician-Lower
Silurian drillcore standard succession from Borenshult in€Osterg€otland, southern Sweden: 2. Significance of d13Cchemostratigraphy. GFF, 134, 39–63.
Bergstr€om, S.M., Schmitz, B., Saltzman, M.R. and Huff, W.D.(2010c) The Upper Ordovician Guttenberg d13C excursion
(GICE) in North America and Baltoscandia: occurrence,
chronostratigraphic significance, and paleoenvironmental
relationships. In: The Ordovician Earth System (Eds S.C.
Finney and W.B.N. Berry), GSA Spec. Pap., 466, 37–67.Bergstr€om, S.M., Young, S. and Schmitz, B. (2010d) Katian
(Upper Ordovician) d13C chemostratigraphy and sequence
stratigraphy in the United States and Baltoscandia: a
regional comparison. Palaeogeogr. Palaeoclimatol.Palaeoecol., 296, 217–234.
Bergstr€om, S.M., Eriksson, M.E., Young, S.A., Ahlberg, P.and Schmitz, B. (2014) Hirnantian (latest Ordovician) d13Cchemostratigraphy in southern Sweden and globally: a
refined integration with the graptolite and conodont zone
successions. GFF, 136, 355–386.Berner, R.A. (1994) GEOCARB II: a revised model of
atmospheric CO2 over Phanerozoic time. Am. J. Sci., 294,56–91.
Berner, R.A. and Kothavala, Z. (2001) GEOCARB III: a
revised model of atmospheric CO2 over Phanerozoic time.
Am. J. Sci., 301, 182–204.Bluemle, J.P., Anderson, S.B. and Carlson, C.G. (1981)
Williston Basin stratigraphic nomenclature chart. NorthDakota Geol. Surv. Misc. Ser., 61, 1 pl.
Boyd, D.W. (2007) Morphology and diagenesis of
Dimorphosiphon talbotorium n. sp., an Ordovician skeleton-
building alga (Chlorophyta: Dimorphosiphonaceae). J.Paleontol., 81, 1–8.
Brasier, M.D., Corfield, R.M., Derry, L.A., Rozanov, A.Yu.and Zhuravlev, A.Yu. (1994) Multiple d13C excursions
spanning the Cambrian explosion to the Botomian crisis in
Siberia. Geology, 22, 455–458.Brenchley, P.J., Marshall, J.D., Carden, G.A.F., Robertson,
D.B.R., Long, D.G.F., Meidla, T., Hints, L. and Anderson,T.F. (1994) Bathymetric and isotopic evidence for a short-
lived Late Ordovician glaciation in a greenhouse period.
Geology, 22, 295–298.Brenchley, P.J., Carden, G.A., Hints, L., Kaljo, D., Marshall,
J.D., Martma, T., Meidla, T. and N~olvak, J. (2003) High-
resolution stable isotope stratigraphy of Upper Ordovician
sequences: constraints on the timing of bioevents and
environmental changes associated with mass extinction
and glaciation. Geol. Soc. Am. Bull., 115, 89–104.Calvert, S.E., Bustin, R.P. and Ingall, E.D. (1996) Influence
of water column anoxia and sediment supply on the burial
and preservation of organic carbon in marine shales.
Geochim. Cosmochim. Acta, 60, 1577–1593.Canter, K.L. (1998) Facies, cyclostratigraphic and secondary
diagenetic controls on reservoir distribution, Ordovician Red
River Formation, Midale Field, southern Saskatchewan. In:
Eighth International Williston Basin Symposium, CoreWorkshop (Ed. L.K. Kreis), pp. 41–65. Saskatchewan, North
Dakota & Montana Geological Societies, Regina.
Carlson, C.G. and Anderson, S.B. (1965) Sedimentary and
tectonic history of North Dakota part of Williston Basin.
AAPG Bull., 49, 1833–1846.Carroll, W.K. (1979) Depositional environments and
paragenetic porosity controls, upper Red River Formation,
North Dakota. North Dakota Geol. Surv. Rep. Inv., 66, 51.Chafetz, H.S., Imerito-Tetzlaff, A.A. and Zhang, J. (1999)
Stable-isotope and elemental trends in Pleistocene sabkha
dolomites: descending meteoric waters vs. sulfate
reduction. J. Sed. Res., 69, 268–278.Christ, N., Immenhauser, A., Amour, F., Mutti, M., Preston,
R., Whitacker, F.F., Peterh€ansel, A., Egenhoff, S.O., Dunn,P.A. and Agar, S.M. (2012) Triassic Latemar cycle tops –subaerial exposure of platform carbonates under tropical
arid climate. Sed. Geol., 265–266, 1–29.Clement, J.H. (1987) Cedar Creek: a significant paleotectonic
feature of the Williston Basin. In: Williston Basin:Anatomy of a Cratonic Oil Province (Ed. M.W. Longman),
pp. 323–336. Rocky Mountain Association of Geologists,
Denver.
Colombi�e, C., L�ecuyer, C. and Strasser, A. (2011) Carbon-
and oxygen-isotope records of palaeoenvironmental and
carbonate production changes in shallow-marine
carbonates (Kimmeridgian, Swiss Jura). Geol. Mag., 148,133–153.
Copper, P. (2001) Reefs during multiple crises toward the
Ordovician-Silurian boundary, Anticosti Island,
eastern Canada, and world-wide. Can. J. Earth Sci., 38,153–171.
Cummings, C.E. and McCarthy, H.B. (1982) Stable carbon
isotope ratios in Astrangea danae: evidence for algal
modification of varbon pools used in calcification.
Geochim. Cosmochim. Acta, 46, 1125–1129.Curtis, C.D., Petrowski, C. and Oertel, G. (1972) Stable
carbon isotope ratios within carbonate concretions: a clue
to place and time of formation. Nature, 235, 98–100.Demski, M.W., Wheadon, B.J., Stewart, L.A., Elias, R.J.,
Young, G.A., Nowlan, G.S. and Dobrzanskyt, E.P. (2011)
Ordovician-Silurian boundary interval in the Williston
and Hudson Bay basins, Manitoba: isotopic carbon
excursion and conodont turnover. Geol. Assoc. Can.
Annu. Meet., Abstracts. Ottawa, Canada, pp. 50–51.Derby, J.R. and Kilpatrick, J.T. (1985) Ordovician Red River
dolomite reservoirs, Killdeer Field, North Dakota. In:
Carbonate Petroleum Reservoirs (Eds P.O. Roehl and P.W.
Choquette), pp. 61–69. Springer-Verlag, New York.
Derry, L.A., Kaufman, A.J. and Jacobsen, S.B. (1992)
Sedimentary cycling and environmental change in the
Late Proterozoic: evidence from stable and radiogenic
isotopes. Geochim. Cosmochim. Acta, 56, 1317–1329.Dickson, J.A.D., Wood, R.A., Al Rougha, H.B. and Shebl, H.
(2008) Sulphate reduction associated with hardgrounds:
lithification afterburn! Sed. Geol., 205, 34–39.Elias, R.J., Nowlan, G.S. and Bolton, T.E. (1988)
Paleontology of the type section, Fort Garry Member, Red
River Formation (Upper Ordovician), southern Manitoba.
In: Contributions to Paleozoic Paleontology in Honor of
© 2014 The Authors. Sedimentology © 2014 International Association of Sedimentologists, Sedimentology, 62, 314–349
338 A. Husinec and S. M. Bergstr€om

Rousseau H. Flower (Ed. D.L. Wohlberg), Bull. New Mex.
Bur. Min. Mineral Resour., 44, 341–359.Finnegan, S., Bergmann, K., Eiler, J.M., Jones, D.S., Fike, D.A.,
Eisenman, I., Hughes, N.C., Tripati, A.K. and Fischer, W.W.(2011) The magnitude and duration of Late Ordovician-Early
Silurian glaciation. Science, 331, 903–906.Fischer, A.G. (1982) Long term climate oscillations recorded
in stratigraphy. In: Climate in Earth History (Eds W.H.
Berger and J.C. Crowell), pp. 97–104. National Academic
Press, Washington DC.
F€ollmi, K.B., Weissert, H., Bisping, M. and Funk, H. (1994)Phosphogenesis, carbon-isotope stratigraphy, and carbonate-
platform evolution along the Lower Cretaceous northern
Tethyan margin. Geol. Soc. Am. Bull., 106, 729–746.Frakes, L.A. (1979) Climates Throughout Geologic Time.
Elsevier, Amsterdam, 310 pp.
Frakes, L.A., Francis, J.E. and Syktus, J.I. (1992) Climate
Modes of the Phanerozoic: The History of the Earth’sClimate Over the Past 600 Million Years. Cambridge
University Press, Cambridge, 274 pp.
Fuller, J.G.C.M. (1961) Ordovician and continuous
formations in North Dakota. AAPG Bull., 45, 1334–1363.Garrels, R.M. and Christ, C.L. (1965) Solutions, Minerals
and Equilibria. Freeman, San Francisco, 450 pp.
Gerhard, L.C., Anderson, S.B., LeFever, J.A. and Carlson,C.G. (1982) Geological development, origin, and energy
mineral resources of Williston basin, North Dakota. AAPG
Bull., 66, 989–1020.Gerhard, L.C., Anderson, S.B. and LeFever, J.A. (1987)
Structural history of the Nesson anticline. In: Williston
Basin: Anatomy of a Cratonic Oil Province (Ed. M.W.
Longman), pp. 337–353. Rocky Mountain Association of
Geologists, Denver.
Gingras, M.K., Pemberton, S.G., Muelenbachs, K. and
Machel, H. (2004) Conceptual models for burrow-related,
selective dolomitization with textural and isotopic evidence
from the Tyndall Stone, Canada. Geobiology, 2, 21–30.Gischler, E., Swart, P.K. and Lomando, A.J. (2009) Stable
isotopes of carbon and oxygen in modern sediments of
carbonate platforms, Barrier Reefs, Atolls and Ramps:
patterns and implications. In: Perspectives in Carbonate
Geology: A Tribute to the Career of Robert Nathan
Ginsburg (Eds P.K. Swart, G.P. Eberli and J.A. McKenzie),
Int. Assoc. Sedimentol. Spec. Publ., 41, 61–74.Glumac, B. and Walker, K.R. (1998) A Late Cambrian
positive carbon-isotope excursion in the Southern
Appalachians: relation to biostratigraphy, sequence
stratigraphy, environments of deposition, and diagenesis.
J. Sed. Res., 68, 1212–1222.Goldman, D. and Bergstr€om, S.M. (1997) Late Ordovician
graptolites from the North American Midcontinent.
Palaeontology, 40, 965–1010.Herrmann, A.D., Haupt, B.J., Patzkowsky, M.E., Seidov, D.
and Slingerland, R.L. (2004) Response of Late Ordovician
paleoceanography to changes in sea level, continental
drift, and atmospheric pCO2: potential causes for long-
term cooling and glaciation. Palaeogeogr. Palaeoclimatol.
Palaeoecol., 210, 385–401.Hite, R.J. and Buckner, D.H. (1981) Stratigraphic correlations,
facies concepts, and cyclicity in Pennsylvanian rocks of the
Paradox Basin. In: Geology of the Paradox Basin, 1981 Field
Conference (Ed. D.L. Weigand), pp. 147–159. Rocky
Mountain Association of Geologists, Denver.
Holland, S.M. and Patzkowsky, M.E. (2009) Stratigraphic
architecture of a tropical carbonate platform and its effect
on the distribution of fossils: Ordovician Bighorn
Dolomite, Wyoming, USA. Palaios, 24, 303–317.Holmden, C. (2009) Ca isotope study of Ordovician dolomite,
limestone, and anhydrite in the Williston Basin:
implications for subsurface dolomitization and local Ca
cycling. Chem. Geol., 268, 180–188.Husinec, A. (2013) Sedimentary evolution of Williston Basin
at the onset of Hirnantian glaciation. Geol. Soc. Am.
Annu. Conven., Abstracts with Program. Denver, CO,
USA, 243 pp.
Husinec, A. and Read, J.F. (2011) Microbial laminite versus
rooted and burrowed caps on peritidal cycles: salinity
control on parasequence development, Early Cretaceous
isolated carbonate platform, Croatia. Geol. Soc. Am. Bull.,123, 1896–1907.
Immenhauser, A., Della Porta, G., Kenter, J.A.M. and
Bahamonde, J.E. (2003) An alternative model for positive
shifts in shallow-marine carbonate d13C and d18O.
Sedimentology, 50, 953–959.Immenhauser, A., Holmden, C. and Patterson, W.P. (2008)
Interpreting the carbon-isotope record of shallow epeiric
seas: lessons from the recent. In: Dynamics of Epeiric Seas
(Eds B.R. Pratt and C. Holmden), Geol. Assoc. Can. Spec.
Publ., 48, 135–174.Jenkyns, H.C. (1996) Relative sea-level change and carbon
isotopes: data from the Upper Jurassic (Oxfordian) of
central and Southern Europe. Terra Nova, 8, 75–85.Jenkyns, H.C., Jones, C.E., Gr€ocke, D.R., Hesselbo, S.P. and
Parkinson, D.N. (2002) Chemostratigraphy of the Jurassic
System: applications, limitations and implications for
palaeoceanography. J. Geol. Soc. London, 159, 351–378.Jin, J. (2000) Evolution and extinction of the North American
Hiscobeccus brachiopod Fauna during the Late
Ordovician. Can. J. Earth Sci., 38, 143–151.Jin, J. and Zhan, R.-B. (2001) Late Ordovician Articulate
Brachiopods from the Red River and Stony MountainFormations. National Research Council of Canada
Research Press, Ottawa, Southern Manitoba, 117 pp.
Jin, J., Harper, D.A.T., Cocks, L.R.M., McCausland, P.J.A.,Rasmussen, C.M.Ø. and Sheehan, P. (2013) Precisely
locating the Ordovician equator in Laurentia. Geology, 41,107–110.
Jones, D.S., Fike, D.A., Finnegan, S., Fisher, W.W., Schrag,D.P. and McCay, D. (2011) Terminal Ordovician carbon
isotope stratigraphy and glacioeustatic sea-level change
across Anticosti Island (Qu�ebec, Canada). Geol. Soc. Am.
Bull., 123, 1645–1664.Kaljo, D., Hints, L., Martma, T., N~olvak, J. and Orasp~old, A.
(2004) Late Ordovician carbon isotope trend in Estonia, its
significance in stratigraphy and environmental analysis.
Palaeogeogr. Palaeoclimatol. Palaeoecol., 210, 165–185.Kaljo, D., Hints, L., M€annik, P. and N~olvak, J. (2008) The
succession of Hirnantian events based on data from
Baltica: brachiopods, chitinozoans, conodonts, and carbon
isotopes. Est. J. Earth Sci., 57, 197–218.Kaufman, A.J., Jacobsen, S.B. and Knoll, A.H. (1993) The
Vendian record of Sr and C isotopic variations in
seawater: implications for tectonics and paleoclimate.
Earth Planet. Sci. Lett., 120, 409–430.Kendall, A.C. (1976) The Ordovician Carbonate Succession
(Bighorn Group) of Southeastern Saskatchewan.
Saskatchewan Geological Survey, Department of Mineral
Resources, Report, 190, 185 pp.
Kohm, J.A. and Louden, R.O. (1978) Ordovician Red River of
Eastern Montana-western North Dakota: relationships
© 2014 The Authors. Sedimentology © 2014 International Association of Sedimentologists, Sedimentology, 62, 314–349
Carbon-isotope record of an epicratonic basin 339

between lithofacies and production. Montana Geological
Society 24th Annual Field Conference Guidebook, pp. 99–117.
Kump, L.R., Arthur, M.A., Patzkowsky, M.E., Gibbs, M.T.,Pinkus, D.S. and Sheehan, P.M. (1999) A weathering
hypothesis for glaciation at high atmospheric pCO2 during
the Late Ordovician. Palaeogeogr. Palaeoclimatol.
Palaeoecol., 152, 173–187.Lashkov, E.M. and Pa�skevicius, J. (1989) The stratigraphic
gaps and sedimentation breaks of the Ordovician section in
the western borderland of the East European platform. In:
Nauchnye Trudy Vyshikh uchebnykh zavedeniy Litovskoi
SSR, Geologija, 10, 12–37 (In Russian).
Lee, D. and Carpenter, S.J. (2001) Isotopic disequilibrium in
marine calcareous algae. Chem. Geol., 172, 307–329.LeFever, R.D., Thompson, S.C. and Anderson, D.B. (1987)
Earliest Paleozoic history of the Williston Basin in North
Dakota. In: Fifth International Williston Basin Symposium(Eds C.G. Carlson and J.E. Christopher), Sask. Geol. Soc.
Spec. Publ., 9, 22–37.Lesp�erance, P.J. (1982) Field Meeting Anticosti-Gasp�e,
Qu�ebec, 1981, vol. II, Stratigraphy and Paleontology, IUGS
Subcommission on Silurian Stratigraphy and Ordovician-
Silurian Boundary Working Group. D�epartement de
G�eologie, Universit�e de Montr�eal, 321 pp.
Lohmann, K.C. (1988) Geochemical pattern of meteoric
diagenetic systems and their application to the study of
paleokarst. In: Paleokarst (Eds N.P. James and P.W.
Choquette), pp. 58–80. Springer-Verlag, New York.
Longman, M.W., Fertal, T.G. and Glennie, J.S. (1983) Origin
and geometry of Red River dolomite reservoirs, western
Williston Basin. AAPG Bull., 67, 744–771.Loyd, M.R. (1964) Variations in the oxygen and carbon
isotope ratios of Florida Bay mollusks and their
environmental significance. J. Geol., 72, 84–111.Lucia, F.J. and Major, R.P. (1994) Porosity evolution through
hypersaline reflux dolomitization. In: Dolomites, a Volume in
Honour of Dolomieu (Eds B.H. Purser, M.E. Tucker and D.H.
Zenger), Int. Assoc. Sedimentol. Spec. Publ., 21, 325–341.Ludvigson, G.A., Jacobson, S.R., Witzke, B.J. and Gonzalez,
L.A. (1996) Carbonate component chemostratigraphy and
depositional history of the Ordovician Decorah Formation,
Upper Mississippi Valley. In: Paleozoic SequenceStratigraphy: Views From the North American Craton (Eds
B.J. Witzke, G.A. Ludvigson and J. Day), Geol. Soc. Am.
Spec. Pap., 306, 67–86.Ludvigson, G.A., Witzke, B.J., Gonz�alez, L.A., Carpenter, S.J.,
Schneider, C.L. and Hasiuk, F. (2004) Late Ordovician
(Turinian–Chatfieldian) carbon isotope excursions and their
stratigraphic and paleoceanographic significance.
Palaeogeogr. Palaeoclimatol. Palaeoecol., 210, 187–214.Machel, H.G. (1999) Effects of groundwater flow on mineral
diagenesis, with emphasis on carbonate aquifers.
Hydrogeol. J., 7, 94–107.Machel, H.G. and Burton, E.A. (1991) Factors governing
cathodoluminescence in calcite and dolomite and their
implications for studies of carbonate diagenesis. In:
Luminescence Microscopy: Qualitative and QuantitativeApplications (Eds C.E. Barker and O.C. Kopp), SEPM
Short Course Notes, 25, 37–57.Marshall, J.D., Brenchley, P.J., Mason, P., Wolff, G.A.,
Astini, R.A., Hints, L. and Meidla, T. (1997) Global carbonisotopic events associated with mass extinction and
glaciation in the late Ordovician. Palaeogeogr.
Palaeoclimatol. Palaeoecol., 132, 195–210.
McConnaughey, T. (1989) 13C and 18O isotopic
disequilibrium in biological carbonates: I. Patterns.
Geochim. Cosmochim. Acta, 53, 151–162.McCracken, A.D. and Barnes, C.R. (1981) Conodont
biostratigraphy and palaeoecology of the Ellis Bay
Formation, Anticosti Island, Quebec, with special
reference to late Ordovician-early Silurian
chronostratigraphy and the systemic boundary. Bull. Geol.
Surv. Can., 329, 51–134.McKenzie, J.A. (1981) Holocene dolomitization of calcium
carbonate sediments from the coastal sabkas of Abu Dhabi,
U.A.E. J. Geol., 89, 185–198.McLaughlin, P.I., Emerson, N., Witzke, B., Sell, B. and
Emsbo, P. (2011) Distal signatures of Late Ordovician
oceanic anoxia – new data from a classic epeiric ramp
transect. In: Archean to Anthropocene: Field Guides to the
Geology of Mid-Continent North America (Eds J.D. Miller,
G.J. Hudak, C. Wittkop and P.I. McLaughlin), Geol. Soc.Am. Field Guide, 24, 259–284.
Melim, L.A. and Scholle, P.A. (2002) Dolomitization of the
Capitan Formation forereef facies (Permian, west Texas
and New Mexico): seepage reflux revisited. Sedimentology,
49, 1207–1227.Montanez, I.P. (1997) Secondary porosity and late diagenetic
cements of the Upper Knox Group, central Tennessee
region: a temporal and spatial history of fluid flow conduit
development within the Knox regional aquifer. In: Basin-
Wide Diagenetic Patterns: Integrated Petrologic,
Geochemical, and Hydologic Considerations (Eds I.P.
Montanez, J.M. Gregg and K.L. Shelton), SEPM Spec.
Publ., 57, 101–117.Montanez, I.P. and Read, J.F. (1992) Fluid-rock interaction
history during stabilization of early dolomites, Upper
Knox Group (Lower Ordovician), U.S. Appalachians. J.
Sed. Petrol., 62, 753–778.Moore, C.H., Chowdhury, A. and Chan, L. (1988) Upper
Jurassic Smackover platform dolomitization, northwestern
Gulf of Mexico: a tale of two waters. In: Sedimentology
and Geochemistry of Dolostones (Eds V. Shukla and P.A.
Baker), SEPM Spec. Publ., 43, 175–189.Morrow, D.W. (1982) Diagenesis 1. Dolomite – part 1: the
geochemistry of dolomitization and dolomite
precipitation. Geosci. Can., 9, 5–13.Mountjoy, E.W., Machel, H.G., Green, D., Duggan, J. and
Williams-Jones, A.E. (1999) Devonian matrix dolomites
and deep burial carbonate cements: a comparison between
the Rimbey-Meadowbrook reef trend and the deep basin of
west-central Alberta. Bull. Can. Petrol. Geol., 47, 487–509.Murphy, E.C., Nordeng, S.H., Juenker, B.J. and Hoganson,
J.W. (2009) Stratigraphic column of North Dakota. North
Dakota Geol. Surv. Misc. Ser., 91, 1 pl.
Neese, D.E. (1985) Depositional environment and diagenesis
of the Red River Formation, “C” Interval, Divide County,
North Dakota and Sheridan County, Montana. In: Rocky
Mountain Carbonate Reservoirs (Eds M.W. Longman, K.W.
Shanley, R.F. Lindsay and D.E. Eby), SEPM Core
Workshop, 7, 95–124.Nowlan, G.S. and Barnes, C.R. (1981) Late Ordovician
conodonts from the Vaur�eal Formation, Anticosti Island,
Qu�ebec. Bull. Geol. Surv. Can., 329, 1–49.Oberg, R. (1966) Winnipeg conodonts from Manitoba. J.
Paleontol., 40, 130–147.Oehlert, A.M., Lamb-Wozniak, K.A., Devlin, Q.B.,
MacKenzie, G.J., Reijmer, J.J. and Swart, P.K. (2012) Thestable carbon isotopic composition of organic material in
© 2014 The Authors. Sedimentology © 2014 International Association of Sedimentologists, Sedimentology, 62, 314–349
340 A. Husinec and S. M. Bergstr€om

platform derived sediments: implications for
reconstructing the global carbon cycle. Sedimentology, 59,319–335.
Panchuk, K., Holmden, C.E. and Kump, L.R. (2005)
Sensitivity of the epeiric sea carbon isotope record to
local-scale carbon cycle processes: tales from the
Mohawkian Sea. Palaeogeogr. Palaeoclimatol. Palaeoecol.,
228, 320–337.Panchuk, K., Holmden, C.E. and Leslie, S.A. (2006) Local
controls on carbon cycling in the Ordovician Midcontinent
region of North America with implications for carbon
isotope secular curves. J. Sed. Res., 76, 200–211.Paris, F., Elaouad-Debbaj, Z., Jaglin, J.C., Massa, D. and
Oulebsir, L. (1995) Chitinozoans and Late Ordovician
glacial events on Gondwana. In: Ordovician Odyssey:
Short Papers for the Seventh International Symposium on
the Ordovician System (Eds D. Cooper, M.L. Droser and
S.L. Finney), pp. 171–176. Pacific Section SEPM,
Fullerton, California.
Patterson, W.P. and Walter, L.M. (1994) Depletion of 13C in
seawater ΣCO2 on modern carbonate platforms:
significance for the carbon isotopic record of carbonates.
Geology, 22, 885–888.Patzkowsky, M.E., Slupik, L.M., Arthur, M.A., Pancost, R.D.
and Freeman, K.H. (1997) Late Middle Ordovician
environmental change and extinction: harbinger of the
Late Ordovician or continuation of Cambrian patterns?
Geology, 25, 911–914.Pope, M.C. and Read, J.F. (1998) Ordovician meter-scale
cycles: implications for climate and eustatic fluctuations
in the central Appalachians during a global greenhouse,
non-glacial to glacial transition. Palaeogeogr.Palaeoclimatol. Palaeoecol., 138, 27–42.
Porter, J.W. and Fuller, J.G.C.M. (1959) Lower Paleozoic
rocks of northern Williston basin and adjacent areas.
AAPG Bull., 43, 124–189.Qing, H. and Veizer, J. (1994) Oxygen carbon isotopic
composition of Ordovician brachiopods; implications for
coeval seawater. Geochim. Cosmochim. Acta, 58, 4429–4442.
Qing, H., Kent, D. and Bend, S. (2001) Preliminary results of
isotopic geochemistry of Ordovician Red River carbonates,
subsurface of southeastern Saskatchewan: implication for
process of dolomitization and diagenetic modification of
dolomites. Summary of Investigations 2001. Saskatchewan
Geological Survey; Saskatchewan Energy and Mines,
Miscellaneous Report 2001-4-1,1, 3–9.Railsback, L.B., Holland, S.M., Hunter, D.E., Michael, E.J.,
Diaz, J.R. and Crowe, D.E. (2003) Controls on geochemical
expression of subaerial exposure in Ordovician limestones
from the Nashville Dome, Tennessee, U.S.A. J. Sed. Res.,73, 790–805.
Rendall, B.E. and Husinec, A. (2012) Importance of
Dimorphosiphon (Chlorophyta, Bryopsidales) for facies
and biostratigraphic studies of the Upper Ordovician
Richmondian Red River Formation, Williston Basin.
Palaios, 27, 713–725.Riva, J. (1969) Middle and Upper Ordovician graptolite faunas
of Saint Lawrence Lowlands of Quebec and Anticosti
Island. In: North Atlantic-Geology and Continental Drift: A
Symposium (Ed. M. Kay), AAPG. Mem., 12, 513–556.Saltzman, M.R. and Young, S.A. (2005) Long-lived glaciation
in the Late Ordovician? Isotopic and sequence-
stratigraphic evidence from western Laurentia. Geology,
33, 109–112.
Sandberg, C.A. (1964) Precambrian to Mississippian
paleotectonics of the southern Williston basin. 3rd
International Williston Basin Symposium, Proceedings,
pp. 37–38.Sarg, J.F. (1988) Carbonate sequence stratigraphy. In: Sea-Level
Changes: An Integrated Approach (Eds C.K. Wilgus, B.S.
Hastings, C.G.St.C. Kendall, H.W. Posamentier, C.A. Ross
and J.C. Van Wagoner), SEPM Spec. Publ., 42, 155–181.Sarg, J.F. (2001) The sequence stratigraphy, sedimentology,
and economic importance of evaporite-carbonate
transitions: a review. Sed. Geol., 140, 9–42.Sarg, J.F., Suriamin, K.T.M. and Humphrey, J.D. (2013)
Lithofacies, stable isotopic composition, and stratigraphic
evolution of microbial and associated carbonates, Green
River Formation (Eocene), Piceance Basin, Colorado.
AAPG Bull., 97, 1937–1966.Sass, E., Bein, A. and Almogi-Labin, A. (1991) Oxygen-
isotope composition of diagenetic calcite in organic-rich
rocks: evidence for 18O depletion in marine anaerobic pore
water. Geology, 19, 839–842.Schidlowski, M. (1979) Carbon isotope geochemistry of the
3.7 x 10⁹ yr-old Isua sediments, West Greenland:
implications for the Archean carbon and oxygen cycles.
Geochim. Cosmochim. Acta, 43, 189–199.Sepkoski, J.J. (1995) The Ordovician radiations:
diversification and extinction shown by global genus-
level taxonomic data. In: Ordovician Odyssey: Short
Papers for the Seventh International Symposium on the
Ordovician System (Eds D. Cooper, M.L. Droser and S.L.
Finney), pp. 393–396. Pacific Section SEPM, Fullerton,
California.
Shackleton, N.J. and Pisias, N.G. (1985) Atmospheric carbon
dioxide, orbital forcing, and climate. In: The Carbon Cycle
and atmospheric CO2: Natural Variations Archaen to
Present: Geophysical Monograph (Eds E.T. Sundquist and
W.S. Broecker), pp. 412–417. AGU, Washington D.C.
Sheehan, P.M. (2001) The Late Ordovician mass extinction.
Annu. Rev. Earth Planet. Sci., 29, 331–364.Sinclair, G.W. (1959) Succession of Ordovician rocks in
southern Manitoba. Geol. Surv. Can. Pap., 59–5, 5.Skoglund, R. (1963) Uppermost Viruan and Lower Harjuan
(Ordovician) stratigraphy of V€asterg€otland and Lower
Harjuan graptolite faunas of central Sweden. Bull. Geol.Inst. Univ. Uppsala, 42, 1–55.
Sloss, L.L. (1963) Sequences in the cratonic interior of North
America. Geol. Soc. Am. Bull., 74, 93–114.Swart, P.K. (1983) Carbon and oxygen isotope fractionation in
Scleractinian corals: a review. Earth Sci. Rev., 19, 51–80.Swart, P.K. and Eberli, G.P. (2005) The nature of the d13C of
periplatform sediments: implications for stratigraphy and
the global carbon cycle. Sed. Geol., 175, 115–129.Swart, P.K. and Kennedy, M.J. (2012) Does the global
stratigraphic reproducibility of d13C in Neoproterozoic
carbonates require a marine origin? A Pliocene-Pleistocene
comparison. Geology, 40, 87–90.Swart, P.K. and Melim, L.A. (2000) The origin of dolomites
in Tertiary sediments from the margin of Great Bahama
Bank. J. Sed. Res., 70, 738–748.Swart, P.K., Reijmer, J.G. and Otto, R. (2009) A re-
evaluation of facies on Great Bahama Bank II: variations in
the d13C, d18O and mineralogy of surface sediments. In:
Perspectives in Carbonate Geology: A Tribute to the Careerof Robert Nathan Ginsburg (Eds P.K. Swart, G.P. Eberlie
and J.A. McKenzie), Int. Assoc. Sedimentol. Spec. Publ.,
41, 47–59.
© 2014 The Authors. Sedimentology © 2014 International Association of Sedimentologists, Sedimentology, 62, 314–349
Carbon-isotope record of an epicratonic basin 341

Sweet, W.C. (1982) Conodonts from the Winnipeg Formation
(Middle Ordovician) of the northern Black Hills, South
Dakota. J. Paleontol., 56, 1029–1059.Tobin, K.J. and Walker, K.R. (1997) Ordovician oxygen
isotopes and paleotemperatures. Palaeogeogr.
Palaeoclimatol. Palaeoecol., 129, 269–290.Trotter, J.A., Williams, I.S., Barnes, C.R., L�ecuyer, C. and
Nicoll, R.S. (2008) Did cooling oceans trigger Ordovician
biodiversification? Evidence from conodont thermometry.
Science, 321, 550–554.Tucker, M.E. (1991) Sequence stratigraphy of carbonate-
evaporite basins: models and application to the Upper
Permian (Zechstein) of Northeast England and adjoining
North Sea. J. Geol. Soc. London, 148, 1019–1036.Twenhofel, W.H. (1929) Geology of Anticosti Island. Can.
Geol. Surv. Mem., 154, 1–481.Underwood, C.J., Crowley, S., Marshall, J.D. and Brenchley,
P.J. (1997) High-resolution carbon isotope stratigraphy of
the basal Silurian stratotype (Dob’s Linn, Scotland) and its
global correlation. J. Geol. Soc. London, 154, 709–718.Vahrenkamp, V.C. (1996) Carbon isotope stratigraphy of the
Upper Kharaib and Shuaiba formations: implications for
the Early Cretaceous evolution of the Arabian Gulf Region.
AAPG Bull., 80, 647–662.Vahrenkamp, V.C. and Swart, P.K. (1994) Late Cenozoic
dolomites of the Bahamas: metastable analogues for the
genesis of ancient platform dolomites. In: Dolomites, a
Volume in Honor of Dolomieu (Eds B. Purser, M. Tucker and
D. Zenger), Int. Assoc. Sedimentol. Spec. Publ., 21, 133–153.Van Wagoner, J.C., Posamentier, H.W., Mitchum, R.M. Jr,
Vail, P.R., Sarg, J.F., Loutit, T.S. and Hardenbol, J. (1988)An overview of the fundamentals of sequence stratigraphy
and key definitions. In: Sea-Level Changes: An Integrated
Approach (Eds C.K. Wilgus, B.S. Hastings, C.G.St.C.
Kendall, H.W. Posamentier, C.A. Ross and J.C. Van
Wagoner), SEPM Spec. Publ., 42, 39–47.Vandenbroucke, T.R.A., Armstrong, H.A., Williams, M.,
Paris, F., Zalasiewicz, J.A., Sabbe, K., N~olvak, J.,Challands, T.J., Verniers, J. and Servais, T. (2010) Polar
front shift and atmospheric CO2 during the glacial
maximum of the Early Paleozoic Icehouse. Proc. Natl
Acad. Sci. USA, 107, 14983–14986.Vasconcelos, C., McKenzie, J.A., Warthmann, R.
and Bernasconi, S.M. (2005) Calibribration of the d18Opaleothermometer for dolomite precipitated in
microbial cultures and natural environments. Geology,
33, 317–320.Veizer, J. and Hoefs, J. (1976) The nature of 18O/16O and
13C/12C secular trends in sedimentary carbonate rocks.
Geochim. Cosmochim. Acta, 40, 1387–1395.Weber, L.J., Sarg, J.F. and Wright, F.M. (1995) Sequence
stratigraphy and reservoir delineation of the Middle
Pennsylvanian (Desmoinesian) Paradox basin and Aneth
Field, southwestern USA. In: Milankovitch Sea-Level
Changes, Cycles, and Reservoirs on Carbonate Platforms in
Greenhouse and Ice-House Worlds (Eds J.F. Read, C.
Kerans, L.J. Weber, J.F. Sarg and F.M. Wright), SEPMShort Course Notes, 35, 1–81.
Weissert, H. (1989) C-isotope stratigraphy, a monitor of
paleoenvironmental change: a case study from the early
Cretaceous. Surv. Geophys., 10, 1–61.Yapp, C.J. and Poths, H. (1992) Ancient atmospheric CO2
pressures inferred from natural goethites. Nature, 355,342–344.
Young, S.A., Saltzman, M.R., Ausich, W.I., Desrochers, A.and Kaljo, D. (2010) Did changes in atmospheric CO2
coincide with latest Ordovician glacial–interglacial cycles?Palaeogeogr. Palaeoclimatol. Palaeoecol., 296, 376–388.
Zenger, D.H. (1996) Dolomitization of the “C” zone, Red
River Formation (Upper Ordovician) in a deep core,
Williston basin, Richland County, eastern Montana.
Contrib. Geol., 31, 57–75.
Manuscript received 29 May 2013; revision accepted10 June 2014
© 2014 The Authors. Sedimentology © 2014 International Association of Sedimentologists, Sedimentology, 62, 314–349
342 A. Husinec and S. M. Bergstr€om

APPENDIX
Table
A1.
Borehole
data
forloggedintervals
andbulk
matrix
samples.
Wellname
NDIC
a
No.
County
Latitude
Longitude
Elevationbin
metres(feet)
RedRivertop§
Logged
intervaltopc
Loggedinterval
bottom
§
Logged
interval
thickness
Samples
UrlacherState
Unit#1
8010
Hettinger
46°180 25.47″N
102°480 23.19″W
816.3
(2678)
3070.9
(10075)
3069.9
(10072)
3156.5
(10356)
86.6
(284)
101
Federal#10-1
9103
Dunn
47°330 46.57″N
102°530 28.07″W
668.4
(2193)
4170.9
(13684)
4192.8
(13756)
4267.8
(14002)
75(246)
69
Sim
pson#1
9800
Williams
48°280 46.10″N
103°110 51.60″W
694(2277)
4045.9
(13274)
4041.6
(13260)
4113.9
(13497)
72.2
(237)
65
Coresare
storedattheNorthDakota
GeologicalSurvey’s
WilsonM.LairdCore
andSample
Library,GrandForks,
NorthDakota.
aNorthDakota
Industrial
Commission,Oil
and
GasDivision.
bReferenced
tothekellybush
ing(K
B),
an
adapterthatservesto
connecttherotary
table
tothekelly.
cDepth
below
theKB
inmetres(feet).
Table
A2.
Stable-isotopedata
forbulk
carbonate
matrix
samples.
Depth
(m)
Depth
(feet)
d13C
[&VPDB]
d18O
[&VPDB]
Bulk
Lithology
Interval/Member
Form
ation
NDGS#8010a
3070.6
10074
0.75
�6.77
Lim
estone
StonyMountain
3071.5
10077
0.08
�7.40
Lim
estone
StonyMountain
3072.4
10080
�0.33
�7.35
Lim
estone
StonyMountain
3073.3
10083
�0.63
�7.00
Lim
estone
Ainterval
RedRiver
3073.9
10085
�1.05
�5.81
Lim
estone
Ainterval
RedRiver
3074.5
10087
�1.12
�6.11
Lim
estone
Ainterval
RedRiver
3075.4
10090
�1.87
�5.93
Lim
estone
Ainterval
RedRiver
3076.3
10093
�0.30
�5.55
Lim
estone
Ainterval
RedRiver
3077.0
10095
�0.59
�4.17
Dolomite
Ainterval
RedRiver
3077.6
10097
�0.09
�4.24
Dolomite
Ainterval
RedRiver
3077.9
10098
�0.95
�5.61
Lim
estone
Ainterval
RedRiver
3078.8
10101
�0.24
�4.75
Lim
estone
Ainterval
RedRiver
3079.7
10104
�0.30
�5.09
Lim
estone
Ainterval
RedRiver
3080.6
10107
�0.34
�5.49
Lim
estone
Ainterval
RedRiver
3081.5
10110
�0.20
�4.70
Lim
estone
Ainterval
RedRiver
3082.4
10113
�1.39
�4.83
Lim
estone
Ainterval
RedRiver
3083.1
10115
�2.08
�4.59
Lim
estone
Ainterval
RedRiver
3084.0
10118
�2.00
�4.49
Lim
estone
Ainterval
RedRiver
© 2014 The Authors. Sedimentology © 2014 International Association of Sedimentologists, Sedimentology, 62, 314–349
Carbon-isotope record of an epicratonic basin 343

Table
A2.(continued)
Depth
(m)
Depth
(feet)
d13C[&
VPDB]
d18O
[&VPDB]
Bulk
Lithology
Interval/Member
Form
ation
3084.9
10121
�0.92
�4.95
Lim
estone
Ainterval
RedRiver
3087.3
10129
1.27
�4.91
Dolomite
Blaminatedmbr.
RedRiver
3087.9
10131
1.33
�5.13
Dolomite
Blaminatedmbr.
RedRiver
3088.2
10132
1.43
�5.14
Dolomite
Blaminatedmbr.
RedRiver
3088.5
10133
1.07
�4.94
Dolomite
Blaminatedmbr.
RedRiver
3089.8
10137
0.96
�3.89
Dolomite
Blaminatedmbr.
RedRiver
3090.7
10140
0.73
�6.03
Lim
estone
Bburrowedmbr.
RedRiver
3091.3
10142
0.71
�5.33
Lim
estone
Bburrowedmbr.
RedRiver
3092.2
10145
1.13
�5.44
Lim
estone
Bburrowedmbr.
RedRiver
3093.1
10148
0.79
�6.77
Lim
estone
Bburrowedmbr.
RedRiver
3094.0
10151
0.90
�5.64
Lim
estone
Bburrowedmbr.
RedRiver
3095.2
10155
0.93
�5.31
Lim
estone
Bburrowedmbr.
RedRiver
3096.2
10158
0.72
�4.11
Lim
estone
Bburrowedmbr.
RedRiver
3097.1
10161
1.14
�5.09
Lim
estone
Bburrowedmbr.
RedRiver
3098.0
10164
0.78
�5.30
Lim
estone
Bburrowedmbr.
RedRiver
3098.9
10167
0.78
�5.05
Lim
estone
Bburrowedmbr.
RedRiver
3099.8
10170
1.36
�5.17
Lim
estone
Bburrowedmbr.
RedRiver
3100.7
10173
0.99
�5.07
Lim
estone
Bburrowedmbr.
RedRiver
3101.6
10176
�0.74
�4.33
Dolomite
Bburrowedmbr.
RedRiver
3105.3
10188
0.34
�4.79
Dolomite
Canhydrite
mbr.
RedRiver
3106.2
10191
0.32
�4.58
Dolomite
Canhydrite
mbr.
RedRiver
3107.1
10194
�0.03
�4.56
Dolomite
Canhydrite
mbr.
RedRiver
3108.0
10197
�0.69
�4.18
Dolomite
Canhydrite
mbr.
RedRiver
3109.3
10201
0.53
�4.46
Dolomite
Canhydrite
mbr.
RedRiver
3109.9
10203
1.08
�4.02
Dolomite
Canhydrite
mbr.
RedRiver
3110.2
10204
0.46
�4.43
Dolomite
Canhydrite
mbr.
RedRiver
3111.1
10207
0.28
�4.37
Dolomite
Canhydrite
mbr.
RedRiver
3111.4
10208
�0.04
�4.41
Dolomite
Canhydrite
mbr.
RedRiver
3112.0
10210
0.68
�4.60
Dolomite
Canhydrite
mbr.
RedRiver
3112.9
10213
0.89
�4.72
Dolomite
Claminatedmbr.
RedRiver
3113.5
10215
1.52
�4.70
Dolomite
Claminatedmbr.
RedRiver
3113.8
10216
0.87
�4.70
Dolomite
Claminatedmbr.
RedRiver
3114.4
10218
0.70
�4.63
Dolomite
Claminatedmbr.
RedRiver
3115.1
10220
1.18
�5.06
Dolomite
Claminatedmbr.
RedRiver
3115.4
10221
0.78
�4.86
Dolomite
Claminatedmbr.
RedRiver
3116.3
10224
0.65
�5.53
Dolomite
Claminatedmbr.
RedRiver
3117.5
10228
0.21
�6.33
Lim
estone
Claminatedmbr.
RedRiver
3118.4
10231
1.03
�4.11
Dolomite
Claminatedmbr.
RedRiver
3119.3
10234
1.12
�4.57
Dolomite
Claminatedmbr.
RedRiver
3120.2
10237
0.92
�6.11
Lim
estone
Claminatedmbr.
RedRiver
© 2014 The Authors. Sedimentology © 2014 International Association of Sedimentologists, Sedimentology, 62, 314–349
344 A. Husinec and S. M. Bergstr€om

Table
A2.(continued)
Depth
(m)
Depth
(feet)
d13C[&
VPDB]
d18O
[&VPDB]
Bulk
Lithology
Interval/Member
Form
ation
3120.5
10238
0.48
�6.40
Lim
estone
Claminatedmbr.
RedRiver
3121.5
10241
0.63
�6.43
Lim
estone
Claminatedmbr.
RedRiver
3122.4
10244
0.71
�6.38
Lim
estone
Claminatedmbr.
RedRiver
3123.3
10247
1.50
�5.18
Dolomite
Claminatedmbr.
RedRiver
3124.5
10251
1.25
�4.93
Dolomite
Claminatedmbr.
RedRiver
3125.1
10253
1.04
�4.57
Dolomite
Claminatedmbr.
RedRiver
3125.7
10255
1.04
�4.23
Dolomite
Claminatedmbr.
RedRiver
3126.6
10258
0.54
�5.70
Lim
estone
Cburrowedmbr.
RedRiver
3127.6
10261
0.30
�6.36
Lim
estone
Cburrowedmbr.
RedRiver
3128.5
10264
0.13
�6.01
Lim
estone
Cburrowedmbr.
RedRiver
3129.4
10267
0.10
�6.59
Lim
estone
Cburrowedmbr.
RedRiver
3130.3
10270
0.60
�6.25
Lim
estone
Cburrowedmbr.
RedRiver
3131.2
10273
�0.01
�6.71
Lim
estone
Cburrowedmbr.
RedRiver
3132.1
10276
0.22
�6.57
Lim
estone
Cburrowedmbr.
RedRiver
3133.0
10279
0.35
�6.30
Lim
estone
Cburrowedmbr.
RedRiver
3134.0
10282
0.25
�5.94
Lim
estone
Cburrowedmbr.
RedRiver
3134.9
10285
0.14
�6.32
Lim
estone
Cburrowedmbr.
RedRiver
3135.8
10288
0.37
�6.68
Lim
estone
Cburrowedmbr.
RedRiver
3136.7
10291
0.42
�6.37
Lim
estone
Cburrowedmbr.
RedRiver
3137.6
10294
0.20
�5.93
Lim
estone
Cburrowedmbr.
RedRiver
3138.2
10296
1.05
�3.78
Dolomite
Cburrowedmbr.
RedRiver
3138.5
10297
0.43
�5.71
Dol.limestone
Cburrowedmbr.
RedRiver
3139.1
10299
0.66
�5.30
Dolomite
Cburrowedmbr.
RedRiver
3140.0
10302
0.60
�5.49
Lim
estone
Cburrowedmbr.
RedRiver
3141.0
10305
0.09
�6.47
Lim
estone
Cburrowedmbr.
RedRiver
3141.9
10308
0.27
�6.31
Lim
estone
Cburrowedmbr.
RedRiver
3143.7
10314
0.28
�7.21
Lim
estone
Cburrowedmbr.
RedRiver
3144.3
10316
1.08
�4.58
Dolomite
Cburrowedmbr.
RedRiver
3145.5
10320
0.47
�6.63
Lim
estone
Cburrowedmbr.
RedRiver
3147.1
10325
0.21
�7.14
Lim
estone
Cburrowedmbr.
RedRiver
3152.9
10344
0.53
�5.78
Lim
estone
Cburrowedmbr.
RedRiver
3153.8
10347
0.11
�6.28
Lim
estone
Cburrowedmbr.
RedRiver
3154.7
10350
0.74
�5.18
Lim
estone
Cburrowedmbr.
RedRiver
3155.6
10353
0.36
�5.68
Lim
estone
Cburrowedmbr.
RedRiver
3156.5
10356
0.39
�6.07
Lim
estone
Cburrowedmbr.
RedRiver
Carbon-isotope record of an epicratonic basin 345
© 2014 The Authors. Sedimentology © 2014 International Association of Sedimentologists, Sedimentology, 62, 314–349

Table
A2.(continued)
Depth
(m)
Depth
(feet)
d13C[&
VPDB]
d18O
[&VPDB]
Bulk
Lithology
Interval/Member
Form
ation
NDGS#9103
4194.7
13762
1.71
�6.72
Lim
estone
Banhydrite
mbr.
RedRiver
4195.6
13765
1.29
�6.96
Lim
estone
Blaminitembr.
RedRiver
4196.5
13768
1.15
�4.94
Dolomite
Blaminitembr.
RedRiver
4197.4
13771
0.26
�5.65
Dolomite
Blaminitembr.
RedRiver
4198.0
13773
0.59
�5.31
Dolomite
Blaminitembr.
RedRiver
4198.6
13775
0.30
�4.91
Lim
estone
Blaminitembr.
RedRiver
4215.1
13829
1.22
�4.72
Dolomite
Canhydrite
mbr.
RedRiver
4216.0
13832
�0.20
�5.28
Dolomite
Canhydrite
mbr.
RedRiver
4217.2
13836
1.11
�5.51
Dolomite
Claminatedmbr.
RedRiver
4217.5
13837
1.32
�4.66
Dolomite
Claminatedmbr.
RedRiver
4217.8
13838
0.88
�4.91
Dolomite
Claminatedmbr.
RedRiver
4218.7
13841
0.79
�5.06
Dolomite
Claminatedmbr.
RedRiver
4219.3
13843
0.45
�4.72
Dolomite
Claminatedmbr.
RedRiver
4219.7
13844
0.10
�5.27
Dolomite
Claminatedmbr.
RedRiver
4223.9
13858
�0.23
�6.45
Lim
estone
Claminatedmbr.
RedRiver
4224.8
13861
0.19
�6.16
Lim
estone
Claminatedmbr.
RedRiver
4225.7
13864
�0.11
�6.70
Lim
estone
Cburrowedmbr.
RedRiver
4226.7
13867
�0.02
�6.80
Lim
estone
Cburrowedmbr.
RedRiver
4227.6
13870
0.10
�6.79
Lim
estone
Cburrowedmbr.
RedRiver
4228.5
13873
�0.09
�6.83
Lim
estone
Cburrowedmbr.
RedRiver
4229.1
13875
0.49
�6.14
Lim
estone
Cburrowedmbr.
RedRiver
4230.3
13879
�0.10
�6.29
Lim
estone
Cburrowedmbr.
RedRiver
4230.9
13881
0.21
�6.26
Lim
estone
Cburrowedmbr.
RedRiver
4231.8
13884
0.45
�5.35
Dolomite
Cburrowedmbr.
RedRiver
4232.8
13887
0.25
�6.84
Dolomite
Cburrowedmbr.
RedRiver
4233.7
13890
0.44
�5.36
Lim
estone
Cburrowedmbr.
RedRiver
4234.0
13891
0.32
�4.88
Dolomite
Cburrowedmbr.
RedRiver
4234.6
13893
0.00
�6.15
Lim
estone
Cburrowedmbr.
RedRiver
4235.5
13896
0.11
�6.56
Lim
estone
Cburrowedmbr.
RedRiver
4236.4
13899
0.65
�5.24
Lim
estone
Cburrowedmbr.
RedRiver
4236.7
13900
0.75
�5.38
Dolomite
Cburrowedmbr.
RedRiver
4237.3
13902
0.20
�6.57
Dolomite
Cburrowedmbr.
RedRiver
4238.2
13905
0.00
�6.65
Lim
estone
Cburrowedmbr.
RedRiver
4239.2
13908
0.07
�6.59
Lim
estone
Cburrowedmbr.
RedRiver
4240.1
13911
0.34
�6.07
Lim
estone
Cburrowedmbr.
RedRiver
4241.0
13914
0.42
�5.74
Lim
estone
Cburrowedmbr.
RedRiver
4242.2
13918
0.54
�6.00
Lim
estone
Cburrowedmbr.
RedRiver
4243.1
13921
�0.36
�6.78
Lim
estone
Cburrowedmbr.
RedRiver
4244.0
13924
0.56
�5.79
Lim
estone
Cburrowedmbr.
RedRiver
346 A. Husinec and S. M. Bergstr€om
© 2014 The Authors. Sedimentology © 2014 International Association of Sedimentologists, Sedimentology, 62, 314–349

Table
A2.(continued)
Depth
(m)
Depth
(feet)
d13C[&
VPDB]
d18O
[&VPDB]
Bulk
Lithology
Interval/Member
Form
ation
4244.6
13926
0.93
�5.42
Dolomite
Cburrowedmbr.
RedRiver
4244.9
13927
0.18
�6.15
Lim
estone
Cburrowedmbr.
RedRiver
4245.9
13930
�0.02
�6.30
Lim
estone
Cburrowedmbr.
RedRiver
4246.8
13933
�0.09
�6.29
Lim
estone
Cburrowedmbr.
RedRiver
4247.7
13936
0.03
�5.81
Lim
estone
Cburrowedmbr.
RedRiver
4248.9
13940
0.23
�6.06
Lim
estone
Cburrowedmbr.
RedRiver
4249.5
13942
0.88
�4.96
Dolomite
Cburrowedmbr.
RedRiver
4249.8
13943
0.21
�5.81
Lim
estone
Cburrowedmbr.
RedRiver
4250.7
13946
0.10
�5.85
Lim
estone
Cburrowedmbr.
RedRiver
4252.0
13950
0.11
�5.96
Lim
estone
Cburrowedmbr.
RedRiver
4252.9
13953
0.15
�5.82
Lim
estone
Cburrowedmbr.
RedRiver
4253.8
13956
0.37
�5.63
Lim
estone
Cburrowedmbr.
RedRiver
4254.7
13959
�0.10
�5.93
Lim
estone
Cburrowedmbr.
RedRiver
4255.6
13962
0.58
�5.69
Lim
estone
Cburrowedmbr.
RedRiver
4256.5
13965
�0.06
�5.40
Lim
estone
Cburrowedmbr.
RedRiver
4257.4
13968
0.29
�5.44
Lim
estone
Cburrowedmbr.
RedRiver
4258.4
13971
�0.15
�6.16
Lim
estone
Cburrowedmbr.
RedRiver
4259.3
13974
0.48
�6.16
Lim
estone
Cburrowedmbr.
RedRiver
4259.9
13976
0.46
�6.71
Lim
estone
Cburrowedmbr.
RedRiver
4260.8
13979
0.35
�6.06
Lim
estone
Cburrowedmbr.
RedRiver
4261.7
13982
0.78
�5.69
Lim
estone
Cburrowedmbr.
RedRiver
4262.6
13985
0.38
�6.25
Lim
estone
Cburrowedmbr.
RedRiver
4263.5
13988
0.50
�5.61
Lim
estone
Cburrowedmbr.
RedRiver
4264.2
13990
0.93
�5.76
Lim
estone
Cburrowedmbr.
RedRiver
4265.1
13993
1.09
�5.97
Lim
estone
Cburrowedmbr.
RedRiver
4266.0
13996
0.83
�6.15
Lim
estone
Cburrowedmbr.
RedRiver
4266.6
13998
0.97
�6.07
Lim
estone
Cburrowedmbr.
RedRiver
4267.5
14001
0.77
�6.17
Lim
estone
Cburrowedmbr.
RedRiver
NDGS#9800
4042.6
13263
�0.90
�6.83
Lim
estone
StonyMountain
4043.5
13266
�0.87
�6.47
Lim
estone
StonyMountain
4044.4
13269
�2.79
�7.43
Lim
estone
StonyMountain
4045.6
13273
�0.67
�6.26
Lim
estone
Ainterval
RedRiver
4046.2
13275
�0.23
�5.73
Lim
estone
Ainterval
RedRiver
4047.1
13278
�2.03
�5.99
Lim
estone
Ainterval
RedRiver
4048.0
13281
0.04
�6.17
Lim
estone
Ainterval
RedRiver
4049.0
13284
�0.13
�6.51
Lim
estone
Ainterval
RedRiver
4049.9
13287
0.31
�6.54
Lim
estone
Ainterval
RedRiver
4051.1
13291
�0.32
�6.62
Lim
estone
Ainterval
RedRiver
4052.0
13294
�0.83
�5.67
Lim
estone
Ainterval
RedRiver
Carbon-isotope record of an epicratonic basin 347
© 2014 The Authors. Sedimentology © 2014 International Association of Sedimentologists, Sedimentology, 62, 314–349

Table
A2.(continued)
Depth
(m)
Depth
(feet)
d13C[&
VPDB]
d18O
[&VPDB]
Bulk
Lithology
Interval/Member
Form
ation
4052.6
13296
1.05
�3.78
Lim
estone
Ainterval
RedRiver
4052.9
13297
�3.07
�5.85
Lim
estone
Ainterval
RedRiver
4053.8
13300
�1.31
�6.02
Lim
estone
Ainterval
RedRiver
4056.9
13310
�0.71
�6.27
Lim
estone
Ainterval
RedRiver
4057.8
13313
�1.78
�4.84
Lim
estone
Ainterval
RedRiver
4059.6
13319
�1.33
�5.35
Lim
estone
Ainterval
RedRiver
4060.5
13322
�2.50
�6.22
Lim
estone
Ainterval
RedRiver
4060.9
13323
�1.80
�6.42
Lim
estone
Ainterval
RedRiver
4061.5
13325
�2.67
�6.70
Lim
estone
Ainterval
RedRiver
4062.4
13328
�2.09
�6.24
Lim
estone
Ainterval
RedRiver
4063.3
13331
�2.41
�5.77
Lim
estone
Ainterval
RedRiver
4064.2
13334
�2.45
�5.11
Lim
estone
Ainterval
RedRiver
4066.0
13340
�0.44
�7.51
Dolomite
Banhydrite
mbr.
RedRiver
4069.7
13352
0.99
�4.35
Dolomite
Blaminatedmbr.
RedRiver
4070.6
13355
1.77
�5.32
Dolomite
Blaminatedmbr.
RedRiver
4071.2
13357
2.06
�4.59
Dolomite
Blaminatedmbr.
RedRiver
4071.5
13358
1.64
�4.89
Dolomite
Blaminatedmbr.
RedRiver
4071.8
13359
0.43
�5.08
Dolomite
Blaminatedmbr.
RedRiver
4072.4
13361
0.54
�5.60
Dolomite
Blaminatedmbr.
RedRiver
4074.3
13367
0.37
�6.51
Lim
estone
Bburrowedmbr.
RedRiver
4075.2
13370
�0.99
�5.43
Lim
estone
Bburrowedmbr.
RedRiver
4076.1
13373
�0.14
�5.41
Lim
estone
Bburrowedmbr.
RedRiver
4077.0
13376
0.46
�5.66
Lim
estone
Bburrowedmbr.
RedRiver
4077.3
13377
0.59
�6.11
Lim
estone
Bburrowedmbr.
RedRiver
4077.9
13379
0.04
�6.90
Lim
estone
Bburrowedmbr.
RedRiver
4078.8
13382
0.65
�6.45
Lim
estone
Bburrowedmbr.
RedRiver
4080.7
13388
0.47
�4.98
Dolomite
Canhydrite
mbr.
RedRiver
4084.9
13402
�0.03
�6.64
Dolomite
Canhydrite
mbr.
RedRiver
4085.8
13405
1.20
�4.56
Dolomite
Claminatedmbr.
RedRiver
4087.1
13409
0.97
�7.75
Lim
estone
Claminatedmbr.
RedRiver
4089.8
13418
0.75
�8.04
Lim
estone
Claminatedmbr.
RedRiver
4090.7
13421
0.51
�6.17
Lim
estone
Claminatedmbr.
RedRiver
4091.6
13424
�0.03
�7.41
Lim
estone
Claminatedmbr.
RedRiver
4092.2
13426
�1.01
�7.89
Lim
estone
Claminatedmbr.
RedRiver
4093.5
13430
0.01
�6.46
Lim
estone
Claminatedmbr.
RedRiver
4094.1
13432
�0.12
�7.17
Lim
estone
Claminatedmbr.
RedRiver
4095.0
13435
�0.15
�6.79
Lim
estone
Claminatedmbr.
RedRiver
4095.9
13438
�0.69
�7.59
Lim
estone
Claminatedmbr.
RedRiver
4096.8
13441
0.40
�5.10
Lim
estone
Claminatedmbr.
RedRiver
4097.4
13443
�0.98
�7.75
Lim
estone
Claminatedmbr.
RedRiver
348 A. Husinec and S. M. Bergstr€om
© 2014 The Authors. Sedimentology © 2014 International Association of Sedimentologists, Sedimentology, 62, 314–349

Table
A2.(continued)
Depth
(m)
Depth
(feet)
d13C[&
VPDB]
d18O
[&VPDB]
Bulk
Lithology
Interval/Member
Form
ation
4098.3
13446
�0.38
�7.02
Lim
estone
Claminatedmbr.
RedRiver
4099.3
13449
�0.47
�7.89
Lim
estone
Claminatedmbr.
RedRiver
4099.9
13451
0.00
�6.95
Lim
estone
Claminatedmbr.
RedRiver
4100.8
13454
0.30
�7.22
Lim
estone
Claminatedmbr.
RedRiver
4102.6
13460
�0.45
�7.82
Lim
estone
Claminatedmbr.
RedRiver
4103.5
13463
0.32
�5.90
Lim
estone
Claminatedmbr.
RedRiver
4105.4
13469
�0.04
�6.07
Lim
estone
Claminatedmbr.
RedRiver
4106.0
13471
�0.27
�6.72
Lim
estone
Claminatedmbr.
RedRiver
4108.4
13479
�0.21
�6.11
Lim
estone
Claminatedmbr.
RedRiver
4109.3
13482
�0.17
�7.41
Lim
estone
Claminatedmbr.
RedRiver
4110.2
13485
�0.27
�6.30
Lim
estone
Claminatedmbr.
RedRiver
4111.8
13490
0.97
�4.50
Lim
estone
Claminatedmbr.
RedRiver
aNorthDakota
IndustrialCommission,Oil
andGasDivision;well
no.
Carbon-isotope record of an epicratonic basin 349
© 2014 The Authors. Sedimentology © 2014 International Association of Sedimentologists, Sedimentology, 62, 314–349