12-06 predictive modeling - canadian reinsurance predictive modeling.pdf · question … researcher...
TRANSCRIPT
Predictive Modeling

Julie ChambersDirector Risk Research
London Life Insurance Company
Question …
Researcher investigating an individual’s lifestyle discovers that personal credit scores correlates with risky behaviour
Question …
Researcher investigating an individual’s lifestyle discovers that personal credit scores correlates with risky behaviour
Is this a predictive model?
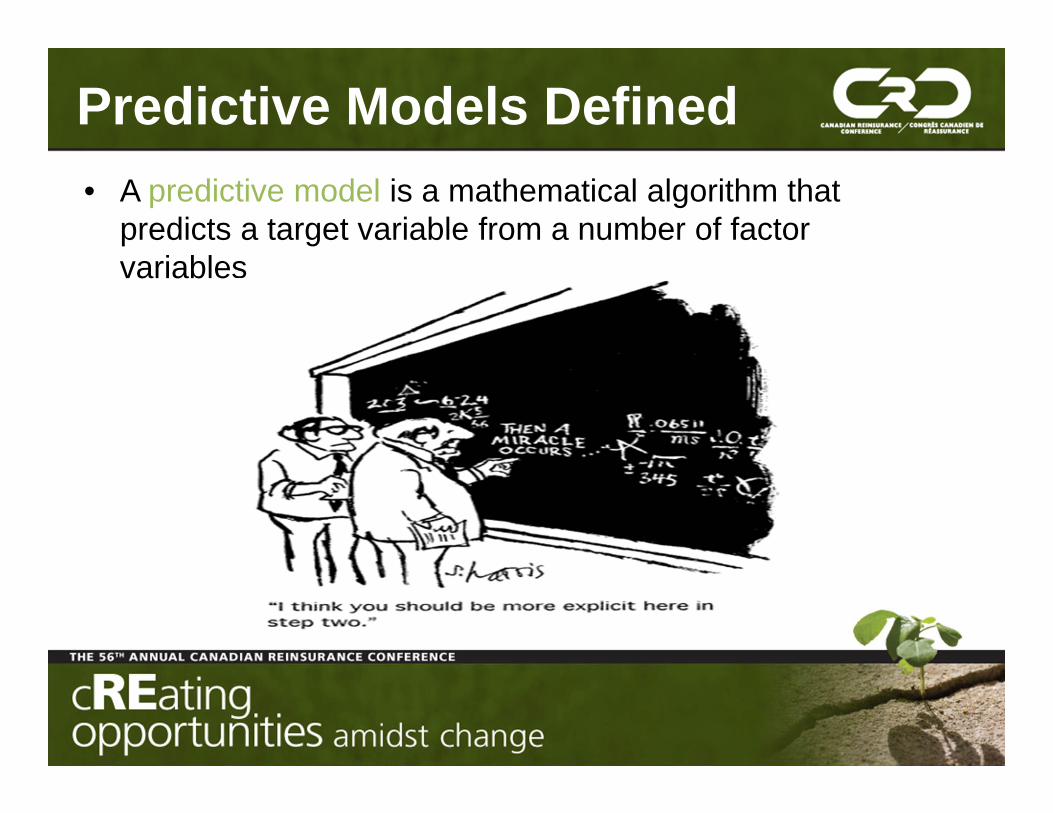
Predictive Models Defined• A predictive model is a mathematical algorithm that
predicts a target variable from a number of factor variables
Semantics• Data Mining – Exploration and Discovery
– Find “interesting” patterns in databases– Open-ended, “cast the net” wide
• Predictive Modeling – Apply Statistical Techniques– Quantify and synthesize relationships found
during knowledge and discovery

Examples of Predictive Modeling
• The Netflix algorithm CineMatch determines whichmovies a customer is likely to enjoy based on:
– The films themselves, which are arranged as groups of common movies– The customers' ratings, rented movies and current queue– The combined ratings of all Netflix users
• According to Netflix, half of Netflix users who rented CineMatchrecommended movies gave them a five-star rating
• Netflix launched a contest with a $1 million prize to the first person or team meet the accuracy goals for recommending movies based on users' personal preferences
Source: www.howstuffworks.com
Examples of Predictive ModelingTo make matches, a computer:
1. Searches the CineMatch database for people who have rated the same movie - for example, "The Return of the Jedi"
2. Determines which of those people have also rated a second movie, such as "The Matrix"3. Calculates the statistical likelihood that people who liked "Return of the Jedi" will also like "The Matrix"4. Continues this process to establish a pattern of correlations between subscribers' ratings of many different
films
Algorithms that keep the recommendation system running don't necessarily have anything to do with the plot or cast.
They are based on the other subscribers' rental and ratings histories.
Source: www.howstuffworks.com
Examples of Predictive Modeling• codenamed “Synapse” the Match algorithm, considers a variety of factors• User’s stated preferences such as:
– Age range– Hair colour– Body type
• The algorithm learns from the user’s actions on the site, it began "weighting" variables differently, according to how users behaved
– For example, “if conservative users were actually looking at profiles of liberals, the algorithm would learn from that and recommend more liberal users to them”
– For example, “if a woman says she doesn't want to date anyone older than 26, but often looks at profiles of thirty-somethings, Match will know she is in fact open to meeting older men.”
• Triangulation – Looks at the behaviour of similar users and factors this in too
• “It’s all about behaviour modeling. All that data goes into algorithms and affects who we put in front of you.”
Source: The Financial Times, “Inside Match.com, It’s all about the algorithm”
Examples of Predictive ModelingSanta Cruz’s Predictive Policing Program
“police officers were directed to the parking structure by a computer program that had predicted that car burglaries were especially likely there that day”
• By analyzing and detecting patterns in years of past crime data, it generates projections about areas and windows of time that are high risk
• Projections are recalibrated daily as new crimes occur and are fed into the program
Source: Mercury News, Santa Cruz’s predictive policing program becomes a model for departments nationwide, August 18, 2011
Examples of Predictive ModelingFighting Medicare Fraud
“Centers for Medicare and Medicaid Services (CMS) is poised to begin using predictive modeling technology to fightMedicare fraud”
• Examine claims by beneficiary, provider, service origin and other patterns to identify potential problems
– Similar to technology being used to detect fraud by credit card companies
• Create automatic alerts and “risk scores” for claims
Source: RACmonitor.com, “RAC Game Changer: Predictifve Modeling”, June 22, 2011
Examples of Predictive ModelingHow VISA Predicts Divorce
“Predicting people’s behaviour is becoming big business”
“Because people who are going through a divorce are more likely to miss payments, your domestic troubles are of great importance to a company that thrives on risk management”
• Credit card companies create psychological profiles of it’s cardholders that were built on alarming precise correlations
– “if you show us what you buy, we can tell you who you are, maybe even better than you know yourself”
Source: The Daily Beast, “How Visa Predicts Divorce”
Examples of Predictive Modeling
Harrah’s Casino “Analysis of gambling patterns …showedthat most customers have a “pain threshold” beyondwhich they will not bet. When losses reach that point,they may become disillusioned and leave the casino.”
– Harrah’s calculates each individual’s threshold and tracks their totals which are checked in real time against a loyalty index
• This gives it the power to anticipate dissatisfaction and intervene before it happens
Source: www.information-age.com, “Nothing Left to Chance”, January 18, 2007

Controversy ????• “There is a dark side to electronic records”
– Hank George, Best’s Review, August 2010
• “Would you buy a life insurance policy from this machine?”– Wall Street Journal, March 12, 2011
• “Insurer’s test data profiles to identify risky clients”– Wall Street Journal, November 19, 2010
• “Useless Arithmetic: Ten Points to Ponder When Using Mathematical Models in Environmental Decision Making”
– Public Administration Review, May/June 2008
• “What concerns me…with predictive modeling [is the idea that] we can predict what a criminal looks like, what a criminal is, and what a criminal might do … [and that] predictive modeling leads to another area …profiling.”
– Excerpt from the New Mexico Independent, December 8, 2009

Barry SenenskyPresident, Claim Analytics Inc.
• Introduction to Predictive Modeling• The Past• The Future
Agenda

Introduction to Predictive Modeling

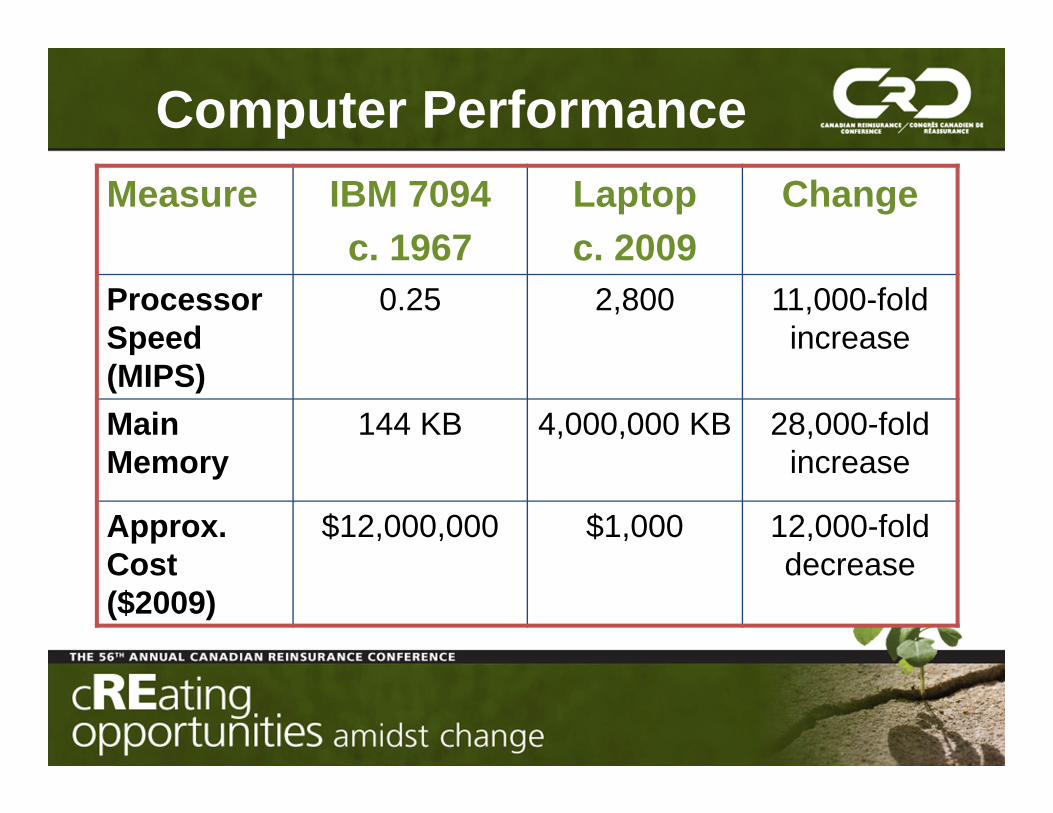
Computer PerformanceMeasure IBM 7094
c. 1967Laptop c. 2009
Change
Processor Speed (MIPS)
0.25 2,800 11,000-fold increase
Main Memory
144 KB 4,000,000 KB 28,000-fold increase
Approx. Cost ($2009)
$12,000,000 $1,000 12,000-fold decrease
What is Predictive Modeling
• Analyze historic data
• Identify & quantify relationships between predictive inputs and outcomes
• Apply learning to predict outcomes of new cases
Two “ERA’s”
• Traditional– Around for 100+ years– Low usage of computer power – Relatively easy to understand
• Modern– Have been around 40+ years – Exploits power of computer processing– Can be “black boxes”
Modern Predictive Models • Used extensively in industry• Applications include
– Credit Scores– Credit Card Fraud Detection– Mail sorting– Weather prediction– Hot dogs and Hamburgers

Some Modern Predictive Modeling Methods
mM Methods• Classification and Regression Trees• Generalized Linear Models • Neural Networks • Genetic Algorithms • Stochastic Gradient Boosted Trees• Support Vector Machines
Predictive Modeling and the Life Insurance Industry
“The Past”
The Past-P&C Industry• Progressive Insurance• Incorporated Credit Ratings into auto
pricing • Huge competitive advantage• Catalyst-others followed• Now standard practice
The Past-Life Insurance Industry
• Not too much!• Some application for target marketing• A few fraud applications • Claim Analytics applications for claims
management and group disability pricing• Recent interest in mortality applications
8
9
10
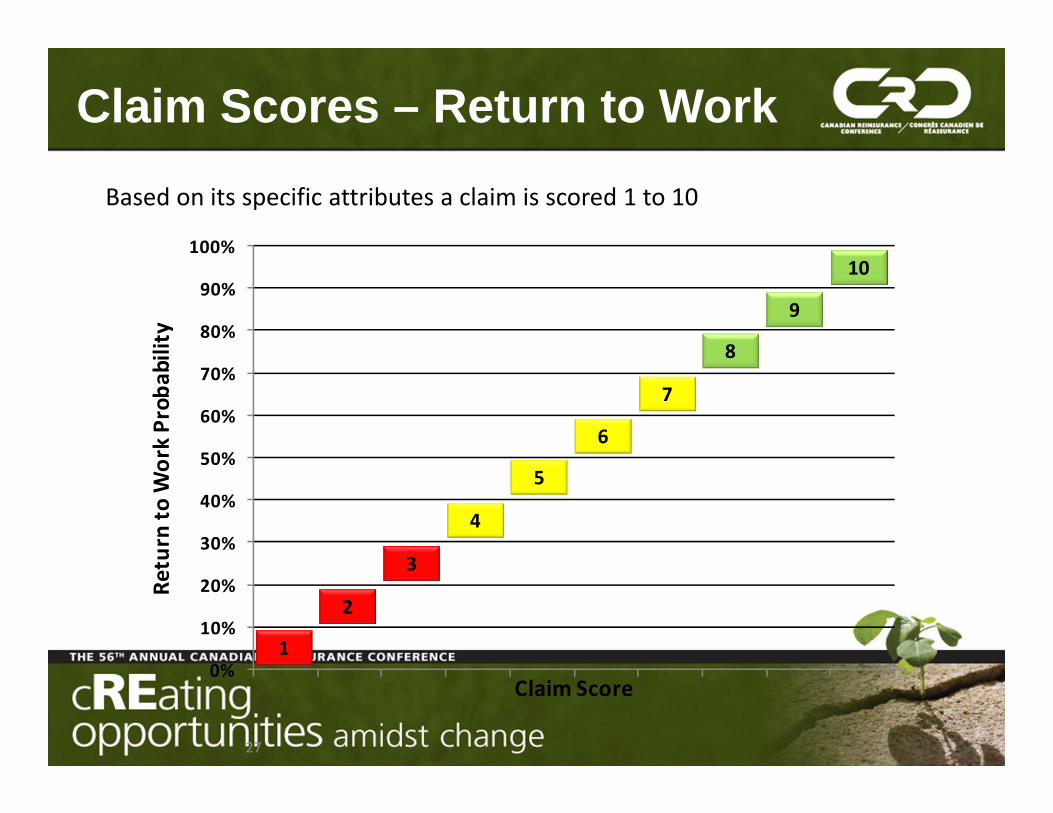
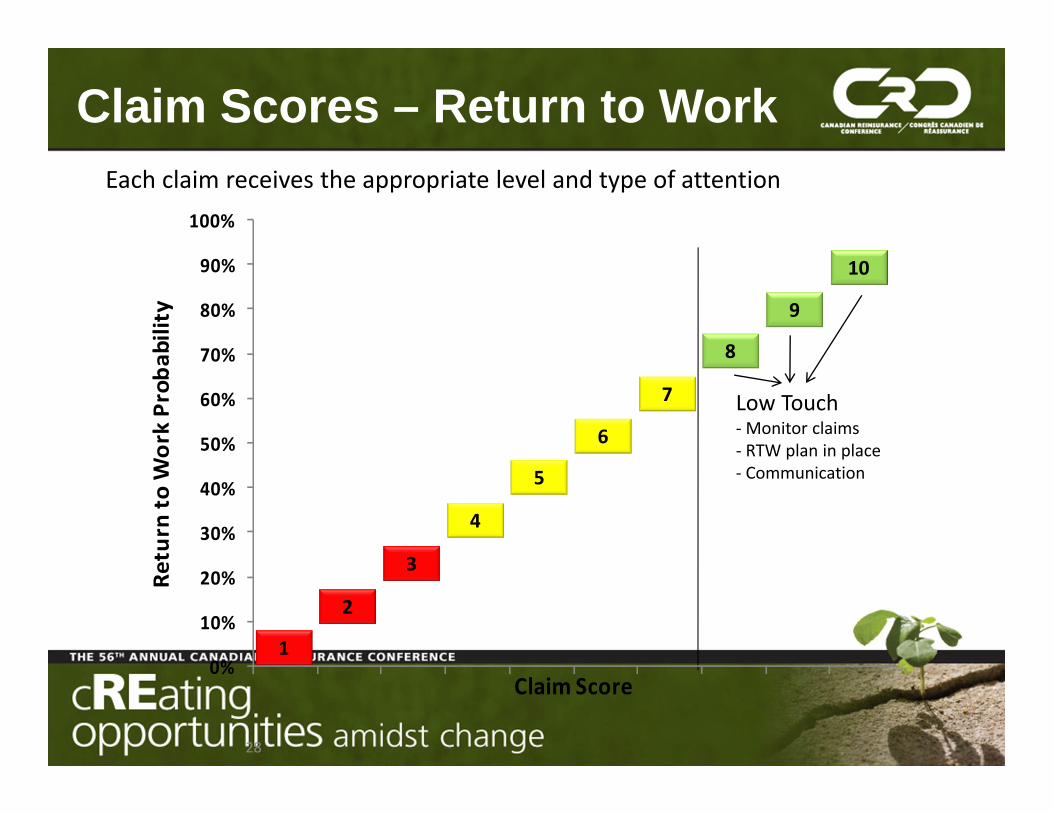
Based on its specific attributes a claim is scored 1 to 10
5
6
7
2
3
4
1
Claim Scores – Return to Work
0%
10%
20%
30%
40%
50%
60%
70%
80%
90%
100%
Retu
rn to
Wor
k Pr
obab
ility
Claim Score
27
8
9
10
Each claim receives the appropriate level and type of attention
5
6
7
2
3
4
1
Claim Scores – Return to Work
Low Touch- Monitor claims- RTW plan in place- Communication
0%
10%
20%
30%
40%
50%
60%
70%
80%
90%
100%
Ret
urn
to
Wo
rk P
rob
abili
ty
Claim Score
28

0%
10%
20%
30%
40%
50%
60%
70%
80%
90%
100%
Retu
rn to
Wor
k Pr
obab
ility
Claim Score
8
9
10
Risk stratification provides early identification of at risk claims
5
6
7
2
3
4
1
Claim Scores – Return to Work
Low Touch- Monitor claims- RTW plan in place- Communication
Expense Mgmt- Major impairment- Manage expenses- Maximize offsets- Consider settlement
29
0%
10%
20%
30%
40%
50%
60%
70%
80%
90%
100%
Retu
rn to
Wor
k Pr
obab
ility
Claim Score
8
9
10
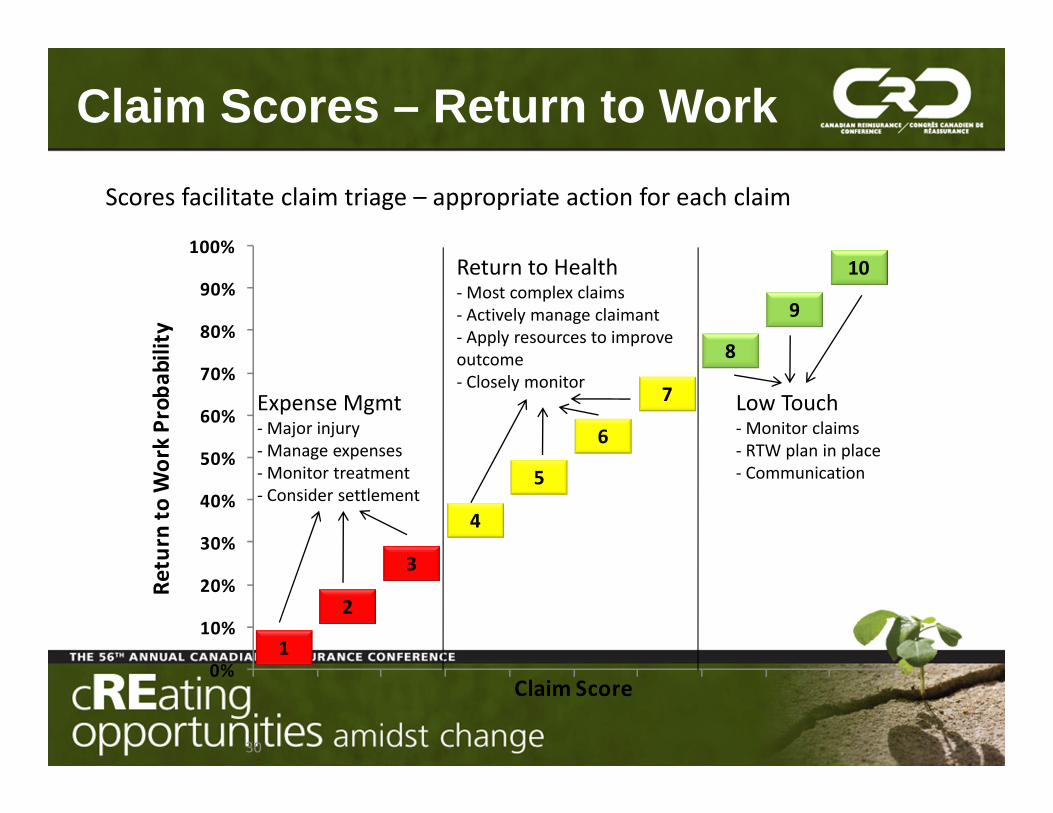
Scores facilitate claim triage – appropriate action for each claim
5
6
7
2
3
4
1
Claim Scores – Return to Work
Low Touch- Monitor claims- RTW plan in place- Communication
Expense Mgmt- Major injury- Manage expenses- Monitor treatment- Consider settlement
Return to Health- Most complex claims- Actively manage claimant- Apply resources to improve outcome- Closely monitor
30
Recent Mortality Applications
1. Reproducing underwriting decisions• Relatively Straightforward to
model• Automates underwriting function• Reduces costs but doesn’t impact
mortality
Recent Mortality Applications
2. Predictive Scores based on lab analysis of fluids
• Produces additional variables to be considered in the underwriting process
• More complex to model as claim history needs to be known and reflected in models
• Impacts mortality but doesn’t impact underwriting costs
Recent Mortality Applications
3. Predictive Scores based on data on the insurance application
Why haven’t Life Insurance Companies embraced modern predictive models?
• Life Insurance Industry is conservative and slow to change
• Not a traditional actuarial tool
Modern Predictive Modeling and the Life Insurance Industry
“The Future”
The Future-Mortality
1. More and Better models available 2. Less reliance on fluids3. Higher Limits on Simplified Underwriting4. Use of Social Media Data/Web Scraping5. Internet Selling6. Direct development of mortality rates for
each individual 7. More and Stricter Regulation

The Future-General
1. Predictive modeling will become a tool of choice in the industry
2. Predictive models will be used extensively – Underwriting– Fraud Detection– Claims Management – Target Marketing– Experience Analysis
The Future-General
3. Rapid Innovation 4. New problems and issues
– Use of data – Reliability of data– Measuring robustness of models
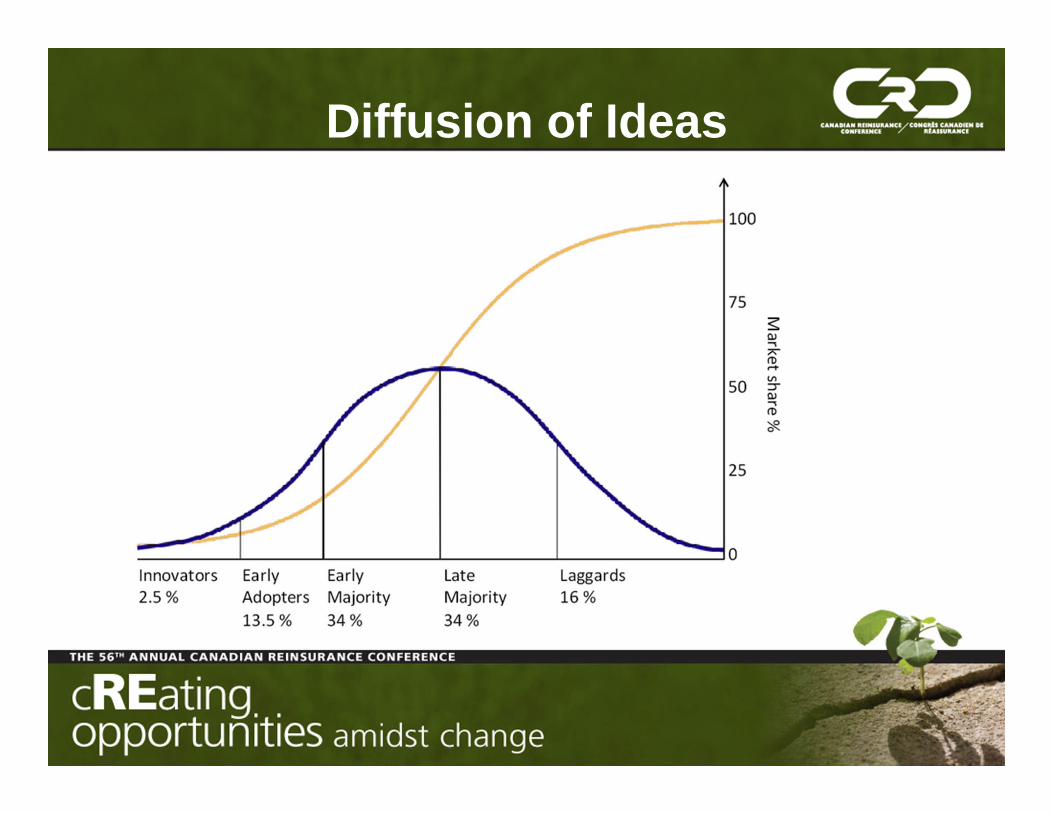
Diffusion of Ideas
d
More Information About
Predictive Modeling
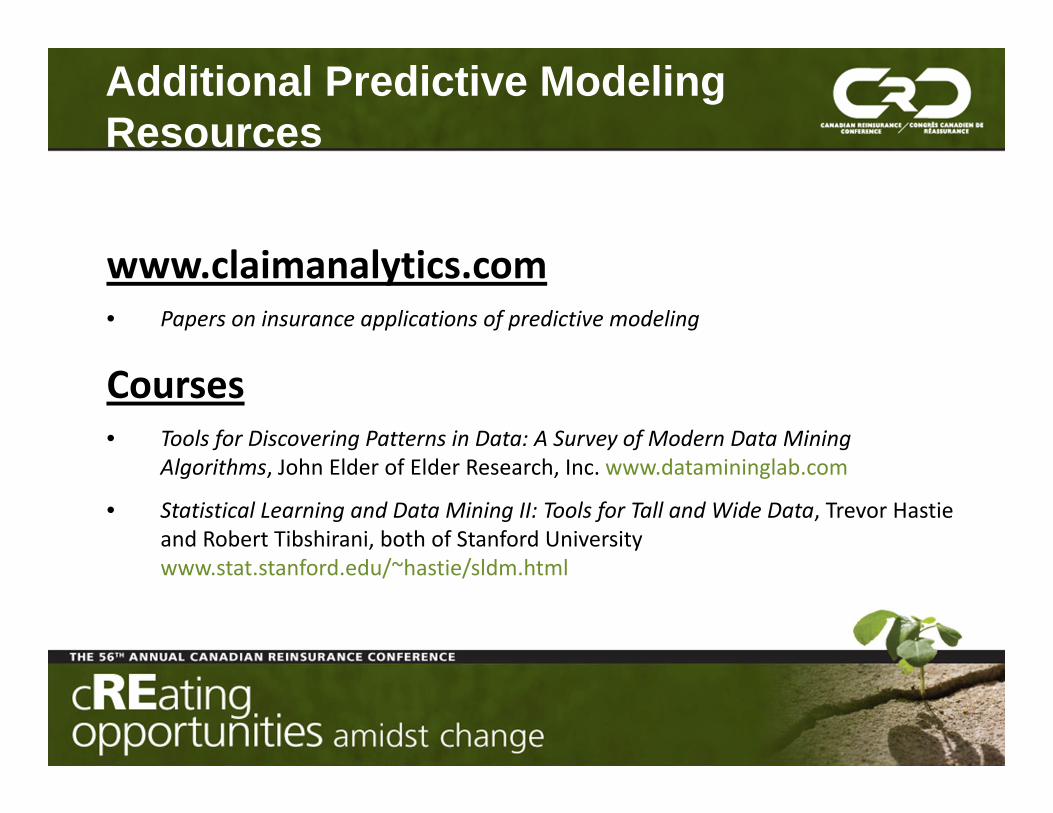
www.claimanalytics.com• Papers on insurance applications of predictive modeling
Courses• Tools for Discovering Patterns in Data: A Survey of Modern Data Mining
Algorithms, John Elder of Elder Research, Inc. www.datamininglab.com
• Statistical Learning and Data Mining II: Tools for Tall and Wide Data, Trevor Hastie and Robert Tibshirani, both of Stanford University www.stat.stanford.edu/~hastie/sldm.html
Additional Predictive ModelingResources

Guizhou Hu, MD, PhDChief Scientific Officer, BioSignia Inc.
Prediction Models in Life Underwriting
• Two kinds of prediction models• Why use prediction models?• An example:
Mortality Assessment Technology (MATTM)
Two Kinds of Prediction Models
• Epidemiological research-based models– Based on biological associations
• Smoking increased mortality• Framingham heart disease model
• Third party data-driven models– Based on any possible data correlation
• People with yellow fingers (smokers tend to have yellow fingers) may have higher mortality
• People with a gym membership may have lower mortality
Why Use Prediction Models?• Improve mortality prediction by using
epidemiological research-based models– Total/HDL ratio predicts risk better than total
cholesterol alone• Reduce underwriting costs by using third
party data-driven models
Example:• Mortality Assessment Technology (MAT):
an epidemiological research-based prediction model developed for life insurance underwriting
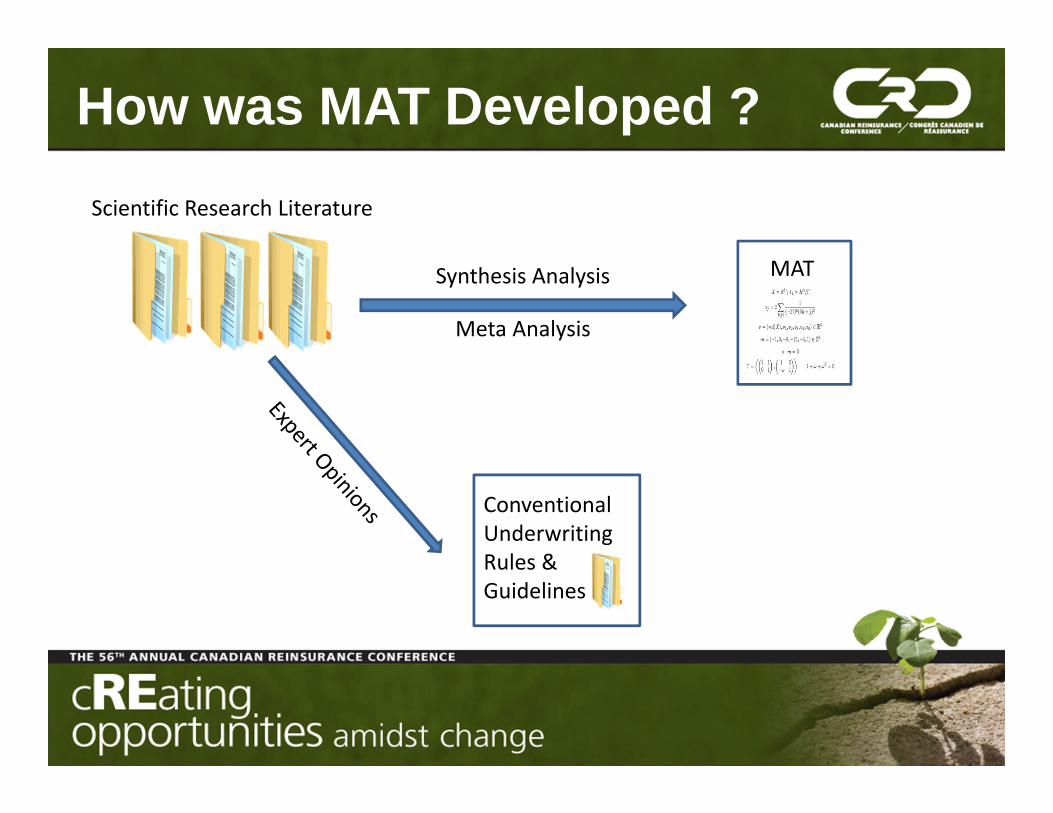
How was MAT Developed ?
Synthesis Analysis
Meta Analysis
MAT
ConventionalUnderwriting Rules & Guidelines
Scientific Research Literature
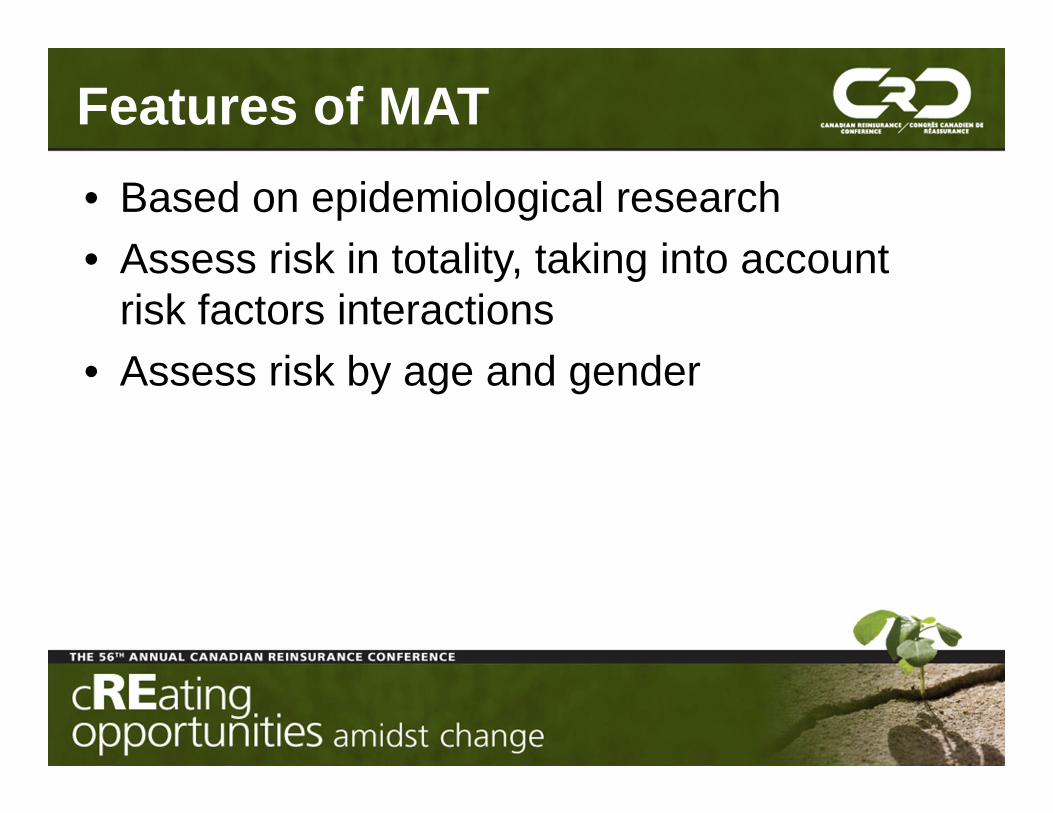
Features of MAT• Based on epidemiological research• Assess risk in totality, taking into account
risk factors interactions• Assess risk by age and gender
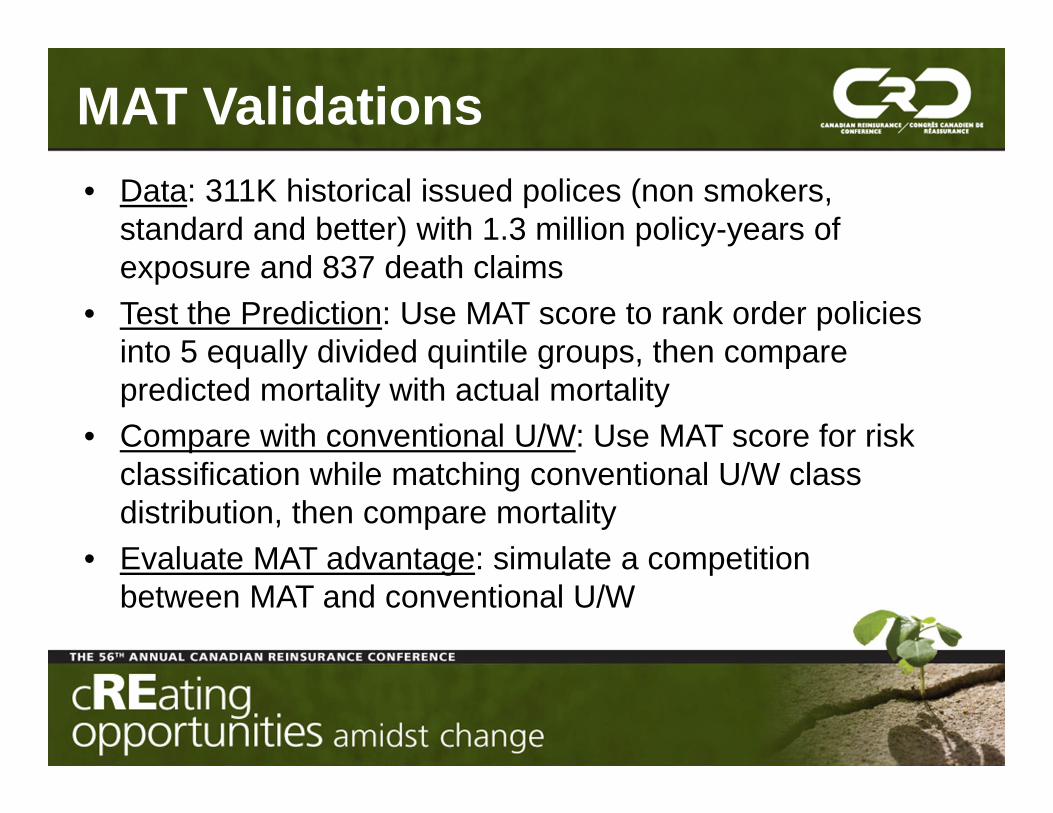
MAT Validations• Data: 311K historical issued polices (non smokers,
standard and better) with 1.3 million policy-years of exposure and 837 death claims
• Test the Prediction: Use MAT score to rank order policies into 5 equally divided quintile groups, then compare predicted mortality with actual mortality
• Compare with conventional U/W: Use MAT score for risk classification while matching conventional U/W class distribution, then compare mortality
• Evaluate MAT advantage: simulate a competition between MAT and conventional U/W

Predicted vs. Actual Mortality
0.3
0.4
0.5
0.6
0.7
0.8
0.9
1
0.3 0.5 0.7 0.9 1.1
Correlation Coefficient=0.99
Predicted Mortality [PAE]
Act
ual M
orta
lity
[A/E
]
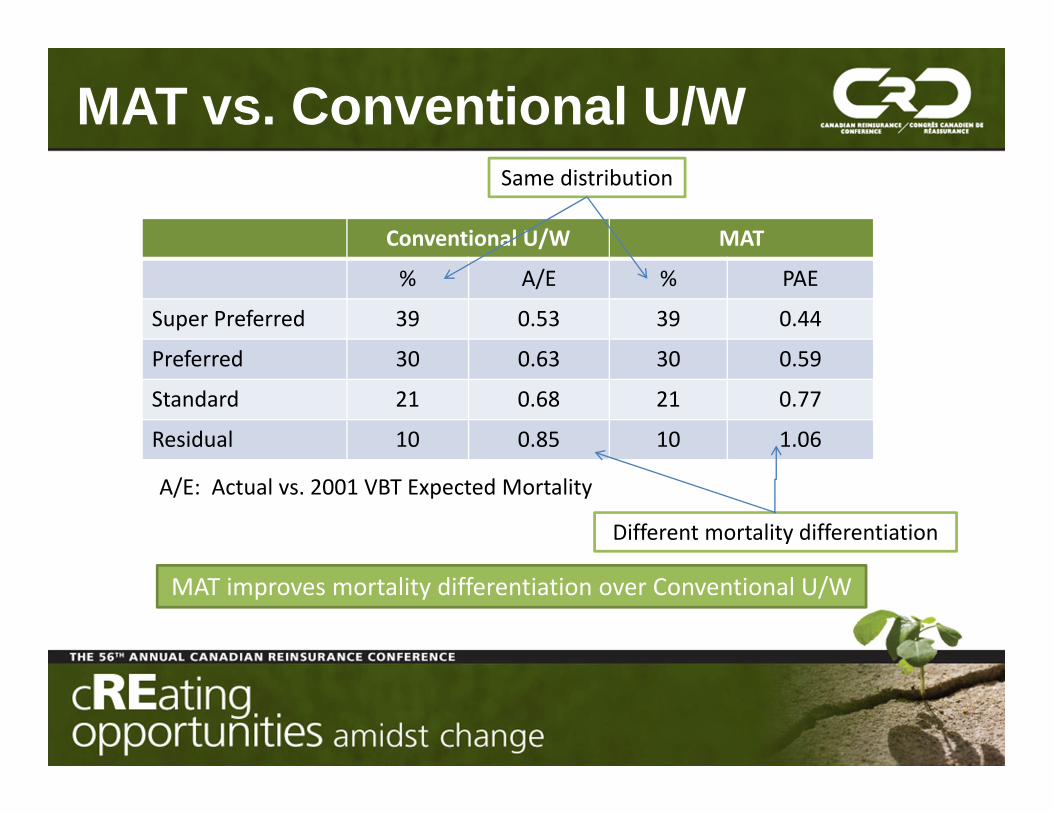
MAT vs. Conventional U/W
Conventional U/W MAT
% A/E % PAE
Super Preferred 39 0.53 39 0.44
Preferred 30 0.63 30 0.59
Standard 21 0.68 21 0.77
Residual 10 0.85 10 1.06
A/E: Actual vs. 2001 VBT Expected Mortality
MAT improves mortality differentiation over Conventional U/W
Same distribution
Different mortality differentiation
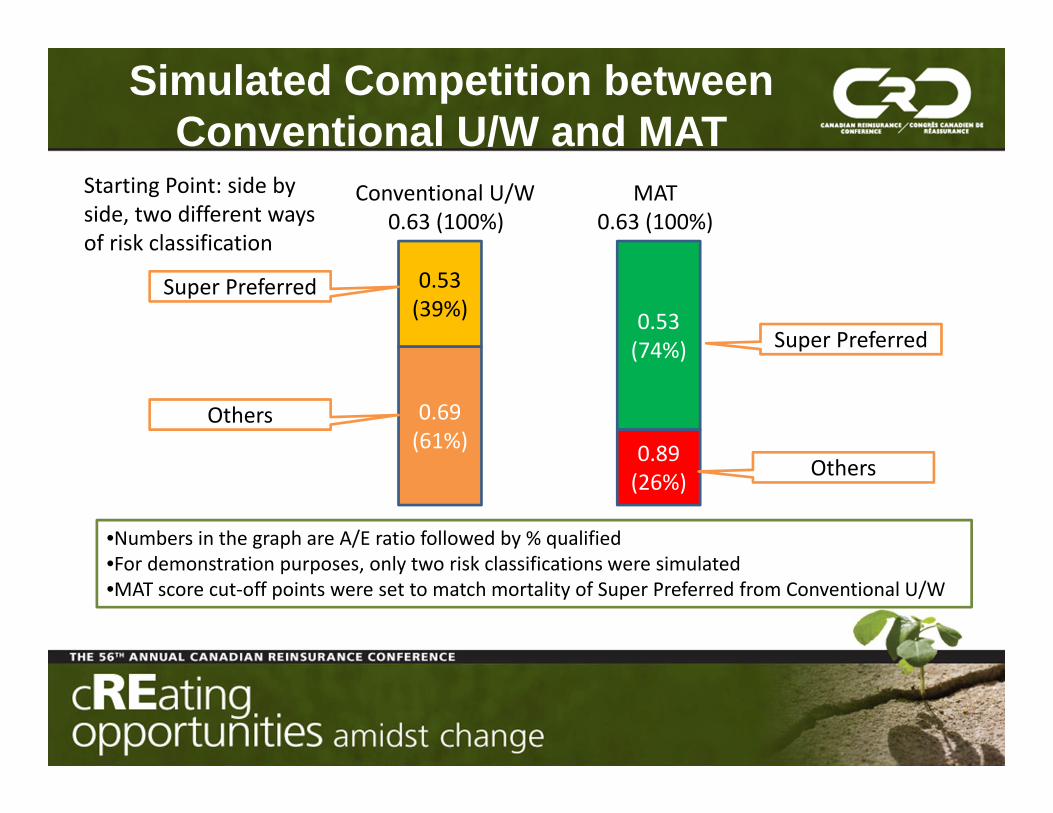
Simulated Competition between Conventional U/W and MAT
0.53(39%)
0.69(61%)
0.53(74%)
0.89(26%)
Conventional U/W0.63 (100%)
MAT0.63 (100%)
Super Preferred
Others
Super Preferred
Others
•Numbers in the graph are A/E ratio followed by % qualified•For demonstration purposes, only two risk classifications were simulated•MAT score cut-off points were set to match mortality of Super Preferred from Conventional U/W
Starting Point: side by side, two different ways of risk classification
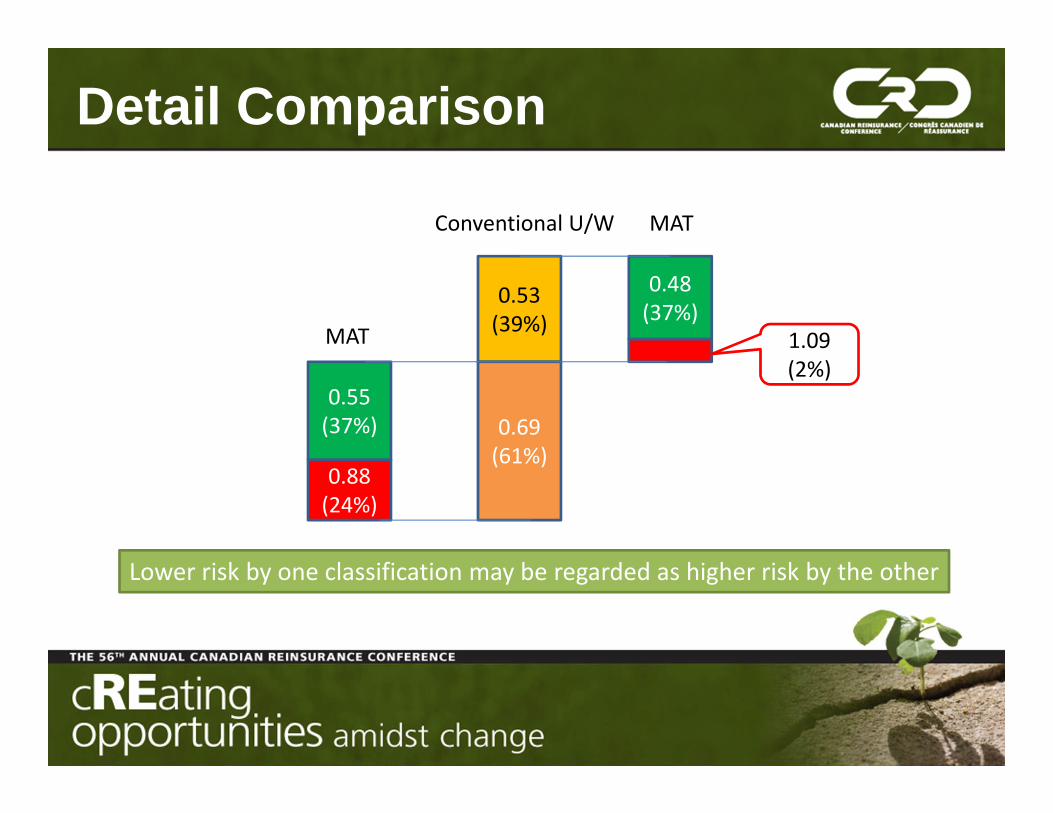
Detail Comparison
0.53(39%)
0.69(61%)
0.48(37%)
Conventional U/W MAT
0.55(37%)
0.88(24%)
MAT 1.09(2%)
Lower risk by one classification may be regarded as higher risk by the other
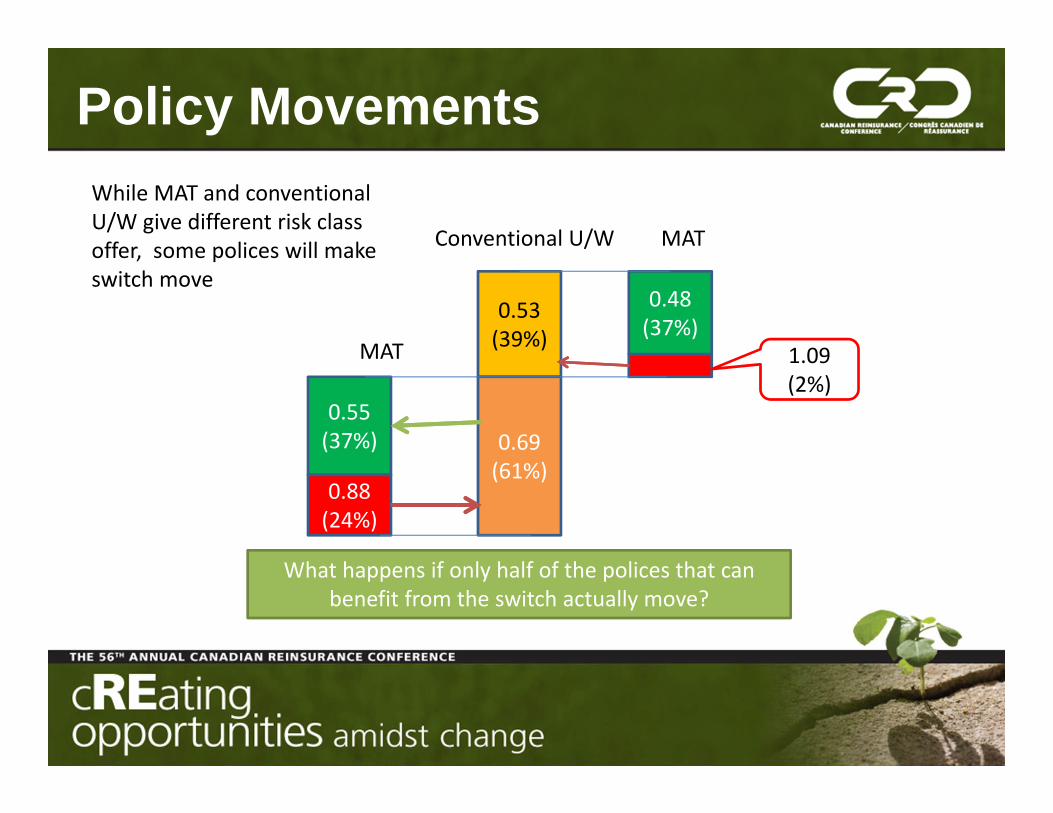
Policy Movements
0.53(39%)
0.69(61%)
0.48(37%)
Conventional U/W MAT
0.55(37%)
0.88(24%)
MAT 1.09(2%)
What happens if only half of the polices that can benefit from the switch actually move?
While MAT and conventional U/W give different risk class offer, some polices will make switch move
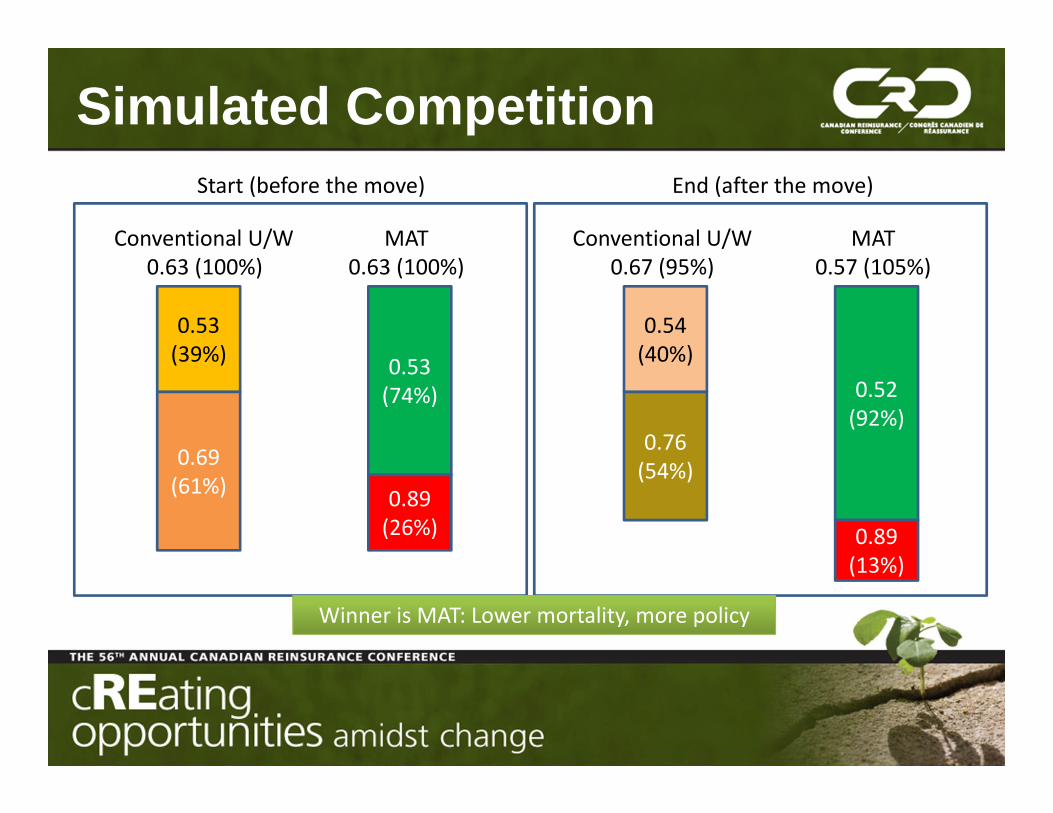
Simulated Competition
0.53(39%)
0.69(61%)
0.53(74%)
0.89(26%)
Conventional U/W0.63 (100%)
MAT0.63 (100%)
0.54(40%)
0.76(54%)
0.52(92%)
0.89(13%)
Conventional U/W0.67 (95%)
MAT0.57 (105%)
Start (before the move) End (after the move)
Winner is MAT: Lower mortality, more policy
Summary• Two kinds of prediction models
– Epidemiological research-based models: improve mortality prediction
– Third party data-driven models: reduce U/W costs
• Epidemiological research-based models help gain competitive advantage through improved mortality prediction

Any Questions?