1/111 iiiiiii iliiuiii uilu-iiig-
TRANSCRIPT

1/111 ~IIIIIII~ IlIIUIIIPB94-159811
UILU-IIIG-_-'"CIVIL ENGINEERING STUDIES
1truabnI............. No. 111
IAN:_-Gn
SEISMIC RESPONSE OF TILT-UP CONSTRUCTION
By
Jam. W. Cart.. IIINell M. HawkinsWldSMron L. Wood
A Report to 1heNdonId ScIence FoundatIonReaeerch Grant BCS 91-2al81

11111111111111_11111111 II50272 101-
Ul -REPORT DOCUMENTATION \,.Jl£I>ORTNO. !Z
3. II-
PAGE UILU-ENG-93-2004 i PB94 ··15"~1l
•. ntJo_hlllitlt I . ...,....,DoUSeismic Response of Tilt - Up Construction December 1993
l-
T "'''''''''0' •. _Ill", 0tgM........" "-po" No
James W. Carter III, Neil M. Hawkins, and Sharon L. Wood SRS 581t ...._1ll"'ll0rVM_____
10. ProteG'&/Teelw'WO.... Unit No.
University of Illinois at Urbana-ChanpaignD1artment of Civil Engineering 11. CoftUKt(CI or Gr"",(GI No.
20 North Mathews Avenue BCS 91-20281Urbana, Illinois 61801
lZ.~""lIOr__ft ___•11""'... IIepott • _ cov....
National Science Foundation4201 Wllson Boulevard, Room 545Arlington, Virginia 22230 1••
,s., wpp'.men\aly Mal••
1'. AOsCtKt tUmll: 20D _orela)
Tilt - up construction is an economical method ofconstructing low- rise industrial and coaunercial buildings.
However, the structures are susceptible to seismic damage. The seismic response of tilt-up construction is
reviewed in this report. Construction techniques are described, design procedures are summarized, the results
of previous experimental and analytical research are compared. and observed damage during recent earth-
quakes is discussed. The measured response of three tilt-up buildings in California is also presented.
11.DDcu_t-,.o .. o-cri-,
Low- Rise Buildings, Precast Concrete Wall Panels, Roof Diaphragms, Connections,Earthquakes, Design Provisions, Observed Damage, Measured Seismic Response
.. -'_~-_T.'"
Co COSAT1F~.
tl-_lIJ__, •._ily C_ (1Ilie IIoI*tl Zl.No. "Pep.
UNClASSIFIED 224-
ID.-..rC_ (1Ilie .....1 4.l'rioo
UNClASSIFIED:

SEISMIC RESPONSE OF TILT-UP CONSTRUcrlON
1. IntnMIuction............................ ..........................•.......... 11.1 Past Seismic Performance , , , , , .. , , . . . . . . . . . . . . . . . . . . . . . . 21.2 Research Needs , , ' , . , , , , , . 21.3 Objective and Scope , , ' , ' , , . . . . . . . . . . . . . . . . . . . . . . 31.4 Acknowledgements. , , , , , , . . . . . . . . . . . . . . 3
2. ConstructioD of Tlit-Up Structures , .. , .....••.•...•..•....•••••....... , .. 42.1 Wall Panel Construction , , , .. , , , . . . . . . . . . . . . . . 42.2 Roof Construction ' , , . . . . . . . . . . . . . . . . . . . . . . . . . . . . . . 5
2.2.1 Wood Diaphragms ., , , , ,. 52.2.2 Metal Deck Diaphragms .. , .. , , , .. , , , , . 62.2.3 Composite Diaphragms ,.,., , "." .. " " ,." 6
3. Design of Tilt-Up Structures to Resi§t Lateral I..oam • • . • . • . • . . . . .. • . . .. . . . . . . . . . . . . . 73.1 Wall Panels .. , . , , , , , , , , .. , . , . ' , . . . . . . . . . . . . . . 73.2 Diaphragms .. , , , ,.............. 9
3.2.1 Diaphragm Strength and Sti ffness " ' , . , ' . . . . . . . . . . . .. 103.2.2 Diaphragm Fasleners ., .. , .. , ,........................ 133.2.3 Design of Non-Rectangular Diaphragms and Diaphragms with Openings ..... , . 15
3.3 Connections in TIle-Up Systems .,. _ , , , . , , . . . . . . . . . . . . . . . . . . . . .. 163.3.1 Panel-lO-Foundation Connections , , _. . . .. 163.3.2 Panel-to-Panel Connections ,................. 163.3.3 Panel-to-RoofCOnnections........................................... 17
3.4 Summary , . . . . . . . . . . . . . . . . . . . . . . . . . . . . . . . . . . . . . . . . 19
4. Summary of Previous Investigations 01 the Sefi.ue Behavior of Tdt-Up Constructioa .... 204.1 Cydic Response of Diaphragms , , . , . ' , , , . . . . . . . . . . .. 20
4.1,1 Exp.:rimental Tests of Wood Panels and Diaphragms ,'.,., ".,.......... 214.1.2 Experimental Tests of Metal-Deck Diaphragms , , . ' , . . . . . . . . . . .. 224.1.3 Analytical Models of Diaphragms , , . , , .. _. . . .. 22
4.2 Cyclic Response of TIIt-Up Wall Panels , .. , . , , . , . . . . . . . . . . .. 254.3 Analytical Models of TIlt-Up Systems , .. , ,............. 254.4 Summary , , , . . . . . . . . . . . .. 28
5. Measaued Stroac-MotioD Respoase OITDt-Up Buildings " ,. . . . .. . .• ... . . . .. . . 305.1 Hollister Warehouse ' , , , , . . . . . . . . . . . . . .. 305.2 Redlands Warehouse , .. . . . . . . . . . .. . . . . . . . . . . . .. .. 325.3 Milpitas Industrial Building ' , . . . . . . . . . . . . . . . . . 345.4 Summary. . . . . . . . . . . . . . . . . . . . . . . . . . . . . . . . . . . . . . . . . . . . . . . . . . . . . . . . . . . . . . . 36
6. Obse.,..ed Performance Of TUt-Up Co_ruction DuriDg Earthquakes ..•......•....... 376.1 The 1964 Alaska Eanhquake ., , ' . . . . . . . . . 376.2 The 1971 San Fernando Earthquake '" , , , . . . .. .. . 376.3 The 1987 Whittier Narrows Earthquake , , , , .. _. , , , . . . . . . . . 386.4 The 1989 Loma Prieta Earthquake. . . . . . . . . . . . . . . . . . . . . . . . . . . . . . . . . . . . . . . . . . . 396.5 Summary .. " . " " , , , .. . .. .. 40
ii

7. Coaclusions ................................••................................ 41
Refereaccs .••..•...•........................•••..............•••.••.•••..••.• 43
Tables......................... 49
Figures......................... 6S
Appendix A - SIUIUIIllI'Y 01 UBC Provisions . . . . . . . • • . . . . . . . . . . . • . . . . • • • • • • • • • • . . • •• 212
Appendix B - Filtering of Relative Dfiplacement Hfitories ..........•.••....•.•..•.•. 213
iii

Table
LIST OF TABLES
Page
3.1 Allowable shear in lb/ft for horizontal plywood diaphr.lgmswithframing of douglas fir-larch or southern pine [77) . . . . . . . . . . . . . . . . . . . . . . . . . . . 49
3.2 Diaphragm shear stiffness 13J - . . . . . . . . . . . . . . . . . . . . . . . . . . . . . . . 50
3.3 Fastener slip equations (74) . . . . . . . . . . . . . . . . . . . . . . . . . . . . . . . . . 50
3.4 Strength of metal-<leck diaphragms [48) - , 51
3.5
3.6
J.7
Strength and flexibility of connections in metal deck diaphragms (48)
Strength of composite diaphragms (48) .
Maximum diaphragm dimension ratios [77] .
52
S3
53
4.1 Summary of experimental tests of diaphragms subjected to load reversals. . . . . . . . . . . 54
4.2 Summary of ABK diaphragm tests 11] . . . . . . . . . . . . . . . . . . . . . . . . .. 55
4.3 Summary of dynamic tests of tilt-up wall panels [6. 8. 7} 56
'U
5.2
Characteristics of instrumented tilt-up buildings _ .
Summary of strong-motion instrument; in the Hollister warehouse
57
58
5.3 Summary of relative displacement data from the Hollister warehouse " . . . . . . 59
5.4 Summary of the strong-motion instruments in the Redlands warehouse 60
5.5
5.6
Summary of relative displacement data from the Redlands warehouse
Summary of the strong-motion instruments in theMilpitas industrial building _ _ .
61
62
5.7 Summary of relative displacement data from theMilpitas industrial building 63
6.1 Summary of observed damage in tilt-up buildingsfollowing earthquakes in the U.S. 64
B.1 Filter limits used to process strong-motion records 220
iv

Figure
UST OF FIGURES
Page
2.1 Common arrangement of panel pick points [79] . 65
2.2 lilting procedure ., 66
2.3 Examples of improper placement of openings [78] . . . . . . . . . . . . . . . . . . . . . . . . . . . . . 67
2.4 Locations of openings within tilt-up panels [78] . 6B
2.5 Roof framing member connected to the tilt-uppanels at the panel-t0-p3nel joint [781 (f)
2.6 Common types of diaphragms useo in tilt-up constructionthroughout the U.S. [101 , . . . . . .. . . . .. . . . .. . . . .. . . . . . . . . 70
2.7 Typical plywood diaphragm [35] 71
2.8 Blocked section of a plywood roof diaphragm [57]. 71
2.9 Prefabricated secti"n of a plywood roof diaphragm [33] 72
2.1 t' Plan view of a steel diaphragm [64] . . . . . . . . . . . . . . . . . . . . . . . . . . . . . . .. 73
2.11 TypicalZr- and C- type shear transfer connections [64] 74
3.1 Idealized force distribution in diaphragm [33J. . . . . . . . . . . . . . . . . . . . . . . . . . . . . . . . . 75
3.2 Idealized model oca tilt-up wall panel [16J 76
3.3 Test configuration for AO-SEASC lateral load tests (16). . . . . . . . . . . . . . . . . . . . . . . . 76
3.4 Free body diagram of a tilt-up panel subjected to lateralloadiog [16J . . . . . . . . . . . . . . 77
3.5 Distribution of lateml forces to supponing walls in structures withflexible and rigid diaphragms [65J . . . . . . . . . . . . . . . . . . . . . . . . . . . . . . . . . . . . . . . . . . 78
3.6 Configuration of metal-deck diaphragm . . . . . . . . . . . . . . . . . . . . . . . . . . . . . 79
3.7 Corrugations in metal decking [48J . . . . . . . . . . . . . . . . . . . . . 80
3.8 Strength of metal~eckdiaphragm limited byconnections along edge of diaphragm [48J 81
3.9 Strength of metal-deck diaphragm limited byconnections in an interior panel [48J 81
3.10 Strength of metal-deck diaphragm limited byconnections in comer [48J 82
3.11 Deformation of metal deck [48J , .. . .. . . . . . . .. . . . . . . . . . . . . . .. . .. . . . 83
3.12 Pull-out strength of various roofing nails [20] 84
3.13 Displacement discontinuities in non-rectangular diaphragms [14J . . . . . . . . . . . . . . . . . 85
3.14 Displacement discontinuities in buildings with stairwellsand elevator cores [14J • . • . . . . . . . • . • • • • • . • . • . . . . . • . . . . . . . . . . . . . . . . . . . .....
v
86

Figure
3.15
3.16
Analysis of diaphragm modelled as a Vierendeel truss {74]
Typical panel-to-foundation connections in buildingsconstructed before 1971 (55,SO) . 88
3.17 Typical panel-to-foundation connections in buildingsconstructed after 1971 (40) 89
3.18 Typical panel-to-panel connections in buildingsconstructed before 1971 (55,SO] 90
3.19
3.20
3.21
Typical panel-to-panel connections in buildingsconstructed after 1971 (40,80] .
Typical purlin to wood ledger connection in buildingsconstructed befort: 1971 [35] .
Typical plywood to wood ledger connection in buildingsconstructed before 1971 [25] .
91
92
92
3.22 Typical purlin to wood ledger connection in buildingsconstructed after 1971 [25] 93
3.23 Plan view of roof framing members showing subdiaphragm details. . . . . . . . . . . . . . . . 94
3.24 Strengthening of existing panel-to-roof connections{or walls with parapets (25] . . . . . . . . . . . . . . . . 95
3.25 Strengthening of existing panel-to-roof connectionsat top of wall [25) . . . . . . . . . . . . . . . . . . . . . . . . . . . . . . . . . . . . . . . . . . . . . . . . . . . . . . . 96
3.26 Purlin-to-purlin connection across a glulam beam (22) . . . . . . . . . . . . . . . . . . 96
3.27 Use of metal ties through purlins to create a subdiaphragm(walls with parapet';) [251 . . . . . . . . . . . . . . . . . . . . . . . . . . . . . . . . . . . . . . . . . . . . . . . . . 97
3.28 Use of metal ties through purlins 10 create a subdiaphragm(top of wall) (25] 98
3.29 Use of metal strap attached to plywood and blockingto create a subdiaphragm (25] 99
3.30
3.31
Use of metal strap attached to blocking to create a subdiapbragm (25]
Detail of a direct glulam-to-panel connection [55] .
100
101
4.1 Measured force-displacement response of nailed connections " 102
4.2 Measured force-displacement response of plywood wall panelsand diaphragms 103
4.3 Measured free-vibration response of plywood diaphragm [39) 105
4.4 Test configuration for ASK diaphragm tests (11 . . . . . . . . . . . . . . . . 106
4.5 Measured force-displacement response of metal-deck diaphragm [1] . . . . . . . . . . . . . . 107
vi

Figure Page
4.6 Representation of plywood diaphragm as a series of nonlinear springs (11) . . . . . . . . . . lOB
4.7 Initial hysteresis rules for plywood diaphragms [11) . lOB
4.8 Force~ef)ectionenvelope and hysteresis rules for plywooddiaphragms developed after ABK tests [4] 109
4.9 Revised force~enectionenvelope and hysteresis rules forplywood diaphrai~m (9) 110
4.10 Comparison of measured and calculated displacementresponse of diaphragm N [9) 111
4.11 Best-fit backbone curve through load~isplacementdatafor nailed connections (39) . . . . . . . . . . . . . . . . . . . . . . . . . . . . . . . . . . . . . . . . . . . . . . . . 112
4.12 Comparison of measured and calculated response of wall panels. . . . . . . . . . . . . . . . . . 113
4.13 Test configuration for dynamic testing of tilt-up wall panels [6,8,7) . . . . . . . . . . . . . . . 114
4.14 Comparison of maximum response of panels 2, 3, and 4 witha rigid roof diaphragm subjected to EI Centro base motion [6,8, 7} 115
4.15 Displacement and acceleration distributions in panel 3 with a rigid roofdiaphragm subjected to varying intensities of the EI Centro base motion [6,8,7) 115
4.16 Displacement, acceleration, and moment distributions in panel 4 with a rigid loofdiaphragm subjected to varying intensities of the EI Centro base motion [6,8,7] 116
4.17 One-story tilt-up building u. -:d to develop analytical model (4) 117
4.18 Calculated acceleration response of cenler longitudinal wall panel(or Iightly-damped model [4] 119
4.19 Calculated acceleration response of center longitudinal wall panelfor moderately-damped model [4) . 120
4.20 Calculated distributions of acceleration and moment along the heightof the center longitudinal wall panel(4) 121
4.21 Analytical models of one-slory rilt-up building [53,54] ,. . .. . . .. . . . . 122
4.22 Calculated roof-to-panel connection forces [53,54} " . .. . . . . . .. . 123
4.23 Calculated distribution of shear forces in the diaphragm (53,54) 123
4.24 Analytical model o( Hollister warehouse for input motionin the transverse direction [9) . . . . . . . . . . . . . . . . . . . . . . . . . . . . . . . . . . . . . . . . . . . . . . 124
4.25 Relative displacements at the center of the diaphragm in theHollister warehouse during the 1986 Morgan Hill earthquake [9) 125
4.26 Plan views of tilt-up buildings in Downey and Whinier [9] . . . . . . . . . . . . . . . . . . . . . . 126
4.27 Analytical model or Downey building for input motionin the transverse direction [9) . . . . . . . . . . . . . . . . . . . . . . . . . . . . . . . . . . . . . . . . . . . . . . 127
vii

FigUJ"e
4.28 Analytical model of Whittier building for input molionin the transver.;e direction [9J . 128
5.1 Hollister warehow.e 129
5.2 Floor plan - Hollister warehouse ., . . . . . . . . . . . . . . . . . . . . . . . . . . . . . . . . . . . . . . . . . 130
5.3 Cross sections - Hollister warehouse . 131
5.4 Typical panel reinforcement details - Hollister warehouse . . . . . . . . . . . . . . . . . . . . . . . 132
5.5 Elevations - Hollister warehouse . . . . . . . . . . . . . . . . . . . . . . . . . . . . .. 133
5.6 Locations of strong-motion instruments - Hollister warehouse , . . . . . . . 134
57 Measured ground accelerations - Hollister warehouse 135
5.8
5.9
Linear response spectra - Hollister warehouse
Hollister warehouse - Acceleration Histories1984 Morgan Hill eanhquake .
136
139
5.10 Hollister warehouse - Acceleration Histories1986 Hollister earthquake 141
5.11 Hollister warehouse - Acceleration Histories1989 Loma Prieta earthquake. . . . . . . . . . . . . . . . . . . . . . . . . . . . . . . . . . . . . . . . . . . . . . 143
5 i2 Hollister warehouse - Normalized Fourier amplitude spectra1984 Morgan Hill earthquake 145
5.1 ~ Hollister warehouse - Normal~ FOllner amplitude spectra1986 Hollister eanhquake . _. . . . . . .. . . . . . . 147
5.14 Hollister warehouse - Normalized Fourier amplitude spectra1989 Lorna Prieta earthquake. . . . . . . . . . . . . . . . . . . . . . . . . . . . . . . . . . . . . . . . . . . . . . 149
5.15
5.16
Hollister warehouse - Absolute displacement histories _ .
Hollister warehouse - Relative displacement histories1984 Morgan Hill eanhquake .
151
154
5.17 Hollister warehouse - Relative displacement histories1986 Hollister eanhquake 157
5.18 Hollister wareholl5<: - Relative displacement histori~1989 Lorna Prieta earthquake. . . . . . . . . . . . . . . . . . . . . . . . . . . . . . . . . . . . . . . . . . . . . . 160
5.19 Redlands warehouse , __ . . . 163
5.20 Floor plan - Redlands warehouse _. . . . . . . . . . . . . . . . . . . . . . . . . . . . . . . 164
5.21 Transverse cross section - Redlands warehouse - . . . 165
5.22 Elevations - Redlands warehouse 166
5.23 Locations of strong-motion instruments - Redlands warehouse. . . . . . . . . . . 167
viii

Page
Measured ground accelerations - Redlands warehouse. . . . . . . . . . . . . . . . . . . . . . . . . . 168
Figure
5.24
5.25
5.26
Unear response spectra - Redlands warehouse -
Redlands warehouse - Acceleration Histories1986 Palm Springs earthquake .
169
170
5.27 Redlands warehouse - Acceleration Histories1992 Landers earthquake (66) . . . . . . . 172
5.28 Redlands warehouse - Acceleration Histories1992 Big Bear earthquake [37] 174
5.29 Redlands warehouse - Nonnalized Fourier amplitude spectra1986 Palm Springs earthquake .. , , . . . . . . . . . . . . . . . . . . 175
5.30 Redlands warehouse - Absolute displacement histories 177
5.31 Redlands warehouse - Relative displacement histories1986 Palm Springs earthquake. . . . . . . . . . . . . . . . . . . . . . . . . . . . . . . . . . . . . . . . . . . . . 178
5.32 Milpitas industrial building 181
5.33 floor plans - Milpitas industrial building 182
5.34 Elevations - Milpitas industrial building . . . . . . . . . . . . . . . . . . . . . . . . . . . . . . . . . . . . . 184
5.35 Locations of strong-motion instruments - Milpitas industrial building 185
5.36 Measured ground accelerations - Milpitas industrial building 186
5.37 Linear response spectra - Milpitas industrial building 187
5.38 Milpitas industrial building - Accelerativn Histories1988 Alum Rock earthquake , , " , , . .. . . . 189
5.39 Milpitas industrial building - Acceleration Histories1989 Loma Prieta earthquake. . . . . . . . . . . . . . . . . . . . . . . . . . . . . . . . . . . . . . . . . . . . . . 191
5.40 Milpitas industrial building - Normalized Fourier amplitude spectra1988 Alum Rock earthquake 193
5.41 Milpitas industrial building - Normalized Fourier amplitude spectra1989 Loma Prieta earthquake. . . . . . . . . . . . . . . . . . . . . . . . . . . . . . . . . . . . . . . . . . . . . . 195
5.42 Milpitas ir.dustrial building - Absolute displacement histories. . . . . . . . . . . . . . . . . . . . 197
5.43 Milpitas industrial building - Relative displacement histories1988 Alum Rock earthquake 199
5.44 Milpitas industrial building - Relative displacement histories1989 Loma Prieta earthquake . . . . . . . . . . . . . . . . . . . . . . . . . . . . . . . . . . . . . . . . . . . . . . 202
6.1 Plan view of Elmendorf Warehouse indicating location.o; of damage (32) . . . . . . . . . . . . 205
6.2 Typical roof framing plan and elevation of fire wall inElmendorf Warehouse [32] 206
ix

Figure
6.3 Failure of a wood ledger beam in cross-grain bending . . . . . . . . . . . . . . . . . . . . . . . . . . 207
6.4 Summary of damage in tilt-up buildings during the1971 San Fernando eanhquake [41,55] 208
6.5
6.6
Use of steel kickers to increase the strength and stabilityof tilt-up panels with large openings [10] .
Skewed wall joints [35] .
210
211
6.7 Typical connection between wood purlin and steel ledger (10) . . . . . . . . . . . . . . . . . . . . 211
8.1 Estimate of processing noise present in corre.:-ted strong-motion records (68] 221
8.2 Ormsby filter used to process CSMlP records [38] .. . . . . . . . . . . . . . . . . . . . . . . . . . . . 221
8.3
8.4
Absolute displacement response .
Unfiltered. relative displacement response at the roof .
222
223
8.5 High-pass filtcr used to calculate relative displacement response 224
8.6 Filtered, relative displacement response at the roof . . . . . . . . . . . . . . . . . . . . . . . . . . . . . 224
x

1. INTRODUCTION
Tilt-up construction is an efficient and economic method for constructing low-rise structures which has
become popular throughout the United Slates. Wall panels in tilt-up structures are cast horizontally at the
construction site, rather than in a prefabrication plant or on-site in vertical forms. TIlt-up construction
derives its name from the process of "tilting" the wall panels up into their final vertical position. Once in
place, the panels are con.lected to one another using pilasters, steel plates, or splicing "chord" steel at the roof
level, so as to form a structurally continuous wall systelJ' The panels are then COJ1Dected to the foundation
using cast-in-place "dowel-type" connections (SO). Finally, the wof is attached to the wails thl'Ough ledger
beams anached to the: panels.
Tilt-up construction offers cenain advantages to contr.::ctors when compared with conventional cast-in
place walls or precast wall sections shipped to the si:e P). Tilt-up walls are usually cast horizontally on the
floor slab, therefore, form costs are low only the edges of the wall need to be formed. Further, both compac
tion of the concrete and ~reparationof special surface finishes are easier when panels cast horizontally rather
than vertically. Also, transponation costs and restrictions on panel size and configuration due to vehicle li
mitations are virtually eliminated when the panels are cast on site (70]. Generally, tilt-up walls are only han
dled once (when they are tilted into place) during the construction process (30). Consequently there is less
chance ofdamage to a tilt-up wall panel. as compared to the use ofconventional precast elements, which must
be handled at least twice. Tilt-up panels can also function as shear walls [70] thereby ~liminating the need
for perimeter bracing and reducing overall building costs.
There are, however, several distinct disadvantages to tilt-up construction. Some of its constructibility
advantages are lost if the structure is located on a relatively confined site. Operations are difficult if the area
of the floor slab tbat is free of utilities and can be used to cast panels is less than 6,000 ft2, or if the width of
the building is less than 50 ft. Generally it is not cost-effective to construct these small structures using tilt-up
panels (31). Uncongested, non-urban sites are desirable for tilt-up construction because adequate room is
needed for casting the panels and to allow movement of the crane used to erert the panels.
Tilt-up construction is cost-effective if a proposed building is one- to two-stories in height and bas a
relatively simple configuration (meaning the structure is built with perpendicular comers and has large-area
offsets, if offsets are desired). Examples of simple configurations are structures with rectangular, L-shaped,
or H-shaped plan geometries. Structures with small-area offsets, although favored Cor aesthetic reasons, may
increase the cost significantly and can lead to less reliable seismic response calculations.
1

1.1 Past Seismic Performance
During the 1964 Alaska earthquake and the 1971 San Fernando earthquake, typical damage in tilt-up
structures included partial collapse of roof sections due to failure of the panel-to-roof connections and col
lapse of wall panels following failure of the panel-to-roof and panel-to-panel connections (32,41,55]. As
a consequence of the structural behavior durir.g those earthquakes, building code provisions were revised in
an effort to improve the seismic performance of tilt-up construction [75,76,77]. The response of tilt-up
construction during the 1987 Whittier Narrows and 1989l..oma Prieta earthquakes showed that some im
provements had been achieved. However, the degree of damage to some tilt-up buildings in the 1987 and
1989 earthquakes was still unacceptable [10,35,69].
The seismic performance of tilt-up construction is closely linked to the connection details. The designer
of tilt-up structures is faced with a difficult task ofdetailing each connection to provide the stiffness required
to resist service loads within permissible deflection limits while also ensuring that each connection has suffi
cient ductility, energy--<lissipation capacity, and stability to survive seismic loads. The connections must also
accommodate the expansion and contraction of structural elements due to temperature, creep, and shrinkage
121 1.
1.2 Research Needs
In the two decades since the San Fernando earthquake, considerable efforts have been made to improve
the seismic performance of tilt-up construction. Building code provisions have been revised [63]; lateral
load tests on slender walls have been performed [52] and the results led to the adoption of DeW design proce
dures for tilt-up wall panels [5]; in-plane bending tests have been conducted on a variety ofdi..,hragms repre
senting typical roof construction [1,23,43,44,45,72,74]; analytical models have been developed to calculate
the overall r:sponse of til t-up structures to seismic loadings [1,4,6,7,8,12,53,54]; and isolated tilt-up panels
have been subjected to simulated earthquake loading [6,7,28). The results ofthese investigations have led
to an improved understanding of the behavior of tilt-up structures during strong ground motion.
However, lhe perf"rmance 01 lilt-up construction in recent earthquakes demonstrates that additional re
search is needed ifseismic damage is to be reduced to acceptable levels. There have been no tests ofcomplete
.ilt-up systems and attempts to validate analytical models oftilt-up construction using the measured response
of buildings during recent earthquak.es have been limited. Physical teslinghas consisted only of tests on single
panels and isolated diaphragms. There have been few tests to measure the capacity and ductility of typical
connections used in tilt-up buildings. Finally, there are a large number ofexisting tilt-up structures that have
details which do not !'08tisfy current building code regulations. Repair aDd rehabilitation procedures must be
developed to reduce the seismic vulnerability of these structures.
2

1.3 Objectlve and Scope
This report is intended to summarize existing information about the seismic performance of tilt-up
construction. The scope of the report is limited to traditional, tilt-up structures in which conclete wall panels
are cast horizontally. No attempt is made to interpret the response of tilt-up frame structures.
This report is divided into seven chapters. Chapter 2 describes the influence of construction techniques
on the desien of tilt-up structures. Design considerations for the wall panels, the roof diaphragm, and the
critical connections used in tilt-up construction are discussed in Chapter 3. In Chapter 4, the results of pre
vious experimental tests of tilt-up wall panels and roof diaphragms, and previous analytical studies are sum
marized. Acceleration histories recorded during recent earthquakes measured in three tilt-up buildings in
California are evaluated in Chapter 5. Chapter 6 summarizes the damage observed in tilt-up structures fol
lowing the 1964 Alaska, the 1971 San Fernando, the 1987 Whittier Narrows, and the 1989 Lorna Prieta eanh
quakes. Results are summarized in Chapter 7.
1.4 Acknowledgements
This report was completed with the assistance of graduate students Gregory J. Lakota and Fernando S.
Fonseca. Funding for this study was provided by the National Science Foundation, under Grant
B~912Q2[,., for which the cognizant NSF program official was Dr. Henry 1. Lagorio and subsequently is
Dr. '"LP. Singh. Opinions and findings expressed in this report do nm necessarily reflect those of the sponsor.
3

2. CONSTRUCTION OF TILT- UP STRUCTURES
Most imponant developments related to tbe design and construction of tilt-up structures may be traced
to innovations in tbe field. Tilt-up was first used in the early 1900's as an efficient method for fabricating
durable concrete wall panels used in military structures (13]. Contractors found that the quality of concrete
panels cast horiwntally and tilted inlO place exceeded that of traditional cast-in-place walls. Until the 1960's,
tilt-up construction was used almost exclusively for one and two--story warehouses and industrial structures
where economical, quick construction was emphasized [24]. During the past 30 years, increased attention
has been placed on aesthetics, and the uses for tilt-up structures now include office buildings, shopping cen
ters, and other commercial buildings. Construction techniques have been continually refined as the market
for tilt-up structures has continued to expand.
Typical techniques for fabricating and erecting the tilt-up wall panels and roof diaphragms are reviewed
briefly in the following sections. The influence of tbese construction techniques on the design of tilt-up struc
tures is also discussed.
2.1 Wall Panel Construction
Knowledge of fabrication and erection techniques for tilt-up panels is required to proponion the panels
effectively. Altbough tbe panel height is determined by the architect, panel weight, and therefore width and
thickness, is often limited by tbe capacity of the crane used during construction. Stresses induced in the panels
during lifting must also be considered during design (79). Cables are attached to connections cast in the wall
panels at the pick points (Fig. 2.1) and used by the crane to lift the panels from a horizontal to a vertical posi
tion. Improper placement of the pick point can result in extensive cracking of the panel during tilting.
Other factors considered in design include panel fabrication, positioning of the crane at the site, and the
lifting schedule. The proposed building floor plan, panel dimensions, and the architectural treatments to the
exterior panel surface must be considered to ensure that panel fabrication and erection are completed effi
ciently and economically [46]. For example, the outside face ofthe wall panels is typically cast against the
flour slab. The crane is then attached to the inside face of the panel and the panels are positioned from inside
the building (except when erecting the last few panels) (46). This procedure prevents excessive head swing
from the top of the panel and provides excellent traction for the crane when it operates on the floor slab
(Fig. 2.2). Hence. the panel erection process influences the proponioning and fabrication of the wall panels
and the design of the building foundation.
Special attention must be paid to the design ofconcrete panels. Variations in width should be minimized
and attention paid 10 large openings in order to en.sure structural integrity and maintain serviceability after
the panels have been lifted into place (10,35.78). The openings should be located so as not to interf~rewith
4

the load path within the panel (I·ig. 2.3). It is desj':-.ble that openings be placed so as not to intt.rcept panel
joinl:i (Fig. 2.4), because di ffer~ntial movements betw~enpanels can cause doors to stick or windows to break
[78]. However, piers must b<: of sufficient size to resist shear forces, and an arrangement with panel joints
through the openings may he more desirable based on strength considerations.
Oue must also be taken to ensure the serviceability of connections within the structure. Roof framing
members should not be connected to the walls at the panel-to-panel joints in order to accommodate thennal
expaTl:iion of the panels (Fig. 2.5) [78]. Thermal effects are an important coTl:iideration for panel-~panel
connections. because very stiff connections can cause cracking and eventual degI3dation of the panels (78).
2.2 Roof Construction
Roof construction for tilt-up and other low-rise buildings consists of the assembly of three structural ele
menl:i: the framing members, the roof skin, and the fasteners. In the interest of minimizing project costs, roofs
are usually constructed to serve both as an outer protective covering for the building and as a structural dia
phragm to resist lateral loads. Wood and steel are often used as the roofing elements in tilt-up building.;. with
plywood-sh.:alhed roofs being the most common form of roof construction in the western U.S (Fig. 2.6).
Metal deck roofs are often used in the eastern U.S.
Building performance is often directly related to the choice of fasteners in the roof system [5"7]. Because
venicalloads on the roof of a typical low-rise building are relatively small compared with lateral loads from
wind or eanhquakes, the capacity of the roof is proportional to the amount, distribution, and shearing resis
tance of the fasteners.
2.2.1 Wood Diaphragms
A typical plan view of a plywood diaphragm is shown in Fig. 2.7. Glued-laminated (glulam) beams run
in the transverse direction of the building and are connected to the tilt-up wall panels and interior columns.
Sawn purlinsspan between the glulam beams, and are overlain by a skin ofplywood. Nails are used to connect
the structural members.
Wood roofs designed to resist large lateral loads should be constructed as blocked rather than unblocked
systems [33]. In a blocked roof, framing members are located around the entire perimeter ofeach 4xFr-ft ply
wood panel in the roof diaphragm (Fig. 2.8) [57]. Blocking prevents buckling of the plywood under lateral
loads. The shear capacity of a blocked roof is 1.5 to 2 times the strength of a similar unblocked diaphragm
[57]. However, if the design shears are low, which might occur if the proposed building is not designed to
resist earthquake loads, ali unblocked diaphragm is probably the most cost efficient choice.
Panelized roofsystems are often used to minimize the cost ofconstructing a wood diaphragm. Panel sec
tions are fabricated on the ground from purlins and blocking members overlain with sheets of plywood
5

(Fig. 2.9). The grids are then lifted into position and connected to g1uJam beams and purlins already in place.
Speed of construction is the pnmary advantage of this technique: an experienced crew of five workers can
fabricate up to 20,000 ftl per day (33).
2.2.2 Metal Deck Diaphragms
Truss girders and steel joists typically serve as the main structural members in metal deck diaphragms
(Fig. 2.10). Where shear is transferred from the diaphragm to the walls, a perimeter steel angle ledger is typi
cally used as a shear collector, as shown in Section A-Aof Fig. 2.10. In situations where diaphragm-to-wall
connections are embedded steel plates or steel framing members, typical connections are as shown in Sections
B-B. C-C, and D-D. The metal decking typically consists of ribbed members that are either puddle-welded,
screw fastened, or pin-anached to the framing members.
Similarly to blocking in a wood diaphragm, buckling of the roof skin is prevented by installing channel
or Z- or C-type metal deck members transverse to the ribs at each panel end (Fig. 2.11). Metal decking is
typically 20-ft lon~~ and spans 2 to 3 joists. Therefore, placing these "blocking" elements every second or
third joist provides a mechanil>m for transferring large shears within the diaphragm.
2.2.3 Composite Diaphragms
Composite diaphragms usually comprise a metal deck diaphragm, as discussed in Section 2.2.2. overlaid
with a layer of concrete. The concrete fill acts as a ~Iobal buckling mechanism for the metal deck di:.phragm
skeleton.
6

3. DESIGN OF TILT- UP STRUCTURES TO RESIST LATERAL LOADS
During design. the wall panels located at'lund the perimeter of tilt-up buildings are typically assumed
to fonn a box which resists the horizontal and venicalloads. The use of load-arrying members around the
perimeter ofthe structure increases the available area in the building by eliminating the need for internal brac
ing. When a unifonnly distributed horizontal load is applied at the roof level, the roof diaphragm acts as a
deep beam (Fig. 3.1): the interior roofing members represent the web and the perimeter chords represent the
flanges (members BF and CG in Fig. 3.1). Similarly to a plate girder, the diaphragm web is designed to resist
the in-plane shear forces and the flanges are proportioned to resist the axial forces developed due to bending
(3).
Shear forces developed in the diaphragm are transferred to the end walls and are then carried as horizontal
shear into the foundation. Chord reinforcement, located in the panels at the elevation of the diaphragm or
in the edge of the diaphragm itself, restrains the out-of-plane deflections of the tilt-up panels which result
from Ihe in-plane defonnations of the diaphragm.
lilt-up systems represent an economical alternative to metal-<lad or masonry buildings in the compet i
ti"e environment of low-rise commercial and industrial structures. In order to reduce the total cost ofa build
ing, the effon spent on design of tilt-up systems is usually minimized (15). Maximum advantage is taken
of standardized design procedures and minimum building code requirements. Although this approach pro
vides a quick and inexpensive -nethod for proportioning tilt-up wall systems, it is unly reliable for regular,
rectangular buildings with few openings in the wall panels or offsets in the perimeter. More sophisticated
analytical methods may be required fOT the design of buildings with irregular geometries.
Design of a tilt-up system involves the proportioning of three components: the tilt-up wall panels, the
horizontal diaphragm, and the primary connections (those between the wall panels and the diaphragm, be
tween adjllcent wall panels, and between tbe wall panels and the foundation). Methods used to design these
structural elements and factors affecting component perfonnance are discussed in the following sections.
3.1 Wall Panels
The provisions of the Unifonn Building Code [77] govern tbe design of tilt-up wall panels in most re
gions of high seismicity in the U.S. Panels must have sufficient strength to resist moments and axial forces
due to the factored vertical and lateral loads, and must have sufficient stiffness to control deflections under
service loads. Because slender walls may develop significant out-of-plane deflections, p-tJ moments must
be considered when evaluating both panel strength and stiffness.
7

Individual wall panels are typically modelled as uniformly-loaded, simply~upponedreams (Fig. 3.2).
The midspan deflections corresponding to the cracking moment•.1eT , and nominal flexural capacity, .1", may
be approximated as:
(3.1)
(3.2)
where Mer is the cracking moment of the panel, Mil is the nominal flexural capacity of panel, h is the distance
between supports, Ec is Young's modulus for concrete, [8 is the moment of inertia corresponding to gross sec
tions, and ler is the moment of inertia corresponding to fully cracked sections.
The UBC limits midspan deflections under service loads, L1 s , to [77]:
A <: hLJ S - ISO (3.3)
where L1 s is calculated assuming a linear variation of displacement between the cracking moment and the
nominal capacity:
A A ( Ms - MeT) (Ll A).... S = "-'" + ( M" _ Mer) .. - LJ cr
where Ms is the maximum moment in the wall under servic~ loads.
(3.4)
Typically, the provisions of UBC Section 2336 are used to determine the design lateral forces for the wall
panels. The specified lateral force for design is [77]:
(3.5)
where Fp is the lateral force resisted by the parlel, Z is the seismic zone factor,l is the importance factor, Cp
is defined as 0.75 for exterior walls. and Wp is the weight of the panel. For a building located in seismic zone
4 with an importance factor of 1, the design lateral force is equal to 30% of the panel weight
The UBC design procedure [77] is based on the results of a series of lateral load tests conducted by the
ACI-SEASC Task Committee on Slender Walls [16]. Twelve tilt-up wall panels, with slenderness ratios
ranging from 30 to 60, were tested during this investigation. The test configuration is shown in Fig. 3.3. The
Task Committee found that previous design procedures [81], which assumed that the entire wall panel was
fully cracked. overestimated mid-panel deflections. An iterative approach for estimating deflections was
proposed where the panel midspan deflection is calculated using Eq. 3.6 based on the magnitude of the mid
span moment under service loads and the midspan moment is determined using Eq. 3.7 which includes the
influence of P-Ll effects (Fig. 3.4).
8

M < Mer
Mer < M < My(3.6)
(3.7)
wbere w is tbe lateral load, .1 is the midspan deflection, M is the midspan r.tomeut, My is the yield moment
for the panel, Pp is the weight of the panel, Po is the applied venicalload at the top of the panel, and e is the
eccentricity of tbe applied load, Po.
The design procedures in tbe UBC and Task Commiltee repon are based on the following assumptions:
A wall panel behaves as a uniformly-loaded, simply-supported member: maximum moments
and deflections occur at midspan and tbe horizontal displacement of the top of the panel relative
to the base is ignored.
The panei cross-section is constant over the height of the panel.
Many common tilt-up structural configurations do not satisfy the conditions implied in the design proce
dures. Under seismic loading, tbe roof of a tilt-up structure moves relative to the base violating the assumed
simply-supported boundary conditions, concentrated loads are transferred to the panel at intermediate points
along the panel height in buildings with multiple stories, and panels are frequently cast with large openings
causing variations in the moment of inertia overthe height of the panel. Proponioning ofpanels witb openings
fur seismic loads appears to be the most important of these concerns. Damage was observed in panels with
openings following the 1987 Whittier Narrows [10,35] and 1989 Loma Prieta [69] earthquakes.
3,2 Diaphragms
A diaphragm transfers lateral forces from one lateral-load resisting system to another. In the process of
transferring these forces, the energy dissipated by the flexible diaphragm can reduce tbe magnitude of the
forces that the other structural elements must resist. In tilt-up structures the roof is typically the primary dia
phragm, however, vertical diaphragms, such as those used to subdivide the structure or to compensate for wall
offsets, may also be found in tilt-up construction. In the {ollowingsections. emphasis is placed on horizontal
diaphragms.
Horizontal diaphragms in tilt-up structures are typically designed to be flexible and may sustain sizeable
in-plal~e deformations when subjected to lateral loads. As shown in Fig. 3.1, the horizontal shear developed
in the diaphragm is resisted by the transverse walls which musttransferthatsheartothe foundations. Continu-
9

ity within the diaphragm and between the diaphragm and the transverse wall is dependent upon the strength
and deformation capacity of various connections. Four general criteria must be satisfied [73J:
• Connections between adjacent sections of the roof (e.g. BIKC and IJLK in Fig. 3.1) must restrain
relative horizontal deflections.
Connections between the roof framing members and the diaphragm skin must prevent buckling
of the skin.
Connections between the diaphragm and the lateral-load resisting walls must be sufficient to
transfer the diaphragm shear (e.g. connection between roof panel BIKC and wall panel ABeD
in Fig. 3.1).
Connections between the sections of the diaphragm and the diaphragm chord (e.g. chords BF and
CG in Fig. 3.1) must be sufficient to transfer the shear resulting from out-<lf-plane bending of
the longitudinal wall panels.
Connection details vary depending upon the materials used to construct the diaphragm. Factors influencing
the design and behaviorofwood and metal-deckdiaphragrns are discussed in the following sections. Metal
deck diaphragms generally provide more stability, stiffnes.,. and resistance to environmental effects than
wood diaphragms. Experience has shown that panel-to-mof connections in tilt-up structures with metal
deck diaphragms perform better under severe loadi:ag than panel-to-roof connections in tilt-up structures
with plywood diaphragms. However, connections between roof elements in a metal deck do not perform as
well as those in plywood diaphragms under the same conditions. Regardless of connector performance, the
materials used for diaphragm construction are usually chosen to minimize the initial cost of construction.
3.2.1 Diaphrt'gm Strength and Stiffness
The distribution of forces from the diaphragm to the tilt-up wall panels depends on the stiffness of the
diaphragm [3J. As shown in Fig. 3.5(a), forces are distributed in proportion to the tributary area supponerl
by the wall panels in buildings with flexible diaphragms. In contrast, forces are distributed in propoition to
the relative stiffness of the wall panels (Fig. 3.5(b» in buildings with rigid diaphragms. AO Committee 551
[3J classifies diaphragms according to the sbear stiffness (fable 3.2) and reports that most plywood and
metal-4eck diaphragms may be considered to be semi-flexible (Fig. 3.5(a». Composite and concrete dia
phragms are typically semi-rigid or rigid (Fig. 3.5(b»).
According to one school of thought, a rigid diaphragm is beneficial for lateral-load resistance because
the out-o(-plane deflections in the wall panels are reduced [42,50,73]. However, flexible diaphragms and
flexible roof-to-wall connections provide a mechanism for energy dissipation which reduces the magnitude
of the forces transmitted to the perimeter walls [71].
10

(a) Wood Diaphragms
Historically, plywood diaphragms have been the most common type of diaphragm used in tilt-up
construction on the West Coast. The allowable shear strength of various plywood diaphragm configurations
is summarized in Table 3.1 [77]. The results of monotonic experimental tests [23,43,44,45,72,741 sponsored
by the American Plywood Association in the 1950's and 60's fonn the basis for these design provisions. The
nominal shear strength of plywood diaphragms is typically 3 to 4 times the allowable shear stress for design
(57].
The UBC requires that the in-plane defonnations of the diaphragm must not exceed the deflection limits
of the supponing elements [76]. The foliowing equation was developed from tests by OJuntryman [23] and
is suggested by the American Plywood Association [57] for calculating deflections in single-layered. ply
wood sheathed diaohragms under service loads:
d = 5vL3 ~ 0094 L I (-1< X)8£Ab + 4Gt +. ell + 2b (3.8)
where d is the maximum deflection of the diaphragm, in.; v is the diaphragm shear, IblCt; L is the diaphragm
length, ft; b is the diaphragm width, ft;A is the cross-sectional area oCthe chord, in.2;E is the elastic modulus,
psi; G is the shear modulus. psi; t is the effective thickness of the plywood; ell is the deformation of the nails,
in.; -1e is the slip in the individual chords, in.; and X is the distance between the suppon and the splice. ft.
The four components of Eq. 3.7 correspond to deflection due to diaphragm bending, deflection due to
diaphragm shear. deflection due to slip of the individual nails, and deflection due to slip at the chord splices,
respectively. Representative values of fastener slip, ell' are summarized in Table 3.3. The individual chord
splice slip, LIe, has nOl been quantified in any of the building codes or design recommendations and is lISually
assumed based on data from relevant tests or engineering judgement. When the flange chord is steel reinforc
ing bal or steel angle ledgers as in concrete tilt-up construction, the splice slip component is reduced to the
minimal effect of web-flange shear transfer between the perimeter chord and the boundary diaphragm ele
ments [34).
(b) Metal-Deck Diaphragms
Guidelines for the design of metal~eckdiaphragms are published by the Steel Deck Institute (47,48].
The results of experimental tests conducted at West Virginia University [49] form the basis for these provi-
sions.
As shown in Fig. 3.6, the panel length for metal~eck sheets typically corresponds to 2 or 3 times the
purlin spacing. Connections between the corrugated decking and the supporting members are shown sche
matically in Fig. 3.7. The strength of the diaphragm is typically controlled by failure of the connections in
11

the metal deck or local buckling of the metal-deck panels [48]. Nominal diaphragm strengths for each mode
of failure are summarized in Table 3.4. Three conditions must be evaluated to determine the shear strength
of a diaphragm that is limited by the connections: failure of the structural connections between the metal deck
and the supporting members along the edge of the diaphragm (Fig. 3.8), failure of the structural and sidelap
connections (connections between adjacent metal--4eck panels) in an interior panel (Fig. 3.9), and failure of
the comer fasteners (Fig. 3.10) (48).
The deflection ofa metal-deck diaphragm is larger than the deflection of a comparable, continuous plate
of uniform thickness because the metal-4eck. diaphragm is made {rom individual sheets of finite width that
are joined at discrete points along the edges (49). Stress fields are discontinuous within the metal-4eck dia
phragm due to these gaps leading to larger displacements. The corrugations in the metal deck are susceptible
to warping at the ends of the panels. which also increases the deformations.
Studies of l1letal~eckdiaphragms [49] have identified {our phenomenon that must be considered when
calc ulati ng diaphragm deflections: shear displacement of the diaphragm, end warping of the deck panels, slip
at the interior sidelap connections. and slip of the supporting system of puriins and edge beams. An underly
ing assumption in this approach is that the shearstiffness of the metal deck is small compared with the flexural
stiffness. Therefore, only shear deformations are considered (47).
The displacement due to pure shear (Fig. 3. 11(a» may be calculated as [481:
.1 = (P a) 2 (1 + v) 1-S LEt d
(3.9)
where LIs is the pure shear displacement, in.; P is the applied diaphragm load. kip; a is the diaphragm width,
ft; L is the diaphragm length, ft; v is Poisson's Ratio; E is Young's Modulus, ksi; t is the thickness of the deck
element, in.; d is the corrugation pitch, in.; and s is the developed flute width. in. (Fig. 3.7(b)).
Unless the corrugated deck elements are restrained, an extra component vfdeflection results from warp
ing (Fig. 3. 11(b»). This component of displacement is derived from treating the corrugation as a beam on an
elastic foundation and leads to rather cumbersome expressions for warping displacement. However, warping
constants. D", are tabulated in the Steel Deck Institute manual [48) for common deck panels so detailed cal
culations are unnecessary.
The influence of fastener and support slip are included in the coefficient C [48]:
(3.10)
where S, is the structural connection flexibility, in./kip; Ss is the sidelap connection flexibility, in.lkip. The
terms at. a2. lis, and lip are related to the number and anangement of the fasteners. and are defined in
12
Table 3.4. Fastener strengths and flexibilities are defined in Table 3.5 and discussed in Section 3.2.2. The
slip coefficient. C. decreases with an increase in the number and stiffness of the fasteners, or with an increase
in the thidilifSS of the metal deck.
The shear displacement, warping constant, and slip coefficient are combined to give the total deflection
of a diaphragm subjected 10 a load P as follows (48):
Pa.1, =.1. + (</)Dn + C)E t L (3.11 )
where.1( is the diaphragm deflection. in. and the factor</) reflects the influence of purlin spacing on warping.
Values of </) are tabulated in Ref. 48 and range from 1.0 for deck sheets that span over two or three purlins
to 0.58 for deck sheets that span over eight purlins.
The shear stiffness, expressed in kip/in.• of a metal deck diaphragm may be calculated as (48):
G' = E t2.6 ~ + 4JDn + C
(c) Composite Diaphragms
(3.12)
When additional stiffness is required in a metal-deck diaphragm. the decking is often over-lain with con
crete. In concrete composite diaphragms, the shear strength is dependent upon the type of concrete used.
Nominal strengths are presented in Table 3.6 for composite diaphragms with structural and Insulating con-
cretes.
The shear stiffness ofconcrete composite decks may be derived from Eq. 3.12. The concrete fall prevents
warping of the corrugated elements and the stiffness of the concrete fill must be considered (48J:
G' = E ( + 3.5 d 1f')O.72.6 a+ C c vc
(3.13)
where 4: is the depth of the concrete cover above the top corrugations, in. and fc' is the specified compressive
strength of the concrete, psi.
3.2.2 Diaphragm Fasteners
(a> Wood Diaphragms
The fasteners used within the framing elements ofa wood roofdiaphngm can be broken down into three
categories (71 J: nails. staples. and adhesives. Nails are by far the most common mechanical fastener in wood
diaphragm construction and are produced with either plain or mechanically deformed shanks. Nail pulHlut
was a common cause of roof failures in low-rise buildinp in the 1971 San Fernando earthquake [55) and at
13

that time most nails had plain shanks. By inducing deformation in the nail shank, an increase in the nail's
pull~ut resistance occurs, along with a decrease in the required depth of penetration for the nail to achieve
resistance. Therefore deformed shank nails are now recommended for use in high seismic zones.
The pull~ut strer.gth of nails with lengths between 3.4 and 11/ S in. and various deformed shanks are
compared with 6d common nails tn Fig. 3.12 (20). In general, nails with helical threads provide more strength
and create a stiffer connection than nails with annular threads [71]. The size of the nail head is also important
[711. A large nail head gives a larger bearing :liea and therefore more resistance against the nail pulling
through the diaphragm skin. Splitting of the plywood skin was also a common mode of roof failure in the
1971 San Fernando eanhquake (55).
Staples are the second most common type offasteners in plywood diaphragms. Staples are not as variable
in geometry as nails. They have such general classifications as "slender" or "thin" and "stout" or "fat" [71].
It is considerW better practice to use many slender staples than a few stout staples because slender staples
cause less splitting of the plywood and can be driven with lighter tools. Staples can be used in place of nails
in order to control plywood splining or when a small fastener spacing is required.
Two types of adhesives are used in diaphragm construction: rigid adhesives and mastic adhesives. Rigid
adhesives use staples or nails only to hold the wood in place until the adhesive has set [71). Mastic adhesives,
however, resist service I(\ads with the help of fasteners, and at large loadings the load is carried solely by the
fasteners while the mastic adhesive acts to reduce the amplitude of the deflection [71]. Although adhesives
provide strong and durable connections, their use is not widespread because of their relatively high cost
(b) Metal-Deck Diaphragms
The fasteners used foc connections within metal-dcck diaphragms can be divided into three categories:
welds, screws, and power-driven pins [47). Each ;ype of fastener exhibits higher strength and stiffness when
the connection is between the metal deck and a structural member (structural connections) than when the COIi
nection is between deck sheets (sidelap or sti tch connections). The fastener strength and flexibili ty ofstruc
tural connections will be denoted as Q{andS" while the fastener strength and flexibility ofsidelap connections
will be denNe>:' as Qs and Ss. The strength and flexibility of common connectors are presented in Table 3.4
(48).
Welded connections are the most common in metal decks due to the speed of construction [47]. The
strength of puddle welds without washersdependson the thicknessof the metal deck, the diameterof the weld,
and the strength of the base material. Problems can occur if the amperage is too high during welding leading
to bum-through of the upper layer of deck. or if the amperage is too low there may be improper fusion ioto
the bottom layer [47]. When thin deck sh.:ets (less than 0.028 in.) are used a the diaphragm, weld washers
14

are recommended because they act as a heat sink and control the size ofthe hole [48]. The strength ofa welded
connection with w~Jd washers is related to the thiclrness of the deck, the diameter of the hole in the washer,
and the electrode strength. The strength of welded sideJap connections is taken 10 be 75% of the comparable
strength of structural welded connections. Welded connection flexibility is usually small compared with the
flexibility ofother types of fasteners because the sliparound the welds is relativeIysmall and limited primariJy
to distonion of the deck element around the weld (48).
The equations for strength and flexibility of screwed connections are based on experimental data using
No. 12 and No. 14screws and apply to both self-drilling and self-tapping types of screws [47]. Furstructural
connections, the strength is controlled by the thickness and yield stress of the d~king. Strength depends on
deck thickness and screw diameter for sidelap connections.
Power-driven pins are shafts, which may be slightly tapered, that are driven through the deck elements.
Holes are not pre-drilied. The strength ofstructural connections depends on the type of pin and the thickness
of the deck, while the strengtl& of sidelap connections depends only on the thickness of the deck.
3.2.3 Design of Non-Rectangular Diaphragms and Diaphragms with Openings
Due to the inherent flexibility of roof diaphragms in tilt-up buildings, large deflections are expected un
der lateral loads. Consequently, tilt-up buildings with irregular plans may experience large incompatibilities
in displacements between adjoining sections of diaphragm near reentrant comers or near stairwells attached
to the roof (Fig. 3. 13(a) and 3.l4(a». The concentration of displacements generates large shear forces and
has the potential to cause structural damage [14]. In Older to resist these shear forces, the diaphragm must
be designed with structural members that "collect" the force and transfer it to the vertical wall panels. These
collector elements, called drag struts, receive the diaphragm force in shear and then "drag" the force back to
the vertical elements by anchorage [14]. Figures 3.13(b) and 3.14(b) show that the addition of drag struts has
divided the diaphragm into smaller rectangular diaphragms [14l, and the displacements at reentrant comers
and stairwells are compatible witb the surrounding structural elements.
Rather than provide structural elements to resiSt the high shear forces developed at the reentrant comers
and stairwells, efforts can be made to eliminate these forces altogether by avoiding displacement incompati
bilities at reentrant comers and stairwell~as show J in Fig. 3.13(c) and 3. 14(c). By not attaching the wall pan
els to the roof in these areas, displacement incompatibilities at critical locations no longer exist. The unat
tached walls and stairwells will deflect as solitary units without affecting the global diaphragm response.
Smaller rectangular diaphragms within a global non-rectangular diaplmagm are called "subdiaphragms,"
and arc subject to tbe same code provisions and constraints as a typical diaphragm [34). Specifically, all sub-
15

diaphragms must be sized such that they confonn to the maximum diaphragm aspect ratios given in Table
No. 25-[ of the UBC (Table 3.7) [77].
Higi. local shears that may be present in a diaphragm with openings must also be considered. Local shears
are typically co~idered by analyzing the diaphragm as a Vierendeel truss [74] as shown in Fig. 3.15. The
shear and bending forces along and across critical sections of the diaphragm must be calculated to dete:mine
if the surrounding framing members have sufficient capacity to resist the amplified bending and shear forces
located in the vicinity of the opening. It is important to provide blocking members around the perimeter of
all openings and to proVide a positive direct connection between the blocking and the surrounding framing
eiements.
3.3 Connections in Tilt-Up Systems
Selecting appropriate connections is the most important aspect of designing tilt-up buildings to resist
earthquak.e loads. The capacity and ductility of the connections will determine whether or not a structure per
forms satisfactorily dur;ng 3n eanhquak.e. The connections in a tilt-up structure can be divided into three
types: pane[-to-foundation connections; panel-to-panel connections; and panel-to-roof connections.
3.3.1 Panel-to-Foundation Connections
Typical panel-to-foundation connections are shown in Figs. 3.16 and 3.17 [40.55,80]. The Uniform
Buildin~ OxIe [77J requires that conJ1ections between precast walls and the supporting member must resist
a tensile force in It- of at least 50·Ag where Ag is the cross-sectional area of the wall in in. l . Most designers
do not provide a physical connection between the tilt-up panel and the foundation as specified by the UBC
because in many instances the weight of the panel counteracts any uplift forces. Rather, a dowel connec:;on
hetween the panel and floor slab is typically provided. If lateral loads are expected to prodxe uplift forces
in the tilt-up panels. then designers typically will provide one of the following types ofconnections: (I) physi
cal connection between tilt-up panel and foundation (which in most instances is *4 bars at 4 ft on center),
or (2) sufficient panel-to-panel connections to constrain the in-plane walls to behave as one monolithic shear
wall. This monolithic behavior increases the resisting moment oCthe shearwall which counteracts the applied
moment from the lateral forces producing uplift. Currently, many engineers are trying to remove UOC provi
sion 2615(i)3B which would allow designers to decide if panel-to-foundation connections are needed.
3.3.2 Panel-to-Panel Connections
Panel-urpanel connections have changed significantly during the past 30 years. In tbe i 960'5 continu
ous, cast-in-place pilasters were often used to connect panels (Fig. 3.18(a». Another common detail was
to provide connecrions at six to eight foot intervals along the height of the wall (Fig 3.18(b». However. in
recent construction. a single continuous chord is typically provided at the roof level around the perimeter of
16

the building [10,80], with no other connecnons between panels, except at the corners of the building (Fig.
3.19). The perimeter chord provides a restraint that holds the tilt-up building together, so that it functions
as a unit unje~ seismic loading. Designers recommend restricting panel-to-panel connections to the single
continuous chord in order to eliminate degradation of connections due to temperature and shrinkage effects.
Also, some designers believe that the increased amount of structural damping due to fewer panel-to-panel
connections more than compensates for the decreased lateral resistance that results from using less connec
tions [80J.
Pilaster connections are not common in new construction because the pilasters produce stress concentra
tions at the connected panel edges. as a result of out-of-plane deflections. and they restrain movement due
to shnnkage and temperature effects (10).
3,3.3 Panel-to-Roof Connections
In tilt-up construction. the critical connection for seismic loading is usually the connection between the
roof diaphragm and the concrete tilt-up wall panel. Panel-ta-roof connections must be designed to resist
forces normal and parallel to the plane of the panel. Inadequacies of these connection have beer, the cause
for many partial roof and panel collapses during the past three decades. The 1964 Alaska earthquake and the
1971 San Fernando earthquake gave clear evidence that the use of the popular wood ledger connection, as
shown in Figs. 3.20 and 3.21 [77l, must be restricted to regions of low seismic risle and should be replaced
by some type of joist anchor in high seismic risk zones (Fig. 3.22) [25]
Wood ledger connections were found to be susceptible to three failure mechanisms: the ledger was placed
in cross grain bending by seismic lateral loads which resulted in the wood ledger splitting along the bolt line;
the bearing stresses of the nails in the plywood-la-ledger connection caused the nails to shear through the
plywood; and the force on the nails resulting from tension in the plywood overcame the pull-out resistance
of the ledger.
In 1976, the UBC [75] introduced four new code provisions to avoid these problems (Fig. 3.23). Those
provisions are reproduced in Appendix A. Section 2310 specifies a direct connection between the wall and
diaphragm capable of resisting at least 200 Ib per lineal foot of w<ill. Section 2312(j)2D requires continuous
ties between diaphragm chords to anchor these forces. Section 2312(j)3A prohibits the usr of toe nails, nails
subjected to withdrawal, or wood framing used in cross-gram bending or cross-grain tens:,}n in all seismic
zones except zone 1. Section 2312(j)3C draws attention to the need 10 have exterior panels able to aCC.:lmmo
dale structural movements resulting from both lateral forces and temperature changes. These provisions have
remained essentially unchanged through the 1991 edition of the UBC [77].
17

As sped fled in Section 2110 of the UBC, the panel-to-roofconnection must resist a minimum anchorage
force of200 Ib per lineal foot of wall. This provision rareIy controls in tilt-up construction, however. Consid
er, for example, a till-up warehouse with a plywood roof diaphragm constructed in California ciuring the early
1970's. The panel height is likely to be greater than 17 ft. The design force for the panel, Fp , is calculated
using Eq. 3.5 where the zone factor i3 taken to be 0.4, the importance factor is taken to be 1.0, and Cp is taken
to be 0.75 [77). This leads to a design lateral force for the panel of03Wp where Wp is the weight of the panel.
However, the UBC states that when designing the connections in the middle half of the building, Cp must be
multiplied by 1.5 for flexible diaphragms. If the tilt-up panel is modelled as a simply~upported member,
then the connection force between the foundation and the panel is the same magnitude as the connection force
between the panel and the diaphragm, 0.225Wp . Assuming a minimum panel thickness of 51f2 in., the weight
of the panel :s 1170 Ib/ft, and the connection between the panel and the diaphragm must be designed to resist
265 Ib/ft. which is grealer than the specified minimum strength. Therefore, the minimum anchorage force
of 200 Ib/ft shuuld be considered '0 be a lower bound in tilt-up construction.
The unsatisfactory perfonnance of many panel-to-roof conr:ections indicated that continuous ties were
needed bet~eendiaphragm chords to distribute horizontal forces within the diaphragm and that direct, posi
tive connections were needed for anchorage of the diaphragm to the panels. Because the use of continuous
ties from one end of a diaphragm to the other W1S highly inefficient, the concept of subdiaphragms was
introduced (Fig. 3.23). A series of small "diaphragms" within the total diaphragm were used to transfer an
chorage forces to the wall from the diaphragm interior. For the 16x64-ft subdiaphragm EFGH in Fig. 3.23,
the longitudinal purlins serve as ties. if the purlins are connected directly to the wall (Fig. 3.22, 3.24, and 3.25)
and are made continuous over tbe interior glulam beams (Fig. 3.26). If, however, the purlins do not frame
into the side walls, as is the case for some existing construction, then a retrofit can be made by introducing
ties into ,he 8xl6-ftsubdiaphragm HIJK(Fig.3.23) by metal strapsor rods. as shown in Figs. 3.28, 3.29,3.30,
and 3.27, to create the continuous tie connection. In the transverse direction. the continuous tie can be pro
vided by connecting the glulam beams directly tu the tilt-up wall as shown in Fig. 3.31. The subdiaphragm
concept, therefore, simultaneously fulfills the provisions for continuous ties between diaphragm chords and
for c1osely~paced ties for walls with negligible bending resistance between anchors.
Several varieties of "direct" connections of plywood sheathing and roofjoists to the wall panel reinforce
ment, as seen in Figs. 3.22, 3.28, 3.29, 3.30. 3.31, have been used. The advantages and disadvantages ofeach
of those connections are listed below each figure [25]. Connections used to retrofit the wood ledger in
Fig. 3.20and 3.21 to provide bener anchorage ofthe framing members to the wall panel by providing a "direct
connection" are shown in Figs. 3.24, 3.~. 3.27. Such schemes were used to repair and upgrade roof-t~wall
connections after the 1971 San Fernando and 19R7 Whittier Narrows earthquakes.
18

After the 1971 San Fernando Earthquake, building codes also placed limits on plywood thickness [75].
For the details shown in Fig. 3.23, plywood was to be at least ~h6-in. thick for sub-purlins (studs) placed
16 in. on center and at least 3/s-in. thick. for studs placed 24 in. on center. These limits on plywood thickness
were implemented to reduce the likelihood of nail shearing through the plywood.
The influence ofshrinkage in wood diaphragm elements must be considered when evaluating the durabil
ity of panel-to-roof connections. Shrinkage in sawn lumber framing members may be approxima~edas
Ih2 in. shrinkage per 1 in. of width or depth as the member progresses from the green to the dry state [25].
GluIam beams can be expected to shrink 1/16 in. per foot of depth for every 3% moisture loss. This restraint
could lead to pull-out of the fasteners connecting the embedded strap to the plywood, or degradation of !he
ledger due to cross-grain tension splitting along the bolt line.
3.4 Summary
Typical design procedures for tilt-up construction creat a building as a series of individual components,
rather than a structural system. The diaphragm is designed as a sirnply-supponed shear beam to transfer later
al forces into the end walls, and the wall panels are designed as slenc~rcolumns, pinned at both ends, to resist
gravity and lateral loads. Code-specified forces are often used to design the critical connections.
19

4. SUMMARY OF PREVIOUS INVESTIGATIONS OF THE SEISMIC
BEHAVIOR OF TILT-UP CONSTRUCTION
Since the 1971 San Fernando earthquake, engineers throughout the U.S. have studied the s::ismic re
sponse of many types of buildings. i111d developed design provisions to improve the performance of new
construction. In Southern California, emphasis was placed on reducing the seismic risk of unreinforced ma
sonry and tilt-up buildings. These types uf construction have sustained significant structural damage during
recent earthquakes and represent a large portion of the inventory of existing, low-rise, industrial buildings.
Much of the work related to tilt-up construction has been conducted by researchers at Agbabian
Associates [4,5,6,8,7,9,10,11,12,27,28), where analytical modelling procedures have been developed
based on the results of experimental tests. Analytical models of tilt-up systems have also been developed at
Dames and Moore [53,54].
Experimental tests of diaphragms subjected to cyclic loads have been conducted by AgbabianlBarnes/
Kariotis (ABK) (1) and researchers at the University of British Columbia [26), the University of California
[84,851, Stanford University (83), and Washington State University [39). The ABK tests represent the most
extensive investigation with tests of full-5Cale plywood. wood-sheathed, and metal deck diaphragms. How
ever, a detailed description of the results has not been published (2).
The results of these experimental and analytical studies are summarized in this chapter. Diaphragms are
discussed in Section 4.1, tilt-up wall panels are discussed in Section 4.2. and analytical models for complete
tilt-up systems are summarized in Section 4.3.
4.1 Cyclic Response of Diaphragms
During a design-level earthquake, the types of roof diaphragms used in most tilt-up structures are ex
pected to experience nonlinear response. The nature of this response is extremely sensitive to the types of
connections used within the diaphragm and to the actual material properties of the diaphragm components,
which are highly variable. Most of the experimental research to date has focused on the behavior of wood
diaphragms, because wood diaphragms have been used almost exclusively in Southern California and the
Pacific Northwest during the past 20 years. The results of five experimental investigations of the cyclic re
sponse of wood diaphragms and panels are summarized in Section 4.1.1. Data from individual connections
and complete diaphragms are presented. The limited data from cyclic tests of metal~eckdiaphragms are
described in Section 4.1.2. Methods for modelling diaphragms are discussed in Section 4.1.3. Analytical
representations of the diaphragms range from using several nonlinear spring elements to special-purpose fi
nite~lement models with individual nail elements.
20

This section is not intended to summarize all experimental and analytical work related to diaphragms.
Only investigations that involve cyclic loading are discussed. The paper by Peterson [56] contains a compre
hensive review of the literature related to wood diaphragms.
4.1.1 Experimental Tests or Wood Panels and Diaphragms
The first phase of many investigations of the behavior of plywood diaphragms and panels is devoted to
understanding the response of the individual nailed connections. The measured response of nails connecting
plywood and framing members is shown in Fig. 4.1. The data shown in Fig. 4.1(a) were obtained by cycling
the connection to a given force level (39), while the connection shown in Fig. 4.1(b) was cycled between given
displacement levels [26]. In both cases, the stiffness of the connection decreased as the amplitude of the dis
placement increased, and the connection exhibited a region of extremely low stiffness as the applied load
passed through zero. Once the connection was pushed into the nonlinear region of response, specimens would
ex.perience larger displacements when pushed to the same nominal force level (Fig. 4.1(a)) and specimens
pushed to a specified displacement would resist lower forces as the number of loading cycles increased (Fig.
4.1(b».
Five experimental investigations in which complete diaphragms or panels were subjected to load rever
sals are summarized in Table 4.1. Young and Medearis [83], Zacher and Gray [84,85], ltani and Falk (39),
and Dolan [26] evaluated the response of plywood, gypsum board, and waferboard panels, while ABK [1]
and ltani and Falk (39) investigated the behavior of plywood, lumber-sheathed, and gypsum board dia
phragms. The general shape of the measured hysteretic response ofcomplete diaphragms closely resembles
the behavior ofthe individual connections (Fig. 4.2). The force-displacement curves are pinched, diaphragm
stiffness decreases with increasing displacement, and diaphragm stiffness decreases as the number of inelastic
loading cycles at a constant displacement or force level increases.
Young and Medearis [83) found that 20 cycles attlle nominal design level did not influence the capacity
of the wall panel nor the nonlinear force-displacement response. This observation was confirmed in small
scale panel tests by Yasumura and Sugiyama [82] where panels were subjected to 50 cycles at ±60% of the
strength of nominally identical specimens tested monotonically. Accumulated damage was observed in tests
when the panels were subjected to loading cycles of ±80% of the capacity (82).
Young and Medearis (83) also estimated viscous damping factors from their test results. During load
cycles at the nominal design level, damping values of 0.07 and 0.10 were calculated for panels with one and
two layers of plywood, respectively. Polensek [58) identified damping factors between 0.07 and 0.11 from
low-amplitude, free-vibration tests of plywood floor systems. hani and Falk [39] also estimated damping
coefficients {rom free-vibration tests (Fig. 4.3). At a displacement level o{ 0.1 in., damping factors in the
plywood diaphragm specimens were between 0.1 and 0.1S. Equivalent damping {actors incre3SCd to more
21

than 0.20 when the displacement level was increased to 0.6 in. As indicated in Fig. 4.3(b), the displacement
levds used in both free-vibration tests did not cause significant nonlinear response in tbe diaphragms.
'l'lIe ARK.diaphragm tests were d~igned to evaluate a number of pra~ticalconcerns sucb as the inn uence
of bloc1c.Jng, roofing materials, and retrofit nailing on the response of diaphragms [1]. Table 4.2 contains a
summary of the primary experimental variables in these tests. Each diaphragm was subjected to a series of
quasi-static load rever.>als and earthquake motions in real time. Schematic drawing<; of the diaphragm test
specimens are shown in Fig. 4.4. Comparisons of the quasi-static and dynamic response of diaphragm Dare
shown in Fig. 4.2(c) and (d). The average initial stiffness inferred from the low-amplitude quasi-static tests
of all diaphragms are reported in Table 4.2.
Data obtained during the dynamic. earthquake simulations indicate that diaphragm response remains
nearly linear up to accelerations of approximately O.lg (1 J Beyond O.lg, the nonlinear characteristics of the
diaphragm may be observed. Researchers noted that roofing material initially added stiffness to the dia
phragm, however, the roofing material separated from the diaphragm when the accelerations reached approx
imately 0.2g [1].
Zacher and Gray [84,85] compared the behavior of panels connected with nails and staples, and eva
luated the influence of over-driving the fasteners. The results indicated that stapled panels do behave satis
factorily, however the nailed panels were able to resist larger displacements before failure. Panels with nails
over-driven by 1 (3" failed in a brittle manner at displacements that were less than 75% of the displacement
capacity of similar panels in which the nail heads did not break the plywood veneer. The displacement capac
ity of panels with staples was also reduced when the staples were over-driven, however, the failure mode was
not as abrupt as observed for the nailed connections.
4.1,2 Experimental Tests of Metal-Deck Diaphragms
As indicated in Table 4.2, metal-deck diaphragms were also tested as part of the ABK investigation [11.
The measured response of diaphragm R is shown in Fig. 4.5. Response during the quasi-static tests
(Fig. 4.5(a)) is similar to that of ply\.ood diaphragms. The metal-deck diaphragm displayed a pinched hys
teresis curve and the effective stiffness decreased with increasing displacement It is difficult to make conclu
sions about the cyclic force~isplacement response of mctal-deck diaphragms from the dynamic data
(Fig. 4.5 (b».
4.1.3 Analytical Mod••s of Dlaphl'8gms
The mea:.ured data described in Sectiou 4.1.1 form the basis for the analytical representations of dia
phragms discussed in this section. In all cases, the nonlinear features of the analytical models were scaled
22

from available experimental data. No procedures are available to estimate the nonlinear response of a dia
phragm given the nominal design properties discussed in Chapter 3.
In the late 1970's, Adham and Ewing (11) developed an analytical model where eight inelastic spring and
damper assemblies were used to model wood diaphragms (Fig. 4.6). Diaphragm propenies scaled from the
monotonic tests performed by TIssel (74) were combined with the linear hysteresis rules shown in Fig. 4.7.
The calculated frequencies of plywood and lumber sheathed diaphragms ranged from 2.8 to 11.5 sec. which
is considerably larger than those inferred by Blume and Rea from full-scale, non~estructivetests of wood
diaphragms in school buidlings (17, 18,62].
Following the ABK tests [ I], Adham (4) refined the hysteresis model for plywood diaphragms. A se
cond-order curve was selected to model the force-deflection envelope of the diaphragm (Fig. 4.8(a»:
F(e) = F. e
~: + lei(4.1)
where F(t!) is the force in the spring, e is the deformation of the spring, F .. represents the strength of the dia
phragm, and K 1 is the initial diaphragm stiffness. When the diaphragm is subjected to cyclic loading, the hys
teresis rules defined in Fig. 4.8(b) are used to control the response. Based on the observed response of the
ABK diaphragms, the unloading stiffness, K2, was assumed to be equal to the initial diaphragm stiffness, Kit
and the force level used to define slip at low applied loads, F I, was tak.en to be ten percent of the strength of
the diaphragm, F... Values of the critical parameters, KI, Kl. F., and F j, for an arbitrary plywood diaphragm
are calculated from the experimental data usin~ the scaling rules listed below (4]:
L'DK j = LD,K;
F- = D F~, D"
(4.2)
(4.3)
L' :::::
D' :::::
K' -I
Ki :::::
F~ :::::
F' :::::1
where L is the length and D is the width of the diaphragm section under consideration, and the following pa
ran:eters were taken from the ABK test results [1):
length of diaphragm section in test =20 ft
width of diaphragm section in test =20 ft
observed initial stiffness of diaphragm in tcst =324 kiplft
observed reloading stiffness of diaphragm in test =324 kip/ft
observed suength of diaphragm in test =32 kip
observed strength at which diaphragm stiffness increases during cycling = 3.2 kip
During the NSF-5ponsored TCCMAR program, the ABK tes1S [1] were re-evaluated and the diapbIagm
hysteresis model was revised to include strength degradation at large displacements and variation of the un-
23

loading stiffness with the level ofdeformation (9,36,29). The force-<leflection envelope and hysteresis rules
for the revised model are shown in Fig. 4.9. The unloading stiffness, K.., was defined as:
(4.4)
where e,. represents the yield deformation and is defined as 1/3 FM/Kl, e",,,,, is the maximum deformation of
the diaphr..lgm during previous loading cycles, and y is assumed to be 0.2 for wood diaphragms. Viscous
damping was ignored in the revised diaphragm model (Fig. 4.6), the hysteretic damping was considered to
be sufficient Calculated and measured displacement response of diaphragm N are compared in Fig. 4.10
during one of the later eanhquake simulations {9].
ltani and Falk (39) and Dolan (26) developed special-purpose finite-element codes to analyze the re
sponse of plywood diaphragms and panels. The researchers used similar modelling techniques: framing
members were represented using linear beam elem~nts, the plywood sheathin~was modelled with linear
plane-stress or shell elements, and nonlinear spring elements were used to model the nailed connections be
tween the franing and sheathing. Special gap elements were used in both investigations to allow adjacent
sheets of plywood to separate, but not overlap. Dolan [26] u,<:ed similar bi-linear elements to represent the
connections between framing members, while Itani and Falk (39) used hinged connections to attach all fram
ing members.
The general nature of the calculated response i::l both investigations was governed by the choice ofnonlin
ear nail element. Data from connection rests (Fig. 4.1) were used to develop envelope curves for the nailed
connections (Fig. 4.11). Approximately 100 connections were tested in each investigation. Itani and Falk
[391 chose a power curve 10 represent the data,
(4.5)
while Dolan [26} used a three-parameter model,
(4.6)
where FcOtl is the force resisted by the connection, LI is the displacement of tbe connection. and al. az. po.
Ko, and K2 are constants whose values were determined from the experimental data using a curve fitting tech
nique.
Both finite~lement models were used successfully by the researchers to reproduce their experimental
fe.'lults (Fig. 4.12).
24

4.2 Cyclic Response of Tilt-Up Wall Panels
Agbabian Associates conducted a series of dynamic tests on tilt-up wall panels in the early 1980's
[6,8, 7,28). The experimental selUp for tbese tests is shown in Fig. 4.13. Three wall panels were tested. Key
parameters of the experimental program are summarized in Table 4.3. Two load ails, 1 displacement trans
ducer, and 9 velocity transducers were used to measure the response of the panels. Displacements and accel
erations along the height of the panel were later calculated from the velocity data.
These experiments were closely linked to the analytical modeled described in Section 4.3. Researchers
calculated the transverse response ofa representative tilt-up building at the top of the longitudinal wall panels
using the 1940 El Centro and 1971 Ca.;taic (San Femando) earthquake records. This calculated response was
then used as the input motion at the top of the wall panel, and the ground motion was used to drive the base
of the panel (Fig. 4.13). Response was calculated for tilt-up b:tildings with rigid and flexible diaphragms.
Each wall panel was subjected to a series of 9 or 10 earthquake simulations. The effective peak ground
acceleration was increased from 0.2g to O.4g in the later tests. By the end of the testing sequence, all panels
had experienced inelastic response. The El Centro ground motion. combined with a rigid diaphragm, proved
to be the most severe lest of the panels. The maximum acceleration and displacement response of the panels,
inferred from the measured velocity data, is shown in Fig. 4.14. The amplitude ofthe displacements increased
as the panels were subjected to more loading cycles and sustained structural damage (Fig. 4.15).
The distributions of accelerations and displacements closely resembled the first mode shape of a panel
that is pinned at both ends (Fig. 4.14). The researchers, therefore, concluded that the response of the panel
at mid-height :;hould govern the design, and that using fully cracked sections for panel design was a conserva
tive assumption {6, 8, 7]. Distributions of moments were also cah;ulated along the panel height (Fig. 4.16).
Although the distribution of moments did not correspond to the expected first mode shape. the researchers
concluded that design procedures for walls were appropriate because the magnitude of the calculated mo
men~ was less than those calculated using the ACI-SEASC recommendations for slender walls (81).
4.3 Analytical Models of Tilt-Up Systems
In the early 1980's, Adham (4) developed an ailalytical model for tilt-up construction that was based on
an earlier representation of unreinforced masonry buildings (11). Considering tbe representative tiit-up
building shown in Fig. 4.17, the following assumptions were made:
Eanhquak.e motion in the transverse direction of the building was considered to be critical.
Only half of the building was analyzed due to symmetry (Fig. 4.17(c)).
• The roof diaphragm was modelled as a deep shear beam using four inelastic springs (Fig.
4. 17(d). Hysteresis rules for the inelastic springs are defined in Fig. 4.8.
25

The transverse wall panels were assumed to be rigid. Thtrefore, ground motion was assumed
to be transmitted 10 the roof without amplification at the end of the building (Fig. 4.17(d».
The longitudinal wall panels were assumed to deform primarily in out~f-plane bending. Linear
beam elements were used to represent these panels (Fig. 4.17(d».
The response of the two longitudinal walls was assumed to be the :.ame. Therefore, a single set
of beam elements could be used to model the longitudinal walls (Fig. 4.17(e».
A total of23 nodes, 4 inelastic springs, and 18 linear beam elements were used to model the 300' by 150'
warehouse shown in Fig. 4.17(a) [6]. The model did not include any type of connection between adjacent
longitudinal wall panels. A viscous damping factor of 5% was used for the beam elements, and two damping
factors (0.07% and 10%) were used for the nonlinear springs. The model was subjected to a scaled version
of the N69W component of the motion recorded at Castaic dwing the 1971 San Fernando earthquake.
Calculated acceleration response at the top and mid-height ofthe center lo:.!'.itudinal wall panel is shown
in Fig. 4.18 and 4.19 for the lightly-damped and moderately...<J.amped models, respectively. In both cases,
the amplitude ofthe response is greater at mid-heightof the panel than at the top. The amplitude of the accel
erations at the roof exceeded those at the ground by a factor of 1.4 for the moderately-damped model and 2.6
for the Iightly-damped model. This result implies that the connection forces between the wall panels and the
roof exceed those between the wall panels and the foundation. The calculated acceleration response of the
center of the roof was used as the driving function at the top of the panel for the experimental tests described
in Section 4.2 (6.8, 7,28}.
Distributions of the calculated accelerations and moments along the height ofthe center longitudinal wall
panel are shown in Fig. 4.20. Unlike tbe experimental dat:\, tbe distribution ofcalculated moments resembled
the first mode shape of a pinned-pinned beam.
In the late 1980's, researchers at Dames and Moore used asimilar model to represent the seismic response
of till-up buildin~ (53,54]. The idealized building and analytical models for linear and nonlinear analyses
are shown in Fig. 4.21. The transverse walls were assumed to be rigid and the longitudinal walls were mod
elled using beam elements. The diaphragm was assumed to defonn in shear. Initially, linear elements were
used to model the diaphragm and longitudinal wall panels. Bi-Iinear models were later adopted to evaluate
the influence of member nonlineariay on structural response.
A 200' by 200' buildingwassubjected to the S69Ecomponentofthe 1952Taft ground motion. The initial
stiffness of the diaphragm was varied su:h that the natural period of the diaphragm ranged form 0.25 to 2.0
sec. Viscous damping factors of 5% and 10% were used. The calculated anchoiOlge folCes between the dia
phragm and longitudinal walls exceeded 50% of the weight of the wall panels for the majority of the condi-
26
tions considered (Fig. 4.22). The magnihlde of the forces was not reduced significantly in the nonlinear analy
ses. Because panel-to-roofconnections typically have limited ductility, the researchers concluded that linear
analyses were appropriate for tilt-up construction [53,54].
The distribution of shear forces in the diaphragm is shown in Fig. 4.23. The results indicate that shear
forces do not decrease linearly with distance from the end walls. Proposed shear distributions for design are
also indicated in Fig. 4.23.
Following the 1987 Whittier Narrows earthquake, researchers at Agbabian Associates revised their ana
lytical model to reflect the observed damage in tilt-up buildings and to take advantage of the improved model
ling capabilities developed as part of the TCCMAR research program [29]. The modelling of three actual
buildings is described in Ref. 9. In all three cases, the nature of the analytical model is considerably different
from the earlier analyses [4,6]. For earthquake motion in the transverse direction, the following changes were
made:
The longihldinal walls are not included in the analyses, because their contribution to the stiffness
of the building was considered to be negligible.
• The transverse wall panels were modelled using linear beam elements.
Nonlinear springs were used to represent the soil supporting the transverse wall panels. Panel
uplift could be evaluated with these elements.
A warehouse in Hollister, California (discussed in Chapter 5 of this report) was analyzed to demonstrate
the performance of the revised nonlinear model for diaphragms (Fig. 4.9). The analytical model of the 300'
by 100' warehouse is shown in Fig. 4.24 for earthquake motion in the transverse direction. The concrete wall
panels were assumed to be uncracked in the analysis. The stiffness of the plywood diaphragm was inferred
from the results of the ABK tests [1] using the scaling procedure defmed in Eq. 4.2 and 4.3. The diaphragm
stiffness was subsequendy increased by a factor of 3 to account for the roofmg material and insulation [9].
The response of this building during the 1986 Morgan Hill eanbquake was recorded as part of the Califor
nia Strong Motion Instrumentation Program [38]. Comparisons of the calculated and measured displacement
at the center of the diaphragm., relative to the top of the transverse walls, are shown in Fig. 4.25. The general
nature of the measured response is well-represented by the analytical model.
A 165' by 544' warehouse in Downey, California and a 294' by 452' building in Whittier, California (Fig.
4.26) were analyzed as part of an investigation of tilt-up performance during the 1987 Whittier Narrow~
earthquake [9]. Both buildings were located less than 10 miles from the epicenter. The Downey building
sustained minor structural damage during the earthquake, while no damage was observed in the Whittier
building (9).
27

Analytical models of the Downey and Whittier buildings for ground motion in the transverse direction
are shown in Fig. 4.27 and 4.28, respectively. The models included a more-detailed representation of the
transverse walls than was used to analyze the Holiister building and nonlinear springs were included beneath
the transverse walls in the Downey building to model the soil. The response of the longitudinal walls was
not modelled explicitly, however, the response of the longitudinal wall panels was evaluated by subjecting
an isolated panel to the calculated diaphragm accelerations and the input ground motion.
Although the response of these buildings was not recorded during the Whittier t'.anhquake, the ground
motion was recorded at six sites within 15 miles of the epicenter, and both buildings were inspected thorough
ly after the event. Therefore, the performance of the analytical model was evaluated by comparing the extent
of structural damage predicted using the analytiral model and damage observed following the earthquake.
'The results of the analyses of the Downey buildir.g agreed with the observed damage. For transverse
ground motion, panel uplift was calculated to occur in the west and interior walls. When the building was
subjected to longitudinal ground motion, the calculated forces between the diaphragm and the longitudinal
wall panels exceeded the strength of the connections. Evaluation of the longitudinal wall panels subjected
to transverse ground motion indicated that the dynamic moments were less than the cracking load for the pan
els. The calculated damage in the panel-to-found.ltion and panel-to-roofconnections was observed follow
ing the earthquake, and cracking of the wall panels wa.'" not observed.
The correlation between calculated and observed damage in the Whittier building was not as good. The
analyses indicated damage in the panel-Io-roof connections, distress in the diaphragm along the south wall
of the building, and extensive cracking of the longitudinal wall panels, when the building was subjected to
transve!'Se ground motion. None of this damage was obser".:d in the structure. The researchers believed that
the skewed wall panels along the south end of the building may have led to problems modelling the dia
phragm, and that the ground motion measured approximately 1.2 miles from the building was not representa
tive of the motion at the ~ite.
4.4 Summary
As indicated in this chapter, the seismic response tilt-up construction has been studied extensively in the
past 15 years. Analytical models for calculating the seismic response of plywood diaphragms and tilt-up
buildings have been summarized. However, little guidance is available for the engineer interested in perform
ing independent calculations. The response of tilt-ilp buildings is closely linked to the nonlinear characteris
tics of the diaphragms. AlI the researchers scaled experimental data to obtain the parameters used in their
analyses. The link between the design l'.quations discussed in Chapter 3 and tbe analytical models is missing.
28

Therefore. the influence of variations in the diaphragm. such as the type or spacing of the fasteners or the
thickness of the plywood. on the structural performance can not be evaluated.
The seismic response of tilt-u:) consb'Uction is also related to the performance of the structural connec
tions Detween the roof and wall panels. adjacent wall panels. and wall panels a.9)d the founMtion. With the
exception of the study by Adham et al. [9] where the panel-to-foundation connections were modelled. con
nections are not considered in the analytical models discussed. Although most damage observed after an
earthquake has been attributed to failure of the connections, the current analytical models can not be used to
evaluatt Lie required strength and ductility of these critical elements.
29

5. MEASURED STRONG-MOTION RESPONSE OF TILT-UP BUILDINGS
Acceleration response histories have been recorded in tilt-up buildings during several recent eanhquakes
as pan ofthe California Str.>ng Motion Instrumentation Program (37,38,59,60,61.66,67). The physical char
acteristics of three buildings for which data are available are summarized in Table 5.1. Two of the buildings,
the Hollister and Redlands warehouses, represent traditional tilt-up construction. The one-story structures
are rectangular in plan, have relatively few openings in the tilt-up panels, and are u.~ primarily for storage.
The Milpitas industrial building, on the other hand, represents the recent trend of using tilt-up wall panels
in multi-story commercial buildings. The first story in this building is used as a warehouse and the secon,j
for offices. Every wall panel has openings for windows or doors.
The seismic response of each of the structures will be summarized in the following sections. Generaliza
tions about the dynamic behavior of tilt-up buildings will also bP. presented.
5.1 Hollister Warehouse
A view of the nonh-east comer of the Hollister warehouse is shown in Fig. 5.1 and the floor plan is shown
in Fig. 5.2. Six-in. thick tilt-up panels are used throughout the building, with the exception of four 7-in
panels atlhe nonh and south ends of the longitudinal walls. Cast-in-place pilasters are used to connect adja .
cent wall panels. Cambered, glulam beams, ranging in depth from 221f2 in. to 281f2 in. with a width of 5 1/3
in., run in both the longitudinal and transverse directions of the building (Fig. 5.3). The beams ale supponej
by a single line of ~in. standard pipe columns. The roof is formed from a grid of 4xl4 and 4xlO purlins 11
8 ft on center with 2x4 stiffeners at 2 ft on cenler, overlain by V2-in. structural plywood. Blocking was p'o
vided throughout the diaphragm. The plywood is covered with 2-in. styrofoam insulation, I-in. fesco boud,
and roofing material.
Typical reinforcement in the waH panels consists of a single layer of #4 bars spaced at 12 in. on center
in each direction (Fig. 5.4). Two #9 bars form the chord in the longitudinal walls and a single 115 bar i. used
in the transverse walls. Chord reinforcement from adjacent panels was overlapped and welded.
The building was designed with nine openings in the tilt-up walls: four overhe.td doors for truck access
and five doors for personnel (Fig. 5.5). Two #5 bars were typically placed in the wall panels next to the open
ings.
Records from thirteen strong-motion instruments were obtained during the 1984 Morgan Hill. 1986 Hol
lister, and 1989 Loma Prieta earthquakes. Five instruments rec,lrded the ground motion, four monitored
transverse motion al the roof, three recorded longitudinal motion dt the roof, and one instrument monitored
the out~f-plane response of a longitudinal ~ all panel at midheight. Instrument locations are indicated in
Fig. 5.6 and summarized in Table 5.2. Horizontal ground acceleration histories recorded at the base of the
warehouse are sbown in Fig. 5.7 for the three earthquakes. Corresponding linear response spectra are pres
ented in Fig. 5.8.
Acceleration histories are shown in Fig. 5.9, 5.10, and 5.11 for the Morgan Hill, Hollister, and Loma Prie
ta eanhquakes, respectively. The following observations were made from the acceleration response:
30

The amplitudes of the transverse accelerations at the center of the roof (channel 4) and the top
of the longitudinal wall (channel 5) were approximately 3 times greater than the corresponding
ground accelerations (channel 7). The out-of-plane mOlion at midheight of the center longitudi
nal wall panel (channel 6) exceeded the ground accelerations by a factor of approximately 2.5.
The longitudinal accelerations at the center of th~ roof (channel 11) were observed to be ampli
fied by a factor of 1.5 to 2 relative to the longitudinal ground acceleration (channel 13).
In-plane accelerations measured at the top of the walls (channels 2 and 3 for transverse motion
and channels 10 and 12 for longitudinal motion) were essentially the same as the accelerations
recorded at the base of the walls (chall1lel 7 for transverse motion and channel 13 for longitudinal
motion). No appreciable amplification of the in-plane ground motion was observed at the roof.
Nonnalized Fourier amplitude spectra of the acceleration response histories are shown in Fig. 5.12, 5.13,
and 5.14. A summary of the predominant frequency for eacb. channel is presented in Table 5.2.
Similarly to the acceleration histories, the Fourier amplitude spectra indicate that the frequency
content of the in-plane wall response is essentially the same as the corresponding ground motion.
Out~f-plane response at the center of the walls and response at the center of the diaphragm was
similar and may be used to identify the fundamental natural frequency of the structure. In the
transverse direction, the natural frequency was approximately the same during the Morgan Hill
and Hollister earthquakes, ranging from 1.6 to 1.7 Hz. The natural frequency decreased to 1.10
Hz during the Loma Prieta earthquake. The decrease in structural stiffness observed during the
Loma Prieta earthquake is consistent with the increased amplitude of the response and observed
damage following the earthquake [67].
The Fourier amplitude spectra from out~f-plane motion at midheighl of the longitudinal wall
panels (channel 6) indicate amplification of response between 3 and 5 Hz. However, the out-of
plane response of tbe panels is dominated by the transverse behavior of the building.
Longitudinal structural frequencies are not easily identified from ~he Fourier amplitude spectra.
The relative frequency content was essentially the same as the ground motion for frequencies
less than 2 Hz. Maximum amplification at the center of the roof occurred between 6 and 7 Hz.
The digitic..ed data provided by the California Depanment of Conservation included displacement histo
ries which were obtained by integrating the corrected acceleration response. Displacement response at the
base of the structure and the center of the roof is shown iu Fig. 5.15. The longitudinal displacement of the
roof was essentially the same as the north-south ground displacement. Amplification of th<;. transverse dis
placements at the ct:nter of the roof may be observed.
The displacement of the structure relative to the ground may be interpreted as an indication of damage
during an earthquake. However, due to the nature of the numerical integration process, the magnitude of the
relative displacement response must be considered to be approximate. Differences between the integrated
structural displacement records and the integratedground displacement are shown in Fig. 5.16, 5.17, and 5.18
as the "unfiltered" relative displacement records. It was observed that the predominant frequency of the
31

ground motion tended to dominate the calculated relative displacement response, especially for the transverse
response recorded at lhe top of the trano; verse end walls and the longitudinal response. The relative displace
ment records were filtered in the fre-:uency domain, in an attempt to remove the noise attributable to the
ground motion. Details of the filtering procedure are described in Appendix B. The filtered relative displace
ment records for the Hollister warehouse are also shown in Fig. 5.16,5.17, and 5.18. Calculated maximum
relative displacements are summarized in Table 5.3 for the unfiltered and fPtered records. The following
trends may be observed:
• The relative displacement records in the transverse direction at the center of the building (chan
nels 4, 5, and 6) were not significantly affected by the filtering process. Maximum relative dis
placement variations were typically within :t 15% for the unfiltered and fLItered records, which
is consistent with the error expected for numerical integration of acceleration records (68). The
primary difference between the unfiltered and filtered records, was that the fdtered relative dis
placement records tended to oscillate about zero displacement, while the unfiltered records oscil
lated about the ground displacements.
The character of the relative displacement records in the transverse direction at the end of the
building (channels 2 and 3) were dramatically changed by the mtering process. In many cases,
the maximum relative displacement from the filtered records was less than one-halfof the maxi
mum relative displacement from the unfiltered records. Due to the significant change in the am
plitude and frequency content of the relative displacement records at the top of the transverse
walls, the relative displacement records for channels 2 and 3 were considered to be unreliable.
Longitudinal relative displacement records (channels 10,11, and 12) were also dominated by the
ground displacements. The amplitude ofthe longitudinal relative displacements was larger at the
cenler of the roof than along the longitudinal walls. However, the relative displacement records
for channels 10, 11, and 12 were considered to be unreliable.
The tran.;verse relative displacemenlS of the roof sustained by the Hollisler warehouse during
the Lorna Prieta earthquake were an order of magnitude larger than the relative displacements
of the roof during the Morgan Hill and Hollister events. The maximum relative roof displace
ment in the transverse direction during the Lorna Prieta earthquake was on the order of 1% of
the building beighl
The out~f-planedisplacements at the top of the lon~tudinal wall panel were consistently larger
than the response at midheight of the panel.
5.2 Redlands Warehouse
The east elevation of the Redlands warehouse is shown in Fig. 5.19 aDd the floor plan is shown in Fig.
5.20. The building is divided nearly in half by a non-bearing stud panition wall. Panels soutb of tbe rue wall
are 22-ftwide and panels north ofthe fire wall are 20-ft wide. Panelsalong the transverse sides of the building
are 22Y:z-ft wide. AU panels are 7-in. thick. Pilasters are used to connect adjacent panels.
32

Cambered glul~m beams span between the longitudinal walls (Fig. 5.21). The Yz-in. plywood sheathing
is supported by 4x14 purlins at 8-ft on center and 2x4 rafters at 2-ft on center. All touropenings in the perime
ler walls (two overhead doors and two personnel doors) were located in the east, longitudinal wall (Fig. 5.22).
Structural response during the 1986 Palm Springs, 1992 Landers. and 1992 Big Bear earthquakes was
re-:orded at 12 locations. Three instruments recorded ground motion, five r...corded transverse response at the
roof, three recorded longitudinal response at the roof, and one recorded the out~f-planeresponse of a longi
tudinal wall panel at midheight. hlStroment locations are indicated in Fig. 5.20 and summarized in Table 5.4.
Horizontal ground acceleration histories recorded at the base of the warehouse are shown in Fig. 5.24 for the
Palm Springs earthquake. Corresponding linear response spectra are presented in Fig. 5.25. Digitized data
are not yet available from the Landers and Big Bear earthquakes.
Acceleration hUories are shown in Fig. 5.26,5.27, and 5.28 for the Palm Springs, Landers, and Big Bear
earthquakes, respectively. Observatio.lS from the acceleration response are summarized below:
The maxim urn transverse acceleration response was measured at the quarter-point of the longi
tudinal walls (channel 5) durir.g the Palm Springs and Landers earthquakes, indicating that the
non-bearing fire wall and overhead door openings in the longitudinal wall influenced the dynam
ic response ofthe structure. During the Big Bear earthquake, maximum transverse accelerations
were recorded at the center of the longitudinal wall (channel 4). This change in beh.svior indicates
that the stiffness of the fire wall decreased during the Big Bear event, however, no information
on observed damage is available.
The amplitude of the transverse accelerations 2t the roof (channels 3 and 5) were 3 to 5 times the
amplitude of the transverse ground acceleration (channel 12). The out~f-planeaccelerations
at midheight of the center longitudinal wall panel (channel 2) were approximately 2.5 times the
magnitude of the transverse ground accelerations.
The magnitude of longitudinal accelerations at the center of the transverse walls at the roof level
(channel 9) were amplified by a factor of approximately 3 relative to the longitudinal ground ac
celerations (channel 11).
Tne ill-plane acceleration response at the top of the longitudinal (channels 8 and 10) and trans
verse (channels 6 and 7) walls was approximately the same as the corresponding ground accelera
tions (channel 11 in the longitudinal direction and channel 12 in the transverse direction).
Nonnalized Fourier amplitude spectra for the Palm Springs earthquake acceleration records are shown
in Fig. 5.29.
The fundamental transverse natural frequency of the warehouse was observed to be 2.6 Hz. The
fundamental natural frequency in the longitudinal direction was 3.2 Hz.
• The Fourier amplitude spectra for in-plane wall response werc essentially the same as those for
the corresponding ground acceleration records.
33

Integrated displacement response at the base of the structure and the center of the roof is shown in Fig.
5.30. The longitudinal displacement of the roof was essentially the same as the nonh-south ground displace
ment. The transverse response of the roof may be observed in the east-west absolute displacement record.
Unfiltered and filtered relative displacements for the Redlands warehouse are shown in Fig. 5.31. Calcu
lated maximum relative displacements are summarized in Table 5.5 for the uofl1tered and filtered records.
The following trends may be observed:
• The relative displacement records in the transverse direction at the center of the building (chan
nels 2, 3, 4, and 5) were not significantly affected by the filtering process. Roof-level relative
disp:acements.lt tbe quaner-point of the longitudinal wall (channel 5) exceeded thale at the cen
ter of the longitudinal wall (channel 3), indicating that the fire wall influenced structural re
sponse.
The character of the relative displacement records in the transverse direction at the end of the
building (channels 6 and 7) were dramatically changed by the filtering process. The relative dis
placement records for channels 6 and 7 were considered to be ullIeliable.
Longiturlinal relative displacement records recorded on the top of the longitudinal walls (chan
nels 8 and 10) were also dominated by the ground displar.ements.lne relative displacement re
cords for channels 8 anci 10 were considered to be unreliable. longiTUdinal relative displace
ments recorded at the top of tbe south transverse wall (cbaooe: 9) were not significantly
influenced by filtering. The amplitude of the longitudinal relative displacements measured by
channel 9 were approximatdy one-fifth of the transverse relative displacements recorded by
channel 5.
The maximum relative roof displacement sustained by tbe Redlands warehouse during the Palm
Springs eanhquake was less than 0.1% of the building height.
The out-of-plane displacements at the top of the longitudinal wall pane Iwere consistently larger
than the response at midheigbt of the panel.
5.3 MilpitaS Industrial Building
The north-west comer of the twcrstory Milpitas industrial building is shown in Fig. 5.32 and the floor
plans are sbown in Fig. 5.33. The tilt-up panels are typically 24-ft wide with window openings at both the
first and second story levels (Fig. 5.34). Panel thickness varies between 16 in. along the panel edges to 8 in.
above and below the windows. Chord reinforcement is located at the second floor and roof levels and is
welded between adjacent panels.
Eighteen, structural steel tube columns are used to carry tbe vertical floor and roof loads. The columns
are arranged in a 24x3()...ft grid. Deep, open web steel girders span in the longitudinal direction of the building
at the second floor level. Open web steel joists span between the girders in the transvCISC direction and suppan
a metal deck and a 2Vz-in. concrete slab. Puddle welds were used to connect the metal deck to the joists and
girders. The pitched roof is supported by glulam beams moning in the traosverse direction. The roof dia
phragm consists of IMn. plywood sheathing with 2x4 joislS and 6xl6 purlins.
34

Thirteen instruments recorded the response of the building dunng the 1988 Alum Rock and 1989 Loma
Prieta earthquakes. Instrument locations are shown in Fig. 5.35 and summarized in Table 5.6. Five instru
ments recordc:d the ground motion. the transverse building response was monitored by three instruments at
the roof and three at the second floor, and the longitudinal building response was recorded by one instrument
at the roof and one at the second floor. Horizontal ground acceleration histories recorded at the base of the
building are shown in Fig. 5.36 (or the two earthquakes. Corresponding linear response spectra are presented
in Fig. 5.37.
Measured acceleration records are shown in Fig. 5.38 and 5.39 for the Alum Rock and Loma Prieta eanh
quakes. respectively. Observations are noted below:
The maximum transverse accelerations recorded at the centerof the longitudinal walls at the roof
level (channel 4) were approximately 3 times greater than the maximum transverse ground accel
erations (channel 9). Ma>.:mum transverse accf'lerations recorded at the second floor level (chan
nel 7) were approximately 25% greater than the transverse ground accelerations.
The in-plane response of the transvetse walls measured at both the roof and second floor levels
(channels 3, 5,6, and 8) was essentially the same as the transvetse ground acceleration (chan
nel1).
The magnitude ofthe longitudinal acceleration response, measured at the center of the transverse
walls(channel 11 at the roof and channel 12 at the second floor), exceeded the transverse accel
eration response at both the roof (channel 4) and second floor level (channel 1) during both eanh
quakes. Amplification factors. relative to the base, exceeded 4 for longitudinal acceleration re
sponse at the roof and were approximately 1.6 at the second floor level.
The corresponding Fourier amplitude spectra are shown in Fig. 5.40 and 5.41. The predominant natural
frequencies are between 3.5 and 5 Hz in tbe transverse direction and between 4.5 and 5.5 Hz in the longitudi
nal direction. The frequency signature is less pronounced in the data from the 1988 Alum Rock earthquake.
Integrated displacement histories are shown in Fig. 5.42. The amplitude o( the ground displacement is
an order of magnitude larger during the Loma Prieta earthquake than during the Alum Rock eanhquake. As
a result of the large ground displacements during the Lorna Prieta earthquake, the relative displacements o(
the structure are not significant. Relative displacements at the roof may be observed in both the longitudinal
and transverse directions during the Alum Rock earthquake however.
Unfiltered and fdtered relative displacements for the Milpitas industrial building are shown in Fig. 5.43
and 5.44. Calculated maximum relative displacements are summarized in Table 5.7 for the unfiltered and
filtered records. The following trends may be observed:
• The signal-to-noise ratios for the relative displacements in the Milpitas industtial building were
smaller than tbose observed for the Hollister and Redlands warehouses. Therefore, the reliability
of all the relative displacement data must be questioned.
• The relative displacement records from all channels during the Loma Prieta eartbquake were sig
nificantly affected by the filtering process.
35

Only two channels of relative displacement data during the Alum Rock eanhquake appear to be
ii:sensitive to filtering: channels 4 and II, which represent the transverse and longitudinal re
sponse at the center of the roof. The maximum relative displacement of the roof was less than
0.05% of the height of the building.
5.4 Summary
The measured response of three tilt-up buildings during seven recent earthquak.es in California bas been
presented. Although the structural systems used in the three buildings differ, the following generalizations
about the seismic response of tilt-up construction may be made:
• Transverse accelerations were observed to be amplified by a factor ofapproximately 3 between
the base and the center of the roof. The measured QUHlf-plane response at midheigbt of tbe lon
gitudinal wall panels was amplified relative to the ground accelerations. However, maximum
amplification was observed at the roof level.
The magnitude of the amplification of the longitudinal accelerations appeared to be dependent
upon the aspect ratio and structural characteristics of the building. Amplification factors ranged
from 1.5 in the Hollister warehouse to 4 in the Milpitas industrial building.
In-plane acceleration response of the transverse walls at the roof level was essentially the same
as the corresponding ground motion. The magnitudes of the acceleration histories were not am
plified appreciably, and the frequency content of the signals was nearly identical.
Displacement of the roof relative to the ground was more pronounced in the transverse than t.he
longitudinal building response. Maximum out~f-plane displacements at the roof level were
approximately twice those measured at the midbeight of the panel.
Non-bearing panition walls and openings in wa:1 panels may influence the behavior of tilt-up
construction. Maximum transverse acceleratior. response was observed at the quaner-point of
the longitudinal walls in the Redlands warehous.:.
36

6. OBSERVED PERFORMANCE OF TILT-UP CONSTRUCTION
DURING EARTHQUAKES
Investigations of the performance of in.lividual tilt-up struc!'.Ires during the 1964 Alaska., the 1971 San
Fernando, the 1987 Whittier Narrows, and tt..: 1989 Loma Prieta earthquakes are summarized in this chapter.
Typical types of damage are listed in Table 6. l, along with an indication of the frequency. The observed be
havior of tilt-up construction during the four earthquakes is summarized in Sections 6.1 through 6.4. Section
6.5 contains some general observations.
6.1 The 1964 Alaska Earthquake
The 1964 Alaska earthquake damaged tilt-up structures at the Elmendorf Air Force Base and provided
the first evidence of the potential seismic vulnerability of this type ofconstruclion [32). The Elmendorf Ware
house suffered the worst structural damage in the aru: three oHive bays cC'llapsed. The plan view ofthe build
ing is shown in Fig. 6.1 and typical roof framing and concrete fire wall details are shown in "ig. 6.2. Adjacent
structures of different forms of construction sustained only minor damage, implying that the cause of the col
lapse was not the magnitude ofthe earthquake (Ml=8.3-K6) but rather the structural system used in the ware
house.
Following the earthquake, investigators identified the likely cause of failure to be pullout of the anchor
bolts from the tilt-up concrete walls. The anchor bolts connected the wall panels to the steel frame and ply
wood roof diaphragm. This failure mechanism could have been prevented by installing ties in the concrete
column to confme the anchor. Sritde failure of the steel reinforcement in concrete columns and of the welds
connecting the cross bracing in the fire walls to the steel roofframing members was also observed [32]. These
connections were unable to develop the full strength of the structural members, suggesting problems related
to insufficient connection ductility, as well as connection strength.
6.2 The 1971 San Fernando Earthquake
Major structural damage was observed in tilt-up warehouses located in the Sylmar Industrial Tract and
San Fernando Industrial Tract following the 1971 San Fernando earthquake. Studies ofeight tilt-up buildings
are reported in Ref. 41 and 55. Collapse of the roof or wall panels was observed in four of these structures.
Most of the failures were attributed to inadequate connection details between the plywood diaphragm,
the ledger beams, and the tilt-up panels (Fig. 3.20). Three modes of failure occurred at this interface:
plywood pulled through the nails;
nails pulled out of the ledger;
ledgers split in cross-grain bending I Fig. 6.3).
Once the panel-to-roof connection failed, the l,)()f framing system was susceptible to failure of the glulam
to-pilaster or pUrlin-~ledgerconnt.Ctions. Loss of these connections allowed the framing members to slip
off their seats, leading to cOUapse of the roof. The oUH>f-plane resistance of the tilt-up panels is essentially
zero once the adjacent roof element has fallen or the panel-l(H'OOf connection has failed. The wall panel is
then also susceptible to collapse.
37

Evaluation of the roof and wall collapses that occurred during the 1971 San Fernando earthquake indi
cates that most roofcollapses originated in areas where the purlins framed into the wall panels (Fig. 6.4). High
in-plane ~hear forces develop along the shorter side of the diaphragm and therefore the plywood-t~ledger
connections along the end walls are more susceptible to damage than connections along the longitudinal
walls. Also, beam seats provide more stability and redundancy to connections between glulam beams and
concrete pilasters than the hangers used to form the connections between purlins and ledgers. Mel the ply
wood~<r-ledger connections are lost, it is reasonable to assume that the next failure mechanism will occur
at the connection of purlins to other framing elements.
Significant damage also occurred in buildings that did not collapse. Cracking and spalling ofthe pilasters
or corbels was observed in three of the eight tilt-up buildings considered [41,55). Cracking and permanent
out~f-plane deformations were also observed in the wall panels. Damage to wall panels was attributed to
excessive flexural defonnation due to large in-plane roofdeformations [41]. Damage to corbels and pilasters
spalling was also attributed to displacement of the roof diaphragm.
As a result of the poor performance of the plywood-to-ledger connections during the 1971 San Fernando
earthquake (Fig. 3.20), provisions were aclded to Section 2312(j) of the Uniform Building Code to prohibit
the use of these connections in regions of high seismic risk [75]. Positive, direct connections between the roof
diaphragms and the supporting walls are currently required in Section 2310 of the UBC [77].
6.3 The 1987 Whittier Narrows Earthquake
The 1987 Whittier Narrows earthquake provided the first major test of the tilt-up design requirements
adopted following the San Fernando earthquake. The number of roof and wall panel collapses during the
Whinier Narrows earthquake was greatly reduced compared with those during the 1971 San Fernando earth
quake, and all occurred in structures built before 1971. However, the magnitude of the 1987 earthquake
(ML=5.9) was considered moderate, as compared with the 1971 earthquake (ML=6.4). Therefor:, the possi
bility that greater structural damage will occur during a stronger earthquake can not be dismissed for tilt-up
buildings designed using the post-I97S UBC provisions.
The most severe damage in more modem tilt-up structures during the 1987 earthquake occurred in build
ings that had wall panels with large openings. Observations of panels bowing out and cracking near the upper
comers of openings were common in buildings constructed after 1983. This type of damage has been attrib
uted to two sources [35]:
insufficient panel reinforcement, or incorrect placement of reinforcement within the panel;
openings had been cut into existing panels without providing additional reinforcement.
Adham et al. [IOJ suggest that panels with large open.ings should be propoRloned to resist flexural action as
if the panel were a frame: the vertical piers should be designed to resist their own inertial load plu.~ that of
the portion of the wall above the opening. Design of these piers should conform to provisions in Section
2625(f)9B of the UBC entitled "Wall Piers" [77].
38

When modifications are made to an existing building, many owners overlook the need to replace the
strength and stability lost when an opening is cut in a tilt-up panel (10,35]. Steel columns or "kickers" are
usually recommended to increase the lateral-load resistance of a panel with large openings (Fig. 6.5).
The tbe response of tilt-up buildings during the lYin earthquake also highlighted the importance of tying
the structure together and providing adequate collector elements to carry the force away from reentrant cor
ners (35). A number of failures of plywood in roof diapbI3gms could have been prevented if ties had been
provided to ensure that the purlins did not separale from the glulam beams (Fig. 3.26). Distress of roof ele
ments was reported near reentrant comers and skewed joints where framing members were often not able to
transmit chord forces into the diaphragm (Fig. 6.6).
Cases of roof distress and plywood failure directly above vertical elements such as stair wells ar.d interior
columns or walls were also reported. In many cases, collector elements werc not provided to transmit dia
phragm forces into the vertical members.
The Whittier Narrows earthquake also provided infonnation on the seismic perfonnance of a number of
common construction practices thai were developed during the 1970's and SO's. In contrast to buildings
constructed before 1971 when cast-in-place pilasters provided continuous connection between adjacent wall
panels, :he chord reinforcement at the elevation of the diaphragm is the often only panel-to-panel connection
in modern tilt-up construction. Additional panel-to-panel connections are provided only in the comers of
th,' building. Changes in the connection design were adopted to improve the durability of tilt-up construction
under temperature and shrinkage induced loads. Two tilt-up buildings with minimal panel-to-panel connec
tions were studied following the Whittier Narrows earthquake (10}. tittle or no structural damage was ob
served. However, the individual panels were considered to be more susceptible to damage due to out-of
plane bending than comparablestroctures with pilasters. The reduction in the number of panel-to-panel con
nections is also believed to lead to panel uplift [9] .
The structural implications of using steel ledgers and metal screws for the panel-to-roof connections
were investigated by studying the behavior of tbe Downey and Wbittier buildings (Fig. 4.26) [10]. Typical
panel-to-roofconnection details are shown in Fig. 6.7 [9]. The metal screws failed along the transverse walls
in the Downey building. Srructun! damage was expected to be considerably greater if the building bad been
subjected to the design-level earthquake [9]. Although replacing wooden ledgers with steel ledgers elimi
nates the cross-grain bending failure mechanism in the panel-to-roof connections shown in Fig. 6.3. it is not
sufficient to guaranlee acceptable connection perfonnance.
6.4 The 1989 Loma Prieta Earthquake
The satisfactory perfonnance of most engineered buildings during the 1989 Loma Prieta earthquake has
been attributed to the relatively sbort duration of the ground motion [69].
Although there were isolated cases of major damage to tilt-up concrele industrial buildings, collapses
were not as widespread as during the 1971 San Fernando earthquake. Several cases in which the contents of
the building influenced tbe structural performance were identified. A tomato--storage warehouse in Hollister
lost part ofa wall when stacks of cans inside the building fell against the wall panels and broke the connection
39

between the wall panels and pilasters [69].ln IIJl industrial park west ofWatsonville, another tilt-up structure
sustained moderate structural damage to s~veralpilasters and a wall panel separated from the roof diaphragm
wben a free-sranding steel--frame mezzanine struck the exterior walls [69].
6.5 Summary
The observed performance of tilt-up buildings during the 1964, 19'71, 1987, and 1989 earthquakes indi
cates that this fonn of construction is susceptible to structural damage (Table 6.1). Damage in buildings
constructed before the 1971 San Fernando earthquake may usually be attributed to:
• wood ledger members failing in cross-grain bending;
nails pulling through the edges of the plywood at the ledger or at interior panel edges;
• edge nails pulling out of wood ledgers or interior framing members;
brittle fracture of welded connections.
The damage statistics presented in Table 6.1 indicate that the seismic perfonnance of tilt-up buildings
constructed after the 1971 San Fernando earthquake improved significantly. However, the following suscep
tibilities were identified:
• cracking and permanent out-of-plane deformations in panels with large openings;
excessive displacement or flexibility of the diaphragms, particularly for those with very large
spans;
• improper connection or anchorage details between adjacent wall panels and between the wall
panels and the foundation.
40

7. CONCLUSIONS
Tilt-up construction is a proven cost-effective method oferecting low-rise buildings. However, the need
to develop methods to mitigate the seismic hazards continue!: to grow with the increasing use of tilt-up for
commercial and industrial buildings that contain a large number of workers and expensive equipment. Past
seismic performance indicates that initial savings during construction can be offset by the cost of repairing
structural damage and of downtime following an earthquake.
Tilt-up buildings constructed before 1973 are susceptible to failure of the connections between the wall
panels and the roof diaphragm which often leads to the collapse of the roof and wall panel~. The 1971 San
Fernando earthquake highlighted the risk of vulnl'rable connections, and building code provisions were soon
modified [75] to avoid many problems, such as cross-grain bending in wood ledger beams. However, design
procedures developed for traditional warehouse construction may not be appropriate for buildings with geo
metrically complex floor plans or a large number ofopenings in the panels. Damage to wall panels with open
ings and roofconnector elements during the 1987 Whittier earthquake indicates that modem tilt-up buildings
are also susceptible to seismic damage.
A review of current design procedures and detailed analytical models for tilt-up construction indicates
that buildings are often treated as a group of individual components, rather than a complete structural system.
The diaphragm and wall panels are considered independently and connections are typically not modelled in
the analyses. Although the seismic response is closely tied to connector perfonnance, analytical models are
not currently available to evaluate the influence of connection details on the structural response.
The measured response of three tilt-up buildings in California was used to identify trends in the seismic
behavior. The buildings represented different eras in tilt-up construction: the structures in Hollister and Re
dlands were one-story warehouses with plywood roof dlapnragms and cast-in-place pilasters, while the
structure in Milpitas was two-stories tall. included a metal-deck floor diaphragm and a wood roof. and had
window openings in every panel. However, the general nature of response was similar in all three buildings:
• Transverse at;celerationsmeasured at the center of the roof were approximately three times larger
than the corresponding ground accelerations.
• The amplitudes of the transverse accelerations and displacements at the center of the roof were
larger than the amplitudes of the response measured at mid-height of the center longitudinal wall
panel.
The in-plane accelerations measured at the top of the transverse walls were essentially the same
as those measured at the base of the walls.
In addition, data from the Redlands warehouse demonstrated that non-bearing partition walls and openings
in wall panels may influence the response of tilt-up systems.
These observations are not consistent wlth the typical design assumptions. For example, the measured
response indicated thal wall panels do not behave as columns pinned at both ends. The roof of the Hollister
warehouse sustained transverse displacements larger than 4 in. (1 % of the building height) relative to the base
41
during the 1989 Loma Prieta earthquake. The middle of the pllnel experienced a maximum transverse dis
placement of approximately 2.5 in. during the same event.
The differences between the expected and measurf"A! response indicate that the seismic response of tilt-up
CODstru<;tion is not completely understood. Additional work is required to develop analytical models that are
sensitive to the nature of the critical connections in the building and can be used to mitigate seismic hazards
in new and existing construction. With an improved understanding of system behavior, tilt-up construction
can be made as safe as it is economical.
42

REFERENCES
1. ABK, A Joint Venture. "Methodology for Mitigation of Seismic Hazards in Existing Unreinforced Ma·sonry Buildings:Diaphragm Testing." Agbabian/BameslKariotis. ABK-TR-03. (R.D. Ewing, A.W.Johnson, and J.e. Kariotis, Principal Investigators). EI Segundo, CA. December, 1981.
2. ABK, A Joint Venture. "Methodology for Mitigation of Seismic Hazards in Existing Unreinforced Ma·sonry Buildings: Interpretation of Diaphragm Testing." AgbabianIPameslKariotis. ABK-TR-oS. (R.D.Ewing, A W. Johnson, and J.e. Kariotis, Priocipal Investigators). EI Segundo, CA March 1982 (unpublished).
3. ACI Committee 551. "TIlt-Up Concrete Structures." ACI 551R-92. American Concrete Institute. De·troit, MI. 1997h
4. Adham, S.A. "Guidelines for Mitigation ofSeismic Hazards in TIlt-Up Wall Structures- Phase I." Agba·bian Associates. Contract No. PFR--8009736. El Segundo, CA. February 1981.
5. Adham, S.A. "The Slender Wall Test Program: Conclusions and Recommendations." Proceedings.Structural Engineers Association of California. Sacramento, CA 1982. pp. 423-447.
6. Adham, S.A "Response of Slender Precast Concrete WaDs to Out-of-Pl.ane Loading." Proceedings.Seminar on Precast Concrete Construction in Seismic Zones. Japan Society for the Promotion ofScience.Tokyo, Japan. 1986. pp. 311-324.
7. Adham, S.A. "Experimental Data Based Models for Seismic TIlt-Up Wall Design." AgbabianAssociates. Vol. I: Final Report. Report No. R-8515-<J165. EI Segundo, CA April 1987.
8. Adham, S.A. and Agbabian, M.S. "Seismic Design Guidelines for TIlt-U~Wall Buildings Based on Experimental and Analytical Models." Proceedings. Third U.S. National Conference on Earthquake Engineering. Earthquake Engineering Research Institute. Charleston, Se. August 1986. Vol. 3, pp.1767-1777.
9. Adham, SA.; Anderson R.W.; Avanessian V.; Kariotis le.; and EI Mostafa, A. "EvaluationofTilt-U~Wall Structural Systems Affected by the Whittier Narrows Eanhquake." Agbabian Associates. ReportNo. R~28-<J283. El Segundo, CA October 1989.
10. Adham, S.A.; Anderson, R.W.; and Kariotis, J.c. "Survey ofTIlt-U~WallStructural Systems Affectedby the Whinier Narrows Eanhquake of October 1, 1987." Agbabian Associates. Report No.R~2()-{jZ96. Pasedena, CA September 1990.
11. Adham, S.A and Ewing, R.D. "Interaction Between Unreinforced Masonry Structures and their RoofDiaphragms during Earthquakes." Proceedings. North American Masonry Conference. The MasonrySociety. University of Colorado. Boulder, CO. August 1978. Paper No. 57.
12. Agbabian, M.S., and Ewing, R.D. "Anchorage and Diaphragm Systems for Tilt-Up Wall Buildings."Proceedings. Third Seminar on Repair and Retrofit of Structures. Ann Arbor, MI. May 1982. pp. 1-28.
13. Aiken, R. "Monolithic Concrete Wall Buildings-Methods, Construction, and Cost." Concrf!telnterna·tional: Design and Constn4Ction. American Concrete Institute. April 1980. Vol. 2, No.4, pp. 2~30.
14. Amrhein, James E. Reinforced Masonry Engineering Handbook: Clay and Concrete Masonry. 4th Edi·tion. Masonry Institute of America. Los Angeles, CA. 1983.
IS. Arnold, C. "Seismic Performance of Low Rise Commercial Buildings." Proceedings. Seismic Performance ofLow-Rise Buildings: State-of-the-Art Research Needs. American Society of Civil Engineers.New York, NY. May 1980. pp. 132-145.
43

16. Athey, J.W., ed. Test Report on Slender Walls. American Concrete Institute-8EASC Task Committee 00
Slender Walls. los Angeles, CA. September, 1982.
17. Blume, J.A. "The Earthquak.e Resistance of Califomia School Buildillgs- Additional Analyses and Design Implications." Slate of California, Department of Public Works. Sacramento, CA 1962.
18. Blume, J.A.; Sharpe, R.L.; and Elsesser, E.A. "A Structural-Dynamic Investigation of Fifteen SchoolBuildings Subjected to Simulatel.1 Earthquake Motion." State ofCalifornia, Department of Public Works.Sacramento, CA. 1961.
19. Brooks, H. The Tilt-Up Design & Construction MQ1JWJ~ Second Edition. HBA Publications. NewponBeach, CA 1990.
20. Brown, D.H.; Adams, N.R.; and Hiner, D.L "Holding Power of Roofing Nails in 3/8 " and Yz" Plywood."Laboratory Report Number 87 Dougl:lS Fir Plywood Association. Tacoma, WA. February 1961.
21. Oough, D.P. "A Seismic Design Methodology for Medium-Rise Precast Concrete Buildings." Proceedings. U.S.-Japan Seminar on Precast Concrete Construction in Seismic Zones. Tok.yo, Japan. October1986. Vol. 1, pp. 101-126.
22. Connectors for Wood Construction: Prrx:Ulct and Instruction MfJ1Wa/. Simpson Strong-·TIe Company,Inc. Catalog C-91H-1. San Leandro, CA. January 1991.
23. Countryman, D. "Lateral Tests on Plywood Sheathed Diaphragms". Douglas Fir Plywood Association.Report No. 55. Tacoma, WA March 1952.
24. Courtois, P.O. "Architectural Esthetics of lilt-Up Panels." Concrete International: Design andConstructi:Jn. American Concrete Institute. June 1986. Vol. 8, No.6, pp. 16-20.
25. Dielunann, E.F. "Design Details for the Transfer of Forces in Wood Diaphragms to Venical ElemeolS."Proceedings. Workshop on Oesign of Horizontal Wood Diaphragms. Applied Technology Council.Berkeley, CA. 1980. pp. 199-252.
26. Dolan, lD. "The Dynamic Response of Timber Shear Walls." Ph.D. Thesis, submitted to the GraduateCollege, University of British Columbia. Vancouver, Canada. October 1989.
27. Ewing, R.D. "Seismic Performance of Low-Rise Concrete and Masonry Buildings." Proceedings. Seismic Performance of Low-Rise Buildings: State-of-the-Art Research Needs. American Society of CivilEngineers. New York, NY. May 1980. pp. 66-71.
28. Ewing, R.D. and Adham, S.A "Guidelines for Mitigation of Seismic Hazards in TIlt-Up Wall Structures- Phase 2." Agbabian Associates. Report No. R-8216-5771. El Segundo, CA. January 1985.
29. Ewing, R.D.; Kariotis, J.e.; and El-Mustapha, A.M. "LPMII: A Computer Program for the Nonlinear,Dynamic Analysis of Lumped Parameter Models." TCCMAR Report 2.3.1. Kariotis and Associates.South Pasadena, CA. July 1988.
30. Foley, R.P. "TIlt-Up Construction and the Designer-Contractor Team." Concrete International' Designand Construction. American Concrete Institute. June 1986. Vol. 8, No.6, pp. 51-53.
31. Forbes, M.A "Implementation and Performance of Structural Details - lilt-Up Concrete." StructuralEngineelS Association of Nonhero California. San Francisco, CA. 1991.
32. George, W.; Knowles, P.; Allender, lK..; Sizemore, J.F.; and Carson, D.E. "Structures on Military Insta)·lations." Tite GreatAlas/caEarthqruJ/u! of1964: Engineering. National Academy of Sciences, Washington, D.C., 1973. pp. 873-957.
44

33. Glulam Panelized Wood RoofSystems. The American Institute ofTImber Construction. Englewood, CO.1986.
34. Guidelines for the Design ofHorizontal Wood Diaphragms. Prepared for the Applied Technology Council by H.J. Bronnier Associates. Berkeley, CA. September 1981.
35. Hamburger, R.O.; McCormick. D.L.; and Hom, S. "The Whinier Narrows Earthquake of October 1, 1987- Performance of TIlt-Up Buildings." EarthqJuJJce Spectra. Eanhquake Engineering Research Institute.May 1988. Vol. 4, No.2, pp. 219-254.
36. Hart, G.C and K.ariotis, J.C, ed. "U.S.-Japan Coordinated Research Program." Proceedings. FourthNorth American Masonry Conference. University of California, Los Angeles, CA. Vol. 2, August 1987.pp. 38-1 to 47-17.
37. Huang, M.; Shakal, A; Cao, T; Fung, P.; Sherburne, R.; Sydnor, R.; Malhotra, P.; Cramer, C; Su, F.;Darragh, R.; and Wampole, J. "CSMIP Strong-Motion Records from the Big Bear, California Earthquakeof28 June 1992." Report No. OSMS 92-10. California Strong Motion Instrumentation Program, California Department of Conservation, Division of Mines and Geology, Office of Strong Motion Studies, August 1992.
38. Huang, M.J.; Shakal, A.F.; Parke, D.L.; Sherburne, R.W.; and Nun, R.V. "Processed Data from theStrong-Motion Records of the Morgan Hill Eanhquake of 24 April 1984- Pan II. Structural-ResponseRecords." Report No. OSMS 85--05. California Strong Motion Instrumentation Program, California Department of Conservation, Division of Mines and Geology, Office of Strong Motion Studies, December1985.
39. Itani, R.Y. and Falk, R.H. "Damage and Collapse Behavior of Low-Rise Wood-Framed Buildings: Diaphragms." Fmal Report to the National Science Foundation. Washington State University. Department ofCivil Engineering. Pullman, WA. 1986.
40. Janke, R. Private Communications. Engineers Northwest, Seattle, WA. April 1991.
41. Jenning<;, P.c. "Engineering Features of the San Fernando Earthquake of February 9, 1971." Californial.,~tilUte ofTechnology. Division ofEarthquake Engineering and Applied Science. EERL 71~2. Pasadena, CA. June 1971. pp. 230-258 and 297-298.
42. Jephcotl, D. K. and Dewdney, H.S. "Analysis Methods for Horizontal Wood Diaphragms." Proceedings.Workshop on Design of Horizontal Wood Diaphragms. Applied Technology Council. Berkeley, CA.1980. pp. 173-198.
43. Johnson, J.w. "Lateral Test 00 a 12-by 6O-Foot Plywood-Sheathed Roof Diaphragm." Oregon ForestProduclS Laboratory. Report No. T-11. School of Forestry. Oregon 51. College. Corvallis, OR. January1955.
44. Johnson, J.W. "Lateral Test on a 20- by 6O-Foot Roof Diaphragm With Stapled Plywood Sheathing."Oregon Forest Products Laboratory. ReportNo. T-13. School ofForestry. Oregon St. College. Corvallis,OR. December 1955.
45. Johnson, J.W. "Lateral Test of a 2o-by 6O-FootRoofSection Sheathed with Plywood Overlaid on Decking." Forest Research Laboratory. Report T-29, Paper 794. School of Forestry. Oregon State University.Corvallis, OR. November 1971.
46. Kelly, D.L. "Rigging the lilt-Up." Corw:rere InrerJltJtioMl: Design and Construction. American Concrete Institute. June 1986. Vol. 8, No.6, pp. 36--40.
47. Luttrell, L.D. Diaphragm Design Manua~ DDMOI. Steel Deck Institute. St. Louis, MO. 1981.
4S

48. Luttrell, L.D. Diaphragm Design MQ1Wa~ Second Edition. Steel Deck Institute. Canton, OH. 1991.
49. Ll·ttrell, L.D. and Huang, H.T. "Steel Deck. Diaphragm Studi~... Diaphragm Design MillWa~ DDM01.Steel Deck Institute. St. Louis, MO. 1981.
50. Malhotra, S.K. "State~f-the-AnReport:Analysis and Design of Wood Shear Walls and Diaphragms."Proceedings. International Conference on Engineering for Protection from Natural Disasters. AsianInstitute of Technology. Bangkok, Thailand. January 1980. pp. 287-298.
51. McBean. R.P. "Seismic Analysis of Rigid Diaphragms and Shear Walls." Seismic Design ofCommercialand Industrial Buildings, University of Missouri, Columbia, MO, 1987.
52. McLean, R.S. "Testing of Slender Walls." Proceedings. Structural Engineers Association of California.Sacramento, CA. 1982. pp. 409-422.
53. Mehrain, M. and Graf, WP. "Dynamic Analysis ofTIIt-Up Buildings."Proceedings. Fourth U.S. National Conference on Earthquake Engineering, Earthquake Engineering Research Institute. Palm Springs,CA. May 1990. Vol. 2, pp. 299-307.
54. Mehrain, M. and Silver, D. "Concrete Wall AI.chllrage Forces in Industrial Buildings with Flexible RoofDiaphragms." Proceedings. Ninth World Conference on Earthquake Earthquake. Tokyo-Kyoto, Japan.August 1988. Vol. 5, pp. 527-531.
55. NOANEarthquake Engineering Research Institute Earthquake Investigation Committee, Subcommitteeon Buildings. "Low-Rise Industrial and Commercial Buildings." San Fer1llJ1Jl1D, Califomia, EarthquoJceofFebruary 9, 1971. U.S. DepartmentofGJmmerce, Washington, D.C., 1973. Vol.l,PartA, pp.41-128.
56. Peterson. J. "Bibliography of Lumber and Wood Panel Diaphragms."JournalofStructural EngiMering.ASCE. Vol. 109, No. 12, December 1983, pp. 2838-2852.
57. Plywood Diaphragm Construction. American Plywood Association. Tacoma, WA. 1978. 13 p.
58. Polensek, A. "Damping Olpacity of Nailed Wood-Joist Floors." Wood SciellCe. Vol. 8, No.2, October1975, pp. 141-151.
59. "Processed Strong-Motion Data from the Milpitas :. <1ry Industrial Building for the Alum Rock Eam-quake of 12 June 1988," ReportNo. OSMS 91-13. L.tufornia Strong Motion Instrumentation Program,California Department of Conservation. Division of Mines and Geology, Office of Strong Motion Studies. 1991.
60. "Processed Strong-Motion Data from Ihe Lorna Prieta Earthquake of 17 October 1989 - Building Records." ReportNo. OSMS91-4J7. California Strong Motion Instnunentation Program, California Department of Conservation, Division of Mines and Geology, Office of Strong Motion Studies. 1991
61. "ProcessedStrong-Motion Data from the Palm Springs Earthquake of 8 July 1986- Building Records."ReportNo. OSMS 91-16. California Strong Motion Instrumentation Program, California Department ofConservation, Division of Mines and Geology, Office of Strong Motion Studies. 1991
62. Rea, D.; Boukamp, J.G.; and Cough, R.W. "Dynamic Properties of McKinley School Buildings". Uni·versity of California. EERC 68-4. Berkeley, CA November 1968.
63. Robb, J.D. "Seismic Performance of Low-Rise Buildings Experience with Los Angeles Building Code."Proceedings. Seismic Perfonnance of Low-Rise Buildinp: S1ate~f-lhe-ArtResearch Needs. American Society of Civil Engineers. New York. NY. May 1980. pp. 42-52.
64. RoofDecks. Verco Manufacturing Co. Catalog V-19D. Phoenix, AZ.
46

65. "Seismic Design for Buildings." U.S. Army TM 5-809-10. Departments ofthe AnDy, the Navy and theAir Force. April 1973.
66. Shakal, A; Huang, M.; Cao, T.; Sherburne, R; Sydnor, R.; Fung, P; Malhotra, P.; Cramer, c.; Su, E;Darragh, R.; and Wampole. J. "CSMlP Strong-Motion Records from the Landers, California Eanhquakeof 28 June 1992." Report No. OSMS 92-09. California Strong Motion Instrumentation Program, California Department of Conservation, Division of Mines and Geology, Office of Strong Motion Studies, August 1992.
67. Shakal, A.; Huang, M.; Reichle, M.; Ventura, C.; Cao, T.; Sherburne, R.; Savage, M.; Darragh, R.; andPeterson, C. "CSMIP Strong-Motion Records from the Santa Cruz Mountains (loma Prieta), CaliforniaEanhquake of 17 October 1989." Report No. OSMS 89-06. California Strong Motion InsttumentationProgram, California Depanment of Conservation, Division of Mines and Geology, Office of Strong Molion Studies, November 1989.
68. Shakal, A.F. and Ragsdale, J.T. "Acceleration, Velocity and Displacement Noise Analysis for the CSMIPAccelerogram DigitizatioD System." Proceedings, Eighth World Conference on Eanhquake Engineering, Eanhquake Engineering Research Institute, Vol. II, San Francisco, 1984, pp. 111-118.
69. Shepherd, Robin, ed. "Buildings, Lorna Prieta Earthquake Reconnaissance Repon." EarthquakeSpectra. Eanhquake Engineering Research Institute. May 1990. Vol. t (supplement), pp. 127-149.
70. Spears. R.E. "Tilt-Up Construction, Design Considerations - An Overview." Concrete Internatinnal:Design and Construction. American Concrete Institute. April l~. Vol. 2, No.4, pp. 33-38.
71. Slem, E.G. "Performance of Mechanical Fasteners in Wood Diaphragms." Proceedings. Workshop onDesign of Horizontal Wood Diaphragms. Applied Technology Council. Berkeley. CA 1980. pp.109-142.
72. Slillinger, J.R., and Countryman, D. "Lateral Tests on Full-Scale Plywood-Sheathcd RoofDiaphragms."Oregon Forest Products Laboratory. Report No. T -5. School of Forestry. Oregun St. College. Corvallis,OR. October 1953.
73. Tarlton, D.L "Diaphragm Action." Design in Cold Formed Steel. University of Waterloo - Solid Mechanics Division. University of Waterloo Press. Waterloo, Ontario. 1974. pp. 161-182.
74. TIsseU, l.R. and Elliott, J.R. "Plywood Diaphragms." American Plywood Association. Research Report138. Technical Services Division. Tacoma, WA 1990 (revised).
75. Uniform Building Code. International Conference of Building Officials. Whittier, CA. 1976.
76. Uniform Building Code. International Conference of Building Officials. Whittier, CA 1988.
77. Uniform Building Code. International Conference of Building Officials. Whittier, CA. 1990.
78. Varon, Joseph. "Some Practical lips in the Architectural Design of TIlt-Up." Concrete International:Design and Construction. American Concrete Institute. June 1986. Vol. 8, No.6, pp. 21-23.
79. Waddell, Joseph J. "Precast Concrete: Handling and Erection." American Concrete Institute. MonographNo.8. 1974.
SO. Weiler, G. "Connections for TIlt-Up Construction." Concrete InternotionaI: Design and COIlStruet;on.American Concrete Institute. June 1986. Vol. 8, No.6, pp. 24-28.
81. White, Raben S. (chair). "Recommended TIlt-Up Wall Design." Structural Engineers Association ofSouthern California. Los Angeles, CA June 1979.
47

82. Yasumura, M. and Sugiyama, H. "Rigidity and Strength of Plywood-Sheatbed Wall Panels under Reversed Cyclic loading." Transactions. AIchitecturallnstitute of Japan. No. 329, July 1983, pp. 64-73.
83. Young, D.H. and Medearis, K. "An Investigation oftbe Structural Damping Characteristics ofCompositeWood Structures Subjected to Cyclic Loading." Department of Civil Engineering, Stanford University.Stanford, CA. April 1962.
84. Zacher. E.G. and Gray, RG. "Dynamic Tests of Wood Framed Shear Panels." Proceedings. 1985 Convention. Structural Engineers Association of California. San Diego, CA. October 1985, pp. 41-61.
85. Zacher. E.G. and Gray, R.G. "Lessons Learned from Dynamic Tes1sofShear Panels." Structural Design,Analysis, and Testing. Proceedings. Structures Congress 1989. American Society of Civil Engineers. SanFrancisco, CA. May 1989, pp. 132-142.
48

TABLE 3.1 ALLOWABLE SHEAR IN LBIFT FOR HORIZONTAL PLYWOOD DIAPHRAGMSWITH FRAMING OF DOUGLAS FIR- LARCH OR SOUTHERN PINEl [77]
Blocked Di.afllnp5 U.bloded DUpUips
Mi.l." ""'i._.. Nail.,.~II.....,...t!o.""'_("1c.- .. 1l~.... ,.aMp""'cllo ."'l...I..~ "" ............. ...,...... _
!"io.i.~ MiM••• N_._IGOlI(<=-3 .... 4)_ .. al...... <4••e-.. p- H_i_ ........ 0( (u-s .....)
:"lill '0 P1Y-O'1 Fl'I8lla&Plywood Grade !Oz. iO....ial .- hl_.....
6 4 2Y:t ! 2 2(i•.) (.L) (i•.) loM,..,.....I....
N........ II~"plr-ooI ...d ...... ..._-...- O!:aercoa6.....eoa.......... jMa. (e-~3,"S""')
6 6 4 3 (e-Il
6<1 1 'i. Sl16 2 185 250 375 420 165 1253 210 280 420 475 185 140
STRlJCTIJRAL I 8d II/, 3(, 2 270 360 530 600 240 1803 300 400 600 675 265 200
IOd 1 SI, 15132 2 320 425 640 130 285 2153 360 480 720 820 320 240
5116 2 110 225 335 380 150 1106d 1 v;' 3 190 250 380 430 170 125
318 2 185 250 375 420 165 1253 210 280 420 475 185 140
C-D,C-C,3/8 2 240 320 480 545 215 160STRUCTURAL 11
nd oilier gndes 8d lY:t 3 270 ~ 540 610 240 180cove"'d i. U.B.C. lS/32 2 270 360 530 600 240 180SIndoni No. 25-9 3 300 400 600 675 265 20lJ
IS/32 2 290 31>5 575 655 255 190LOd 1 s/~ 3 325 430 650 7?5 29Q 215
19/32 2 320 425 640 7~ 28S 215
I 3 360 480 120 820 320 240
1 n_ VII.es 1fe fors~ort-Ierm loads d.e 10 wi.d or elrtloq.lke ud m.st be red.ecd 25% f"raormalloadiJIg. Space .Iib 12 i.I. oa ee.IeUIo'gillenaedilte fl1lmiag members.Allowable ~earvlhes for nils iI Inmiag members of ol~er species"' fONl ia Tlble No. 25-17-J of l~ U.B.C. SlIldards ""U be c:aJc~LalCd
for IU gmdeso by ...Iliplyilg tle val.es for ..Us i. Sncbllall by tK followi., fsaors; GlOlIP ill, 0.82 aid GlOlIp IV, G.bS.
2 Fnmilgl'adjoiaiall pa.e! cd&es ""U be 3-ia.•omiall or wider IDd IIUs "a!l be .""ggered wII,,,, ..ib Ire spaced 2 il. or 2Y:t iI. 01 celter.
) F..miag Iladjoiaia, palel e••""U be 3-ia. 1I0.ilalol wider IDd Dlils ""U be staUCr.:d wilen lOcI lails bvilg peaetnliol iato fl1lmi.gof 1D0re tho 1 5/, il. are spaced 3 i.I. or \e$6 01 CClllCl'.
49

TABLE 3.2 DIAPHRAGM SHEAR STIFFNESS (3)
Range ofCategory Shear Stiffness Type of Diaphragm
(klin.)
Very Flexible < 6.7 straight and diagonally sheatbed wood diaphragms
Aexible 6.7 -\5 special diagonally sheathed wood diaphragms, plywoodsheathing, lightly-fastened light-gauge steel decks
Semi-Flexible 15 -100 plywood sheathing,moderately-fastened medium-gauge steel decks
Semi-Rigid 100-1000 heavily-fastened heavy-gauge stt'-t'l decks,composite diapbragtD5
Rigid > 1000 cast-in-place Cl'ncrete dc.:ks
TABLE 3.3 FASTENER SLIP EQUATIONS [74)
Mimmum For Maximum Approximate Slip, en (in.) ll,b
Fastener Penetration Loads up to
\(in.) (Ib) GreenIDry DrylDry
6d common nail 1 1/4 180 0!0/434)2.314
I(VJ456)3.144
8d common nail 1 '/16 220 0!01857)1.869 (VJ616)3.018
IOd common nail 15/S 260 0!0/977)1.894
I(V0/769)3.276
14-ga staple 1 to 2 140 01019(2)1.464 (VJ596)1.999
14-ga staple 2 170 010/674)1.873 I (VJ461)z.776
a Fabricated green/tested dry (seasoned); fabricated dry/tested dry. Vn = fastener load.
b Values based on Structural I plywood fastened 10 Group II lumber. Increase slip by 20% when plywoodis not Structural 1.
so

TABLE 3.4 STRENGTH OF METAL-DECK DIAPHRAGMS [48]
Mode of FailureNominal Strength Allowable Shear for Design
(kip/h) (kip/ft)
Failure of Connections
Edge Connections 5 .. ;: 1m) + np a 2 + n~)~[ S.. for weldedS :S 2.75 connections
Interior Panel S.. = (2A (A - 1) + B) ~IS S.. for mechanicalComer Fasteners S _ j; (]{2B2) :S 2.35
II - (L2]{2 + B2) Q[ connections
Stability Sc = (3;~O)([3 ~3 df25 ScS :S 2.0
Notation:S.. =Sc =S ::
L =:
Lv ::
d =w =t =:
D =0Qs =(2)
a2 ::
asx.. =Xp~ =
'P =n.- ::
A =N =/ =s =
B =;. =
nominal shear strength of diaphragm, kip/ftcritical shear for stability of diaphragm, kip/ftallowable shear strength for design, kip/ftpanel length, ftpudin spacing, ftcorrugation pitch, in.width of the deck panel, in.thickness of the metal deck, in.panel depth, in.strength of a structural fastener, kip (defined in Table 3.5)strength of a sidelap fastener, kip (defined in Table 3.5)I x..lw = end distribution faClorI Xp Iw :: pUrlin distribution faclorratio of sidelap fastener strength to structural fastener strength, QslrJtdistance from the panel centerline to a fastener at the end support, in.distancL from the panel centerline to a fastener at purlin support, in.number of intermediate sheet-to-structure connections per panel lengthand between purlins at the diaphragm edgenumber of purlins excluding those at ends or endlapsnumber of stitch connections wilhin length L1 for single~ge fasteners2 for double-edge fastenersnumber of fasteners per fOOl along the endsmoment of inertia of the sheet, in.4/ftdeveloped flute width ( 2(e+w) + fin Fig. 3.7), in.
11. a. + (2np I xi + 4 E x~)
1 _ DL.240ft
51

Applicable for deck thicknesses between 0.0285 and 0.0635 in.Wa'lhers are recommended for deck thicknesses less than 0.028 in.Equations developed for No. 12 and No. 14 screws.Applicable for deck thicknesses between 0.024 and 0.60 in.Strength is independent of screw because deck typically fails before screws yield.Strength and flexibility do nOI depend on the type of pin.
TABLE 3.5 STRENGTH AND FLEXIBILITY OF CONNECTIONSIN METAL DECK DIAPHRAGMS [48]
(a> Structural Connections
Type ofStrength Aexibility
Connector 0" Sf Notes(kip) (in.l1cip)
Puddle Welds 2.2 t F.. (d- t) (1)without washers0.00115
with washers 99 1 ( 1.33 do + 0.3 EJCJl t )it
(2)
Screwed Connections 1.25 F)I t (1 - 0.005 F)I) 0.0013 (3)ItPower-Driven Pins
0.0025Ramset 26SD 62.5 t (l - 5t)ii
Hilti ENP2-21-L15 61.1 t (1 - 41) 0.00125 (4)Hilti ENP3-21-Ll5 .;7Hilti ENKK 52.0 t (l - 3t) 0.00156
Ii(b) Sidelap Connections
Type ofStrength Flexibility
Qs Ss NotesConnector (kip) (in./kip)
Puddle Welds 1.65 t F.. (d - t) (1)without washers 0.00125
with washers 74.25 t ( 1.33 do + 0.3 FJa t) it (2)
Screwed Connections 115 d t 0.0030 (5)-rPower-Driven Pins 240 t2 0.030 (6)
TNotation:
t = thickness of metal deck, in.d =average visible diameter of weld, in. or major diameter of screw, in.E" =specified minimum strength of metal deck, ksi~ = diameter of hole in washer, in.Fx;r =electrode strength, ksiF, =yield stress of metal deck, ksi.
Notes:(1)(2)(3)(4)(5)(6)
52

TABLE 3.6 STRENGTH OF COMPOSITE DIAPHRAGMS (48)
Type of Concrete Nominal Strength(kip/ft)
Allowable Shear for Design(kip/ft)
Structural
Type 1- insulating
Type ll- insUlating
_ BQt wt&Su - T + 19500
Su :::: ~t + 0.040 It:
BQf rr;Su :::: T + 0.064 de
'Ipn.rwf/B =
= nominal shear strength of diaphragm, kip/ft= allowable shear strength for design, kip/It= panel length, ft
w = width of the deck panel, in.fJt = strength of a structural fastener, kip (defined in Table 3.4)Q. = strength of a sidelap fastener, kip (defined in Table 3.4)as = ratio of sidelap fastener strength to structural fastener strength, Q..IQjXe = distance from the panel centerline to a fastener at the end support, in..xp = distance from the panel centerline to a fastener at purim support, in.lit = number of intermediate sheet-IO-Slructure connections per panel length
and between purlins at the diaphragm edge= number of purlins excluding those at ends or endlaps
number of stitch connections within length L= unit weight of concrete, lb/ft3
= specified compressive strength of the concrete, psi.n. a. + (2np .r x~ + 4 .r x;)
Notation:s..SL
TABLE 3.7 MAXIMUM DIAPHRAGM DIMENSION RATIOS (77)
Horizontal Diaphragms Vertical Diapbragms
Material Maximum MaximumSpan-Width Height-Width
Ratios Ratios
1. Diagonal sheathing, conventional 3:1 2:1
2 Diagonal sheathing, special 4:1 31/d
3. Plywood and particleboald, nailed all edges 4:1 3lh:l
4. Plywood and particle board, blodting omitted at 4:1 2:1intermediate joints
53

VI ....
TAB
LE4.
1S
UM
MA
RY
OF
EX
PE
RIM
EN
TAL
TES
TSO
FD
IAP
HR
AG
MS
SU
BJE
CTE
DTO
LOA
DR
EV
ER
SA
LS
Num
bero
fR
efer
ence
Dia
phra
gms
Dia
phra
gmD
iaph
ragm
Typ
eo
fL
oadi
ngE
xper
imen
tal
Tes
ted
Mat
eria
lS
ize
Var
iabl
es
You
ngan
dP
lyw
ood
thic
knes
sM
edea
ris8
plyw
ood
8'x
8'
Sta
tic
load
reve
rsal
sN
ails
ize
and
spac
ing
(196
2)[8
3]In
flue
nce
of
low
-am
plit
ude
cycl
es
5pl
ywoo
dL
oad
reve
rsal
s(2
8m
m/s
ec)
Ply
woo
dth
ickn
ess
AB
K(l
98
1)
61
"x
6"
shea
thin
g2
0'x
60
'F
orce
dvi
brat
ion
Roo
fing
mat
eria
land
over
lays
(1]
3m
etal
deck
(ear
thqu
ake
mot
ion)
Blo
ckin
gan
dch
ords
Zac
hera
ndT
ype
of
fast
ener
sG
ray
(198
5)9
plyw
ood
8'x
8'
Dyn
amic
(2H
z)In
flue
nce
of
over
--()
rivi
ngfa
slcn
er(8
4,85
]4
gyps
umbo
ard
3cy
cles
per
disp
lace
men
tlev
elS
ize
of
nail
For
ced
vibr
atio
nIr
ania
ndF
alk
5pl
ywoo
d8
'x24
',(e
arth
quak
em
otio
nan
dsi
nesw
eep)
Infl
uenc
eo
fope
ning
s(1
986)
(39]
5gy
psum
boar
d16
'x16
',o
rF
ree
vibr
atio
nS
heat
hing
orie
ntat
ion
16
'x28
'S
tati
clo
adre
vers
als
--~-'-----f--------I-"---~--
-~--
----
----------
"-
"--
--
---
-
19pl
ywoo
dS
tati
clo
adre
vers
als
She
athi
ngor
ient
atio
nD
olan
(198
9)16
waf
erbo
ard
8'x
8'
Sin
usoi
dal
load
ing
Nai
lspa
cing
[26)
Sha
king
tabl
e(e
arth
quak
em
otio
n)V
ertic
allo
ad

uo uo
TAB
LE4.
2S
UM
MA
RY
OF
AS
KD
IAP
HR
AG
MTE
STS
[1J
Num
ber
of
Num
ber
of
Ave
rage
Initi
alD
iaph
ragm
Des
crip
tion
Sta
tic
Dyn
amic
Sti
ffne
ss•
IDT
ests
Tes
ls(k
/in.
)
BY2
"pl
ywoo
d,un
bloc
ked,
chor
deil
46
9.1
CW
'pl
ywoo
d,un
bloc
ked,
unch
orde
d,bu
ilt-
upro
ofin
g4
66.
2
DY2
"pl
ywoo
d,un
bloc
ked,
chor
ded,
buil
t-up
roof
ing,
retr
ofit
nail
ing
47
12.0
E1"
x6
"st
raig
htsh
eath
ing,
unch
orde
d,bu
ilt-
upro
ofin
g4
66.
6
E)1"
x6
"st
raig
htsh
eath
ing,
unch
ordc
d,bu
ilt-
upro
ofin
g,re
trof
itna
ilin
g-
4-
H1"
x6
"st
raig
htsh
eath
ing,
5/16
"pl
ywoo
dov
erla
y,ch
orde
d4
714
.7
I]"
x6
"di
agon
alsh
eath
ing,
unch
orde
d,bu
ilt-
upro
ofin
g3
618
.1
ItI"
x6
"di
agon
alsh
eath
ing,
unch
orde
d,bu
ilt-
upro
ofin
g,re
trof
itna
ilin
g-
4-
KI"
x6
"di
agon
alsh
eath
ing,
]"x
6"
stra
ight
shea
lhin
gov
erla
y,ch
orde
d,.5
745
.5
NW
'pl
ywoo
d,bl
ocke
d,ch
orde
d4
102
0.4
p~"
plyw
ood,
~"
plyw
ood
over
lay,
bloc
ked,
chor
ded,
46
52.9
Q20
-ga
stee
lde
ckin
g,un
fille
d,un
chor
ded,
bult
un-p
unch
edse
ams
18"
a.c.
4H
16.6
R20
-ga
stee
lde
ckin
g,un
fille
d,ch
orde
d,bu
tton
-pun
ched
seam
s16
"a.
c.4
627
.9
S20
-ga
stee
ldec
king
,2
W'c
oncr
ete
fill,
chor
ded,
butl
on-p
unch
edse
ams
18"
a.c.
47
-
Mea
sure
dst
iffn
ess
duri
nglo
w-a
mpl
itud
e,qu
asi-
slat
icle
sls.

TABLE 4.3 SUMMARY OF DYNAMIC TESTS OF TILT-UP WALL PANELS [6, 8, 7]
EffectiveTest No. Motion Earthquakc' PW Diapbrllgm Panel No. Reinforcement
~.No. Aa:cleration Stiffness(g)
I I ElCentro 0.2 Flexible2 2 ElCentro 0.2 Rigid3 3 Castaic 0.2 Flexibir4 4 Castaic 0.2 Rigid5 5 El Centro 0.4 Flexible6 6 ElCentro 0.4 Rigid 2 5-#47 7 Castaic 0.4 Flexible8 8 ea.,>taic 0.4 Rigid9 I E1 Ccnlro 0.2 Flexible10 I ElCentro 0.2 Flexible
11 2 El Centro 0.2 Rigid12 3 Castaic 0.2 Flexible I13 4 Castaic 0.2 Rigid14 5 El Centro 0.4 Flexible15 6 ElCentro 0.4 Rigid16 7 Castaic 0.4 Flexible 3 5-#317 8 Castaic 0.4 Rigid18 6 El Centro 0.4 Rigid19 I El Centro 0.2 Flexible20 2 El Centro 0.2 Rigid
21 3 Castaic 0.2 Flexible22 4 Castaic 0.2 Rigid23 5 El Centro 0.4 Flexible24 6 El Centro 0.4 Rigid 4 5-#425 7 Castaic 0.4 Flexible26 8 Castaic 0.4 Rigid27 6 El Centro 0.4 Rigid28 6 ElCcntro 0.4 Rigid29 6 El Centro 0.4 Rigid
30" 2 ElCentro 0.2 Flexiblc 4" 5-#431" 6 ElCentro 0.4 Flexible
• El Ccntro - NS component from 1940 El Centro earthquakeCastaic - N69W component from 1971 San Fernando earthquake.
.. Panel~ was repaired with cpDxy after Test 29. TCSlS 30 and 31 were conducted 00 the repaired panel.
56

..
uo ...,
TAB
LE5.
1C
HA
RA
CTE
RIS
TIC
SO
FIN
STR
UM
EN
TED
TILT
-U
PB
UIL
DIN
GS
Typ
ical
Bui
ldin
gY
ear
Pla
nP
anel
Con
nect
ions
Type
of
Ean
hqua
keD
esig
ned
Dim
ensi
ons
Dim
ensi
ons•
Bet
wee
nP
anel
sD
iaph
ragm
Rec
ords
(ft)
Hol
liste
r18
ft(W
)19
84M
orga
nH
ill
War
ehou
se19
7930
0x
100
30ft
(H)
Pil
aste
rsP
lyw
ood
Roo
f19
86H
olli
sler
6in
. (T
)19
89L
orna
Prie
ta
Red
land
s22
fl(W
)J9
86Pa
lmSprin~s
War
ehou
se19
7124
2x
90
27ft
(H)
Pil
asle
rsP
lyw
ood
Roo
f19
92L
ande
rs··
7in
.(T
)19
92B
igB
ear...
Mil
pita
s24
ft(W
)C
hord
rein
forc
emen
lP
lyw
ood
Roo
f19
88A
lum
Roc
kIn
dust
rial
Bui
ldin
g19
8416
8x
120
38
fl(H
)w
elde
dal
roof
and
Met
alD
eck
1989
Lor
naPr
ieta
(tw
o--s
tory
)8
in.
(1)
•2n
dfl
oor
!e\e
ls.
(2nd
Flo
or)
W-
wid
tho
fpan
el,H
-he
ight
of
pane
l,T
-pa
nell
hick
ness
The
thic
knes
so
fmos
tpa
nels
isin
crea
sed
1016
in.
alon
gIh
eve
rtic
aled
ges.
...
Dig
itiz
edda
laat
eno
tye
lava
ilab
lefr
omC
SMIP
.

'"OD
TAB
LE5.
2S
UM
MA
RY
OF
STR
ON
G-
MO
TIO
NIN
STR
UM
EN
TSIN
THE
HO
LLIS
TER
WA
RE
HO
US
E
Max
imum
Acc
eler
atio
nR
espo
nse
(g)
Pred
omin
ant
Freq
uenc
y(H
z)
Ola
nnel
Loc
atio
nE
leva
tion
Dir
ectio
n19
8419
8619
8919
8419
8619
89N
umbe
rM
orga
nH
ollis
ter
Lor
naM
orga
nH
ollis
ter
Lor
naH
illPr
ieta
Hill
Prie
ta
1C
ente
rN
orth
Wal
lG
roun
dV
ertic
al0.
306
0.30
80.
177
4.54
3.56
0.29
21/
4Po
intS
outh
Wal
lR
oof
EW0.
066
0.\
39
0.26
80.
660.
830.
59
3C
ente
rN
orth
Wal
lR
oof
EW0.
088
0.13
90.
257
0.66
0.81
0.59
4C
ente
rR
oof
EW0.
251
0.29
60.
818
1.64
1.71
1.10
5C
ente
rW
estW
all
Roo
fEW
0.22
70.
281
0.71
81.
64I.
711.
10
6C
ente
rW
estW
all
Mid
pane
lEW
0.20
80.
347
(J.S
531.
64I.
711.
10
7C
ente
rW
estW
all
Gro
und
EW
0.05
80.
112
0.25
20.
660.
830.
59
8C
ente
rN
orth
Wal
lG
roun
dEW
0.07
90.
117
0.25
40.
660.
810
59
91/
4Po
intS
outh
Wal
lG
roun
dE
W0.
062
0.11
00.
237
0.66
0.83
O.:'
i9
10C
ente
rW
est
Wal
lR
oof
NS0.
065
0.14
70
.3M
0.76
1.22
1.94
11C
ente
rR
oof
NS0.
115
0.24
80.
445
6.84
6.40
1.90
12C
ente
rE
astW
all
Roo
fNS
0.06
9
I0.
126
0.34
90.
811.
221.
90
13C
ente
rN
orth
Wal
lG
roun
dNS
0.06
50.
140
0.36
10.
811.
221.
90

VI
\0
TAB
LE5.
3S
UM
MA
RY
OF
REL
ATI
VED
ISP
LAC
EM
EN
TD
ATA
FRO
MTH
EH
OLL
ISTE
RW
AR
EH
OU
SE
Max
imum
Rel
ativ
eD
ispl
acem
ent(
in.)
1984
Mor
gan
Hill
1986
Hol
liste
r19
89L
orna
Prie
ta
Cha
nnel
Ref
.N
umbe
rL
ocat
ion
Ele
vatio
nD
irec
tion
Cha
nnel
"U
nfilt
ered
Filte
red
Unf
ilter
edFi
ltere
dU
nfilt
ered
Fil1e
red
21/
4Po
intS
outh
Wal
lR
oof
EW
90.
250.
060.
120.
050.
600.
36
3C
ente
rN
orth
Wal
lR
oof
EW
80.
160.
0.5
0.16
0.05
0.38
0.30
4C
ente
rR
oof
EW
70.
690.
720.
730.
614.
894.
30
5C
ente
rW
estW
all
Roo
fE
W7
0.74
0.67
0.66
0..5
94.
864.
20
6C
ente
rW
estW
all
Mid
pane
lE
W7
0.44
0.37
0.46
0.41
2.71
2.60
10C
ente
rW
est
Wal
lR
oof
NS
130.
200.
08n
.BO
J16
0.57
0.24
11C
ente
rR
oof
NS
130.
190
.06
0.15
0.09
0.58
J0.
43
12C
ente
rE
astW
all
Roo
fN
S13
0.17
(U17
0.)
30.
24(W
8__~~
Loc
atio
nof
Ref
eren
ceC
hann
els:
Cha
nnel
7:G
roun
d,C
ente
rW
estW
all
C1u
umeI
8:G
roun
d,C
ente
rN
orth
Wal
lC
hann
el9:
Gro
und,
1/4
Poin
tSou
thW
all
Cha
nnel
13:
Gro
und,
Cen
ter
Nor
thW
all

g
TAB
LE5.
4SU
MM
AR
YO
FTH
ES
TRO
NG
-MO
TIO
NIN
STR
UM
ENTS
INTH
ER
EDLA
ND
SW
AR
EHO
USE
Max
imum
Acc
eler
atio
nR
espo
nse
(g)
Pred
omin
ant
Freq
uenc
y(H
z)
Ola
nnel
Loc
atio
nE
leva
tion
Dir
ectio
n19
8619
921m
1986
1992
1992
Num
ber
Palm
Lan
ders
Big
Bea
rPa
lmL
ande
rsB
igB
ear
Spr
ings
Spri
ngs
1C
ente
rW
estW
all
Gro
und
Ver
tical
0.02
70.
040
.06
5.62
--
2C
enle
rW
estW
all
Mid
pane
lE
W0.
094
0.24
0.43
2.56
--
3C
enle
rW
estW
all
Ro
of
EW0.
129
U.4
10.
752.
56-
-4
Cen
ter
Ro
of
EW0.
121
0.34
0.6
92.
56-
-
511
4Po
int
Wes
tW
all
Ro
of
EW
0.24
20
.50
O.fl
O2.
56-
-6
Cen
terS
outh
Wal
tR
oo
fEW
0.03
90.
130.
162.
05-
-
7C
ente
rN
orth
Wal
lR
oo
fE
W0.
050
0.1
20.
182.
05-
-
8C
ente
rE
ast
Wal
lR
oo
fNS
0.04
40.
120.
142.
61-
-
9C
ente
rSo
uth
Wal
lR
oo
fN
SO
.1l3
U.4
g0.
443.
15-
-
10C
enle
rW
eslW
all
Ro
of
NS
0.04
10.
120.
133.
15-
-11
Cen
ter
Wes
tW
all
Gro
und
NS
0.04
10.
120.
132.
71-
-12
Cen
terW
est
Wal
lG
roun
dEW
0.04
60.
100.
172.
05-
-
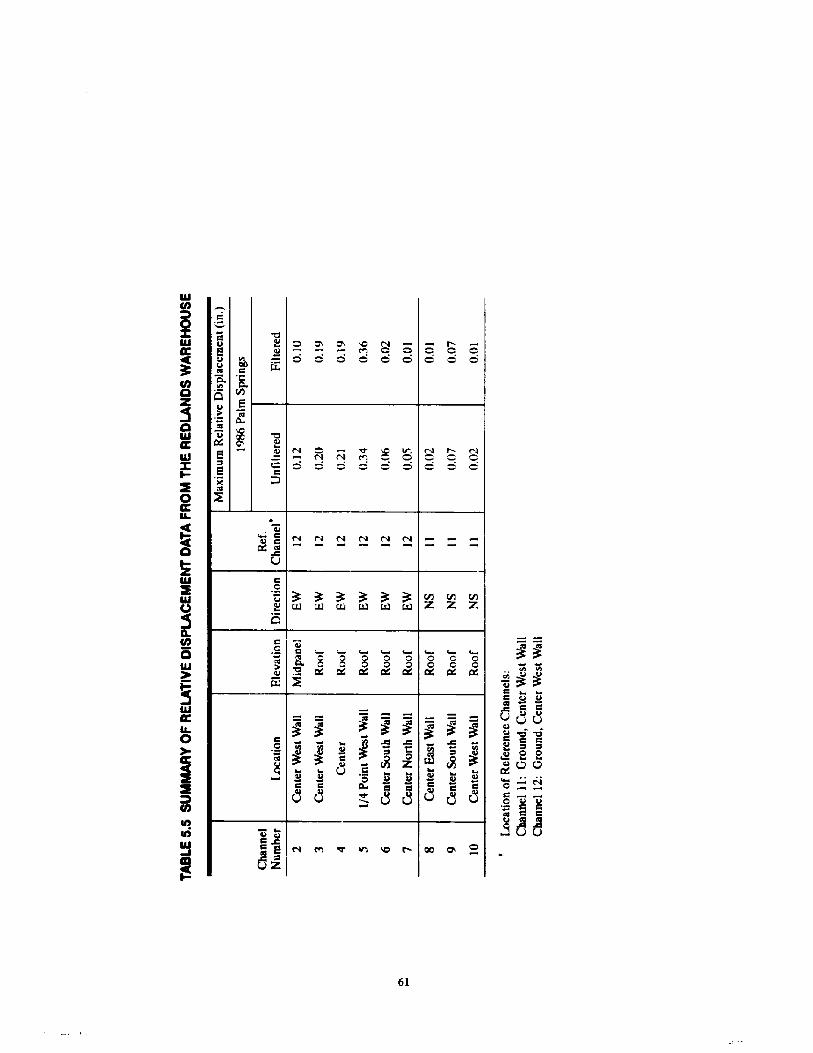
C\ -
TAB
LE5.
5SU
MM
AR
YO
FR
ELA
TIVE
DIS
PLA
CEM
ENT
DA
TAFR
OM
THE
RED
LAN
DS
WA
REH
OU
SE
Max
imum
Rel
ativ
eD
ispl
acem
ent(
in.)
1986
Pal
mS
prin
gs
Cha
nnel
Ref
.N
umbe
rL
ocat
ion
Ele
vati
onD
irec
tion
Ch
ann
el'
Unf
ilte
red
Fil
tere
d
2C
ente
rW
est
Wal
lM
idpa
nel
EW
120.
120.
10
3C
ente
rW
est
Wal
lR
oof
EW
120
.20
0.19
4C
ente
rR
oof
EW
120.
210.
19
51/
4P
oint
Wes
tW
all
Roo
fE
W12
0.34
0.36
6C
ente
rS
outh
Wal
lR
oo
fE
W12
(W6
0.02
7C
ente
rN
orth
Wal
lR
oof
EW
120,
050.
01
8C
ente
rE
ast
Wal
lR
oof
NSII
0.02
OJ))
9C
ente
rS
outh
Wal
lR
oof
NSII
0.07
0.07
10C
ente
rW
est
Wal
lR
oof
NS11
0.02
O.o
I
Loc
atio
no
fR
efer
ence
Cha
nnel
s:C
hann
el11
:G
roun
d,C
ente
rW
est
Wal
lC
hann
el12
:G
roun
d,C
ente
rW
est
Wal
l

0\
IV
TA
BL
E5
.8S
UM
MA
RY
OF
TH
ES
TR
ON
G-M
OT
ION
INS
TR
UM
EN
TS
INT
HE
MIL
PIT
AS
IND
US
TR
IAL
BU
ILD
ING
Max
imum
Acc
eler
atio
nR
espo
nse
(g)
Pred
omin
ant
Frey
uenc
y(H
z)
Cha
nnel
Loc
atio
nE
leva
tion
Dir
ectio
n19
8819
8919
8819
89N
umbe
rA
lum
Roc
kL
oma
Prie
taA
lum
Roc
kL
oma
Prie
ta
1N
orth
End
ofE
ast
Wal
lG
roun
dV
ertic
al0.
034
0.08
11.
640.
44
2So
uth
End
ofE
ast
Wal
lG
roun
dV
ertic
al0.
035
0.08
11.
640.
44
3C
ente
rof
Eas
tW
all
Roo
fN
S0.
076
0.11
43.
49O
.IB
4C
ente
rof
Nor
thW
all
Roo
fN
S0.
174
0.32
94.
833.
69
5C
ente
rof
Wes
tWal
lR
oof
NS
0.07
70.
140
3.49
O.IB
6C
ente
rof
Eas
tW
all
2nd
Hoa
rN
S0.
072
0.10
83.
490.
18
7C
ente
rof
Nor
thW
an2n
dH
oor
NS
0.09
40.
165
),4
90.
18
8C
ente
rof
Wes
tW
all
2nd
Hoo
rN
S0.
074
0.12
51.
390.
18
9C
ente
rof
Eas
tWal
lG
roun
dN
S0.
067
(l.O
921.
290,
1l'\
10C
ente
rof
Wes
tWal
lG
roun
dN
S0.
063
0.10
11.
29O
.IH
11C
ente
rof
Eas
tWal
lR
oof
EW
0.46
50.
585
5.44
4.52
12C
ente
rof
Eas
tW
all
2nd
Hoo
rE
W0.
127
0.25
55.
184.
52
13C
ente
rof
Eas
tWal
lG
roun
dE
W0.
077
0.13
91.
680.
43

CI\ ....
TAB
LE5.
7S
UM
MA
RY
OF
RE
LAnV
ED
ISP
LAC
EM
EN
TD
ATA
FRO
MTH
EM
ILP
ITA
SIN
DU
STR
IAL
BU
ILD
ING
Max
imum
Rel
ativ
eD
ispl
acem
ent(
in.)
1988
Alu
mR
ock
1989
Lorn
aPr
ieta
Cha
nnel
Ref
.N
umbe
rL
ocat
ion
Ele
vatio
nD
irc<.
:lion
Cha
nnel
"U
nfilt
ered
Filte
red
Unf
ilter
edFi
ltere
d
3u
nle
rE
astW
all
Roo
fEW
90.
020.
010.
370.
03
4u
nte
rN
orth
Wal
lR
oof
EW9
0.09
0.07
0.38
(J.1
8
5C
ente
rW
est
Wal
lR
oof
EW10
0.02
0.01
0.29
0.04
6u
nte
rE
astW
all
2nd
Hoo
rEW
90.
020.
010.
340.
02
7C
ente
rN
orth
Wal
l2n
dH
oor
EW9
0.06
(..0
30.
410.
08
8C
ente
rW
est
Wal
l2n
dFl
oor
EW10
0.03
0.01
0.45
0.Q
4
11C
ente
rEas
tWal
lR
OI'f
NS
130.
210.
160.
990.
26
12u
nte
rE
asl
Wal
lR
oot
NS13
0.06
0.04
0.27
0.07
Loc
atio
no
fRef
eren
ceC
hann
els:
Cha
nnel
9:G
roun
d,C
ente
rE
ast
Wal
lC
hann
ellO
:Gro
und,
Cen
ter
Wes
tW
all
Cha
nnel
13:G
roun
d,C
ente
rE
ast
Wal
l

t
TAB
LE8.
1S
UM
MA
RY
OF
OB
SE
RV
ED
DA
MA
GE
INTI
LT-
UP
BU
ILD
ING
SFO
LLO
WIN
GE
AR
THQ
UA
KE
SIN
THE
U.S
.
Num
ber
of
Obs
erva
tion
so
fD
amag
e
1964
1971
1987
1989
Obs
erve
dD
amag
eA
lask
aS
anF
erna
ndo
Whi
nier
Nar
row
sL
orna
Pri
eta
Bui
ldin
gsB
uild
ings
Bui
ldin
gsB
uild
ings
cons
truc
ted
cons
truc
ted
cons
truc
ted
cons
lruc
led
befo
re19
13af
ler
1913
befo
re19
73af
lcr
1973
Dam
age
toco
nnec
tion
betw
een
plyw
ood
and
inte
rior
45
1pu
rtin
or
plyw
ood
and
ledg
er
Dam
age
toco
nnec
tion
betw
een
roof
fram
ing
mem
ber
14
121
and
wal
lpa
nel
Dam
age
topa
nel
topa
nelc
onne
ctio
n2
I1
Dam
age
topa
nel
tofo
unda
tior
.co
nnec
tion
2
Dam
age
obse
rved
inw
all
pane
lsw
itho
utop
enin
gs4
66
2
Dam
age
obse
rved
inw
allp
anel
sw
ith
open
ings
I15
Dam
age
toco
ncre
tew
all
pane
lso
rpi
last
ers
due
to5
23
1bt
iari
ng
Dam
age
toro
ofco
llec
tor
elem
ents
5
Col
laps
eo
fro
ofor
wal
lpa
nel
14
41
No
sign
ific
antd
amag
e13
19I
TO
laIn
umbe
rof
buil
ding
ssu
rvey
ed2
735
463
2

SWlVfl r---i----~------1un I .". I, ..~_A~_.! r,) ( !: r7 :
I II J. I, II IL J
r-------------,
! ~.:i: ....:: I"oc:. .... :I • I
-----J \ :: . !: ... :~--------.-----~
r--------~~-~--~---~-~-l. -..\....... $heM •• :: I I I• • II • I
• I: .. .. .... .. ,ld=J :.!~,L.-------------------------J
,'-
f--~:b~-~~r---:. ,I It 1• ..w.ft I
: ' :
l Cf1::1 LI (
I ~.I ,I ,,~ .. ,'t' II ,\ ...I _I ~-~; !• I
I r-------~-------,
L_=.! f] L-ANGlf I ~ IUIT: Q \. :nAtE , ,
I __, •
1 I......,__ ... J
r---------~---------------,
: so. HtAD : OIAMflfl LENGTH:
l COlt IOU: ,.,.. ..... ..."" :
I I ' II I %" 4"" ,. I; :.-.-,,- ;: : 1'4'" ....... :, ,\¥,"'...,: I IL J J
Fig. 2.1 Common arrangement of panel pick points (79].
65

;.;;\ ============-
(',," " ,
" , ," , ,
" , ," , ,
" ," " ',)
66

~, C ,~
Variable Widths Affect • Stack Casting
• Lift Rigging
• Weight/Crane Size
l
IIAvoid • Laterally Unbalanced
• Too Narrow Elements• Interrupting Support Elements
Fig. 2.3 Examples of improper placement of openings [78J.
67

r-
I~~D 0 0 '~:;;.
L-
Avoid Joints Thru Openings
'ifD D 0 0 Dr--
~ ~'--
Better
Fig. 2.4 Locations of openings within tilt-up panels [78].
68

Fig. 2.5
//
/',/
/',/
/"
Roof framing member connected to the tilt-up panels at the panel-t~el joint [78].
69

~
1YPe
of
Dia
phra
gm
IIW
ood
ESJ
Lig
ht-g
age
Stee
l
EE3
Pre
stre
ssed
Con
cret
e
Fig.
2.6
Com
mon
type
so
fdia
phra
gms
used
inli
lt-u
pco
nstr
ucti
onth
roug
hout
the
U.S
·llO
).

2XJoisIs
Glu'amr- B••ms
V
j II ~~~
lllUI Itl Itll-~I II III
II UJ JII III~m litH r--
= :/"
v
V
,--lnIerior I
Fig. 2.7 Typical plywood diaphragm {35].
Full depthbndging
Blocking (acts as blocking)(may also be
positioned flalwise)
Fig. 2.8 Blocked section of a plywood roof diaphragm (57).
71

72

...... ...,
Cl
6. l
J--
~ ... caDe
ckSp
anCD s= (I) .2 ~ c
At l
Jc
..JL
rf+~ -
co :: ::0 CD s= (I)
Roof
Fram
ing
Plan
o
SECT
ION
A·A
SECT
ION
88
SECT
ION
CC
SECT
ION
D-D
Fig.
2.)(
)P
lan
view
of
ast
eel
diap
hrag
m16
41.

Channel Type Sheartranz I!>
Z-Type Sheartranz I!>
1116" Weld1" LongEvery Flute
1116" Weld 1" longEvery Flute
Fig. 2.11 Typical 'L- and C- type shear transfer connections [64].
74

Net
}lff/b
I"£
lid
lIbI!
Def
lect
fon
Tran
•..,
,,(E
nd)
IMJfI
Long
ftlJd
lnO
i(S
fd,,
)W
of!
H
x )(
2c.
Jlar a
tv1V
~II
-.~
Ir~Bf
I_
-.: ....
WlB
f~mQ"-
UoJ
tlmum
Sh
tIo
r/ft
•r"
",.-
."W
oII"
-2
'i) ee
2T C
Co
rC
SF
-U
altfm
umT
""IJ
iI"o
rC
()fT
lp""
:J/w
FOfT
:"In
na
ng
e_
c.JL
erm
a"
mC
l/f
80ac
Fo
rtle
ri-.o
tfon
of
"T'
_s.c
.J.
2.1
Fig.
3.]
Idea
lize
dfo
rce
dist
ribu
tion
indi
aphr
agm
(331
.

C;IDE ELEVATION OF TEST SETUP
e ...... r-~ --~~I
h
~///,1 '(/
Pl¥WOOO ANDTRUSS JOISTIlAC,",ING rOll6.llt BAG-
TUBULARSTEEL FRAME
II·
I
I
"
LEDGERANGLE• TIE
IITESTSI'EC IM8N
./
I"->-
-TIE
AOJUSTAISUPPORT:
./
LOADDRUM<WATER,
Fig. 3.2 Idealized model of a tilt-up wall panel [16].
Fig. 3.3 Test configuration for AQ-SEASC lateral load teslS [16].
76

""16---I·3
6--
w
Fig. 3.4 Free body diagram of a tilt-up panel subjected to lateral loading [16).
77

K,. = 2
--H-t~
K... = 0.303
1----------- 200'----------
f------ 100'------1
t---H-
r' ," "r;--- ----.- ----f- :t -K~: :0.303---- ---
I 18' I
100 i t~'~
LI K,.'"'2 I II
;- I I K,. '"' 0.39'4I 18' II: +- ,I 20'
~I~~
(a) Flexible Diaphragm
R - 40k A R"'t • 2o
k l, R • '40k '=r A • Aext I ext I U_ ........
....1 ----11 -->1
(b) Rigid Diaphragm
Fig. 3.5 Distribution of lateral forces 10 supporting waDs in structures with flexible and rigiddiaphragms [65J.
78

-L
·1_.
,--_....
~ -t w -f w
~
IIII
-,"
""
"II
l"
Pu
r/in
s\
""~Edg
eB
ea
m
""
".Q
.
".Q
..-
"
JLr
"--
-
•"
En
dM
em
be
r
Sh
ee
tS
ide
lop·
I
"
L~
a
•I
....-
·.=
...-
"--
-
·-
-"
-
·-
J.
"
.-
••
.....
~•
tL.
"
~
-C
orr
ug
ati
on
Lm
es
"S
tru
ctu
ral
Co
nn
ect
IOn
oS
ide
lap
Co
nn
ect
ion
Fig.
3.6
GlO
figu
rati
ono
fm
ela!
-{\c
ckdi
aphr
agm
.

Fig. 3.7 Corrugations in metal decking (48).
80

q,- ct- ct- q,- CT-
..
e,; <f
___L1f
PANEL CENTER LINE
N....IJ
Fig. 3.8 Strength of metahleck diaphragm limited by connections along edge of diaphragm (48).
~-I
F.,N I Fp1.... I• I
I,-0.,e
:x x..J I
I.... I• - ------ - ----o? I
I
jI NIN Q..I.
:x x CENTE:R L IHEII
fp2I f p2I
f.z
-
~-m--~fpl !
•IIII
•II
-------~•III,IIIIIII
-Fig. 3.9 Strength of metal-deck diaphragm limited by connections in an interior panel [48].
81
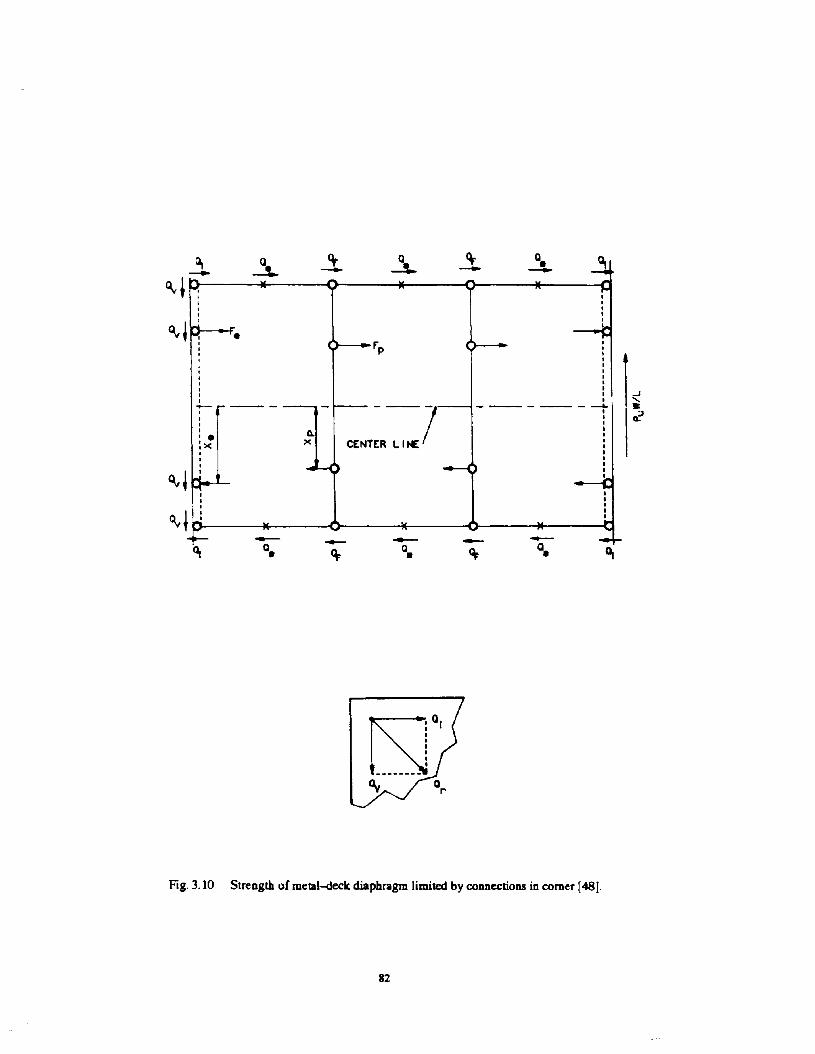
LSJ Q
,
Oy
Fig. 3.10 Strength of metal-deck diaphragm limited by connections in comer [48].
82

EDGE RESTRAINEDBY NEXT UNIT
,,,
p/<-<;:(0) UNIT RESTRAINED AGAINST END WARPING
(bl OPEN-ENDE:D UNIT
Fig. 3.11 Deformatk a of metal deck [48J.
83

/8- Plywood
2- Plywood
J K L M N 0A8CO£FG
1
rz21 .3- 1/.
~~
f
200
~
III 150\)....~
~~ 1000~..c::......~
c:: 500~
~
0
Nail Iden tificotion
Nail Type Length DiameterId in. in.
A An'lular Ring Shank 3/4 0.130 24 rings/in.. brigh t steel8 Annular Ring Shonk 1 0.105 22 rings/in. bright steelC Screw Shonk 1 0.150 aluminum0 Annuler Ring Shonk 7/8 0.100 22 rings/in.. brig" t steel£ Annular Ring Shonk 1 0.740 24 rings/in. bright steelF SCrew Shank 7 0.120 24 threodsjin.. aluminumG Screw Shank 7/8 0.102 32 ringsjin., aluminum! Annular Ring Shonk 1 0.120 20 rings/in.. brigh t steelJ Staple 1/8 16 go bright st",K File Shank , 0.130 bright st",L Annular Ring Shank 1/8 0.715 24,ringsjin.• aluminumAi Steep Spiral Screw Shank 7 0.740 bright sttJelN Barbed
3/__0.145 galvanized
0 tid Common 2 0.713 bright steel
Fig. 3.12 PuU-4ll1t strength of various roofing nails [20].

...._-
-",
....--
-- --
-.,.
6
~...
I."
",.
5I
II
11
- ---9
8
----
----
....._
-,
'--'
.....__
.....
J
...._"
,..,..
-- -- ----
-
2
........-
..... --
........_-
00
Yo
(a)~
..t.
IrId/
aphn
Jgm
"I
and
J,.
,.fl
at
com
pa
tible
with
dI4>
Ioct
ltnen
tsWI
d/f1
phra
gm2.
(b)
WIth
the
ad
diti
on
of
dro
gst
ruts
,d
isp
lon
mlf
lt.
indi
opltr
Qf}
tns
4,5,
ond
6ar
eno
wco
mpo
tlblo
.
(c)
Off
set
wo/
lssh
ou
ldn
ot
beCOlln~tN
toth
ero
of
ifh
igh
she
ars
are
O/t
P«
tMa
tth
ere
-on
tra
nt
corn
er•
.
Fig.
3.13
Dis
plac
emen
tdis
cunt
inui
ties
innu
n-re
ctan
gula
rdi
aphr
agm
s'1
4J.

,,
'"-,'
----
----
----
----
",~
~"--------------'~'
----
----
----
-
,---
SI_
---
---
n.tI
Ot.
c",.
s,_
........
.._,
..........
...._-
----
----
--
~.....
'
--
I--
i...---~·-....
-1
1--'j-
---
1:~II:
II
15
1_
It
[J-r_
,.C
«fI
I•
hrC
JS1
o/1w
1t5
1",
t.tN
or[J-
1_
_1
_S
ttvh
lI
--.,
-I
1--'
51
_~.,c..
,.
-~
(0)
tJJ.p
Ioe
_I.
1ftdk
lphr
ogm
an
no
lco
mpo
t.,.
l1li"
,dI
tpIa
c.",
."t.
'".to
lrw
"'/.
(J#
Id""
"to
r~.
(b)
Wllh
th"
addF
tion
af
dr09
.tl1
lt.,
dls
pla
c."
,.,t
.or.
naw
com
po
tfb
l.tll
roug
hout
til.
dlop
llrag
m.
(c)
With
out
pa
nfi
l-to
-ro
of
con
ne
ctio
n.
at
til.
"ta
ir",
ell"
an
d"'
.I'O
Ior
cor"
'h.
roo
fdi
aphr
agm
dOlI.
na
/d.
Vf1
I9P
/h.
dI"P
lacf
lmen
/"'
com
pa
/fb
l/It
"'.
sIIa
""in
(0)
b"c
ou
."th
.dk
lphr
09m
I.n
ot
r••l
roin
.do
tIh..
.po
rnt•
.
Fig.
3.14
Dis
plac
emen
tdis
cont
inui
ties
inbu
ildi
ngs
with
stai
rwel
lsan
del
evat
orco
rcs
114)
.

<DI
<D <D 0@I I I I w = 290plf
0-~~~~~T@- 11 I I nlulam
opening TT 16'I
@ 1I/v 11/1 I 4'@,---.!---~-;-....J.---~
Rt6'+-a' 2' J- 48' ----------' A.. x
(a) Plan view
1Segment ! t Segment
t1/ I
!~ - 0 0 - -t- - -(325 pin
'11 ~"~:-'~ ,,,'.,,0-
fSegment
IV
344.T 34.4T~ --- I I I I I I I -- -- --- 4-
opal Opll
(b) Frce-body diagram
Fig. 3.15 Analysis uf diaphragm modelled as a Vierendeel truss [74].
87

c __• I •, ...
/6".1",'IOI'IO ...ld/.If. m.otl
c
, '
,,,,,-...... 0 :-;" ,
..."'--i....,.........-.-...~.\. \ ' •• 48" o. c... '~'. \'••~_.~, __ .J. 2.'S
" .L'·:6.' _J
_0_),. _I-"?~~:-<
~
.-c , ,
,
.....
• ..... c.._.•
-\!1
c .=!{
E >\!::!
~I
el'
e[
tJ
"::~..."~
E.,tllnlt•••urll,..td.
IIonom 01 I_In, 1.."",1Thic~ .. 01 p"u IIlcr... 1<'dto .ccommodlte rrcc.Jst pinel.
rod.
.~ CGIIllnlJOUS 'ypiul
." ••11 ..
•• dowel•• 24"
2',0"
Cold joilll~_ I' :}~~ ~......s.]1'·3" ,I S'·J· I I
,--------- --, '--..0-./7 Pan..1 ,<,inforced
6".6"/'10.'10 al c_.rlln. 01Welded ..a"
.. Ii8c ~
i =.. ,v~
li~u.
,t
~..'1
L __
Fig. 3.16 Typical panel-to-fouodatiOD coonectioos in buildings constructed before 1971 [55,80)
88

oP.C. PANELPlR ELEVATIONS
r CONT. SOLIDNON-Sl'iRINK CROUT
FINISHED GRADEPER ARCH. _
I'
'4 SWl DOWELS ~ I 2'• 24" ole L2.:.::
;--- 1 '5 CONT.
, .. DOWELS 0 24-0/0
2 '5 CONT.TOP ok BOT.
~
, ... 24"Cl~
i"cONT SOUD"ION-SHRINKGROUT
1 '4
- COVER _I -S MIN.CONC. OVER STL.
SLAB ON GRADE-PER FDtl. PlAN
-,. 0 24"o/c ! IZ'-rf
PER ~
~--..I
'4 !L• 24"o/r:.-
F'INISHEO CRADEF'ERARCH._
I">eOMT·~iP.C. P......ELPER ELEVATIONS ---_
0'-0"--=--=--- - -- -
Fig, 3.17 Typical panel~foundatioD COIlIleCtioDS ill buildinp COIIStnM:ted a!ler 1971 (40).
89
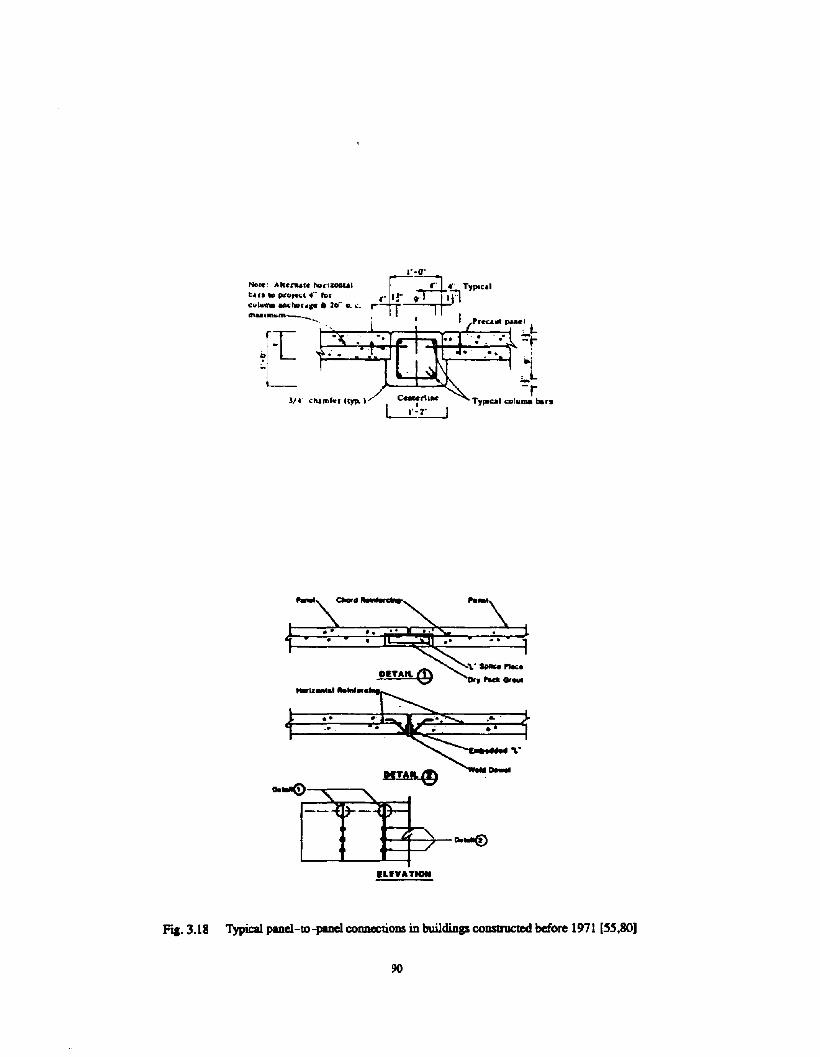
No... , A'...rul.. hoClZOllUI~.. r. eo PI'OICC' 4" lorcc;h... Menor,.p • 2111" Q. lo:.cnutnwm .
r4{ ,.~~ ~l~ToP'"
• I I Pr..c.... -~ l:. ... =r.. ,
io.j.:..L-r
Ty..cal columa ban
• '0• •
.' 0& •.'
"TAIL'!)
..........-.-+-- Oolell(!}
EUVATIOtI
F"1I.3.18 Typical panel-to-panel connections in buildings constructed before 1971 [SS,80]
90

c,.-. c.......... • ---e- T~ C__~ ...- J ;Jf............ ~._.\ VI I I .... I 1/l1!
IMtllDU "'UllICI ,'un
•~.
• • • • v-.. 1IU.D l--~~PlAN---
1lIll' I( •• I.v-.. ~__./ J 15 • T./c I I
.-1llP· ...·1'~ I I
. ~~_.~_oa:
p~
i.J x 3 x_ i- x 0'-0wi 2 - f! x 0W.H.S•• ~o/c
EDGE BARS
t + 2" -:rIt ~x i x O'-~ wi ~-----t ~2- • x .- W.H.S. ""--i;;j!C "I~• o/c-----
Fig. 3.19 Typical paoel-to-pauel COlUlCCtiOns in buildings constructed after 1971 [40,80).
91

80 undar y Nails Edge Nails
Anchor Bolt
Wall Par,el l7
V"
Fig.3.20 Typical purlin to wood ledger connection in buildings constructed before 1971 [35].
2 x 6 @ 24(),'.,
Nails for diaphragm and chord.' ;' shear to ledger
,~""" I
'" I, to ,I Panelized roof ----,
"
Purlins 8'-0 o.c. ',V' ..' d, l+irz:=:==:!:l:=~:l:ClI!~~~
Chord Steel--------~~:1~\"~\
i. "Bolts for chord and diaphragm shear\ ledger to wall
3 x 6 ledger
Fig. 3.21 Typical plywood to wood ledger connection in buildings CODStrueted before 1971 [25].
92

Chord Steel
J Nails for shear transfer to ledger
Embedded strap 1'lith or without swivel, for local forces normal to wall
ra 16" or 24"
Bolts for bothvertical support andchord and dla~hragm
shear
L \o1ood ledger
Advantases:
a. Few pieces with simple, standaru narawar~.
b. Easy to install with standard carpentry techniques.c. Good, direct shear transfer to wall.d. Accommodates ceiling on underside of joists.
Disadvantages:
a. Embedded straps have to cycle and align with joists and follow slopeof 1. edger which requires setting jOist locations at an early stageso joists and straps coincide. Swivel is of dubious merit if placement is significantly off as strap will run diagnonally across joistsand nA:'ing is partially lost.
b. :1ay be adversely affected by shrinkage as strap is permanent inelevation into L .11 while roof and roofing settle around it. Strapalso places buml in roof membrane subject to different thermalbehavior than r~.t of roof.
Comment: This is a good current detail essentially developed after theSan Ferando earthquake to provide a positiv~ tie into diaphragm for localforces. There are some fh·ld problems setting the straps at the properelevation and proper lateral location and some concerns over the effect of thestraps on the roof membrane.
Fig. 3.22 Typical purlin to wood ledger connection in buildings CODStruCted after 1971 [25].
93

Wal
lA
nch
ora
ge
pe
rU
BC
Lo
ng
itud
ina
lW
all
C)
,I ~ '0
~/
\,,,
1"',.
........
./
/[
F ~I
1I
I1/
II
11
II
I
\I
I:
Ii
VI
lI
(j
II
1I ...
rT
dT
TT
TT
1\•
II
CI
II
I1
II
,I:
:I
~2
xS
ub
-pu
r/in
s0
2'-
0·
O.C
....
....0
A...
........
II
III
IT
TT
T1
~.£
;~
I~
't:I
II
T1
rt1
I:
I1
11
II
1,
1.:
11
1I
I1
IT
II
l1
/I
AllB
11
I
V~
I/V
I1
><
1I
),I
L.:
1 I
IK
GI.
DC
.,/._
___
-_.I
•A
',.
,'1
_..-
,.
Tro
nsve
rstl
Wal
l
Pos
itive
Oirt
lC
onne
ctio
np
t!r
UB,
Sec
.2
J70
(t>
pica
,
f
Su
b-d
iap
hro
9m
pe
rU
8CS
ec.
25
'J(t
ypic
al)
Fig.
3.23
Plan
view
of
roof
fram
ing
mem
bers
show
ing
subd
iaph
ragm
deta
ils.

-~-
ger
k
'\ HUC4 ha nger, ,.. !.~r-
\
; ---',
-' I\--- --at-t--' , ___ 4
x bloc.. - .. d
"
~\- ..I, .,
, - \ HUC4 han. ,"
I:.~~ .....
~F
PLAN VIEW
@ 16"
4 x block'~---_.-.. --
HUC4 hanger
II
//
\ \\
\~ Coupl ing nu t
L-__ Washer
~ 3 x ledger
II
4 i: __ Hasher
Bolts for vertical , ~~
support. diaphragm ...-~....C.--I "and chord shear ano .L...__--H--I!!:f---fL------l - ~"I +---- Joistslocal (orces normal h~~-~----~=~~-.......~c.:J'lL- or 24"to wall
--_.-1;-Nails for diaphragm .. <land chord shear ---+--...-i....,to ledger ~ ,
ELEVAT~ON
Advantages:
a. Standard hardware.b. Installs WiHI normal carpentry tools and tt!chniqul'.~. Independent of joist positioning provided wall bolts are not within.
4-inches of joist centerline. Tight tolerances not required.d. Good, direct shear transfer to wall,e. Not adversely affected by wood shrinkagl'.
Fig. 3.24 Strengthening of existing panel-to-roof connections for walls with parapets [25].
9S

;Nail diaphragm and chord shear to sill
Joists @ 16" or 2,,"
I~ood ledger and bolts forvertical support
/JI-
~_-+-4HB-----II..,..c..,;orl&_~ Rods for outward
local forces normalto wall
Bolts diaphragm andchord shear sill towall ---
See Figure 9 for detailsof rod connection
Advantages:
a) Simple connection installed with standard carpentry techniques.b) Can be installed ~ existin~ construction almost as easily as on
new.
Disadvantages: tlumber of small parts resulting in an inr.r~ased cost.
Fig. 3.25 Strengthening of existing panel-to-roof connections at top of waD 125].
Fig.3.26 Purlin-to-purlin connection across a g1ulam bea:n 122].
96

Nails for combination of diaphragm and8ub-diaphragm shear to ledger
Endnail each block for overturning force
~st
6"24"
11(.-.I~~ Nails plyvood to blocking ox: oca '.
/ force normal to wall: () .
,- - - '4
. .. .. . - - -. - _. -- ..
I I I 1-' L~ 'f: LIJ. ",C.
:& -I- .Iof.:- '- - ~~ 1.. li;>r
r•.. .. A 'I- ---- ----~~ - rr
.. ~rod_.D LB locking staggered each side of
" snug fit requix:ed between joists~.
,,
--- Rods for local force normal to wall·V ;
~''1
--_...-~ -- ...- SUB-DIAPHRAGM -If'• j;
0 \
, ' ' -- Coupl ing nut• L.-
Chord steel forcombination ofdiaphragm andsub-diaphragmtension
'--'--30lts for shear transfer to chord/wall
', .... 3 x ledger to tlatch joist depth
Advantages:
a. Relatively simplp carpentryb. Tolerances are relatively loose.c. Not adversely affected by joist shrinkage.d. Can be applied to existing as well as new construction.
Disadvantagt's:
a. Increased hardware, lumber and 113 lUng relative Lo (13).b. Snug fit on blocking hard to obtain unless rods are tightened
before sheathing is in place.r.. Problem in blind nailing plywood into staggered blocks.
Fig. 3.27 Use of metal ties through purlins to create a subdiaplmtgm (walls with parapets) (25].
97

Bolts for chord ./shears and - ~ - -- < '7dii.phragm shear . ··r ' ..,.// ~JI'I;' --S:~=d'i;;;;:~~' -'- _.- R;~ for Iloesl
"" forces normalChord steel . ~ . I. • to wall
;I./" .1couplin~ nut
Nails to blocking forNailing f0r ~hord shear "rom diaphragm ,/ local forces normal to
and sub-J iaphr~.~r~~~ a iaphragm shea~~__ ._ /C wallr
2 x blocking snu~ fitto joists. Staggeropposite sides of rod
Fig. 3.28 Use of metal tics duough purlins to create a subdiapbragm (top of wall) [25].
98

Chord Steel forcombination ofdiaphragm andsub-diaphragmtension
Nails for combination of diaphragm and
Osub-diaphragm shear to ledger
fnbedded strap with or without swivel forr local forces normal to wall
I
I ('trap to attap for full local fOTce nonaal to wall
! I Nails-strap to plywood for proportion of local-I ! force normal to wa 11 I
J I Roundary nailing for sub-diaphragm shear~
/~ _,I,~ Sheetmetal st_r_a_p_~"jl;-- c -'------.- I
,.- 'f
Joists------1-++.---- ---i+1Ic@ 16"
or 24"
-+2 x flat blocking
-Bolts for shear transfer to chord/wall
~ 3 x ledger to match joist depth
II.dvantages:
a. Relatively simple carpentry.b. Work done from above.
Disadvantages:
a. ~o.,-standard sheet llIetal strap.b. Strap has to be set accurately to elevation following slope of roof.c. ~~y be adversely affect~d by shrinkage as strap is permanent in
elevation into wall while roof and roofing settle around it.Strap also places bump in roof membrane subject to different thermalbehavior than rest of roof.
Fig. 3.29 Use of metal strap auached to plywood aDd blocking to create a 5ubdiaphragm (2S).

Boundary nailing for sub-diaphragm shear -,
I,;,
I
l..~' [iNallsto.",ca
p !for portlon of normal
\ I\. \ Sheetmetal s trap I
SUB-D [f\P!lJ..:AGM . t\ Angle connection for local ~
normal forces
Nails for combination of diaphragm and
/
1 sub-diaphragm chord shears to ledger
/ Nails--To blocking for normal forces-
/ /
3 x ledger to....match joist .depth
'0
Chord steel for ~
combination vf ....... "diaphragm andsubdiaphragtntension
L Bolts for shear transfer to chord/wall
Nails to strap for applicable portion of-- local normal forces Some portion goes
off top of blocking to diaphragm plywood
".uvantages:
a. Relatively simple carpentry without close tolerances.b. Adjusts to shrinkage.
Disadvantages:
a. Non-standard angle and strap.b. Nailing to strap overhead - probably requires scaifolding.c. RCCluires duplicate nailing to blocks.d. Blocks must be end connected for overturning.
Fig. 3.30 Use of metal strap attached to blocking to crea~ a 5Ubdiaphragm [25].
100

I.
Reproduced frombest available copy
-r---- I. .. dl I
i'\\II
\ :t--+Concrete colunm
SECTIO:'ti l\·/t SECTlO~ 0 - 0
Fig. 3.31 Detail of a direct gluJam-to-panel connection [55].
101

400
300
200-•..,100c
~
ellQ.- 0QC
-1000..J
-200
-300
-400
-0.30 -0.10 0 0.10 0.30
SLIP (Inch•• )
(a) Cycles to a given force level [39).
,..1.2
'.0
0..
0..- 0.4
I 0.2
~ ~~...4 •...•,.0
.1.2•10 ~ ~ .. .a 0 I 4
Displacement (mm)• • 10
(b) Cycles to a given displacement level [26].
Fig. 4.1 Measured fOfCMisplaccmcnt response or oailed cOIUIeCtions.
102

(a) Static load reversals [83].
8040
CyclicLoad-Defleetlon
Curves
Envelope ~_
·20 0 20Displacement (mm)
40
-20
-30
-40 +---,.-.....---.---.---.--+---.-..,....--.,..-..,....--,,..-..,-eo
30
20
Z 10
6. 0 +----~-_s::iiii
~ ·10
(b) Static load reversals [26J.
Fig. 4.2 Measured fo"Ce~isplacemeDt response of plywood wall panels and diaphraJIDS.
103

~
'"o~--_f----+-~...o
'r_L,_.6-- -.-,.L2---.-0'-11---.-0.1.-.---O~.-::O-----:OL.:-----::O;-l.::8---:-'~.2~---:-'1. "-(OOIB-003), I~.
(C) Quasi-slatic load reversals [I!.
~ l---t.--t------l--t--+--t--r-t-r---j
'" 1---+----+---+--t---1--;t'~t-r;r-it-__j
~
'". 0 ~--_f---_+=~~...~
":'I----A---~...c:.--+,,L---+--_+--_i---r_-___j
"'~--+-----,~4--~---+---+_--_+--_t--~<
-3-4~ L-_..l-_-L_.-L_~_----L--:---7-~
·2 -1 0 2 J 4-(0018-0051. IN.
(11) Dynamic loading 11).
Fig.4.2 (cont.) Mcasllled force-displacemenl rcspouse of plywood wall panels and diaphragms.
104

"CD•LoC
O F2 al 0.60-I. r--------.;-=--=-=;--:;.....:...=.~---__,
0.80.6~__---,0.4
v 0.2~ 0.0~ -0.2laJ -0.4~ -0.6~ -0.8~ -1 . 0 c......................lo.A.oL...................a...&."j~-...................~..........A.'-l~o 0.0 0.5 1.0 1.5 2.0
TIME (seconds)
(a) Initial displacement of 0.6 in.
20
"!.'5-.xv,eocg 5
, 2 3DISPLACEMENT (inch..)
(b) ForcMisplacement curve for monotonic loading to failure.
Fig. 4.3 Measured free-vibration response of plywood diaphragm (39).
105
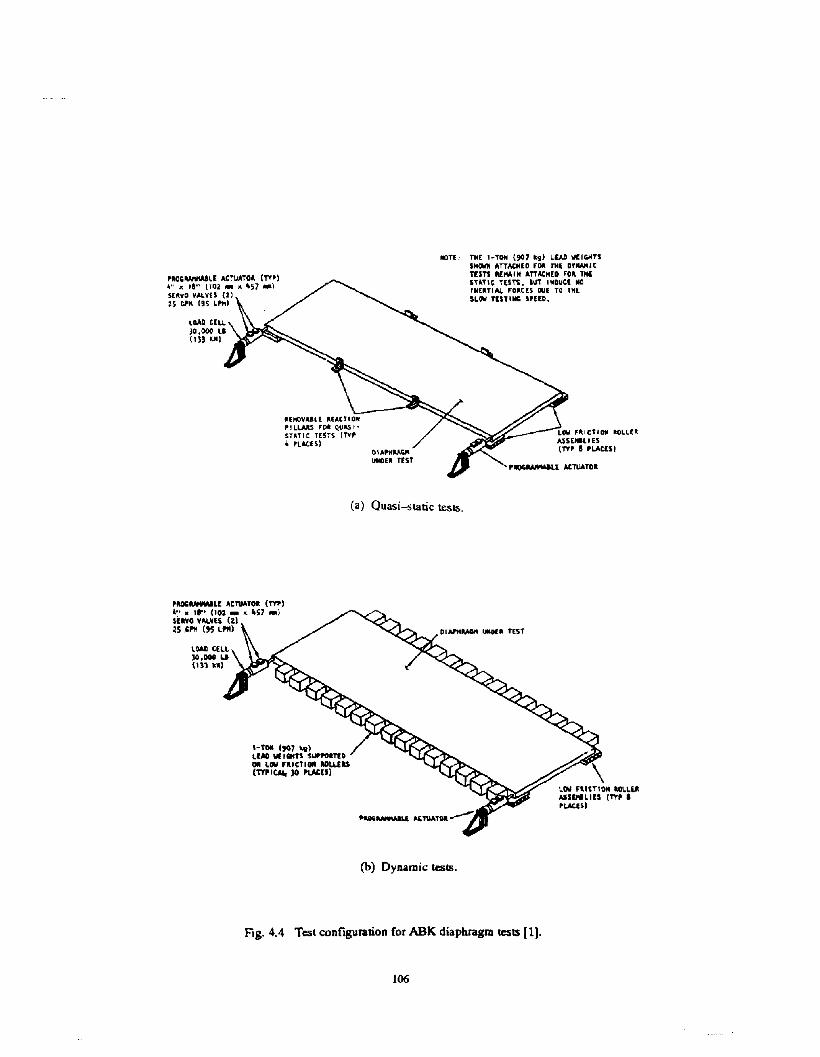
'_O,IWVlAILE AC':1IATO_ In,)~.. x ,e" (102 .. x ~57 _)$UVO VALVts (2)25 &PM (!5 L,,")
01"""......"UNDU TEST
IIOTE: TNE .-TON (!O7 ki) I.Ull wt:IGHTSSNOWll ATTACHEO FCllt TIll DYlWUCTEsn MIlA IN ATTACNED ro_ 1IIlsnT" TUTS. aUT INOUCl NO'NERTIAl. FOltn DUl TO TIlESL~ TtSTIIIC U[(D.
'ROC_LE ACTllATO_ (n,)4~' xl'" (102 _ x It57 _)UlYO YAl.V(S (2)25'''" (95 LPII)
I-TON (,07 k,)LUll WI! ICMn sup,.,an0011 L~ 'lIlCTlOII ROLLUS(TY" CAIt JO 'l.Atul
(a) Quasi-static tests.
\I.OW UICTION RO\.LEIIASSDIILIES (n, •'LAtts)
(b) Dynamic tests.
Fig.4.4 Test configuration for ABK diaphragm tests (1).
106

...c:>
~ r-----,-----,---.,-----,----.,...----,---.....,.....-,-------,
'" r--.......f----t----t-----+----+-----::lI!
CIOf-----If----f-----+----+-----
'? f------1f---~~L--_#;~~--._+---_+- ---+----+----~
"'f------1r--++-+."'".
-2·0 -j .5 -\.0 -0·5 0·0 0.5-(0016-003), l~·
(a) Quasi-static load reversals.
1.0 I .5 2.0
..N
..~
'".0.......<:>
.,,
~~
~
J ~.~
..N.
-8 -2 0 2• (00711-0051. IN.
(b) Dynamic loading.
4 8
Fig. 4.5 Measured force~isplacement response of metal~eckdiaphragm [1].
107

0 lm~_
0 lim_UtI. tJ· ~. CJ·TlISI.
6- Im_lNftt I ·CMP.o .."u.aK.n_• 1l1lS••
Fig. 4.6 Representation of plywood diaphra~m as a series of nonlinear spnngs [11].
rCO,.., •••
A-----.,~--:::~-!-'-L.----.6TENS •• - CO.... •
1TENS ••F
Fig. 4.7 Initial hysteresis rules for plywood diaphrasms [11].
108

12
8
- It0
)( 0
""uCI: -It0l6. F
u
-8 -- +eK1
-12-16 -12 -8 -It 0 It 8 12 16
DEFLECTION
Force-deflection envelope of model
12
8
0 It
)(0
""~0 -It~
-8
-12-IS -12 -8 -It 0 It 8 12 16
DEFLECTION
Typical cyclic load-deflection diagramfor model
Fig. 4.8 Force~eflection envelope and hysteresis rules for plywood diaphragms developed
after ABK tests (4).
109

20
10
•...i'It 01!:-
-10
-20
-302 4 Ii-15 -4 -2 0
tIorormclllon. In
20
to.~It
,; 0
~-1' kJ....,.1Il• 30.0
...-10 ...... '... ao.o.,.-.- 2.S
r piaClll' kJ.pe •• 0-20
rll' kJ.~ a2.0.. 0.2
-JO2 4 II... -4 -2 0
Der-uon, in
Fig.4.9 Revised force~eOeclion envelope and hysteresis rules for plywood diapbragm (9).
110

Mi"4.ln\'~N
3 -:--------==....:....:.:..::.=:.:..:.:-------1
2
-2
4 -l---r---....---..-L-...----,,.----,,.---,.--.-----T"--r--r--.----r-~..;:_.--io • a _ 20 24 •
n-....
(a) Calculated response .
.z-
.~
occ....C-Q'
..,L-_...r-.L_---J-__L--_~_--=-~
• ~ 5 10 15 20 2S 30TI HE. SEC·
(b) Measured response.
Fig. 4.10 Comparison of measured and calculated displacement response of diapbngm N (9].
III

0.' 0.2 0.3 0.4DISPLACEMENT Cinch••)
lee0.0
4ee ....- -,
"~3eec::JoQ.
v 2eeoc(o-J
Fig. 4.11 Besl-fil backbone curve through load~splacemenl data for nailed connections (39).
112

25...- ---:;W:.;:3;....-. --,
20 _"'•.~ 15 ~~V
0 10 1
.c:o
..J 5o
oo
oQt.
CA
c
co
• Model
o El(perimental
2.00.5 1.0 1.5DISPLACEMENT Cinches)
(a) Finite-elemenl model developed by l1ani and Falk (83].
0L-...-..~...&-~........~L-..__.....-...-l-........--..............
0.0
40
30
Z.:.:- 20o<9
10
... -- P'J7IIM4 WaD T._ _ •.,...".,. u..d W. T.
,. * ..~t.r~""'''''1raD• • ..Al.L t• .....MulI AaUle4 WaD
o~.....,...,.-.-..-.-................-.-.-.-.......,....,...r-r-r-r-..............r-T'""'"o 20 .0 60 80 100 120
DISPLACEMENT (mm)
(b) Finite-element model developed by Dolan (26].
Fig. 4.12 Comparison of measured and calculated response of wall panels.
113

TOTA
LIZ
CMA
/llIE
LS
---" •
tAtE
LO(A
TIO
HI
•1
/8H
[lGH
T
, i.'
'
"-1 V/-
-,
_~I
.VS':-
J'0 5 V,,
__ ::~'-
F,
LOAO
D:
DlS
rLA
CEI
IUT
V:
VEL
OCI
TY
TOTA
L_
IER
2 , ,
lASE
'lA
T(
CO
IIC
lUE
Til
T-U
PII
All
).a6
11•
20'
•,.
.
UA
NSl
AT
ING
lASE
"':': "::;'~ ....:
.,:.!
:":'
~':
:;'...
.'~ ... '.'-.. i:'
VJJ
•I"
MU
ST
Of'
STIl
L11
M
- - •
Fig.
4.13
Tes
tcon
figu
rati
onfo
rdy
nam
icte
stin
go
fti
lt-u
pw
all
pane
ls(6
,8,7
).

~ =:, , ••i .. I
• \. • , I' ------ D.zo. '''L 2\ .. \\ \. \ \ --'.20,'''L_. \1 \, - -- 0.", '''L 2 IIlCl."
i ~ . \ --- ...., 'AlCL _ (IlCl. IIa s ~ s \ 1
.i::; : i ............. '.20, '''L ]
- J .: I - ___ 0.'" ,un, IIlO· 'I
'/;: /
2 /,/:' ,'/
(a) Displacements, in.(mm) (b) Accelerations, g
Fig. 4. t4 Comparison of maximum response of panels 2, 3, and 4 with a rigid roof diaphragm
subjected to EI Cenlro base motion [6.8,7).
:: :I,...-..:;:-:.....:.;..--""'I
............. 0.201 1510. Zl
-O IUCI.'I
----- 0 ino. tl.11
, ,......::::..-.7--.,
•,
I s!
\,\
\\ I1.60 )'2.20,,.~',,,I
I!
<a) Displacements. in. (1'IIIl) <b) Accelerations. g
Fig. 4.15 Displacement and acceleration distributiom in panel 3 with a rigid roof diaphragm
subjected to varying intensities of tbe EI Centro base motion [6.8,7].
11S

•, I
i..
(a) Displacements.in. (_)
(b) Accelerations, £
__ '.1).1 ....
_._,.,.....- II • t'.' M<I!
__ ,_,1.'"
(c) Moments, in.-lb (N. a)
Fig. 4.16 Displacement, acceleration, and moment distributions in panel 4 with a rigid roof
diaphragm subjected to varying intensities of the El Centro base motion [6,8, 7}.
TILT-UPWALL PANEL(TYPICAL)
(a) Plan of tilt-up building.
DIRECTION OFEARTHQUAKE:MOTION ~
Fig. 4.17 One-5&ory tilt-up building used 10 develop analytical model (4).
116

rH • 20'
t
/ROOf DIAPHRAGI1
EARTHQUAKEMOTION
(b) Cross section.
/"..
D
(c) Conceptual model of building.
INPUT
Fig. 4.17 (CODt.) One-story tilt-up building used to develop analytical model (4).
117
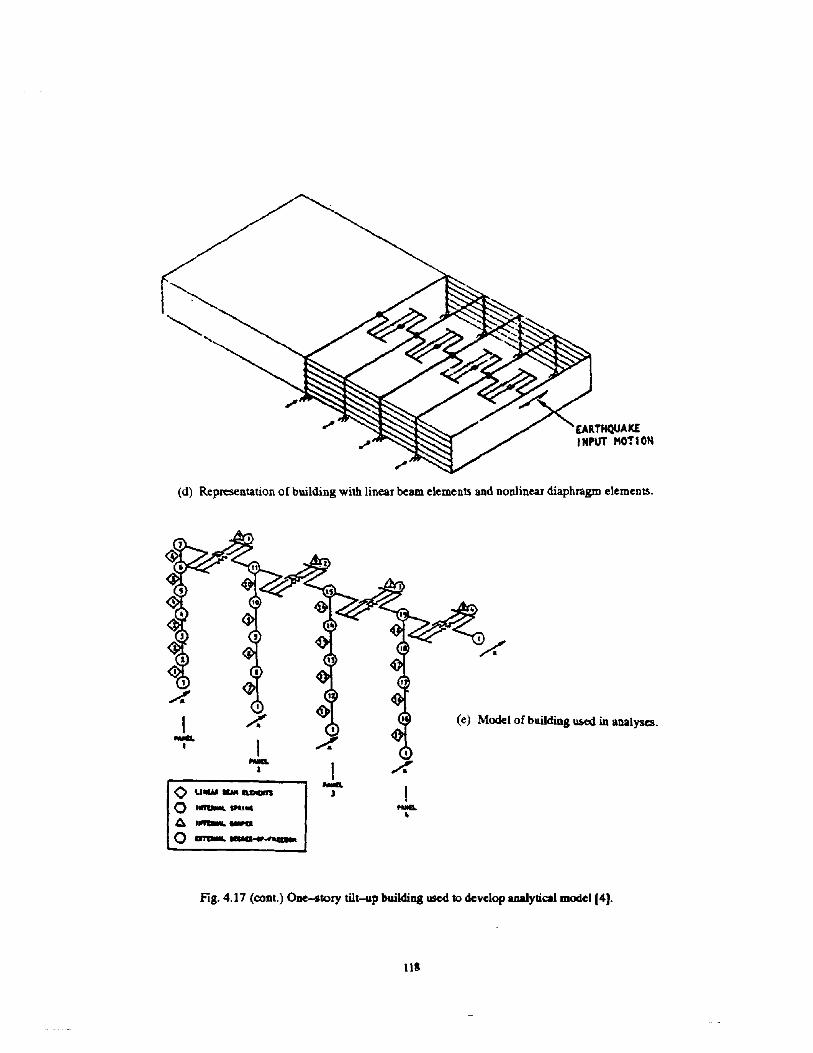
EARTHQUAKEI"PUT ",OTt ON
(d) Representation of building with linear beam elements and nonlinear diaphragm elements.
IMIIIL•
<> UIIUI .. IUlGn
o Im-Iftl"
~I~Oem-..........,.....
/:'
I,....,
(e) Model of building U5ed in analyses.
Fig. 4.17 (cont.) One..-tory tilt-up building used to develop aualytical model (4).
III

O-O·f •1ICIlTLY WWlD
"/\fd\A~ I~~ n
'vvvvvrV \ ~ ~
..¥~ 20
iia 0
;
;..5.. -20
-50o 0.' 1.6 l.~ ).2
TIME. OK
4.0 ~.I $.'
(a) Acceleration at mid-height of panel.
Fig. 4.18 Calculated acceleration response of center longitudinal waD panel
{or lightly-damped model [4J.
119

6.•5.6~.O1.60.'
. , . ,
O-O-F •IllS _INC
~~n/l A~ I ;\~
~~ Ayvy v
~ r V~\1 ~~
~ ii ,-H
o
Z,
'6
..~2
,ii 0;!..~...3! -,
-'6
(a) Acceleration at mid-height of panel.
0-0" IIIIll !lAIlI'INC
.,
'''to---:0:':.•:---:-'..:-,--":"z.'7'.--":'J.":'2--':""•.ro---:'~r:;'---S"'.6---ulTI"I, tee
(b) Acceleration at top of panel.
fig. 4.19 Calculated acceleration response of center longitudinal waD pane)
for moderately-damped model [4].
120

---- CASE 1LICHTLYDAMPED
-- CASE 210~ DAMPED
o S.oMXII1UI1 110ME..T.kl p-ft/ft
Abaolute mAximummoment at midspanTUW
/°.52 9/'/0.97 9
r----r':::'--,.J'
\\\
\,0.599
~1.399I,,
I/
//
/I
o 1 2
MAXIMUM ACCELERATION, 9
Absolute maximumacceleration atmidspan TtJlol
Fig. 4.20 Calculated distributions of accelellltion and moment along the height
of the center longitudinal wall panel (4).
121

(a) Idealized tilt-up building.
(b) Model used for linear analyses.
(c) MlJf.Iel used for nonlinear analyses.
Fig. 4.21 Analytical models of one-story tilt-up building [53,54].
122

--,-....----.----,------1.0
O\J
l::;0.0oi
U07li:
II.UJ() O.Gl.lQ
05'-(
0-'
et. 0·11(:u. OJt-
~ 02
0.1
~.....
".", lw,..O.l s -
............ {5"1.DAMPED
.... T....O.4 s5-....... .....
.... "'.
~""':::::':'...,. T•.".02 s~
" T..., ••O.4 s
T••••0.4 s HI%DAMPED
T~,••0.2 s
SIMPlY·SUPPOnTED WJlLLFIXED·BASE Wl\lL
025 0,5 1.0
ROOF PEntOD (SECONDSj
Fig. 4.22 Calculated roof-to-panel connection forces [53,54].
l/oof.I.OSEe
" "--:r"
LfNEIIR / "VAn/liT/ON
,1,NJ1L.tSiSSIMI'L Y·SlJPPOR I EO WII'-L
nXl'O·£J/ISE WilLI."
pnOPOSED
"50
U2(l
o '-_.J..__.J-._.!.__..l-_-'-_-'-_...1----llU4
DIS1J1NCE mOAf supPOnr
Fig. 4.23 Calculated distribution of shear forces in the diaphragm [53.54].
123
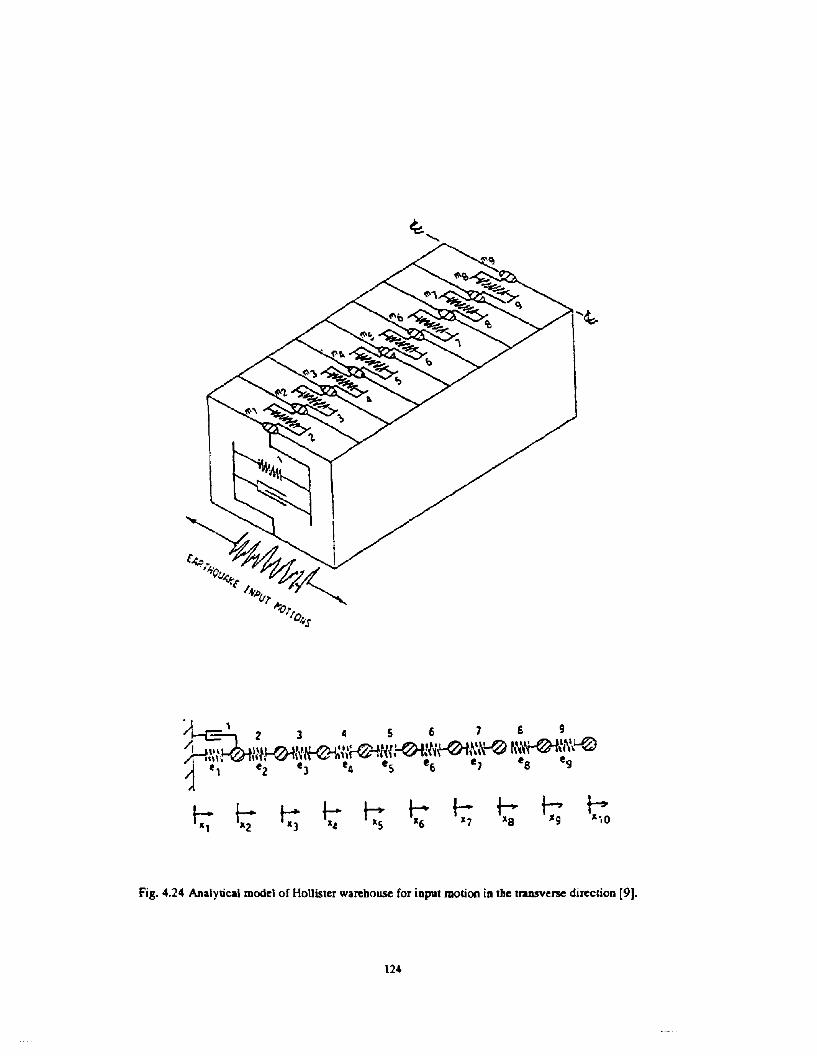
Fig. 4.24 Analytical model of Hollister warehouse for input motion in the transverse direction (9).
124

0.7,..-----------------.-.
(a) Calculated response.
£•1is...It
•••• 0.7) IlItoCS
-2 +--.,---,--~--r__-_r_-_,_-~---Io 10 20
1'..... s..
(b) Measured response.
Fig. 4.25 Relative displacemencs at the center of the diaphragm in the Hollister warehouse
during the 1986 Morgan Hill earthquake [9).
12S

Reproduced frombest available copy
~
-;.yo'"yo •
r
~ ,. E COLUM S (
5 5"
T~'"r -. s~~, -- -_.__._---IGI: . --_. - ;~7";.~;~~
,IZ' -r---I . -- -... . . "jJ • z_' 7. 2.'---t --t r.-, l Ilzz~ZS'
j
"'-r-"
, J--, - -- - - -- " II~Of - -- .. .. ~-
I,10'
~ -'II~t- I, _. - - .. .. _. .•. - - .. ,- - - -f-. 1/. J .J r;::zso )
5.5" / v'.5" 5.5"THICK TIlIU
THICI('tAP'lltO
" r - H TYP
Z7.01'
27.875
1~.021
27.~"
n.ol'
~EY BUILOIlIC
-l~
2/0.25'~28~ j 36 '4 56' i 56' ~ 56' .. 56' 4' 56' 56' 28',
C.Ll:-~J..~.
&1 i\~~;:.S
\
6 SQ. TUBE CC·~."·.(nf')
OfFl tE ANNEX
6.5 THICK PA~_lS (TYP)
L II 72El
r• , • • ! j .
I , '24'I : , : I 0- 'r24', T i lW -
I : ,1 I I
~
I I ·24'
1 I '*I !, :21,'
1\\ I
I 1 J J iw~..\ J 1 I I , f24'
1; I I I I 24'.-, 125'.1
I • • • • II
\"1106 ,
1..Ie at
176'
" 'r
,70.en
I,
1
~-riITTIER BUILCING
Fig. 4.26 Plan views of tilt-up buildings in Downey ano Whinier [9].
126

- ~
N
'"
..'1.,1
0"/~.
""'I~
"),DIAP
HRAC
MEL
EMEN
T
IHPI
./IN
EW~lL
~El
EnEN
T?
V""
,,,"..I~
,~~
~~CT
lO"
OF"T
HOTl
OH
Fig.
4.27
Ana
lyli
cal
mod
elo
fD
owne
ybu
ildi
ngfo
rin
pul
mot
ion
inth
etr
ansv
erse
dire
ctio
n19
1.

II 12)' ®--=-
24.25',18; 1}6't 56' • 56'. 56' q 56' ('5" # 56' l8~
48' ..
I~ I~ II'", "71.5' 46i~
Fig. 4.28 Analytical model of Whinier building for input motion in the transverse direction [9].
12'

129

Ref
.N~
(N2
5W)~
·r
'2'
1114
'a.
H.
O(J
()f
rC
on
a-I
.W
oI/
Pon
el
.....•
..1:GIuIa
ms-
n.
·.
·.
·.
·.
·:
8·~
51
0P
ipe
Col
umn
~-
~r.
_.-:..
• ~1
..'
".
~!1
2x
14O
.H.
Oo
or
i.L
-.l.
.I_
,rC
Dnc
r.f.
MIl
lP
Glle
i[6
·CGII
cre:WO/:1P~".
(t:l
caI)n
on
0n
o!
..
..
...
i".. .1 ! - ~ .1 ~
.~
aa
.1.1
~~
~ o
rC
Mcr
ele
Mbf
lP
anel
12
'11
,,.'
O.H
.D
oo
r1
2'
11,,
,'O
.H.
Do
or
,If
....
....
II
1'N
"I
••
v"-.
"_
:••..:
~~:-
;"'-0"
·'1"
""'"
--
I2.1
'-.11
Fig.
5.2
Ao
or
plan
-H
olli
ster
war
ehou
se.

-3.1
'-.1
"7
Btl,
.•~'-O"
-3
52
'-0
"2:1
'-""1
J~4"
"'''·
iV..CI
uIom
......
tfl"
!ST
D.I
J-
();.
()
.1P
ip.
Col
umn.
.Ii
,I
~~=
Sl
IIr6
"C
oncr
ete
Slab
II
----
~-
.J()
()'-
O·
IL
on
gitu
din
al
Sec
tion
-..., -F
oce
ofP
bt.
.
F_
of
C«
Ir:R
It.
MW
1P
,.".
~'/2.
Ply
woo
dS
heot
hfng
2",,
4"R
oft
ers
1#2
'-0
"D
C4
"",0
"P
urifn
s1#
8'-
0·
DC
CJuJ
omB
.".,
..
fl"!
STD
Pip
.C
Diu
m"
6"C
oncr
et.
Slob
I~~.
I
rran
sver
seS
ectio
n
Fig.
5.3
Cro
ssli
ccti
ons
-H
olli
ster
war
ehou
se.

CH
OIfD
IIA
ItSC
HED
ULE
PAN
Cl.
toe
ATK
JNI
BA
RS
Ire
Tn
III_
IIb
fP
tIMIa
I'-15
BOI
end
ton
gltv
d/t
lo/
Ilb
rP
oM
/.I
-,.
I1a
(8,.
.,0/)
~lO
fl9ltu
dltt
olIl
brP
-12
-,.
Ba
n(2
fto
to/)
Typ
F"
<D
Ch
ord
tH1
n:
La
pp
«!
an
dw
lt»
d
Bon
dIn
0/1.
,.,.0
1.P
OfIe
ih
on
ZO
fllo
ttH
In.
1-"-0
"-1r"
,ie
ol
Pa
ne
i/p
ilO
II.,
Co
nn
«ti
on
OfI
toil
'I."{
!'-~
-~'=
:-
~''''f'
Ne
tO
ponl
nq
----
----
----
---
I"'
-0'-
1\ '"
,<
::-
V~-~-
~i'-
Jit7
'N
elO
p."i
tJ'I
----
----
----
---
'-----'
I"'-
0'
Ir-
.1'-
0'
..L
~
'7'-
0·
lI
\T "'~Ch"",s.
\
",I-+-
~
If&
n01
'2·
OC
""'-I:
::
£D
dt
*'y
'.1/
2"n
'-II
'/2"
(."._
,..
ftwel
to'l
Ito-"
,.-e
l)
jrlfllMI
«JF
loorI-/IS
.
-~
---------~---------
,,-,.~
.11
'-
. w N
Fig.
5.4
Typ
ical
pane
lre
info
rcem
ent
deta
ils
-H
olli
sler
war
ehou
se.

.O-.Of:
.~~..i<j
~:::J
~
~
'"=0..c~."~..~
c:~
~·2 '0j ~ ::r:u .. I
i<j i<j .,.::., iii .;;:
t2 ~ ';>
ti3
or.or.llC
f.i:
~~III
i4:i~
~
c
c
133

Tilt-up Wall PanelsSteel Pipe Columns
-- !12
'3 .2J4 •C)
·e· .... o· <1 I0 b
2t C)
.!£J5 .-LI- 300'-0· -I
Roof PIon
Steel Pipe Columns
!t
13 8 C)
~I0 0 0 0 0 0 0
C)
9fC)
, 7 .-L1- 300'-0· -I
Slob Plan
30'-0"
T
- r510 6.7
Elevation - West Wall
Sensors .. and U Dr. mount" on g/ulam beams.Sensor 1J ;s moun ted on the floor $lab.All other sensors ore mounted on the rIIOl/ panels.
Fig. 5.6 Locations of StroDg-mOtiOD instruments - Hollister W8Rlhouse.
134

Hoflister Warehouse
EW
•
NS
- NS
-..-. ...1989 Loma Prieta Earthquake
1989 Loma Prieta Earthquake
.._.~ "Ir'fi""w" '"", - "-Clfwr"T 5 .. Y _.. -
",.~&.uuL~- . A" AQ ••~h ~v,. .. 40 •
: : [". ~ ,Iop._:::.:o:on Hill Earthquake-0.4[
:':L.,.~:,:~~~~n.~il/ Eart~qUake - EW-0.4 [i :,:~::.~ollister Earthquake - NS
~-04l~ :,:~::Ha:~.te: Earthquake - EWQ:) -0.4l
0.4[0.0
-0.4
0.4 [0.0
-0.4 Time, secao laO 2ao 3ao 4ao 5ao 6QO.... ....' -', ........ ....' .........' -_---...I.
Fig. 5.7 Measured ground accelerations - Hollister warehouse.
135

Ho
llist
er
War
ehou
se1
98
4M
orga
nH
mE
art
hq
ua
ke-
NS
.5.0
,i
,iii
i.S
0.5
,,
,f
II
I
0\ C:0
42
-"~40
o.
-__
_c.
c::.
--
~'0
_._
-lO
XE
'--'---
20
X~
..!?0
.3(,)
3.0
~~
(,)
-(,
)~
"t0
.2c5
2'J
~0
ti0
1~
1.0
~(,
)
~~
O.0
~0
.0I~j
!!
!!
J
ao~o
20
~o
ao~O
20
~O
Per
iod,
sec
Per
iod.
sec
~
[W
...... ai4
.0
~ ~J.O
Q... c52
,O
19
84
Mor
gan
Hill
Ea
rth
qu
ake
.5.0
,ii'
Ii
·S
2%--
----
-5%
_.._
..-10
%---.-
20%
- p)'
",~
'vr~
,L
Af"
'..../
';::-
~,
,I'fV~
__~
'-''0
0.1
,,"'.:/',,_~_#-~.-,
~1.
0~
--'~-"-
~#..
<..>"
,"-'
~V
l----.
_Q
...
0.0
III
O.O
'..E
i!
!!
IJ
0.0
'.0
2.0
3.0
0.0
1.0
--
Per
iod.
sec
Per
iod.
sec
0.5
.iii
•i
i
0\ §O
A'.. ..... ~O.J
~ (,)
(,) "to
.2
Fig.
5.8
Lin
ear
rc:>
pons
csp
ectr
a-
Hol
li:>t
erw
areh
ouse
.

1.00
.I
I,
II
It)o
o
Ho"~ter
War
ehou
se1
98
6H
olli
ste
rE
art
hq
ua
ke-
NS
.5.0
,i
,"
I
.£
£w
1986
Ho
llist
er
Ea
rth
qu
ake
.5.0
,,
••
,i
I.~
1.00
.,
,,
,i
I
01r;,'
2%
.,.;'
40
.S!0
75--
----
-5%
~.
ti.
-.-
-10
%E
l.;.
-----
20
"Q
)~
u3
.0~
0~
0.5
0~
~is2
.0
eo
.25
0...
..•
I"..
10
0-.
~<
,)
~~
0.0
0V
lO.O
I,'-
,!
!,
,I
0.0
1.0
2.0
3,0
0,0
1.0
2.0
3.0
Per
iod,
sec
Per
iod,
sec
-.... -.I
t::2
%"';
40
~0.
75--
----
-5%
~.
o-
..--
10%
t::I".
.-----
20
"~
~0
30
~0
Ma~
a~
is2
.0
e0
25
'0...
..•
I"..
10
0-·
~0
~~
0.00
(fj
O.0
I;
..~
,'
,'
!I
0.0
1.0
2.0
J.O
0,0
1.0
2.0
J.O
Per
iod,
sec
Per
iod,
sec
Fig
.5.
8(c
ont.)
Lin
ear
resp
onse
spec
tra
-H
olli
ster
war
ehou
se.

Redlands Warehouse 1986 Palm Springs Earthquake
Channel 9 - Roof, South Wall
30.0,25.0I
c:'
:2 -0.2
j :::[ C_h_a_n",;IoAI:~;~Ifll,,~:...,:""',.,....~""'''II'I\:,...:M~,.,:w~y..~:....~-:......t_._Wl_a_II --i
-0.2[
::: [ C_h_a"""n,I'<~~lfte..~/\..-.~M:~.•,..",.~.,...,.,.:""':oM:"":~:""I~....'.-.....WI_e_s_t_W;_O-" -1i
-0.2 [ Time, sec
0.0 5.0 10.0 15.0 20.0, , I I I
Fig.5.26 Redlands warehouse - 1986 Palm Springs earthquake_
(b) Longitudinal acceleration respollSC.
171

1.0
2.0
3.0
Per
iod.
sec
EW
,,
",
,,-,-
,,'/
-."-
----
,-..
/-----
--..---
,--_
.ij!
C--
-'-'--
--'
0.0
'~i
'i
',
,
0.0
1.0
2,0
J,O
Pe
rio
d,
sec
,',
,'
I'
-,
----
'"./
'"'
,"""
"".
.-'I
"--
-"""
.....-~
..",
,,,:,'
.-.--
"~//.-./
.,,~
'Z:.
::--
.-.
0.0
1,.
.,p
v0
.0'
,.
,
~ ....5
,0I.
)Q
l
~ t20
,0
~ g15
.0
~ Ci10
,0
t20
.0
~ g15
,0
Q..
.~10
Q.0
15 .t:.5
.0~ ~
3.0
J,O
Ho
llist
er
War
ehou
se1
98
9L
om
aPri~ta
Ea
rth
qu
ake
-N
S.2
5.0
,i
,,
i,
I.~
1989
Lo
ma
Pri
eta
Ea
rth
qu
ake
.25
.0i
,,
i,
'-------'
,~
2~
-------
.5~
-..--
lOX
-----
20
X
2~
-------
.5~
-..--
lOX
-----
20~
1,0
2,0
Per
iod.
sec
1.0
2.0
Per
iod,
sec
1,0
',0
2.0
,,
,iii
IO
'l 2.0
,,
,,
,i
I
O'l c:: .2
1.5
~ ~ oq;: 15 .t:.
0.5
u tl ~0
.01
,,
0,0
"~
c:: .21.
5-o ~ 1
) u I.) ,
w 00
Fig
.5.
8(c
onI.
)L
inea
rre
spon
sesp
cclr
ll.•
Hol
list
erw
areh
ouse
.

0.3
Hollister Warehouse
Channel 2
1984 Morgan Hill Earthquake
Roof, South Wall
-0.3
O.3[0.0
-0.30.3
Channel J - Roof, North Wall.. ·w-J~" I '\t.. 4tltWY,JIe -wft'vN ftd .. a_ .& p .. • •• ... to, , , ~14 04 .. ¥ Q 'I V r ••'V =ov V • pro
Channel 4 - Roof, Cen fer
VA a. V ""'=-
-0.30.3
0.0
Channel 5 - Roof, West Wall
Channel 6 - Midpanel, West Wall
-0.3
_ ~0:.~3[ ~~~:~.~~u~:..~e:~ .W::II
.' --
Time, sec0.0 5.0 10.0 15.0 20.0 25.0 30.0,-I ....' ---'-, ............' ..........' .....''--__-'',
Fig. 5.9 Hollister warehouse - 1984 Morgan Hill eanhquake.
(a) Transverse acceleration response.
139

Hollister Warehouse 1984 Morgan Ht'lI Earthquake
30.0,
..
-
-
..
-
•
-
25.0I
20.0I
10.0!
5.0,0.0I
00.3
0[ .....::~~;.':~.:~o: ~w~~ :011 .
• 4V 'f ,"" .•41 V W" 'iVy , ,,"II =O~ ere»
-0.3
::~~h~~:..._c] -0.3
1_::[ ~';:~'~1~40:~S::OIl ."_::~[ ",,,Np••:;:~:~,~~=::~.) wo:
-0,3 [ Time secI
15.0I
Fig.5.9 (coot.) Hollister warehouse - 1984 Morgan HiD earthquake.
(b) Longitudinal acceleration response.
140

Hollister Warehouse - 1986 Hollister Earthquake
..
30.0!
. .,.o •
A
CO.
25.0,
Center
North Wall
Channel 5 - Roof, West Wall
Cha nel 6 - Midpanel, West Wall
-0.3
::~r..~::::0::: .W:~t..~O~1- 0.3 [ Time, sec
0.0 5.0 10.0 15.0 20.0I I I • ,
::~l';;~:~~ ~0.0f, :ou.t2 :~"..-0.3[
0. 3 t Channel 3 - Roof,
O.O~~~(JI\' ..... J+.. I'v· •
-0.30.3 Channel 4 - Roof,
-0.30.3
O. 0 Io-HIIfIlW\'d
0.0
c::.'.20-0.3a> 0.3-<l>()() o. 0 ~1I'Ill''''~
Fig. 5.10 Hollister warehouse - 1986 Hollister earthquake.
(a) Tnnsversc acceleration response.
141

Hollister Warehouse 1986 Hollister Earthquake
Fig.5.10 (coqt.) Hollister warehouse - 1986 HolJister earthquake.
(b) Longitudinal acceleration response.
142
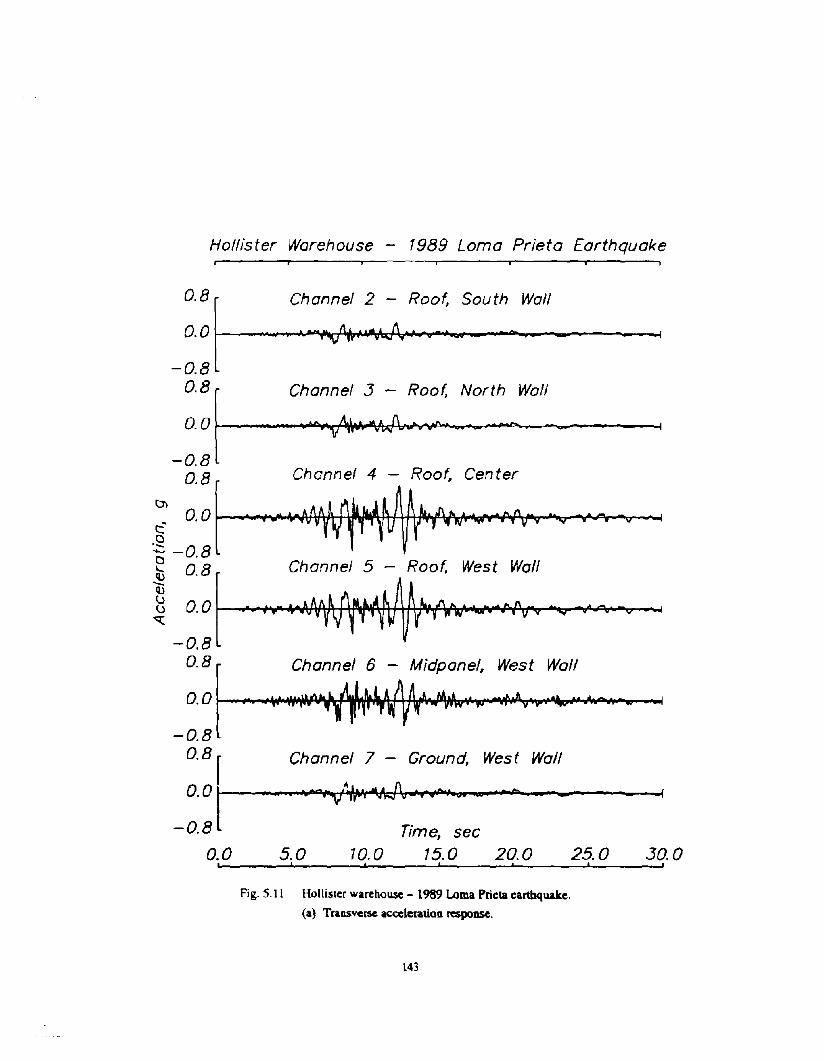
Hollister Warehouse 1989 Lorna Prieta Earthquake
Channel 7 - Ground, West Wall
Channel 6 - Midpane/, West Wall
'~. Wi/"'~'"W" -e~~. .~ .... _ ....
• • 4 UfV pr"l ""'1~ V't',. W"'fJ '"""V"V" V v ..,- W
Channel 5 - Roof, West Wall
• d. _ "'A~~' J\ ••• -~.n - ....... -._W -. Y Vi WIJY rn W"iGiFFV, V'V iTO V
Channel 4 - Roof, Center
•• -AlI ._"fI~,-J\"" ~"-I'\ .. e. _A - •
• ....9fVyV~ , 1-' ~ V ~ r1J 41\1' ~.nrv 'v" 4F4f V
~:: [ .......Co.....h-....a.",,:ri
n
a~e:,...M....:~JOQllCtlf-\y"""~~:......O.....f...:.QlI-S-:-u-t....~...:IIo.....~....a-I-1--------1....,-0.8[
~.: [ C....~..~r::ow:""':+l:Wl~.".~..,..Vf'fj.~rfJl\.t.o.~".,:~..D,tI3"".....~ __N.....__or_:..,.~""'""....~_.D_II-__------I-08 [
01 08[0.0
! -0.8
~ 0.8[u 0.0
oq;:
-08
0.8 [0.0
-0.80.8 rO 0 t----.-...·....enClllII---+t....M• •",....."l.Id-\f\~.f""l"f'I".o.......__-.w::e.........- ----~.$ .. VI Wi ~v •• OW = ...
-0.8 Time, sec
0.0 5.0 10.0 15.0 20.0 25.0 30.01-' ......' .........' ~, .....' ----1.
'
.......'
Fig. 5.11 Hollister warehouse - 1989 Loma Prieta earthquake.
(a) Transverse acceleration rc:5poDSe.
143

Hollister Warehouse 1989 Lorna Prieta Earthquake
0.8 Channel 10 Roof, West Wall
O. a ...-----_Pltf+M+.V~.JI ...."P'" • A. • _ - _ • •
.,.rOp"'LA~II"'~~'-'. .... •W ->., trw.... v ~. IV. v.. _ • _
30.0!
25.0,
Channel 12 - Roof, East Wall
Channel 11 - Roof, Center-0.8
~ 0.8
f0.0
{-0.8l 0.8
f" a 0 ""'A"t'!0rvAu ·.II. LoA.. h. •
'-' . c>ly ., r~ ..."==q' ".""(
-0.8
_:0:'880f----c-~"aI-;_\\l;;:;-. ::d~. ~~:h wa:'.
Time, sec0.0 5.0 10.0 15.0 20.0
, , I • I
Fig. 5.11 (coni.) Hollister warehouse - 1989 Lema Prieta eanhquake.
(b) Longitudinal acceleration response.
144

Hollister Warehouse - 1984 Morgan Hill Earthquake
~:~[,enel 5 - Roof, West Wall
O. 0 [.~~~:J:..-.=:..c:~..:..u..;..;~:>oCe-=::..-..._-...lo-_'-"'---'
~:~~~'M"0.0 1.0 2.0 3.0 4.0 5.0 6.0 7.0 8.0 9.0 10.0Frequency, Hz
Fig. 5.12 Hollister warehouse - 1984 Morgan Hill earthquake.
(a) Normalized Fourier amplitude spectra of tJansverse acceleration response.
145

1.0
0.5
0.0
~:~0.0 0 ,
0.0 1.0 2.0 3.0 4.0 5.0 6.0 7.0 8.0 9.0 10.0Frequency, Hz
Hollister Warehouse - 1984 Morgan Hill Earthquake
~~........
:.a. 1.0 Channel 11 - Roof, Cen ter
: 0.5
.~ 0.0~
G:\)Cll.~
"0Ea<:
Fig. 5.12 (cont.) Hollister warehouse - 1984 Morgan Hill earthquake.
(b) Normalized Fourier amplitude spectra of longitudinal acceleration response.
146

• +,........".". d
Hollister Warehouse - 1986 Hollister Earthquake
~:~[0.0
~.~[~::est~all
1. a Channel 6 - Midpanel, West Wall
~:~[~,
~:~f0.0·
0.0 1.0 2.0 3.0 4.0 5.0 6.0 7.0 8.0 9.0 10.0Frequency, Hz
Fig. 5.13 Hollister warehouse - 1986 Hollister eanhquake.
(a) Normalized Fourier amplitude spectra of tnlDSVerse acceleration response.
147
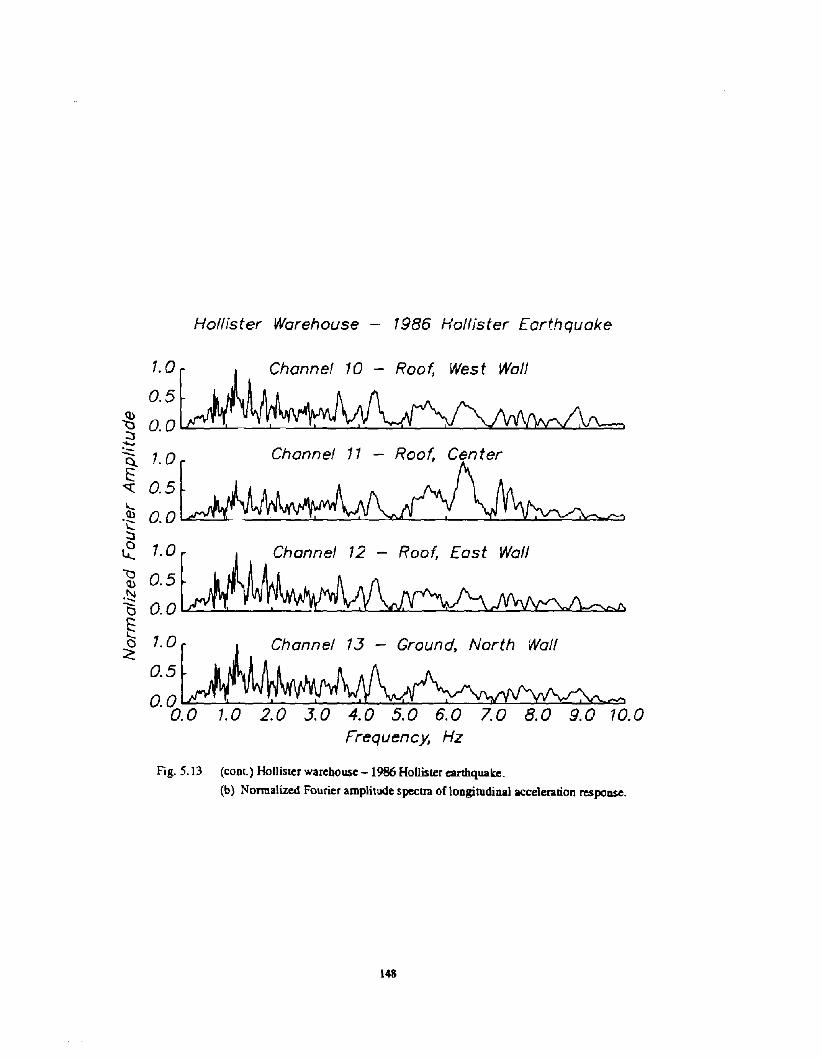
~:~0.0
0.0 1.0 2.0 3.0 4.0 5.0 6.0 7.0 8.0 9.0 10.0Frequency, Hz
Hollister Warehouse - 1986 Hollister Earthquake
1. a Channel 10 - Roof, West Wall
0.5(l)
\:) 0.0~.......
!~~f =I....::l
~\:)Q)
.~
t5§c~
Fig. 5.13 (cont.) Hollister warebouse -1986 Hollister earthquake.
(b) Nonnalized Fourier amplitude spectra of longitudinal acceleration response.
148

Hollister Warehouse - 1989 Loma Prieta Earthquake
• •
'-! ~:~[ A~Channel ~-Ro:f, Center
Q.) O. 0 _ «"==db:.;;::::J
~"t:ICb
~~c~
,.0~ChQnnel7 Ground, West Waf!0.5
0.0 aM~t oce r') , eo 0'0.0 1.0 2.0 3.0 4.0 5.0 6.0 7.0 8.0 9.0 10.0
Frequency, Hz
Fig. 5.14 Hollister warehouse - 1989 Loma Prieta earthquake.
(a) Normalized Fourier amplitude spectra of transverse acceleration response.
149

Hollister Warehouse - 1989 Lorna Prieta £arthq')oke
1.0~ChonneI13Ground, North Wall
0.5
0.0 em! e I
0.0 7.0 2.0 3.0 4.0 5.0 6.0 7.0 8.0 9.0Frequency, Hz
d
..10.0
Fig. 5.14 (coni.) Hollister warehouse - 1989 Lorna Prieta earthquake.
(b) Nonnalized Fourier amplitude spectra of longitudinal acceleration response.
150

Ho
llist
er
War
ehou
se-
1984
Mo
rga
nH
illE
art
hq
ua
ker
,,
T-----
J--
--
f----
I
30
.0Gro
und
----
----
---
Ro
of
25
.0
'~.f
\./\
/\J
-VV
20
.0T
ime,
sec
15.0
10.0
Ea
st
-W
est
No
rth
-S
ou
thR
esp
on
se
5.0
1.0
.0
.0.S ~ ~
-1.0
-E
'" -(l
)1.
0(J 0 - ~
0.0
'- a-1
.0
0.0 I
,I
,I
I,
Fig.
~.1~
Hol
list
erw
areh
ouse
-A
bsol
ute
disp
lace
men
tre
spon
se.

Ho
llis
ter
Wa
reh
ou
se-
19
86
Ho
llis
ter
Ea
rth
qu
ake
II
II
J-----.-
I
30
.0Gro
un
d--
----
----
-R
oo
f
25
.0
Wes
tR
esp
on
se
Tim
e,se
c
10.0
15
.02
0.0
Ea
st
No
rth
-S
ou
thR
esp
on
se
5.0
1.0
..S
0.0
.......
. c:-1
.0Cl>
.-E
Yo '"
Cl>1.
00 tJ - ~
0.0
'-C)-1
.0
0.0 I
,1
,,
,I
Fig.
5.15
(run
t.)
Hol
list
erw
areh
ouse
-A
bsol
ute
disp
lace
men
tre
spon
se.

Ho
llist
er
War
ehou
se-
19
89
Lo
ma
Pri
eta
Ea
rth
qu
ake
I,
---.-----
----.--
--.-
------.---------------,
10.0
Ea
st-
Wes
tR
esp
on
se
.~0
.0....
.: ~-1
0.0
Gro
und
-E
No
rth
-S
ou
thR
esp
on
seR
oo
f....
----
----
---
IN(l.
) u10
.0C
) - ~0
.0'-C)
-10
.0Ti
me.
sec
0.0
5.0
10.0
15.0
20
.02
5.0
30
.0I
I-
__
__
I_
__
l_
-I
_I
I
Fig.
5.15
(con
t.)
Hol
list
erw
areh
ouse
-A
bsol
ute
disp
lace
men
tre
spon
se.

Hollister Warehouse - 1984 Morgan Hill Earthquake
0.8 Channel 4 - Roof, Center (Unfiltered)
o. 0 ~'NH-VtH~1+Rl+I1fIIIcH1
-0.80.8 Channel 4 - Roof, Center (Filtered)
Channel 5 - Roof, West Wall (Filtered)
Channel 5 - Roof, West Wall (Un fJ'ltered)
c:~ O. 0 PNIVfP~ItMttf¥i't\NtttfttttttV¥awt7dftjl~iftMftMi~~~rr1f1!'~~:coI
g -0.8~ 0.8i:S~ 0. 0 ","""IMAf-lNtfllttl\1irfttttfl"tf
'-......~ -0.8 . (. 1\~ 0.8 Channel 6 - Mldpanel, West Wall Un filtered;
O 0 l....... .11••• '0 .M AJl.u.J...."••~~. . ,..,.... • CV> ~. [WVV"'lN\rvq" 'i~VVVVV" 4iF~VW\fY<;J. i/\lV\JJhJ <=l
-g:~ Channel 6 - Midpanel, West Wall (Filtered)
O 0
f-"".t.t.,~llAA ...h/\ t aA ,c~JlA.... o A. IIaoA 0" I). '-1. ...-,' , Vy4f 'r.,rv-. , Vvv -vv vvv "0. • • w v· '" •
-0.8 Time, sec
ao 1aO 2QO 3QO 4QOt I I , ,
c:: -0.8'- 0.8.•..:
Fig.5.16 Hollister warehouse -1984 Morgan Hill earthquake.
(a) Transverse relative displacement resp:>nse.
IS4

Hollister Warehouse - 1984 Morgan Hill Earthquake
0.2 Channel 2 - Roof, South Wall (Unfiltered)
Channel 2 - Roof, South Wall (Filtered)c:E O. 0 """"""""':~~~~~d-Ic7d-b"'o;f--lr?-"""'-.::::F-~~::V~~~Ql
g -0.2 .g. 0.2V Channel 3 - Roof, North Wall (Unfiltered)
CS /\ 1\.~ 0.0 ~n...o.A~~~~.....S2 -0.2
& ::;L~A~-'::"_:::~::~'\A-0.2r Time. sec
ao lao 20.0 30.0 4aOI , t I ,
-0.2·s0.2
Fig. 5.16 (cont.) Hollisler warehouse - 1984 Morgan HiD earthquake.
(b) Transverse relative displacement response.
ISS

Hollister Warehouse - 1984 Morgan Hill Earthquake
0.2 Channel 10 - Roof. West Wall (Unfiltered)
Oof 1\ f.A.,. /\ " 0 n u /\.-0. \:O? vv V"7 v \7" VO
-0.2
::;l,.. ~~~;:..~::~::::::;:: -.lC -02t'- o· ') Channel 11 - Roof. Center (Unfiltered)
~ o' Lo"~ ~.A _,~...-"",...,. ~ f\ /\ f\...,~ . ~~V·p'~\}\'7""~~
g -0.2~ 0.2 Channel 11 - Roof. Center (Filte1ed)
is 0 0 r~........ ' '+ Ie _ " b. __• _" 0" _ _ .~~ .~. vW .PO\) 9iV~~V • VV\j~~ cs
t -02L~ 0:2 Channel 12 - Roof, East Wall (Unfiltered)
O 0r/"\ A .~. oJ\-- A{'v>. f\ f\ f'-cv. -'»--VQV- \JVV ·V\}\VJ-0.2
:;l~~:::~.:::::::::;::::~-0.2r Time sec,
0.0 10.0 20.0 30.0 40.0t , , , I
Fig. 5.16 (cont.) Hollisterwarebouse -198-4 Morgan Hill eanbquake.
(b) Transverse relative displacement response.
156

Hollister Warehouse - 1986 Hollister Earthquake
0.8 Channel 4 - Roof, Center (Unfiltered)
0.0
-0.80.8 Channel 4 - Roof, Center (Filtered)
Channel 5 - Roof, West Wall (Filtered)
Channel 5 - Roof, West Wall (Un filtered)
O. 0 h'lAfw-lirM
O.O~\HM-
.S -0.80.8
~E o. 0 bd\Qj~IHIHflHW~MoItfiI~M++W:y.w.AH1ItfWJ\IiM:ttF'cM1'r1"rf"'w13~Pn'\';O""~~.><>o.t
Q>
g -0.8-~ 0.8CS
Fig. 5.17 Hollister warehouse - 1986 Hol1ister earthquake.
(a) Transverse: relative displacement response.
1'7

Hollister Warehouse - 1986 Hollister Earthquake
Fig. 5.17 (cont) Hollister warehouse - 1986 Hollister earthquake.
(a) (cont.) Transverse relative displacement response.
1.58

Hollister Warehouse - 1986 Hollister Earthquake
Fig. 5.17 (cont.) Hollister warehouse -1986 Hollister eanhquake.
(ti) Longitudinal relative displacement response.
IS9

Hollister Warehouse 1989 Loma Prieta Earthquake
60.0!
50.0!
Roof, Cen ter (Un filtered)
Channel 4 - Roof, Center (Filtered)
Channel 44.0 rO. 0 1---"""'"
-4.04.0
-4.0·S4.0
Fig. 5.18 Hollister warehouse - 1989 Loma Prieta eanhquake.
Ca) Transverse relative displacement response.
!60

Hollis-ter Warehouse - 1989 Loma Prieta Earthquake
0.5r ~:annel 2 - Roof, South Wall (Unfiltered)
O 0 __f\ f'\.,./\ F\ /\ A. -" /\ ,.,. L\ ~'V. ~ V\r \f V~~~~ V
.S -0.5 ~
1:::L~-#:::v-:a::out::':I/.:ilter:~ d
g -0.5 t% 0.5r Channel 3 - Roof, North Wall (Unfiltered)
] 0.0 ~vJ\AArv~o -0.5
Q3
Q: :::r ~:;:~::::orth W: (Filtered) ~
-0.5 t Time, sec
0.0 10.0 20.0 30.0 40.0 50.0 60.0, , I I I I I
Fig. 5.18 (cont.) Hollister warehouse - ]989 Loma Prieta earthquake.
(a) (cont.) Transverse relative displacement response.
161

Hollister Warehouse - 1989 Loma Prieta Earthquake
0.5Channel 10 - Roof, West Wall (Unfiltered)
Fig. 5.18 (conI.) Hollister warehouse -l989l..oma Prieaa eanhquake.
(b) Longitudinal relative displacement response.
162

163

§N/
7·
Co
ncr
.t.
WoI
IP
anel
.
~
r-B
eom
.
VN
on
-btlO
rln
gS
tud
Pa
rtit
ion
(Flr
ew
oll
).i
::
:
Wa/
I
• 10 ,I ~ • !- III ....
• C .1 ~
'2"
x1
4'
a.H.
Do
or
"IV
12"
)(14
"a.H
.D
oo
r
•S
o",
.22
'-0
'I
5B
a,.
.20
'-0
'I
I-2
J2
"-O
·"
Fig.
5.20
RO
Of
plan
-R
edla
nds
war
ehou
se.

fast
Wal
l
~1/2"
Ply
woo
dS
heat
hing
2"
x,,
"R
aft
ers
(12
4"
ole
,,"
x14
"P
ur/in
s(I
8'-
0"
ole
• C) .1 to) • C) .I ~ I
5"
Co
ncr
ete
Slo
b
-G
lula
m-B
ea;;
;-
--T-
----
----
--PilQste~
--. .S ~~st
Wal
l~
I~9
0'-
0"
H
Fig.
5.21
Trl
lnsv
crsc
cros
sse
clio
n-
Red
land
sw
areh
ouse
.

-J
!i
, rN
orth
E/8
votio
n
- !!
~
iI
So
uth
Ele
vatio
n
i
Ea
stD
evo
tio
n
Wes
tF
feva
tio
n
Fig.
5.22
Elc
vati
uns
-R
edla
nds
war
ehou
se.

rGlulam Beams r Tilt-Up Wall Panels
~s JIflO 1: Firewall
V9
r; a· 7~C0)
I J,, 8-I· 232' -I
Roof Plan
1
'D' 1I 12
IVFirewafl "c0),
J,I
232' ISlab Plan
ilJIrnllJll· 10 oJ 5 -----r-2 2B'-W-
11 12 iNorth Wall South Wolf
Elevation - West Wall
Sensors 1, 11, and '2 are mounted on the floor slab.Sensor 4 is mounted on the glulam beam.All other sensors are moun ted on the wall panels.
Fig. 5.23 Locations of strong-motion instruments - Redlands warebollte.
167

Redlands Warehouse
Cl'l 0.05 1986 Palm Springs Earthquake - NS
4o.oo[.~I~~M"~ ..~ -0.05 .~ 0.05 1986 Palm Spnngs Earthquake - EW
~ o.oo[,.__~."_.,,en -0. 05 Time, sec
0.0 10.0 20.0 30.0 40.0 50.0 60.0, I I , , , I
Fig. 5.24 Measured ground accelerations - Redlands warehouse.
168
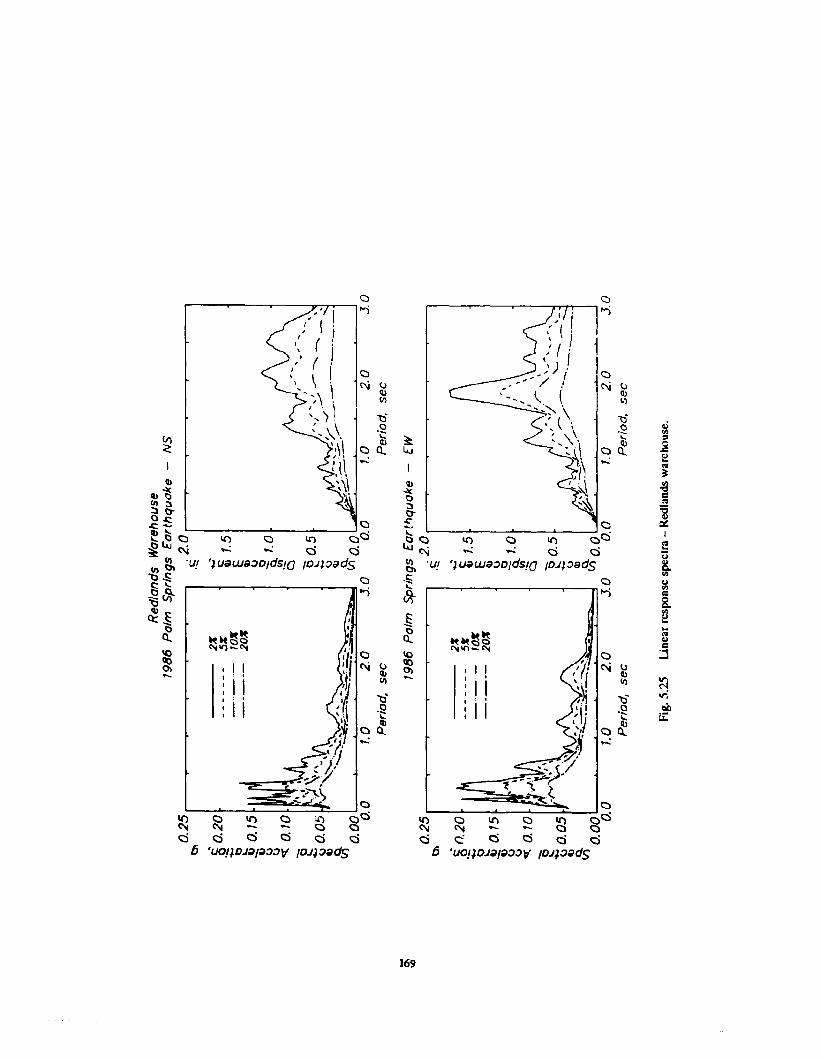
2"
-------
S"
_..-
-7
0"
-----
20
"
Red
land
sW
areh
ouse
19
86
Pa
lmS
pri
ng
sE
art
hq
ua
ke-
NS
0.2
51
ii'iii
.2
.0,
,,iii
,
~~
§0
.20
'-.... t) ~0.
15
" ~ '<{
0.10
....; ~1.
5~ <J t) ~
1.0
cS15
(~\;
.I~
-..
'r/
"-'I
\'.
00
5"
I....
OO
&.·
-'''-
\''\
\...
.-"I
,~-.....-.....
<J•
;.J
\V·,
--..
,:,~
ti,'
..../-
-,'
~..~
~'~'--~----'-'---"-
Vj
-......
.:...
.~..::..~~-;
..::..
::..-
_~
~t':?~'.:::::-;
0.0
0--."
--lt
j0
.0-
!!
I
0.0
7.0
2.0
3.0
0.0
1.0
2.0
3.0
Pe
rio
d.
se
cP
eri
od
.se
c
£w
2"-------
5.1'
_.._
.-
70%
--_
.-
20
"
19
86
Pa
lmS
pri
ng
sE
art
hq
ua
ke
0.2
51
'iii
I.2
.0iiiiii
i~
~
§n
.20
:;:; o ~0.
758 u ~
O.TO
...: 5i
1.5
~ (,)
t) ~7.
0.!!! C
l15
J'IV
~..:\
-~
-""\
:...
~0
.5<J
0.0
5\
"....
",~-
_(,
)<::
l.....
..:::...
--.;:••:'
'-,
"...
Q)
Vi
'-==
::::
i:"'
~---
-:--
~_
Q..
0.0
0ltj
O.O
·...
.•
!!
•'.~
0.0
1.0
2.0
3.0
0.0
7.0
2.0
3.0
Pe
rio
d,
sec
Pe
rio
d.
se
c
;: \0
Fig
.5.
2..')
Lin
ear
resp
onse
spec
tra
-R
edla
nds
war
ehou
se.

Redlands Warehouse 1986 Palm Springs Earthquake
30,0.25.0,
Midpanel. West Wall
Channel 6 - Roof, South Wall
Channel 2
Channel 5 - Roof, 1/4 Point West Wall
Channel 4 - Roof, Cente,.
.' o ....".h.~ ... 1411~A ••• ftn .... I •• ~. to ....... "eO 0
I .... ' "7W4f\{~l/4IJVY'V••VY"'\iV iffW'Ohvli W., ·ViY.. •
Channel 3 - Roof, West Wall
... <to AlliAAA~ •• l"'1I11A4".l\lIlt l •• ~ U .• A'" ,. IIi Ii I$fFV f~V"'"VV''' "1I1.\I~ tv", .. 'iF 1i ~'" .. tVi.. •
-0.20.2[o. a ------v~~\IlIt"r,.,fl"'J#tIW\'f1,.,.~'---'l"l,...o/;III·..'"'..,.'.....".lI""'1J.'\".""""'''IIl'4'~''''''''''''''o --i
-0.2:; [ -""c-h....a""'.n..";"':~:IIIll~,,.,~2..,.C""'4~"-~...."'..,:....:"""~..,.,u.,,.:"""'1:,...."#o,._~""'~_:.."t_~....a_I_I ._-I
-0.2 Time, sec
0.0 5,0 10.0 15.0 20.0, I I ' I
0.2[0.0
-0.20.2[0.0
-0.20.2[0.0
~.
Q
~ -0.2o~ 0.2-Q)l>l>"(
Fig. 5.26 Redlands warehouse - 1986 Palm Springs canhquake.
<a) Transverse acceleration response.
170

Redlands Warehouse 1986 Palm Springs Earthquaker""'----r----....---.--,------.------.-------,
Channel 9 - Roof, South Wall
30.0,25.0I
Channel 10 - Roof, West Wall
c:'
~ -0.2o~ 0.2
f,. 0 0 -------·r,Ji..~.~WW~I~A~··~........·IIoI\·III'i..~./tI..tIf....,·~·-"""""'......_-- --4Jv . ~...._.r ... f •.,.-r ..... """" .... v ". • ,
<:(
-0.2
~:: [ C_h_a_n"'rl:...:~~".-r..-.:l,...,/v'.",."._........~~...:...-:"".:IW:IIO,.~"""","""'......W1....e.....s_t_Wi_a_'_'__---__--I
-0.2 Time, sec0.0 5.0 10.0 15.0 20.0
• l I , •
Fig.5.26 Redlands warehouse: -1986 Palm Springs earthquake.
(b) Longitudinal acceleration response.
171

Red
lan
da
-l-
ato
ryW
areh
ouR
e(C
SKIP
Sca
tio
n23
495)
Rec
ord
2J49
5-C
Ol1
5-92
182.
02
~III
II
iI'
I'
II
II
I"
'I
II
II
II
;I'
II
I'
II
II
I'
I"•
;"
I'
1:
;,
I',
I·"
I"
1,
,.I;
I·I
,•
I1
,"
I·i
I--
---
--
--
..--
-------
---
.._.
.--
-----
--
--
--
---
--
-.
.
~G
roun
dF
loo
r-
Up
_.
...._
,......-=
n...
........
.......~,_
.....-
......__
........
.I'I,J
""'-_
.....-..
.,....
..,.-..
......~'
:""'_
_
4..
Cen
ter
-E~
.........
---:I
..i-
len
gth
po
lpt
of
Wes
tW
all
-E
.."
,..:
...~
6..
Cen
ter
of
So
uth
Wal
l-
E-
-I7
..C
en
ler
of
No
rth
Wal
l-
E.... to
olt- I- A
Dn
nf.
r._n
>_r
of
Eas
tW
all
-N
! :11
Gro
und
Flo
or
-N
----
----
----
----
----
----
----
----
----
----
--.
12..
E-
~~
Str
uct
ure
Ref
er.e
nee
Ori
en
tati
on
:N
-O·
I••••••••••••••••••••••••••••••••••••••••
1•••••••
i·"~..
..,.,.,..~--.
.--~---------------------------------·
'b1·11I1;t·,·~·II~III~II;
11
1·1
.,I
,.,
,:'1
0I'"
'"'1
5"
,.
"2
0'2
'2S
ee.
Fig.
5.27
Red
land
sw
areh
ouse
.-19
92L
ande
rsea
rthq
uake
[66
J.

Red
land
s-
I-st
ory
Var
ehou
s.(C
SHIP
Sta
tio
n23
495)
-.I'
II
II
II
II
II
I.I.
II·
I'
,.I
.I
II
i
------
-----
--
--'
.'---
--
Rec
ord
2349
S-C
OI1
S-9
2l82
.02
..
------
-------
--
--
---
--
--
-.
- ~
rM
alt.
Aceel.
-0
.04
g
l~~
Wi'
....
....
...
....
.T
""--'~"
"I
0.2
4g
0.1
2g
8:0
.12
g
~~~MW#~
0.4
8,
AA
_..~~~~~~~~
~O,l2:...L-g
In,.
...".
·
0.1
2g
0.1
0I
....
....
....
....
....
....
..-.
....
....
....
....
...
.~----------------------------------------------
22I
II
.I!
tI'
'25"
"I'
II:
II'
I,'.
30
'•
.I'
35".
40'
.44
Sec
'.
Fig.
5,27
(con
t.)R
edla
nds
war
ehou
se-1
99
2L
ande
rsea
rthq
uake
(661
·

Red
lan
ds
-I-
sto
ryW
sreh
ou
se(C~KIP
Sta
tio
n23
495)
ieco
ld2
34
95
-Co
I15
-92
18
2.0
5
-..... ....
--
------~--
-------
--
--
..
-_
_-
--
--
--
-_
_•
_.
'w_
.!.-.x;o~~F~~-.~f..
.,.......
...........,.~&
.....~__
•.,...~t.~~
..,..
.,"
u..
....
.~......
Max
.A
ccel.
-O
.06
.s.
lO
fCent~r
o!.
.Nort~,:al1~~~V"'
0.1
8R
oof:
Cen
ter
of
EaB
tW
all
-N
'II"V-"\~-'
...~~
_2.
:.1.4~
9"
Cen
ter
of
So
uth
Wal
l-
.No
!,
"'
:,.:
•,••
I~.
~,
:•..',.
,,',
".,.,'.
0.4
4g
---*
"'<'
I"I"
'w.J
..~H
:'My
,,.t
{~\,
\,,/
\f~I
:1~/,;
""'·/.
'·f.;"
';~·;t·~~
,"r..l
'/~,.'
:;J::,
,~I,·.
,':!J
[11\1
:'.'
/'.
""",:
,'"./,
/,.",:
,,,,,,
,,,:"'
.hI'/v
'N"""
"W..
/I
1'1
("",
I',~
IJ.
•.,
Il'
,.
.,'
J••
.'
•
.-
,------
--.
---.-
10
.13
10"
Cen
ter
of
Wes
tWa
ll~'
l.fv
v'..
rJ'V
I/YJ
'w.,
,"~"
'''.
J.,,
\.''
\A.I
'~''
''''
'''
11G
roun
Flo
or
-N
0.1
3g
12
"E~~M
0.1
7g
Str
uctu
reR
efer
ence
Ori
en
tati
on
:N
-O'
....
....
....
....
....
....
....
.....
....
....
....
..--
----
----
----
----
----
----
----
----
----
----
----
-o
2J
45
1015
2022
Sec
.
Fig
.5.2
8R
edla
nds
war
ehou
se-
1992
Big
Bea
r1'.a
r1hq
uake
[37J
.

Redlands Warehouse - 1986 Palm Springs Earthquake
1 0 Channel 2 - Midpanel, West Wall
~·~r~1.0 Channel J - Roof, West Wall
~:~r ~Ny -A.6'~.' ._••••
1.0 Channel 5 - Roof, 1/4 Point West Wall
~:~f ~A-_M~+'1. a Channel 6 - Roof, South Wall
0.5
0.0
~:~0.0
0.0 1.0 2.0 3.0 4.0 5.0 6.0 7.0 8.0 9.0 10.0Frequency. Hz
Fig. 5.29 RedlaDds warehouse -19% Palm SprinlS earthquake.
<a> Normalized Fourier •.mplitude spectra o(uansverse acceleration response.
17S

Redlands Warehouse - 1986 Palm Springs Earthquake
~~.~~~~~
~ 1.0 Channel 9 - Roof, South Wall
~ ~·~t~._. __~\... .
i ;:~t~ 0.0
§ 1.0 Channel 11 - Ground, West Wall
~ ~:~[0.0 1.0 2.0 3.0 4.0 5.0 6.0 7.0 8.0 9.0 10.0
Frequency, Hz
Fig. 5.29 Redlands warehouse - 1986 Palm Springs earthquake.
(b) Normalized Fourier amplitude spectra of longitudinal acceleration response.
176

Re
dla
nd
sW
areh
ouse
-1
98
6P
alm
Sp
rin
gs
Ea
rth
qu
ake
,---~----
I--.------
--
---r---
---
----
---.
--I
------,
~f\.
1\
J'o.
~vv
I\.
1\
\OJ~
~
0.5
Ea
st-
Wes
tR
esp
on
se
. .£0
.0....
: c::-0
.5Q
)G
roun
dE
No
rth
-S
ou
thR
esp
on
se--
----
----
-R
oo
f-
Q)
-40.
5-4
u 0 - ~0
.00- C
)
-0.5
Tim
e,se
c
0.0
5.0
10.0
15.0
20
.02
5.0
30
.0L
----
II
__
J._
----'----_
__
1_
J
Fig.
5.30
Red
land
sw
areh
ouse
-A
bsol
ute
disp
lace
men
tres
pons
e.

Redlands Warehouse - 1986 Palm Springs Earthquake
::~Lv Q~~~.;::;:t.::.~u:r:=~). _.,-0.3f
::~t ~~a~~::::(~il.t~~.d:.S -0.3L
1::~L~Q:~~':::::/:~:~~__ "g -0.3f
~ ::~I .~~a~;::~t~:::iltered)
ii -0.3 Channel 5 - Roof, 1/4 Point West Wall (Unfiltered)Q:: 0.3
0.0~"""~l\d
-g:~ Chann I 5 - Roof, 1/4 Point West Wall (Filtered)
O ot n ," ,~ , ., 0 On.. I
-0) woo· ..·..··;I"'lr·'II'·..·'·:·e~· ::~.., ·V ¥w •
0.0 10.0 20.0 30.0 40.0I , t , ,
Fig. 5.31 RcdIandl warehouse - 1986 Palm Springs earthquake.
<a) Transverse relative displacement response.
1711

Redlands Warehouse - 1986 Palm Springs Earthquake
o 1 Channel 2 - Midpanel, West Wall (Unfiltered)
o·~rw~Jv¢-~~-g. ~ Channel 2 - Midpanel. West Wall (Filtered)
0 '0L ~.. 'vI·'·w······ , ".r''W"Ywv,~ fiii If .. tV ,ITorp' rTV V 'v VI." O'
.S -0.1O. 1~ Channel 6 - Roof, South WaH (Un filtered)
~ 0 0 _r"-. rJ\ 1\.1' ~.I'\ ,. '" A 1"\. II ~ - b J\M - 1\ f\ A A f\4~ . \r\( v.., VVV W'"P\i"\J-V \Tv V· \[*\JY\j'\JV
g -0.1-~ :..~~, ~h=::, ,~:~:/~:.t~V.:::'~:~:~' .~:.:~ -0.1Q)
a:: O. 1~ Channel 7 - Roof, North Wall (Un filtered)
0.0 '"'\jf\{'-" Jv:J\J\A ~.f'>oJ\}
-0.1
_:~~. c:::~.~.::::::h::/~(:/:te::~ 4 • l
0.0 10.0 20.0 30.0 40.0, , , , ,
Fig. :S.31 (cont.) Redlauds warehouse - 1986 Palm Springs earthquake.
(a) (CORl) Transverse relative displacement RSponse.
179

Redlands Warehouse - 1986 Palm Springs Earthquake
Channel 9 - Roof, South Wall (Filtered)
.....;c::E0. 00 """~I-#f'I,~<b
~0.06~ 0.06is<b 0. 00 ~"""UIIN....~'-......~0.06<bct 0.06~ Channel 10 - Roof, West Wall (Unfiltered)
O 00 __ /\ I"'\.. <' 1"\ I\. eO..... ~ /\ 1\ "-- A " <'" 1\ /\ 0-,. ,,\]V ~\;IF'" ~. ~V~c#~u V<::J v v"'
-0.06
:::: ~ Chan:el, 10 •• ~~Of, West Wall (Filtered)
- 0.06 Tim e, sec
0.0 10.0 20.0 30.0 40.0....' -----'........_--_....'----_......'----------"
0.06~ Channel 8 - Roof, East Wall (Unfiltered)
O 00 _~ ..... 0. .... .,},~ -- A.o. .J\ Ito ~ f\ 1\ ,... _. A 1\ 1\ ~ " ,.... f\ (\ •. - • v - VR \IV W~iV ve;yvcrWV\l~<J<..T\T9 v
-0.06
::~:~ Ch::1 ~~~-•.:~. Eas:.:': ~F:tere~~ ,
.r:.-o. 06 Channel 9 - Roof, South Wall (Unfiltered)- 0.06
Fig. 5.31 (cont.) Redlands warehouse - 1986 Palr.1 Springs earthquake.
(b) Longitudinal relative displacement respoose.
180

181

.D-.~ .o-.IMI • •o-.ar • .,.. • .a-.zl
.O-.IMI • •a-.n •~ 11
1~I!::!-.. ,a~ • • •
~o:Jl :g.s
"tl '=• /I /I ,...J:;::s
~!Ql -;Q -c1:': ~Ic:i 0; =0 -0
.' } i ~ c:
I I ~ /I Ii .s oil~
! tl 's.0
I l • ~
~..
j < ~.I~ f l! J ~ I• I 1 J I l!l!
..~ ~ •
j J ~ i" Ic:i
~ 1 it ..I~
~8. j .. 1 u:::.. -~ (f).. I,; ,; S CI 0; ~.. .l:: .n
"I.;:.. oil
III t!:
• ~
182

.O-.Qel • • O-.or • a(1Ifl ~ .O-.~j
.O-.Mj - .o-.n.~ s
.. .. ..
• .. •
;".., .. • • . .. ...~
•0 j.'~...•I -J .•.. J '.',. ;:=-::
" I l ~
I E...Iii~
..~.on ~ .:...
J~.. ...~ o·
.... ) ~..til .. S
.~li .Ii! oL... , ..... ... . . "., .
~
183
oilI:
!;)\§
~'S~
~ -;~ 'C
~~:J
'0., .5~ <II...£; §.~
:0.:: :i~ I~
~I ..§
'"S...Ii: 8~
c:::"":'
Vi CI 0
1:1 ..::!.-~IJ
<'l r"'lr"'l.....:oilti:

North Elevation
South Devotion
East Elevation
West Elevation
Fig. 5.34 Elevations - Milpitas industrial building.
184

180'-0·
I
~" Sf 1IC)1
~I
t 4 J1 IRoof Plan
® L '28t1I
C)
.1C)C'Ij
Ref. N -(N 25 W) Jt 7
Second Floor PIon
168'·-0· I
910 t1L '3
I
c.1
~-J
Slob Pion
Fig. 5.35 Locations of strong-motion instruments - Milpitas industrial building
18'

Milpitas Industrial Building
1989 Lorna Prieta Earthquake - EW0.15 [
0.00
-0. 75
0.15 1988 Alum Rock Earthquake - NS
_:.~:~." M'~ 0.15 1988 Alum Rock Earthquake - £W
Time, sec0.0 10.0 20.0 30.0 40.0 50.0 60.0
l...' ....l.' ....t.' ...J'''"'"--__-......' .....' __---',
Fig. 5.36 Measured ground accelerations - Milpitas industrial building.
116

NS
...: t0
.75
~ o tJ Q.0
.50
.~ c ~0.25
....... o III «::l
..(t
j0
,00
'"
,'
!t
I
0.0
1.0
2.0
3.0
Pe
rio
d,
sec
M/1
pita
sIn
du
stri
al
8U1'
ldin
g1
98
8A
lum
Ro
ckE
art
hq
ua
ke
o5r
',
,,
,j
.1.00
,,
,,
,,
,~
S2%
r::.'0
4-
--
--
--
5%.~
._
..--
10%
.....
-----
20
%
~ _0.3
ti t: '"(0
.2
~ o0.
1ti Q
..
~'~""".
I0
.0,~
aD
~o
20
30
Per
iod.
sec
£w
...: ~0
,75
~ o tJ ~0.50
£S ~0
,25
....... o 'll Q.,
(tj
O.0
0I
.<!
!I
II
I
0.0
1.0
2.0
3.0
Per
iod.
sec
2% 5% lOX
20
%
19
88
Alu
mR
ock
Ea
rth
qu
ake
.1
.00
,,ii'
ii
.~
0.5
,,
,i
,i
,
tJ> a'0.4
:0:; ~ "ii
0.3
o o ~0
.2
~ o0.
1ti ~o.o
l.~,
I0.
0~o
20
30
Pe
rio
d.
sec
00 ~
Fig.
5,37
Une
arre
spon
sesp
ectr
a-
Milp
itas
indu
stri
albu
ildin
g,

1.0
2.0
3.0
Pe
rio
d,
sec
1 "/
/'/.-
--...
.,J~,
..,..,
-'/.
.-,/'
",,~.
_.-./
.-~.
.2:;:
:-•.
.::.
::::
-.-
'-0
.0'
.".,
--ii'
!I
0.0
......
12.5
t ~ro
.oII o -a.
7,5
.!!l
t:::l
5.0
e t2
,5III ~
Milp
ita
sIn
du
stri
al
Bu
ildin
g1
98
9L
om
aP
rie
toE
art
hq
ua
ke-
NS
.15
.0.
i,
,,
iI
.~
2~
----
---
~~
_..-
-10
%-----
20
%
7.0
0,ii'iii
0'1 c: ~0
.75
o ~ "'ii tl0
.50
~ ~0
.25
o ~ ~0
.00
',ii'
,i
0.0
1.0
2.0
3.0
Pe
rio
d.
sec
EW1
98
9L
orn
aP
rie
taE
art
hq
ua
ke.
15
.0,
ii
tiiI
.~
1.0
0.
ti
,iii
0,
i
2~
-----.-
5~
_..-
-10
%-----
20
%
0.0
'...
......
.,iii
!I
0.0
1.0
2.0
3.0
Pe
rio
d,
sec
....:12
.5~ ~
10.0
II o Q7.
5.!!! ~
5,0
e '02
,5II
I
~
CO ~0
.75
e ~ "'ii tl0
.50
~ ~0.2
5o ~ ~
0.0
0'
II
!!
!I
0.0
1.0
2.0
3.0
Pe
rio
d.
sec
Fig.
5.37
(con
t.)
Lin
ear
resj
XlD
sesp
ectr
a-
Mil
pita
sin
dust
rial
buil
ding
.

Milpitas Industrial Building - 1988 Alum Rock Earthquake
20.0,15.0,
Channel 4 - Roof, North Wall
d • t~ AJA,W hAt.IA. t oU." ...'v V L \if,. , "Y,""" ""7 , 11
_:: [----~rf~I.~..~~V"""~...,..:W.:""":o"'\:......~-'._3_-.............R_O_O_f._'_E_a__s_t_VVi_a_II......-----i
0.3[0.0
-0.3
::~ [ ~QIIt~"M"'tiJo~«'I~"":""'..nW\,n~ot.,..,e~~."'-".~~.""". ~...rN.Rw.......~_o_f,_~_e....s...t_~_a_~,po ---l..
c::.2..... -0.3
J_::: [-__"""lU:P>"h~~..oIc:J"p,..~\"'\.~,...:,..~1\yo.:,,\OOo.~....:_.~~...-..........,....s_e_c_o_n_d_FI_o_o_r_,_E_..a_s_t_~_a_ll.......j
_::[__.. -....~~::::e~:w ~:~C,ond ~oor.•:orth wa':
_ :0:.;3 [--_"'IIf'e"'oHt
8~"6....~...: •.",.~nollo..no"'lo,_e:.....",,,,~_..,.._G_r_O_Un_d_,_E....a_s_t_~.......al_I__--1'l
Time, sec0.0 5.0 10.0, , ,
Fig. 5.38 Milpitas induslrial building - 1988 Alum Rock earthquake.
(8) Transverse acceleration response.
189

Milpitas Industrial BUIlding - 1988 Alum Rock Earthquake
0.3
-0.3
17 Roof. East Wall
~ O.3
fI;) 0.0 ~
~ -0.3(.)
~
Channel 12 Second Floor, East Wall
_ ~~, • .... to _. ;; •4'1 4 Vr 'V11'f ... " Vi' '&7"
::; [ ..IlcJ\vl""4rA"Afl~Ml¥riIWC':""~'"a~.....~n~,"e_~_._13_.__G.....r_o_u_n_d_,_E_G_S_f_Wl_a_II_----t
-0.3
0.0, 5.0,
Time, sec10.0, 15.0. 20.0,
Fig. 5.38 (cont.) Milpitas industrial building - 1988 Alum Rock r.anhquake.
(b) Longitudinal acceleration response.
190

Milpitas Industrial Building - 1989 Loma Prieta Earthquake
Channel 5 - Roof, West Wall
Channel 7 - Second Floor, North Wall
Channel 9 - Ground, East Wall
Channel 4 - Roof, North Wall
Channel 6 - Second Floor, East Wall
Channel J - Roof, East Wall
• "4H."L~"~" , . Ao._ • ..v. .At.W" A'llrnr · lfW44f ~vV=
.. ...".."" if .LMh.~ -.LNI\u •. ",_. d\,o .1\-.. Adtf V't ,...,.., F'i'''V ...~J. VVv 'Mil vV
.. ''4~'W''j~.' tt4\- A~ .J!Il............. av ~1 'i'iiVv- ,.. y"'Ji
0.3 [0.0
-0.30.3
-0.3
0'1 0..3 [0.0
! -0.3
~ 0.3[u 0.0~
-0.3
o.3[0.0
-0.3
0.3 [0.0
-D.."! Time, sec
0.0 5.0 10.0 15.0 20.0 25.0 30. a",-,--_.....'--_-...'--_....'--------",-----'-,----,
Fig. 5.39 Milphas industrial building - 1989 Loma Prieta earthquake.
<a> Transverse aceeleratioa respoase.
191

Milpitas Industrial Building 1989 Loma Prieta Earthquake
Channel 110.3
0.01--......
-0.3
East Wall
Channel 12 - Second Floor, East Wall
0.3 [0.0
-0.3
0.0, 5.0!
Time, sec10.0 15.0 20.0
, I I25.0
!30.0,
Fig. 5.39 (cont.) Milpitas industrial building -1989 Loma Prieta eanhquake.
(b) Longitudinal acceleration response.
192

Channel 5 - Roof, West Wall
~Channel 6 - Second Floor, East Wall
~
Milpr"tas Industrial Building - 1988 Alum Rock Earthquake
~:~['---_....I.~..!.:_..~_......c_h_an_n.....e_/__:..3~~__R.....O~O_f,__I.£....:asL..t__l.VVJ_Q.ll.._II.....;__II~~~~0.0 -
Channel 4 - Roof, North Wall
~~[~O'O----"'IL..-l.....:...-~_.--J'----'I--- .........-..L..-=....;..;......~'---...c.;;..:~=~
1.0 r0.5 [
0.0
~:~[0.0
~:~ [_~~.lL.-L.-_.L..C_h_a_n~n_el.:-...9....L-.-_G-,r.....o_u_n_d....' __E._a_s....t........~....a_"........~'--~0.0
0.0 1.0 2.0 3.0 4.0 5.0 6.0 7.0 8.0 9.0 10.0Frequency, Hz
Fig. 5.40 Milpitas industrial building - 1988 Alwn Rock earthquake.
(a) Normalized Fourier amplitude spectra of transverse acceleration lapoDSe.
193

Channel 11 - Roof, East Wall
~:~[0. 0 ....a..;--l.L~-----L__----&_---J~----'~_L......:.-----I'""--_...J....:....---=:L~~
0.0 1.0 2.0 J.O 4.0 5.0 6.0 7.0 8.0 9.0 10.0Frequency, Hz
Milpitas Industrial Building - 1988 Alum Rock Earthquake
1.0 [~ 0.5::3~ 0.00..Ej ~:~[ . J. Chlan~e~;.1\;:;;d Floor, Eas~ Wall
0.0[ :"b(l)
.~
15EQ~
Fig.5.40 (coot.) Milpitas industrial building -1988 Alum Rock eanhquake.
(b) Normalized Fourier amplitude spectra or longitudinal acceleration response.
194

Wall
~:~~:,-, ..1 0 Channel 4 - Roof, North Wall
~:~~.o
Milpitas Industrial Building - 1989 Lorna Prieto Earthquake
Q)
"b:::s......
~ 1.0~ChanneI5- Roof, West Wall
'<:{ 0. 5~
.~ 0. 0 _·d.::Oe.e~_"""'.c:::eeo..._
:::s
~ 1.0 [' Channel 6 - Second Floor, East Wall
.~ 0.5 .L"§ 0.0 J N>= t oC=o. •
§c~
~~~::,t :0/:0.0 1.0 2.0 J.O 4.0 5.0 6.0 7.0 8.0
Frequency, Hz
< I
9.0 70.0
Fig. 5.41 MilpilaS industrial building - 1989 Lama Prieta earthquake.
<I) Normalized Fourier amplitude spectra of trallSVerse acceleration response.
19S
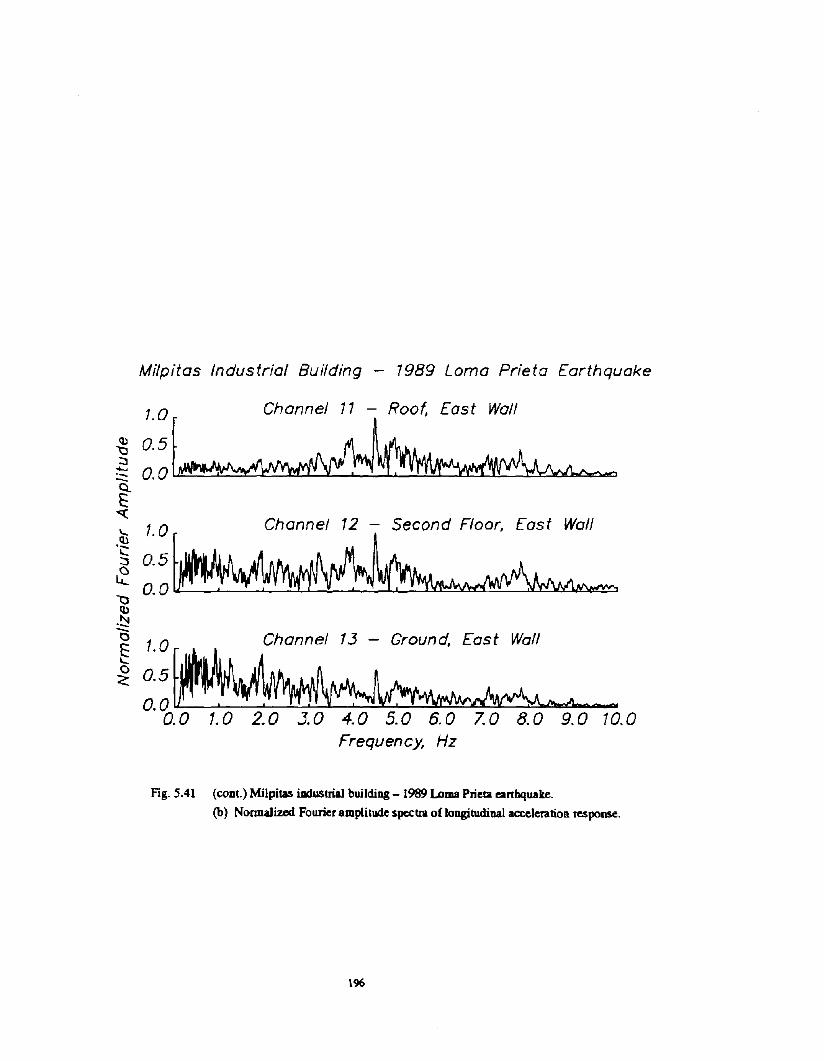
1.0 Channel 13 - Ground, East Wall
~:~~ .•..O. 0 1. 0 2.0 J.O 4.0 5.0 6. 0 7. 0 8.0 9.0 10.0
Frequency, Hz
Milpitas Industrial Building - 7989 Loma Prieta Earthquake
~ ~:~_ 0.0Qf:""(
~ ~:~0.0
1)CI,)
.~
"0~c<:
Fig. 5.41 (cont.) Milpitas industrial building - 1989 Loma Prieta eanhquake.
(b) NOllDalized Fourier amplitude spectra of longitudinal acceleration response.
196

Milp
ita
sIn
du
str
ial
Bu
ildin
g-
19
88
Alu
mR
ock
Ea
rth
qu
ake
.----
,I
,-
---~---.
0.2
5E
ast
-W
est
Re
spo
nse
Gro
und
----
----
---
Ro
of
So
uth
Re
spo
nse
No
rth
l "Clo,,"
--fl~Ptl
ll:d~~J~
~~~'rrl~
;l~~~r-.
r;ltJ't;
;1'Ijf::
~~"::::;
Jr~""'~"
"-'V'f'...=...
.:n~(~tjl~lt,"
'-'QV.......
....rc;.
;}'(;;
;>fr"
l'--1
•W
'~
•,--,
c::zr
--,>
t::0
00
-....~
I'1
hJiJ
W""-.
A"\
f,JIti
~~~
........
"'~Y
-'_.0
....... ~-0
.25
E ~0
.25
tJ Q..
0""
""
·\
I\.
-(>
.I
,,,0
0I
<"'...
.....-
t1W
"'">
db
tl'
AA
••
AI"o
Cto
,.\:F
V"C
F~
IJ
""',
.,..
...
(.V
Ic;
y,7
,Y
;:I
0cS
.-0
.25
~
0.0
5.0
Tim
e,se
c1
0.0
15
.02
0.0
,,
I1
,
Fig.
5.42
Mil
pita
sin
dust
rial
buil
ding
-A
bsol
ute
disp
lace
men
tre
spon
se.

TI
Gro
und
----
----
---
Ro
of
,I
-T
Bu
ildin
g-
19
89
Lo
rna
Pri
eta
Ea
rth
qu
ake
Ea
st-
Wes
tR
esp
on
se
No
rth
-S
ou
th,R
espo
nse
Milp
ita
sIn
du
str
ial
I,
10.0
·S0
.0..
....... ~
-10
.0-
E~
QJ
10.0
(J 0 - ~0
.0'-C)
-10
.0
0.0
5.0
Tim
e,se
c
10.0
15.0
20
.02
5.0
30
.0,
II
,I
I,
Fig
.5.
42tc
onl.
)M
ilpil3
Sin
dust
rial
buil
ding
-A
bsol
ute
disp
lace
men
tre
spon
se.

Milpitas Industrial Building - 1988 Alum Rock Earthquake
25.0,20.0,15.0.
_::::r' ::;::h~.-" R:f~. E~~t :"v(~:filtered)
~ _:::: ~__~"W:~:'lh:""'4~.W\~,....e~.".... _3_-,,,,,,,._R_O_O_f,_E_a_s_t_VVt_a_"_(_~_;I_te_r_e_d)_---i
'- 0: 08 Channel 4 - Roof, North Wall (Un filtered)
~' 0 00 ~ Oe''''--~'~ Il. ... " !I.J\ II Ow" r·L. "' ....E . \Q ;',-.. 14 y. v '\TV \TV vvwvvq.,.(l){J
~ -g: g~ Channel 4 - Roof, North Wall (Filtered)
i-:.::~ ~~.~. ~,~*,.~.(1)
n, ::::l;~:::f~.::;a~~:fi:ered)
-o.oat:.::f :.::n:~ : ,- Roof, West Wall (Filtered)
-0.08 f Time, sec0.0 5.0 10.0
• I ,
Fig. 5.43 Milpitas industrial building - 1988 Alum Rock eanbquake.
(a) Transverse relative displacement response.
199

Milpitas Industrial Building - 1988 Alum Rock Earthquake
Channel 7 - Second Floor, North Wall (Filtered)
•••••~L&JdIWU""".. ~"I'f'Y.........--''''''''.~!f'Io-uWW''''', _••~.-----I... , "~I r, I" nv,"",·"vn .,. " U"
25.0,20.0,
::::~~.con:_F~~O:~:s::::~~nfiltered)
-o.os[::: ~ c:m:::.6",- Second Floor, East Wall (Filtered)
c: -0. OS Channel 7 - Second Floor., North Wall (Unfiltered)'- 0.05 /......'~E O. 00 ~~-+-W~~lflIiltflrtfi'ltr~If*HI~+t+~f+t-;fH~""f-"'P~---IQ.l
g-0.05
~ 0'05~<ll 0. 00 -~'-.......~ -0.05
~ 0. 05! Channel 8 - Second Floor, West Wall (Un filtered)
O 00 /\ A n.r\ '" .J"I...... t'\ A _ " A _.J'\. /"\. f\ f\ . I. ~V\j'YV V w* O~ VV\JV --ry-v
-0.05
::::~ Ch::: ,8,~, Second Floor, West Wall (Fi'ltered)
-0,05 [ Time, sec0.0 5.0 10.0 15.0
, let
Fig. 5.43 (cont.) Milpitas industrial building -1988 Alum Rock earthquake.
(a) (cont.) Transverse relative displacement response.
200
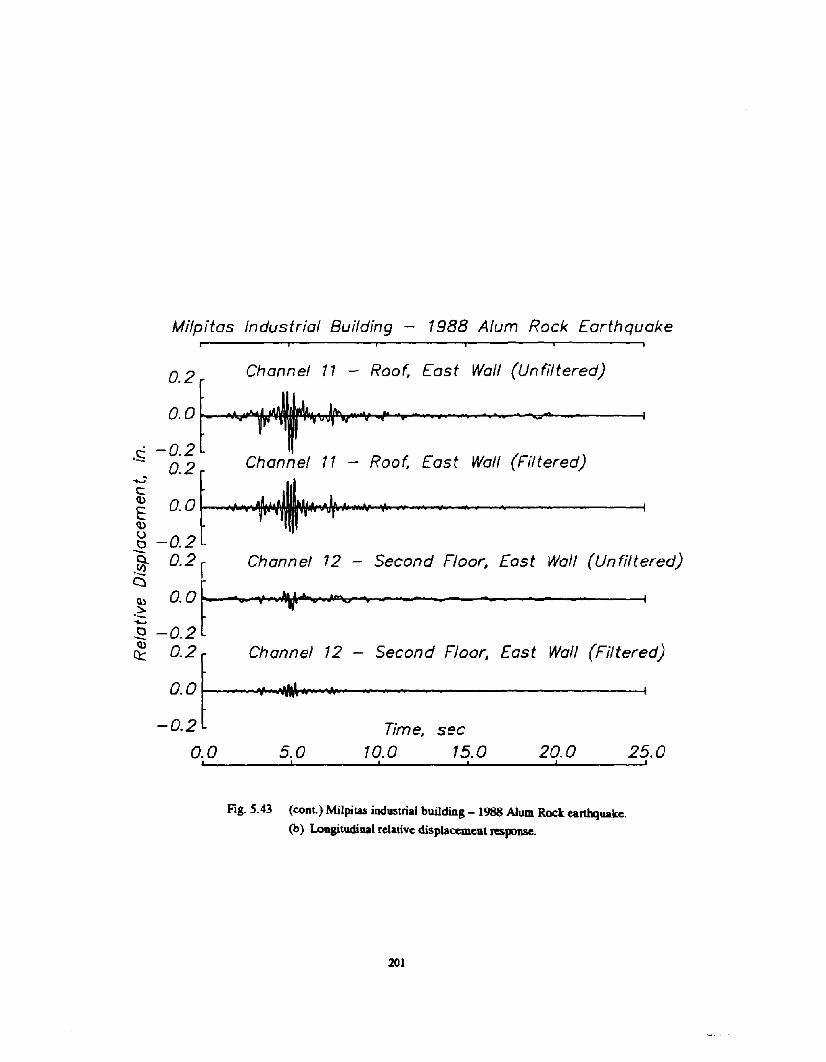
Milpitas Industrial Building - 1988 Alum Rock Earthquake
Channel 72 - Second Floor, East Wall (Unfiltered)
25.0I
20.0I
•-
Channel 11 - Roof, East Wall (Unfiltered)
·"~4"" .. .. ,
-+-'\' ... '.*. -." .. "'"~Channel 11 - Roof, East Wall (Filtered)
0.2
10.0
-0.2·st 0.2
rE 0.0q)
g -0.2 L
% 0.2 ri O.O~.2 -0.2 t~ ::; ~__c""",,:,...,O~~IIII;IW':1r\O.:.....:w:_-_s_e_c_o_n_d_f_-'_o_o_r,_E_as_t_W;_a_'I_(F_i_It_e-fred)
-0.2 Time, sec
0.0 5.0 10.0 15.0, I I ,
Fig. 5.43 (cont.) Milpitas industrial building - 1988 Alum Rock earthquake.
(b) Longitudinal relative displacement response.
201

Milpitas Industrial BUilding - 7989 Lorna Prieta Earthquake
0.4 Channel 3 - Roof, East Wall (Un filtered)
O 0 ~f\ f\ f\ ro.. tV\ f'-\. ./\0 /\ 1\ /\ f\ -. A. ... VV\..T~~V V~UV'7
-0.4
::f _:~:~e: 3 - Roof. East Wolf (FJ1tered)
c: -04 t: 0:4 ~ ~Channel 4 - Roof, North Wall (Unfiltered)
too f\ .I. /\ II 1\", A. 1\ f\. /\ f\ ~ f\~ . ~Nf"'JVV~~' VVVVVV\J~o -0.4~ o.4~ Channel 4 - Roof, North Wall (Filtered)
.~ 0.0 .... ~~i'''.~'_''.''''''h'''I__----------i
....,~ -0.4~ 0.4r Channel 5 - Roof, West Wall (Un filtered)
o.o~.ev-d'l-0.4
:.: f . ..:~o:n.e~ 5 - Roof, West Waif (Filtered)
-0.4 t Time, sec
0.0 10.0 20.0 30.0 40.0 50.0 60.0, I J ) I , ,
Fig.5.44 Milpitas industrial building -1989 Loma Prieta eanhquake.
(a) Transverse relative displacement response.
202

Second Floor, West Wall (Filtered)
Milpitas Industrial Building - 1989 Loma Prieta Earthquake
0.4 Channel 6 - Second Floor, East Wall (Unfiltered)
oar f\ f\ f\ ,J\ 1'\ AA "-0-/\ 1\ "" ~'\lVVVVV~vv- en
-0.4
0.4 f Channel 6 - Secand Floor, East Wall (FIltered)
OoOf ·.S -g~: Channel 7 - Second Floor, North Wall (Unfiltered)
~ a 0 ~J\ Art U\~ f\ ".1\ f\ 0/\ 1\ f\ ~ 1\ I'..
~ '\1 \IV\! ·\TV~\jVV-\T~l::3 -0.4-~ a.4! Channel 7 - Second Floor, North Wall (Filtered)
Q) 0.0 - h .'.'11" '. • iI 1 t~'-......l::3 -04~ 0:4 Channel 8 - Second Floor, West Wall (Unfiltered)
OoOLrvf\j\jvJlv~-0.4to.4! Channel 80 .. 0 - ,. • •
-0.4 Time, sec
0.0 10.0 20.0 30.0 40.0 50.0 60.01-'__---',"--__....�'~__....I'~__....I''______1!'___ ____J'
Fig. 5.44 (coot.) Milpitas industrial building - 1989 Lama Prieta canhquake.
(a) (<:00'-) Transverse ttlative displac:ement response.
203

Milpitas Industrial Building - 1989 Loma Prieta Earthquake
Channel 12 - Second Floor, East Wall (Filtered)
60.0,50.0.40.0,
Time, sec30.0,20.0.10.0
I
7.0 Channel 11 - Roof, East Wall (Unfiftered)
Oo~ /'\ A~_ /\ /'-. "_ 0 __ ".~~V-..... vv =v - 1
-1.0·Si 1.0 [ Channel 17 - Roof, East Wall (Filtered)
E 0.0 - J.' ......f'II'I,..."...."""......----------------!\I.)
g -7.0-~ ~::l. ~:n:' ::'-"'::;::::::~wa::':fil:r~d)o -1.0r~ 1.0[
0.0 ----....-.-------------------1-1.0
0.0,
Fig.5.44 (cont.) Milpitas industrial building - 1989 Loma Prieta eanbquake.
(b) Transverse relative displacement response.
204

r- .-~------
f--cou."~ { J i ~~IIOOf' II
;-. ---~-L. .J l. .J
OIflt:l::TICti CIF SO\JT" WlW. CtlU."~E
000-'
Ii
.. ...
il,
"-11I1 TlI&CItS
Fig. 6.1 ?lan view of Elmendorf Warehouse indicating locations of damage (32]-
lOS

, t • _
....1 ...."
fAl »',,," . 200"0· ..~
(i'----j I mo'. lJSECTION A-A
Fig. 6.2 Typical roof framing plan and elevation of fire wall in Elmendorf Warehouse (32).
206

Fig. 6.3 Failure of a wood ledger beam in cross-grain bending.
207
•

VECTOR ELECTRONICS
Pur1lfl
_.J.- -
111 ,\ ......~ 1ft~f+H-++++++++--H-+-li'+"""++++++-H~~i#-Il y: ~9
~ j -~H-~++++++"""-+-!-+-!H-+-+-++""-+O+-+~~H-1
+--+.L.IL.I.-1-J,...~.....l.-.?+Hi-++~""""'++-+++-++++4~-H II
i ""I
........ 1oWIg Ou~I 11001 CGlIapee '-- ...... CoIaI>-
~100'----jf------14(j"------i
...---------24IJ"--------...,
SAWYER CABINET, INC.
Purt/II
•• StellCalYmn I
Fig.6.4 Summary of damage in tilt-up buildings during the 1971 San Fernando earthquake [41,.5.5).
208

• lD I - .... I")
-l
glu
lom
fell
(pro
ba
bly
aft
er
the
wal
lfe
ll)
~~
<5 ,
.....
'---
WA
RE
HO
US
EB
UIL
DIN
G
I2
76
'-0
"-,
t
pa
ne
lco
llap
se
pa
ne
lsb
ow
ing
out
N ~
ALL
PH
AS
EC
OLO
R
roo
fco
llap
se
wal
lco
llap
se
wal
lst
ress
ing
on
ext
eri
or
wal
lsd
est
roye
d
Fig
.6.4
(con
I.)
Sum
mar
yo
fdam
age
inti
lt-u
pbu
ildi
ngs
duri
ngth
e19
71Sa
nFe
rnan
doea
rthq
uake
141,
551.

v..... . .,"...... .c:>
NEW
- ------
(a)
I)t.'
.. ·17
-';t .
.,N £:1N L~)( ~)C'/6
~ o'--?" l-C'Nb~ .? ~/ \- ?/e. 11 qEX~ e,OLT (4"£r-1eE:~)
@ 'Z.,-(pll(7·C,.TYP,
Fig. 6.5 Use of steel kickers to increase the streDgth and stability of tilt-up pmels with large openings (10).
210

--77-4 •Chord Force
\
/7 \/
Out-ol-Plane/ Component
1.,,/ \
--
Ground fMotion J
Chord Forc.
Fig. 6.6 Skewed wall joints (35].
. /TYP. PANEL
/' Pl YWOOD SHEATHING
HANGER
\1000 PURLIN
STEEL CHANNEL LEDGER
Fig.6.7 Typical colUleCtion between wood purlin and stecllcdger {IO].
211

APPENDIX A
SUMMARY OF USC PROVISIONS
212

1976 UNIFORM BUILDING CODE
Anchorage of Concrete or Masonry WallsSK. 2310. Concrete or masonry walls shall be anchored 10 all Iloors
and roofs which provide lateral supper! for the wall. Such an':horage shallprovide a positive direct connection capable of resisting the horizontalfarces specified in (his Chapler or a minimum force of 200 pounds perlineal foot of wall, whi<;hever is greater. Walls shall be designed to resistbending between anchors where the anchor spacing exceeds 4 feel. Required anchors in masonry walls of hollow unils or cavity walls shall beembedded ;n a reinforced grouted structural dement of the wall. See Sec·tion 2312 (j) 20 and 2312 Ul 3A.
D. D1aphrallms. Floor and roof diaphragms shall be designed to resist(he forces set forlh in Table No, 23·J. Diaphragms supporting concrete ormasonry walls shall hav~ continuous ties between diaphragm chords todistribute. into the diaphragm, the anchorage forces specified in thisChapler. Added chords may be used to form sub-diaphragms to transmitthe anchorage forces to the main cross tics. Oiaphrasm deformations shallbe considered in the design of the sUPPorled walls. See Section 2312 (j) 3 Afor special anchorage requirements of wood diaphragms.
3.Sp«ial requirements. A. Wood diaphraams pruviding I.teral support for concrete or mll50nry ..ails. Where wood diaphraams are used tolaterally support concrete or masonry walls the anchorage shall conformto Section 2310. In Zones No.2. NO.3 and No.4 ancborage shall not beaccomplished by use of toe nails, or nails subjected 10 withdrawal; norshall wood framing be used in cross grain bending or cross grain tension.
8. Pile Clp' and caissons. Individual pile caps and caissons of everybuilding or structure shall be interconnected by ties. eacb of which cancarTy by tension and compression a minimum horizontal force equal to 10percent of Ihe larger pile cap or caiSSOn loading. unless it can bedemonstrated that equivalent restraint can be provided by other approvedmethods.
C. Exlerior elemellts. Precast. nonbearing, nonshear wall panels Of
similar elements which are attached 10 or enclose Ihe exterior. shall ac·commodate movements of Ihe Slructure resulting from lateral forces ortemperature changes. The concrete pands or other elements shall be supported by means of cast·in·place concrete or by mechanical fasteners inaccordance with Ihe following provisions.
Connections and panel joints shall allow for a relative movement between stories of not less than two times slory drift caused by wind Or(3.0/K) times story drift caused by required seismic forces; or \4 inch.wbichever is grealer.
Connections shall have sufficient ductility and rOlalion capacily so as topreclude fracture of Ihe concrete or brittle failures at or near welds. Insertsin concrete shall be attached to. or hooked around reinforcina steel. orotherwise terminated so as 10 efrectively transfer forces 10 the relnrorcinlsteel.
Connections to permit movement in lhe plane of the panel for story driftshall be properly designed slidine connections using slotted or oversizeholes or may be connections which permit movement by bendina of steelor other connections providing equivalent slidina and ductility capacily.
213

TABLE NO. 23·J- tiORIZONTAL FORCE FACTOR "Cp" FORELEMENTS OF STRUCTURES
OIl\ECTION ""WE OF'ART OR POIITIO" OF IUILDIItGS OF FOIICE C"
I. E.terior bearing and nonbeanng walls, Normal toinlerior bearing ,,·all. and parlllions. nat 0.20interior nonbeanng walls and partitions. surface~asonryor concrcte fcnccs
2. Cantilever parapet Normal 10nat 1.00
surface
3. Exterior and '"tcnor ornamentations and A.nyappendages . direction 1.00
4. When connccted to. pan of. or housedwithin a bUIlding'a. Towcr., Iilnks, towers and lank, plus
contents. chimneys. smokcstacks and 0.20'penthouse
b. Storagc racks wtth the upper storage Anylevel at more than 8 fcet in heIght direction 0.20' ,plus contents
c Equipment or machlncry nOI requiredfor Iifc safel~' systems or for conltnucd 0.20' •operalions of essential faCilities
d. EqUipment Or machinery required forlife safety systcms or for continued O.SO" •operation 01 esscntial facilitics
S. Whcn resting on Ihe ground. lank plus Anycffective mass of ils contenlS, direction 0.\2
6. Suspended ceiling framing systems (Ap- Anyplies to Seismic Zones Nos. 2, 3 and 4 direction 0.20'only)
7. Floon and roofs acting a. diaphragms Any 0.12'direction
8. Conneclions for e~lerior panels Or for Anyelements complying with Section 2312 direction 2.00(inc.
9. Connections for prefabricated structural Anyelements other than walls. wl'h force direction 0.30'applied at center of gra'"y of assembly
'See also Sec1l0n 2309 (b) for man,mum load on deflection ctltefla for InterIorDartitlons.
'When located in the upper portlOn or any buildin. where the ""tD ratio isn.e-to-one or lfC8Iel the vllue shall be Inerused b, 50 percent.
Iff'" ror stor..e racks shall be lhe w.i,ht of the racks plus con''''''. Thevillue or c" ror racks 0_ Iwo Slorl" suppon 1e>.1s In hcl.Iht .hall be0.16 for lh. lcvcls below'•• ,op tWo levels. In Ii... of 'hc tabulaled vlluesuee-t !.\Otllit rack!> may be: dtsj,aned in aceOTdanct" with U.B.C, S,andM;S"'J.27 II.WIlere a number of storqc nck unit, areln,crtonneaed 10 'hallher. arc aminimum of four venial clcmans in each direction 011 cad> colwon linelIail"cd 10 railt hori%ontal rorca. tIt'dailncocfrlCicnlS may be u roc abuildin, wilh X values from Table 1'10. %3-1. CS .. 0.20 for usc in th. ror·mula V • ZIKes ff' atUI If' equal ro IhClO,aJ dMd load pt... 50 percenl of,he rack riled CapacilY. WlIcte tM dcsil" and rack conliaurllions are inaccordallcc lWith Ihis parqraph ,h. dcsi&n provisions in U.B.C. StandardNo. 2'-11 do _ appl,.
'For flexible IDd flelCibly moun,ed equIpment and machiner" 'he approprial.valua of C, IbaII be clctcrmined wi,h considera,ion ,ivm '0 both 'Mdynamic prOPerties of the CQuipmen, and macllincry and to Ih. bllildi", orUtllClute in "'hich it is pIaccd but shall IlOI be less 'han the listed val.....The dcsiln of lhc CQuipment ancIlllaclli_y and their ancho<qe i. an in·' .....11 patl of ,h. _,n IIId specir",alio. or ...ch equipment andmachinery.
'For EsscnliaJ Focilili.. and lir. Sir.., systems. the desi,. and delailinl orCQuipmenl which mus, remain in pia.. and be funclional rollawi.,a majorcanhquat. sIIaIl consider dlifl. in ..corda~. ",i'h Section 2312 (tl. TIleprocIlICl of /S need not ..cccd I.'.
"Ceilin, wei,hl "'all include all li,hl Ii....res and olher eq..ipmen, which arcla'eraD, supponcd by lh. ccilinl. For putpOICS or detcnnininl Ihela,e,aJloc... a celinl wciaht of DOt leu llllll • pOunds per squa,e f_ snall beulCll.
'Floors anti roors lCIin. as diaphrqms .1Ia1l be dcsilned lor a minimumforce _lIinllrom a~ of 0.12 applied 10 w~unlnsa .real.dor.. resull.from the dillribu\iOSl Ol IIICfa1 (otca in _ .... "'ilh section Ul2ltl.
"The ":, shall iftcIlOde 23~ of the f\oor live load in Itorase 1II,j
•..-0CC\l0IDCItS.
214

18111 UNIFORM BUILDING CODE
Anchorage of Concrete or Masonry WallaSec. 2310. Concrete or masonry walls shall be am:hored to all floors. roofs and
ocher structural elements which provide required lateral support for the wall. Suchanchorage shall provide a positive direct connection capable of resisting the honzonlal forces specified in thiS chapter or a minimum force of 200 pounds per hnealfoot ofwall. whichever is grealCr. Walls shallbe designed to reslst bendingbetweenanchors where the anchor spacing exc~ 4 fccl. Required anchors in masonrywalls of hollow units or cavity walls shall be embedded in a reinforced grouledstructural element of the wall. See Sections 2336. 2337 (b) 8 and 9.
Lateral Force on Elements of Structures and NonstructuralComponents Supported by Structurea
Sec. 2336. (a) General. -
(b) Design lor Total Lateral Force. The total design lateral seismic force. Fp•
shall be determined from the following fonnula;
Fe =ZlC,We (36-1)
The values of Z and I shall be the values used for the building.EXCEmO~S: 1. For anchorage of machinery and equipment required for
life·safety sysrems. the value of I shall be raken 15 1.5.2. For rhe dcsien of tanks and vessels conraming sufficienr quantiries of hilhly
toxic or explosive sub$tanc" 10 be hazardous 10 lhe safery of the seneral public ifreleased. rhe value of I shall be raken as 1.5.
3. The value of' for panel connecrors for panels in Section 2337 (b) 4 C shall be1.0 for rhe entire connector.
The coefficient Cp is forelemenls and components and for rigid and rigidly suppcxtedequipment. Rigid or rigidly supported equipment is defined as having a fundamental period less than or equal to 0.06 second. Nonrigid or flexibly supportedequipment is defined as a system having a fundamentaJ period. including theequipment. greater than 0.06 second.
The lateral forces calculaled for nonrigid or flexibly supported equipment supponcd by a structure and located above grade shall be dctennined considering thedynamic properties of both the equipment and the structure which supports it. butthe value shall nOI be less than that listed in Table No. 23-P. In the absence of ananalysis orcmpirical data. the value ofCp for nonrigid or flexibly supported equipIIIlIlIt localed above grade on a structure shall be taken as twice the value listed inTable No. 23-P. but need nol exceed 2.0.
EXCEPTION: Pipina. ducrinl and conduir syS1CtlU which are COIISlI'UCled ofductile materials and wnneclions may use the values ofC" from Table No. 23-P,
The value of C" for elements. components and equipment laterally self-supportedator below ground level may be two thirds oftile value set forth inTable No.23-p. However. the design lateral forces for an element or componenl or piece ofequipment shall not be less than would be obtained by treating the item as an independent structure and using the provisions of Sectior 2338.
Thede$ign lateral forccsdetcrmined usingfonllula (36-1) shall bedistributed inproportion 10 the mass distribution of the element or component.
fortes detennincd usinl Formula (36-1) shall be used to desilJl mer:\bers andconnections which transfer these forces to the seismic-resisting sysrems.
For applicable forces in connectors for exterior panels and diaphralll\s, refer toSection 2337 (b) 4 and 9.
Fore:a shall be applied in the borizonlal direetions. which result in the most criticalla.dinp for deaipl.
215

Detailed Systems Design Requirements
Sec.1J37.
(b) Structural Framing Systems. I. General. Four types of general buildingframing systems defined in Section 2333 (f) are recognized in these provisions andshown in Table No. 23·0. Each type is subdivided by the types of vertical elementsused to resist lateral seismic forces. Special framing requirements are given in thissection and in Chapters 24 through 27.
2. Dttailing for combinations of systems. For components common to different strUctural systems. the more reslnctive detailing requirements shall be used.
3. Connections. Connections which resist seismic forces shan be designed anddetailed on the drawings.
4. Dtformalion compatibility. All framing elemems not required by design tobe pan of the lateral force-resisting system shall be investigated and shown to beadequate for venicalload-carrying capacity when displaced 3(R".18) times the dis·placements resulting from the required lateral forces. P~ effects on such elementsshall be accounted for. For designs using working stress methods. this capacitymay he determined using an allowable stress increase of 1.7. The rigidity ofadjoin.ing rigid and exterior elements shall be considered as follows:
A. Adjoining rigid elements. Moment-resistanl frames may be enclosed by oradjoined by more rigid elemenls which would tend to prcvcm the frame from resisting (alt'ra! forces where it can be shown that the action or failure of the morerigid elcrrcms will not impair the vertical and lateral load-resisting ability of theframe.
B. Ell .erior elements. Exterior nonbearing. nonshear wall panels or elementswhich ?Je attached to or enclose the exterior shall be designed to resist the forcesper Fl' nnula (36-1 ) and shall accommodate movements of the strUcture resultingfrom lateral forces or lempcralUrc changes. Such elements shall be supponed bymean, ofcasl·in-place concrete or by mechanical connections and fasteners in accordaIK~ with the following provisions:
(i) Com ,ections and panel joints shall allow fOT a relative movement betweenstories of not less than two times story drift caused by wind. 3(R•.I8) timesIhe calculated elaslic slory drift caused by design seismic forces. or 112inch. whichever is grealer.
(ii) Connections 10 permit movement in the plane of the panel for slory driftshall be sliding connections using sloned or oversize holes. connec1ionswhich permit movement by bending ofsteel. or other connections providIng equivalent sliding and ductility capacity.
(iii) Bodiesofconnections shall have sufficient ductility and rotation ClplIl:il)'sou toprec:lude fracture oftheconcrcle or brittle failures atornear weld5.
(iv) The body of the connection shall be designed for one and one-d1ird timesthe force determined by Fonnula (36-1).
(v) All fasteners in the connecting system such IS bolts. inserts. weld5 anddowels shall be desi,ned for four times the forces determined by Fonnula(~I).
(vi) Fastenersembedded inconcrete shall be attaChed lO.orhooked around. reinforcing steel or otherwise terminated so as to effectively ttaIlSfer forces
• 10 the reinforcins steel.S. Tiel IIId coadDult,. All parts of a stnICture shall be interconnected and the
connections sIWlbe capable of tranSII1ittin, the seismic force induced by the partsbeinac:onnee:ted. Asaminimum. any smallerportion of thebuilding shallbe tied tothe remainder of the building with elements having at least a strength to rain! times the weight of the smaller portion.3
A positive connec:tion for resisting a horizontal force acting paraJlellO themem.bet shall be provided for exh beam. Jirdet or tr1ISS. This force shall not be lessthan ! times the dcId plus live load.,
6. CoIIectGr.....tL Co11ector elemenv. shall be provided which are capableoflnnSferrina lbe seismic: f_oriJinaIin,u.odletportionsofthe buildinllO theeJemeIlt providin, the resisWICC 10 thote forces.
216

7. COlICrete frames. Concrete frames required by design to be part of tile lateralfoo:e-leSisting system shall conform to the following:
A.1n Seismic Zones Nos. 3and 4 they shall be special moment-resisting frames.
B. In Seismic Zone No.2 they shall. as a minimum. be intermediate momentresisting frames.
S. Andloraae of CODcrete or masonry walls. Concrete or masonry walls shallbe ancbored to all floors and roofs which provide lateral support for the wall. 'Theanchorage shall provide a positive direct cOMcction between the wall and floor orroof constnl~tion capable of resisting the horizontal forces specified in Section2336 or Section 2310. Requirements for developing anchorage forces in diaphraIJDS are given in Section 2337 (b) 9 below. Diaphragm deformation shall beconsidered in the design of the supported walls.
9. Diaphraams.
A. The deflection in the plane ofthe diaphragm shall not elceed the permissibledeflection of the attaChed elements. Permissible deflection shall be that deflectionwhich will permit the attached element to maintain its structural integrity undertheindividuallOldin& and continue to support the prescribed loads.
B. Floor and roofdiapJnanu shall be designed to resist the fOR:cs delcrmined inaccordance with the following formula: .
F,. L F,
Fp, . "'p, (37.1)
2:>..-,The force Fp , determined from Formula (37-1) need notellceed 0.75 Z/ w,.... but
shall not be less than 0.35 Z I "'p.,.When the diaphragm is required to transfer lateral forces from the vertical resist
ing clements above the diaphragm to other vertical resisting clements below thediaphragm due to offset in the placement of the elements or to changes in stiffnessin the venical elements. these forces shall be added to those: detennined from Formula (37-1).
C. Diaphragms supporting concreteor masonry walls shall havecontinuous tiesor struts between diaphragm chords to disnibutc the anchorage forces specified inSection 2337 (b) 8. Added chords may be used to form subdiaphragms to transmitthe anchorage forces to the main crossties.
D. Where wood diaphragms are used to lalerally support concrete or masonrywalls. the anchorage shall confonn to Section 2337 (b) 8 above. In Seismic ZonesNos. 2. 3and 4 anchorage shall nOI be accomplished ry use oftoc:nails ornails subject to withdrawal. nor shall wood ledgers or framing be used in cross-grain bending or cross-grain tension. and the continuous tics required by Item C above shallbe: in addition to the diapbragm sheathing.
E. Connectionsofdiaphragms to thevertical elements and to collectors and connections ofe )Ilc:etors to the vertical elements in SlJUetUres in Seismic Zones Nos. 3and 4. having a plan irregularity of Type A. B. C or D in Table No. 23·N. shall bedesigned without considering one-third increase usually pennit\ffl in allowablestr::_ fm elements resisting earthquake forces.
F.ln strUctures in Seismic Zones Nos. 3 and 4 having a 1-'18" irregularity ofTypeB in Table No. 23-N. diaphragm chords and drag members shall be designedconsidering independent movement of the projecting wings of the strueture. Eacb oflhese diaphragm elements shall be designed for the more severe ofdle fc:'owing!wo assumptions:
Motion of the projecting wings in the same direction.Motion of the projecting wings in opposing directions.
Ua:rnON: nus requirement may be deemed IIlisrJed if Ihe proc:ecbes ofSect"", 2335 in conjunc:tiOll widl. dlree1tirnension&l model hlwbeen UIed to demmine dlc Iateralscismic r=es ror desil".
217

APPENDIXBFILTERING OF RELAnVE DISPLACEMENT HISTORIES
Corrected absolute acceleration, absolute velocity, and absoluw displacement records were provided by
me California Office of Strong Motion Studies for each of the tilt-up buildings studied [37,38,59,60,61,66,
67). Relative displacements are typically used to interpret structuml response, because the displacement of
a building relative to its foundation is a measure of the distortions within the structure during the earthquake.
However, digitizing, filtering, and integrating the measured acceleration records introdllccs noise [68].
Therefore, reliable values of relative displacement can not be calculated simply by subtracting the absolute
displacement of the ground from the absolute displacement of the structure.
In an attempt to quantify the amplitude of me error introduced during the digitization process, Shalcal and
Ragsdale [68] digitized a straight line as if it were an acceleration trace. The digitized acceleration records
were filtered and integrated to obtain absolute velocity and displacement records. The error introduced in the
acceleration, velocity, and displacement records is plotted in Fig. 8.1 as a function of the long-period filter
cut-Qff period. The results indicate that errors introduced by the digitization process are likely to be on the
order of 2 cmlsec2 for the acceleration records. Errors in velocity and displacement waveforms depend on
the frequency of the long-period filter cut-Qf( and increase as the period of the filter cut-Qff increases. Noise
introduced by the recording instrument has been ignored in this process, and the results should be considered
to be a lower bound to the amplitude oftbe actual noise introduced [68].
An Ormsby filter was used during the processing of all the strong-motion data considered in this report
[38J. The shape of the filter is shown in Fig. B.2. Frequency cut-Qffs are summarized in Table B.1 and were
determined using an iterative procedure. Progressively shorter long-period filter cut-Qff periods were used
to remove as much noise as possible while retaining as much signal as possible. Given this information, an
estimate of the reliability of the displacement records can be made. For example, records measured in the Hol
lister warehouse during the Loma Prieta eanhquake have a useable bandwidth between 0.12 and 23.6 Hz
(0.042 and 8.40 sec) [38]. The long-period filter cut-Qffcorresponds to approximately 1 em or 0.4 in. ofpro
cessing noise (Fig. B.l).
The procedure used to filter all the relativedisplacementdata will be illustrated using the transverse stJuc
lUral displacement data recorded in the Hollister warehouse during the Loma Prieta eanhquake. Channel 4
(located at the center of the roof) is used 10 represent structural displacements and Channel 7 (located at the
center of the west wall) is used to represent the ground movement. Digitized absolute displacement records
for the two channels are plotted in Fig. 8.3(a) and the Fourier amplitude spocua are shown in Fig. B.3(b).
Both plots indicate that the ground motion dominates the absolute displacement response at the roof. The
structural vibrations observed between 8 aDd 16 sec in the structural displacement record comspoDd to the
218

peak in the Fourier amplitude spectra at approximately 1.1 Hz. This corresponds to the predominant frequen
cy identified from the acceleration records (Table 5.2). The influence of the Ormsby filter may also be seen
in Fig. B.3(b) where it is evident that the long-period response (frequencies less than 1.4 Hz) bas been re
moved from both the ground and structural signals.
The relative displacement signal obtained by subtracting the ground displacement (Channel 7) from the
structural displacement (Channel 4) at each time i'lcrement is shown in Fig. 8.4(a) and the corresponding
Fourier amplitude spectra j:; shown in Fig. B.4(b). Although the predominant frequency in the relative dis
placement history occurs at 1.1 Hz., it is clear that a significant amounl of noise from the ground displacement
is presenl. The long-period oscillations that occur after 30 sec in the relative displacement history also indi
cate the presence of noise.
A high-pass filter was used to remove the ponioD of the signal anributable to the ground motion. The
shape of the filter is shown in Fig. B.5, and the frequency limits were selected using an iterative approach.
The cut-off frequencies were increased until the amplitude of the filtered relative displacement response his
tory tended toward zero at the end of the record. The resulting filtered relative displacement history is shown
in Fig. B.6. Cut-off frequencies for the different eanhqualres are presented in Table B.1.
As discussed in Qaapter 5, tbe general shape of the unfiltered and filtered relative displacement records
did not change appreciably for the transverse displacements measured near the center of the buildings. How
ever, the nature of tbe ftItered and unfiltered longitudinal relative displacements and transverse relative dis
placements measured at the top of the end walls were considerably different In most cases, the maximum
amplitude of the faltered relative displacements at these locations were of the same magnitude as the ampli
tude of the expected enor shown in Fig. B.l. Therefore, only. the transverse relative displacement data mea
sured near the center of the buildings were considered 10 be reliable.
219

TABLE B.1 FILTER LIMITS USED TO PROCESS STRONG-MOTION RECORDS
Limits forBuilding and Earthquake CSMlP limits for Ormsby Filter High-Pass Filter
(Fig. B.2) (fig. B.5)
ILl (Hz) fLe (Hz) fHr (Hz) fHe (Hz) fi (Hz) h (Hz)
Hollister Warehouse
1984 Morgan Hill 0.08 0.16 23 25 0.20 0.50
1986 Hollister 0.10 0.20 23 25 0.20 0.50
1989 Lorna Prieta 0.07 0.14 23 25 0.20 0.50
Redlands Warehouse
1986 Palm Springs 0.25 0.50 23 25 1.10 1.25-Milpitas Industrial Building
1988 Alum Rock 0.30 0.60 23 25 2.0 2.5
1989 Loma Prieta 0.07 0.14 23 25 2.0 2.5--
220

-- /I
; I ! t IIJC 20,
"';"~"~c.:
rI
O,I,:-_~I;--_-,",--"",~,~,,~c.~ 0 IC'':: 2eo
![
Fig. B.l Estimate of processing noise present in corrected strong-motion recurds [68].
1---- Useable Bandwidth----I
1.0~::3~ 0.7~
E 0.5~
~.....~ 0.0 L...-_-:L-"- --I.---L _
~t~c ~t~cFrequency, Hz
Fig. B.2 Ormsby filter used to process CSMlP records [38].
221
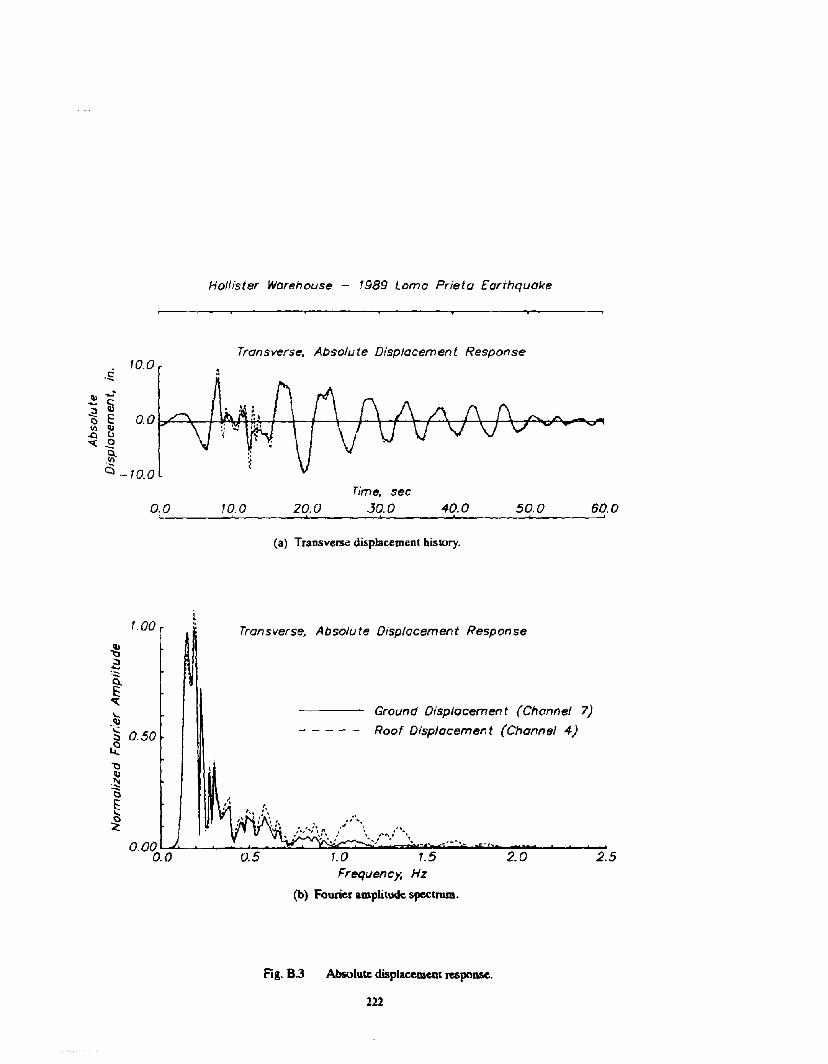
Hollister Warehouse - 1989 Lorna Prieta Earthquake
Transverse. Absolute Displacement Response
Time. sec0.0 10.0 20.0 30.0 40.0 50.0 60.0..._--_.....'---_-...._--_-.....'---_...'------'-,------',
(a) Transverse displacement history.
Transverse. Absolute Displacement Response
Ground Displacement (Channel 7)
- - - - - Roof Displacement (Channel 4)
7.00'I)
"t.l::)~'-Ci.E
oq:.....~
0.50:::l
~"t.lII).~
"5~()
~
0.000.0 0.5 1.0 1.5
Frequency, Hz
(b) Fourier amplitude spectrum.
Fig. 8.3 Absolute displacement respoDSe.
222
2.0 2.5

Hollister Warehouse 1989 Loma Prieto Earthquake
Transverse Roof Response
0.0I
10.0, 20.0,
Time. sec30.0, 40.0, 50.0. 60.0.
(a) Transverse displacement history.
Transverse Roof Response1.00
.~~ 0.50~1:)ll)
~~o~
o. 00 """'------'--'--'--'-----.........."--........................................-:.....---'~~---'---'0.0 0.5 1.0 1.5 2,0 2.5
Frequency, Hz
(b) Fourier amplitude spectrum.
Fig. 8.4 Unfilteml, relative displacement response at the roof.
223

1.0~.2'-Ii.E 0.5~
'-q)....Ii. o. 0~ ~ _
fl f2Frequency. Hz
Fig. 8.5 Higb-pass filter used to calculate relative displacement response.
Hollister Warehouse - 1989 Loma Prieto Earthquake
Transverse Roof Response
0.0I
10.0. 20.0,
Time. sec30.0, 40.0, 50.0
t60.0,
Fig. 8.6 Filtered, relative displacement response at dle roof.
224