11096014 causes and effects of the lehman brothers bankruptcy
TRANSCRIPT
8/6/2019 11096014 Causes and Effects of the Lehman Brothers Bankruptcy
http://slidepdf.com/reader/full/11096014-causes-and-effects-of-the-lehman-brothers-bankruptcy 1/26
Testimony of
Luigi Zingales
on"Causes and Effects of the Lehman Brothers Bankruptcy”
Before the
Committee on Oversight and Government Reform
United States House of Representatives
October 6, 2008
8/6/2019 11096014 Causes and Effects of the Lehman Brothers Bankruptcy
http://slidepdf.com/reader/full/11096014-causes-and-effects-of-the-lehman-brothers-bankruptcy 2/26
2
Causes and Effects of the Lehman Brothers Bankruptcy
Luigi Zingales*
October 2008
Abstract
I argue that the demise of Lehman Brothers is the result of its very aggressiveleverage policy in the context of a major financial crisis. The roots of this crisis have to
be found in bad regulation, lack of transparency, and market complacency brought aboutby several years of positive returns. Lehman’s bankruptcy lead to a reassessment of therisk, in particular in the market for credit default swaps.
*University of Chicago Graduate School of Business, National Bureau of Economic Research and Centerfor Economic Policy Research. Address correspondence to Luigi Zingales, University of Chicago GraduateSchool of Business, 5807 South Woodlawn Avenue, Chicago, IL 60637 or e-mail at [email protected] thank Federico De Luca for excellent research assistantship.

8/6/2019 11096014 Causes and Effects of the Lehman Brothers Bankruptcy
http://slidepdf.com/reader/full/11096014-causes-and-effects-of-the-lehman-brothers-bankruptcy 3/26
3
The demise of Lehman Brothers can only be understood within the context
of the current financial crisis, the biggest financial crisis since the Great
Depression. The roots of this crisis have to be found in bad regulation, lack
of transparency, and market complacency brought about by several years of
positive returns. I will start by explaining these three roots and then I will
discuss how Lehman contributed to its own demise and what the
consequences of its filing for bankruptcy are.
1. Market Complacency
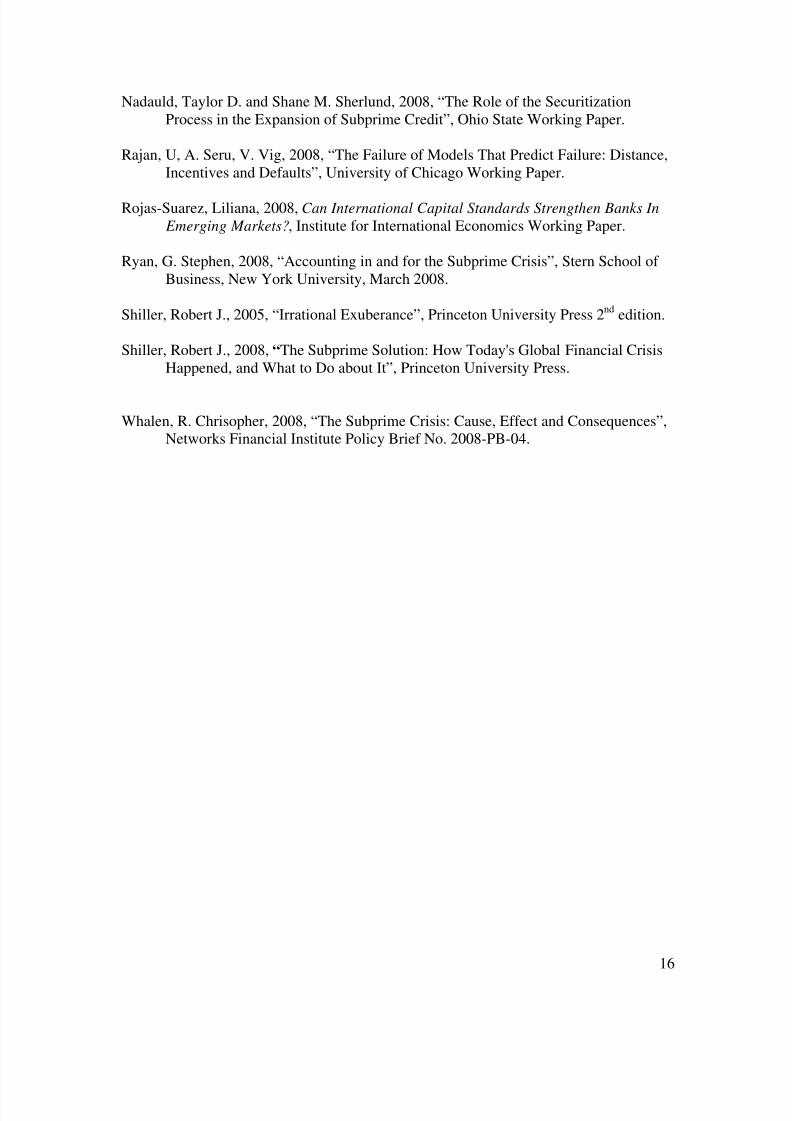
The seeds of current crisis were sewn during the real estate boom. As
Figure 1 shows, a prolonged period of low interest rates lead to a rise in
house prices that was completely abnormal by historical standards. From
March 1997 to June 2006 the Case and Shiller national index of real estate
prices increased every month, except for two. During the same period the
average increase in real estate prices was 12.4% per year. This increase was
in part fueled by extraordinary low interest rates. Between January 2002 and
January 2004 the average 3-month T-bill rate was 1.3%, while the average in
the previous forty years was 6.1%.
This sustained price increase engenders the illusion in many actual
and aspiring home owners that prices will always go up. In a 2005 survey of
San Francisco home buyers Case and Shiller find that the mean expected
price increase over the next ten years was 14% per year, while the median
9% per year (Shiller, 2008).
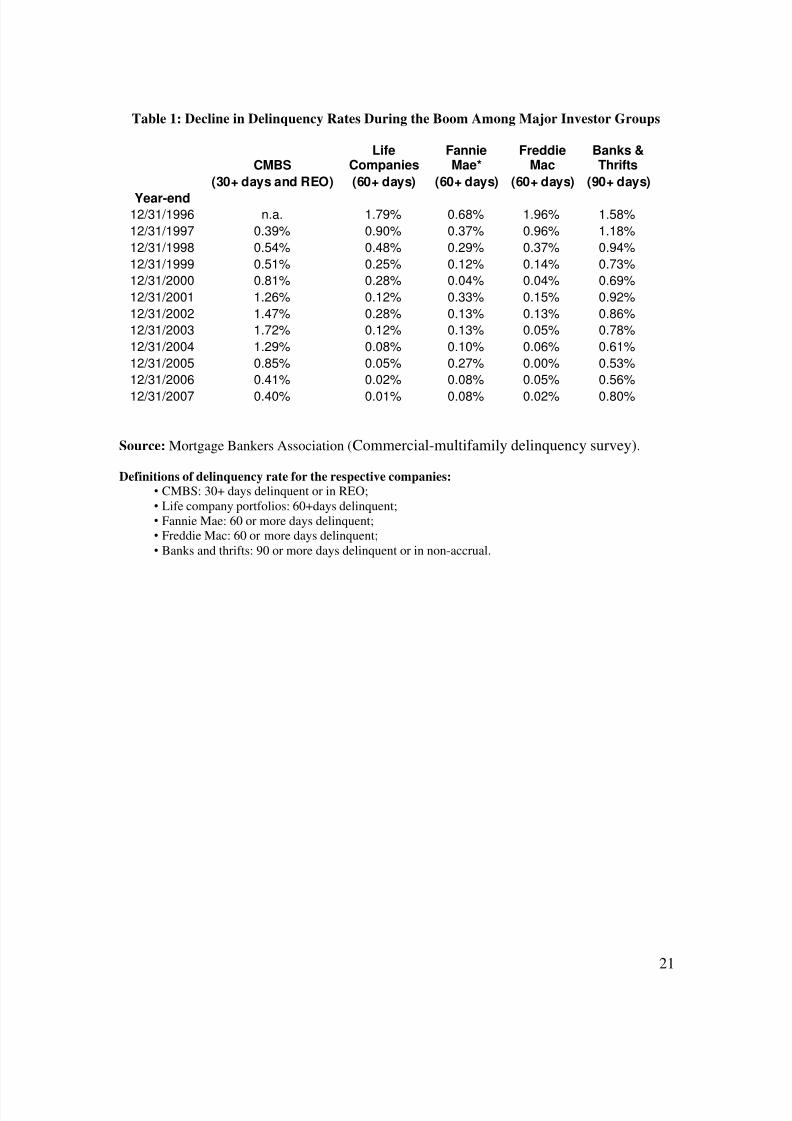
As Table 1 shows, during the real estate boom delinquency rates
dropped. The reason was not only the relatively good economic conditions,
but the sustained real estate price increase. First of all, home owners fight
hard to be able to pay their mortgages when their home equity increases.
8/6/2019 11096014 Causes and Effects of the Lehman Brothers Bankruptcy
http://slidepdf.com/reader/full/11096014-causes-and-effects-of-the-lehman-brothers-bankruptcy 4/26
4
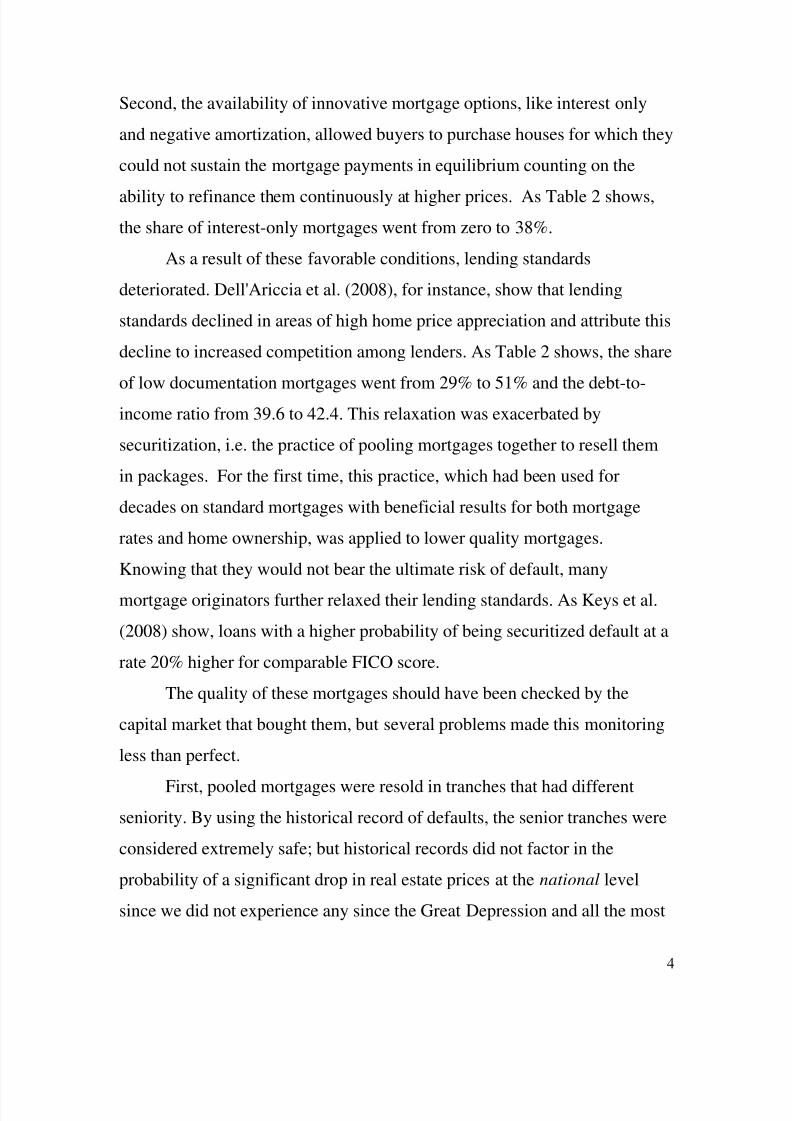
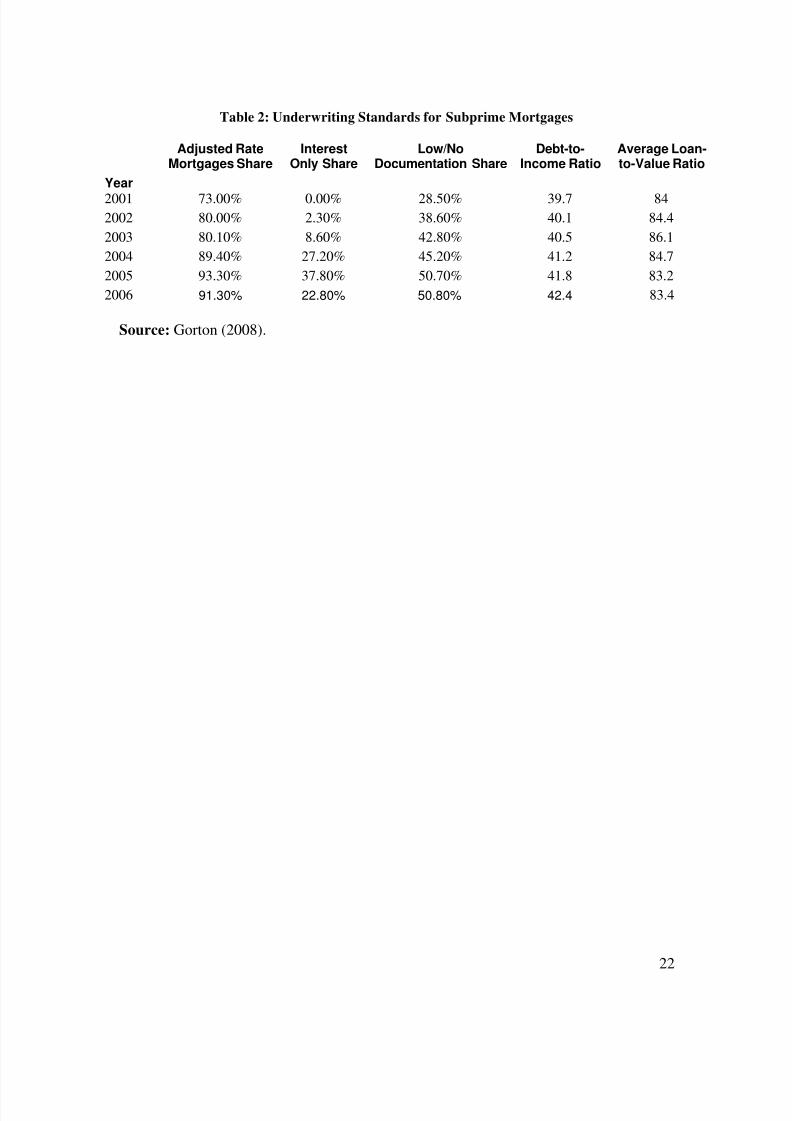
Second, the availability of innovative mortgage options, like interest only
and negative amortization, allowed buyers to purchase houses for which they
could not sustain the mortgage payments in equilibrium counting on the
ability to refinance them continuously at higher prices. As Table 2 shows,
the share of interest-only mortgages went from zero to 38%.
As a result of these favorable conditions, lending standards
deteriorated. Dell'Ariccia et al. (2008), for instance, show that lending
standards declined in areas of high home price appreciation and attribute this
decline to increased competition among lenders. As Table 2 shows, the share
of low documentation mortgages went from 29% to 51% and the debt-to-
income ratio from 39.6 to 42.4. This relaxation was exacerbated by
securitization, i.e. the practice of pooling mortgages together to resell them
in packages. For the first time, this practice, which had been used for
decades on standard mortgages with beneficial results for both mortgage
rates and home ownership, was applied to lower quality mortgages.
Knowing that they would not bear the ultimate risk of default, many
mortgage originators further relaxed their lending standards. As Keys et al.
(2008) show, loans with a higher probability of being securitized default at a
rate 20% higher for comparable FICO score.
The quality of these mortgages should have been checked by the
capital market that bought them, but several problems made this monitoring
less than perfect.
First, pooled mortgages were resold in tranches that had different
seniority. By using the historical record of defaults, the senior tranches were
considered extremely safe; but historical records did not factor in the
probability of a significant drop in real estate prices at the national level
since we did not experience any since the Great Depression and all the most
8/6/2019 11096014 Causes and Effects of the Lehman Brothers Bankruptcy
http://slidepdf.com/reader/full/11096014-causes-and-effects-of-the-lehman-brothers-bankruptcy 5/26
5
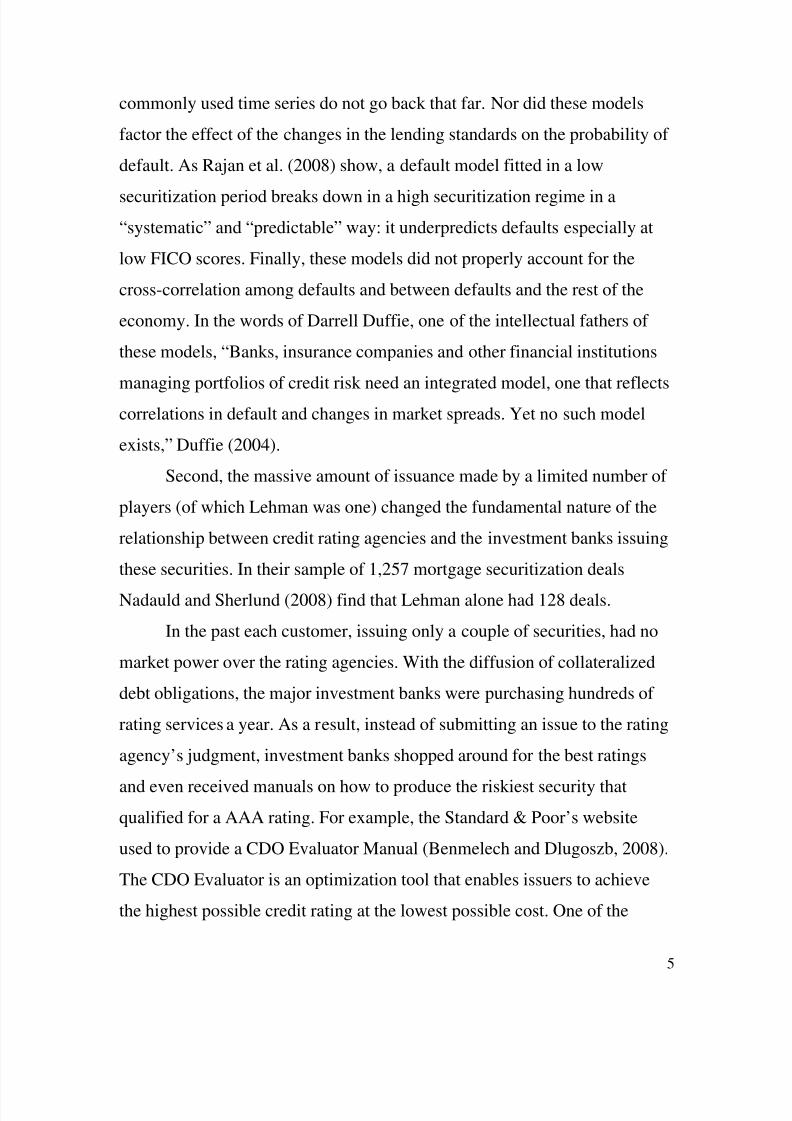
commonly used time series do not go back that far. Nor did these models
factor the effect of the changes in the lending standards on the probability of
default. As Rajan et al. (2008) show, a default model fitted in a low
securitization period breaks down in a high securitization regime in a
“systematic” and “predictable” way: it underpredicts defaults especially at
low FICO scores. Finally, these models did not properly account for the
cross-correlation among defaults and between defaults and the rest of the
economy. In the words of Darrell Duffie, one of the intellectual fathers of
these models, “Banks, insurance companies and other financial institutions
managing portfolios of credit risk need an integrated model, one that reflects
correlations in default and changes in market spreads. Yet no such model
exists,” Duffie (2004).
Second, the massive amount of issuance made by a limited number of
players (of which Lehman was one) changed the fundamental nature of the
relationship between credit rating agencies and the investment banks issuing
these securities. In their sample of 1,257 mortgage securitization deals
Nadauld and Sherlund (2008) find that Lehman alone had 128 deals.
In the past each customer, issuing only a couple of securities, had no
market power over the rating agencies. With the diffusion of collateralized
debt obligations, the major investment banks were purchasing hundreds of
rating services a year. As a result, instead of submitting an issue to the rating
agency’s judgment, investment banks shopped around for the best ratings
and even received manuals on how to produce the riskiest security that
qualified for a AAA rating. For example, the Standard & Poor’s website
used to provide a CDO Evaluator Manual (Benmelech and Dlugoszb, 2008).
The CDO Evaluator is an optimization tool that enables issuers to achieve
the highest possible credit rating at the lowest possible cost. One of the
8/6/2019 11096014 Causes and Effects of the Lehman Brothers Bankruptcy
http://slidepdf.com/reader/full/11096014-causes-and-effects-of-the-lehman-brothers-bankruptcy 6/26
6
outputs of this evaluator was to provide the issuer with a measure of “excess
collateral” which, according to S&P,“tells what percentage of assets notional
needs to be eliminated (added) in order for the transaction to provide just
enough (i.e. ROC equals to 100%) support at a given rating level.”
(Benmelech and Dlugoszb, 2008).
The market was not completely fooled by this process: AAA-rated
assets backed securities had a higher yield than corporate AAA, a clear
indicator of the higher risk. Benmelech and Dlugoszb (2008), for instance,
reports that in their sample average spread over the Libor for AAA tranches
in our sample is 32 basis points.
2. Bad Regulation
Unfortunately, regulatory constraints created inflated demand for
these products. Fannie Mae and Freddie Mac were allowed, even
encouraged, to invest their funds in these securities (Mian et al, 2008).
The Federal Housing Enterprises Financial Safety and Soundness Act
of 1992 requires the Department of Housing and Urban Development
(HUD) to ensure that Fannie Mae and Freddie Mac operate in compliance
with their charter purposes. This act mandates that HUD carry out specific
responsibilities that include setting annual housing goals for the GSEs and
monitoring and enforcing the GSEs' performance in meeting these housing
goals.
In 2004, to encourage Fannie Mae and Freddie Mac to facilitate
greater financing and home ownership opportunities for families and
neighborhoods targeted by the housing goals, especially first-time
homebuyers, the HUD established goals for the two Government Sponsored
Entities (GSE). These goals are expressed as percentages of the total number
8/6/2019 11096014 Causes and Effects of the Lehman Brothers Bankruptcy
http://slidepdf.com/reader/full/11096014-causes-and-effects-of-the-lehman-brothers-bankruptcy 7/26
7
of mortgages purchased by the GSEs that finance the purchase (not
refinance) of single-family and owner-occupied properties located in
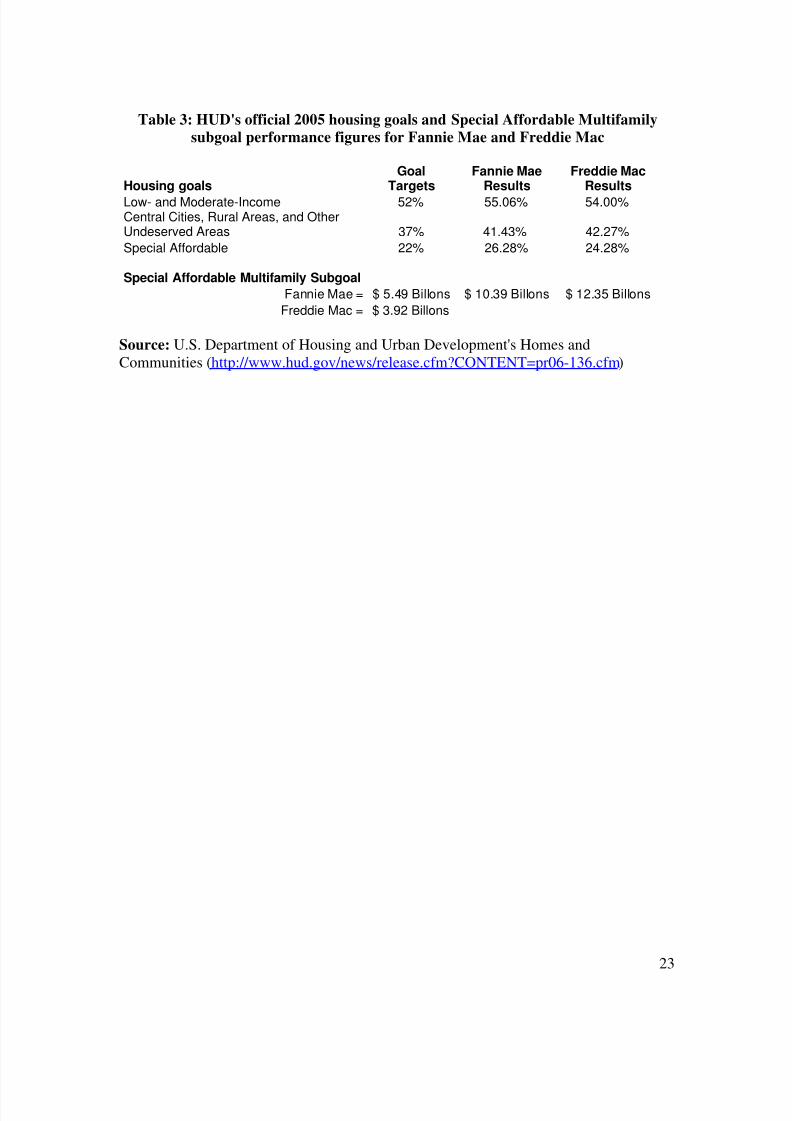
metropolitan areas for low and moderate income people. Table 3, obtained
from a HUD press release, reports these goals for 2005 with the relative
performance of the two GSE along these lines.
While there is no penalty for failure to meet these goals, it is clear
from the press release that HUD exerts political pressure. Since these goals
could be met also with the purchase of subprime collateralized debt
obligations (CDOs), such pressure found no resistance from the GSE who
loved the arbitrage this opportunity created: they could issue AAA-rated
debt and invest in higher-yield AAA debt, gaining the spread.
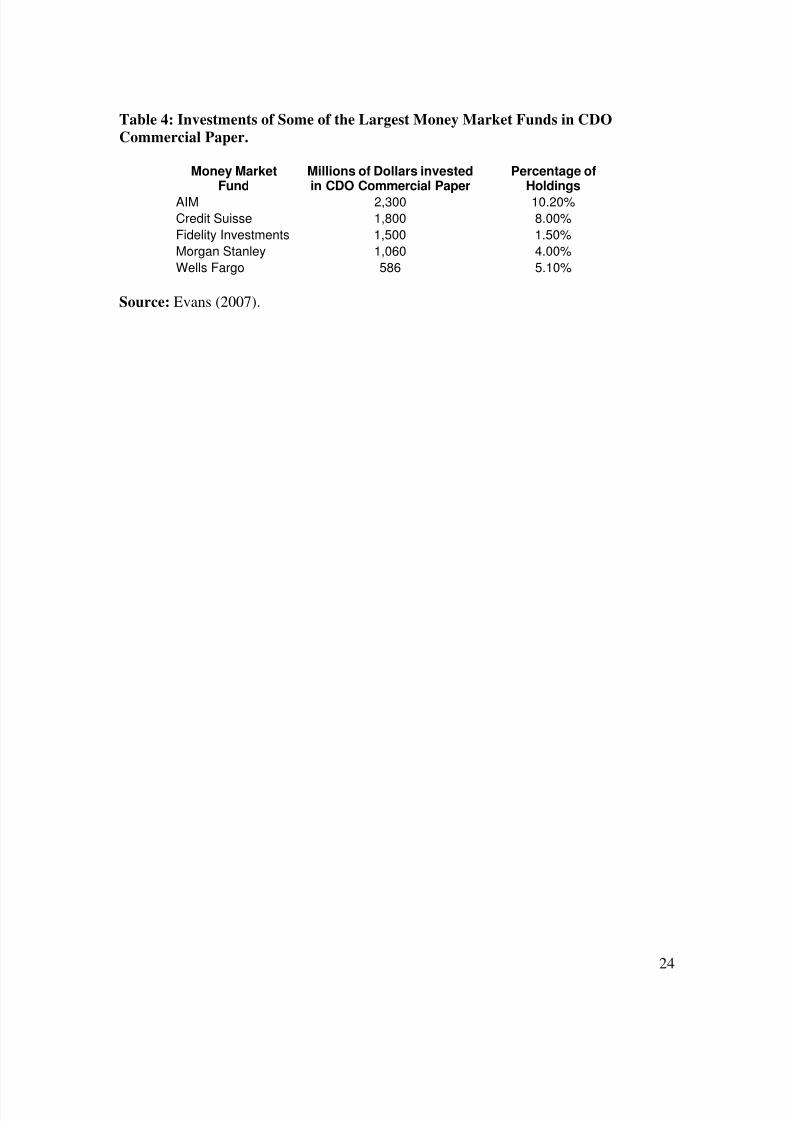
Another source of captive demand were money market funds. Being
required to hold only highly rated securities, money market funds loved
these instruments because they satisfied the regulatory requirements and
boosted their yields. Most managers of these funds were well aware of the
gamble they were taking, but could not resist taking it, under an intense
competition for yield-hungry customers (see for example, Table 4). These
managers were also hoping that if a shock occurred, all their competitors
would face the same problem, thereby reducing the reputational costs and
possibly triggering a Government support. The September 19th decision to
insure all money market funds validated this gamble, forever destroying
money market managers’ incentives to be careful in regard to the risks they
take.
To be fair, the problem was even more severe in the ultra short bond
funds. Unlike money market funds, these funds are not restricted as to which
types of instruments they can own. Their aim is to beat money market funds
without delivering much more volatility. In the last year, the ultrashort-term
8/6/2019 11096014 Causes and Effects of the Lehman Brothers Bankruptcy
http://slidepdf.com/reader/full/11096014-causes-and-effects-of-the-lehman-brothers-bankruptcy 8/26
8
bond category has performed very poorly. The category's worst performers
have lost between 10% and 30% over the past year (Dolan, 2008). As the
mutual find rater Morningstar admits, “We can't say that we saw this
coming. We didn't. There were risks in these portfolios that were hard to see
and had never materialized in the past, so backward-looking risk measures
such as standard deviation and past losses proved unreliable. Given the near-
term maturities of the bonds in the portfolio, we underestimated the damage
that subprime and other low-quality bonds could cause.”
More generally, regulation relied heavily on credit-rating agencies
measures of risk without understating the incentives this creates on the
regulated to game the system and lobby the credit-rating agencies for sweet
deals.
First of all, the bin-approach to risk advocated by Basel risk-based
capital requirements induce banks to invest in the highest risk security in
each bin, sensibly altering the distribution of asset risk. For example, most
non-OECD countries attach a zero percent risk weight to their own
government paper. As a result, during the Argentina crisis, domestic banks
loaded up on government bonds, in spite of the declaration of default,
because they provided a regulation arbitrage: a very high yield and zero
capital requirement (Rojas-Suarez, 2008).
This problem is present also in the United States. Banks are allowed
to allocate zero capital to loans which are hedged with credit default swaps.
But the insurance buy is less than certain because of the possibility that the
insurer will default – what it is known as counterparty risk – since the
amount of collateral posted for this contract is often zero.
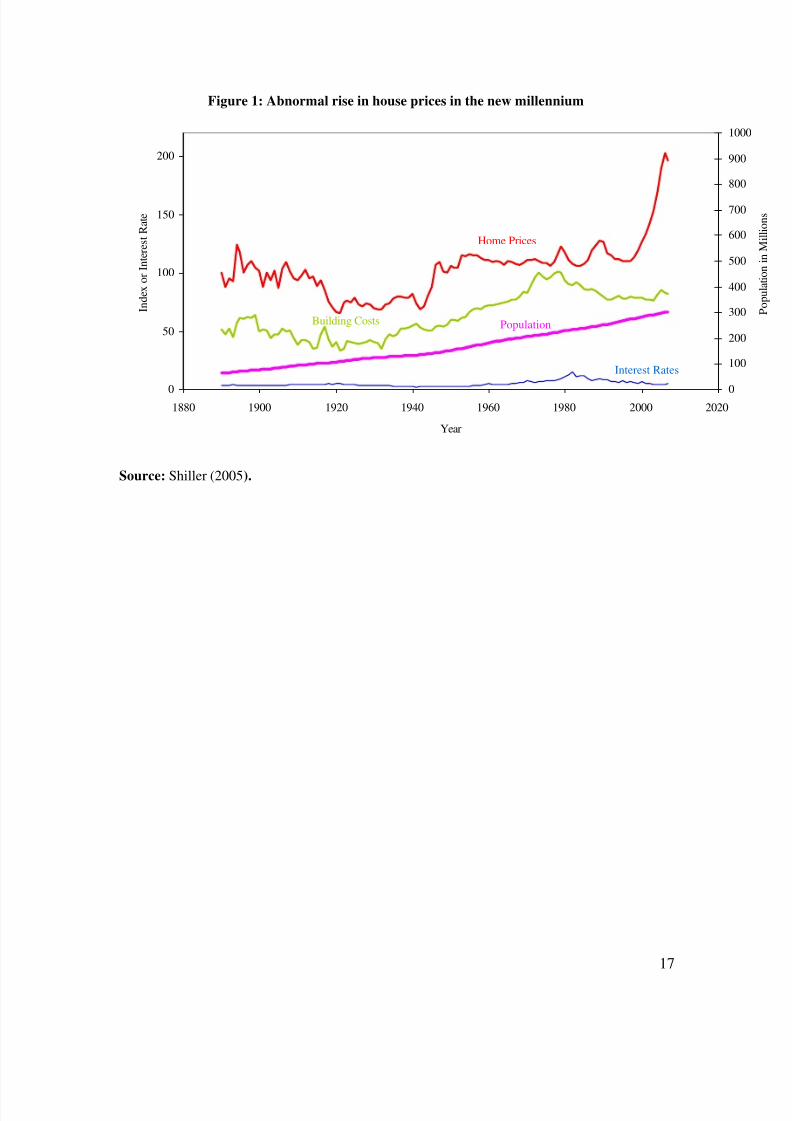
Second, this regulation failed to appreciate the enormous pressure it
put on the shoulder of credit-rating agencies. As figure 2 shows, Moody’s

8/6/2019 11096014 Causes and Effects of the Lehman Brothers Bankruptcy
http://slidepdf.com/reader/full/11096014-causes-and-effects-of-the-lehman-brothers-bankruptcy 9/26
9
revenues from structured finance ratings increased from a little more than
$100 million in 1998 to more than $800 million in 2006, representing more
than 80% of its total rating revenues. Since Standard and Poor’s is a division
of McGraw Hill it does not disclose disaggregated data, but the pattern is
likely to be similar. Given the high degree of concentration of the issues of
structured products among a few investment banks, it is hard to see how this
change in the revenue source will not alter the balance of power between
credit rating agencies and their customers.
To worsen the problem, at least as far as investment banks are
considered, comes a Security and Exchange Commission ruling in April
2004, which relaxed the pre-existing limits on leverage. As a consequence,
the leverage of the five independent investment banks shot up (Labaton,
2008).
The accounting of subprime mortgages deserves a separate discussion.
Many commentators have accused the so-called mark-to-market method
(more properly called fair value accounting) for the spreading of the crisis.
Before passing any judgment it is helpful to review what are the rules that
regulate the accounting of these instruments contained in Financial
Accounting Statement (FAS) 115 (for a thorough discussion see Ryan, 2008).
First of all, buyers have an option to treat these securities as trading or
available for sale (AFS) or held to maturities (HTM). AFS securities are
accounted for at the lower of cost or fair value (see FAS 157). HTM
securities are accounted for at amortized costs, subject to other-than-
temporary impairments. Originators usually treat mortgages as available for
sale.
FAS 157 defines fair value as “the price that would be received to sell
an asset or paid to transfer a liability in an orderly transaction between
8/6/2019 11096014 Causes and Effects of the Lehman Brothers Bankruptcy
http://slidepdf.com/reader/full/11096014-causes-and-effects-of-the-lehman-brothers-bankruptcy 10/26
10
market participants at the measurement date.” FAS 157 provides a hierarchy
of inputs that go to determine the fair value. The first level are market prices
for identical items. This is extremely rare for mortgage-backed securities
(MBS), since they are tailor-made. The second level is represented by
market data for similar items or illiquid market data for the same item. At
the beginning of the crisis most MBS were valued in this way. But as the
crisis made the market increasingly illiquid, MBS started to be valued using
level three, i.e., unobservable, firm-supplied estimates (also called mark-to-
model valuations).
While this system was designed to increase the transparency of
reporting it did encounter some problems, especially at the time of a major
generalized crisis.
First, as market liquidity dried out, more and more firms had to move
to mark-to-model. Given the relative novelty of this approach, there was not
a well-established method to deal with this. Hence, firms were at the mercy
of their external auditors, who had different approaches. Since, there is not
an adequate disclosure of all the assumptions that go in the models, a rule
that was invented to increase transparency lead to more opacity at a time the
market needed transparency the most.
Second, write-offs calculated in this way had major impact in the
rating-firm decisions to downgrade financial institutions, which in turn had
strong effect on their ability to survive. In a different scenario the credit
rating agencies could have helped reduce the impact of write-offs by using
their direct knowledge of the firm balance sheets to overrule the verdict of
some excessively conservative accounting decisions. Unfortunately, given
the limited credibility credit rating agencies enjoy in this moment, they
could not afford to be seen as overruling the implications of the write offs.
8/6/2019 11096014 Causes and Effects of the Lehman Brothers Bankruptcy
http://slidepdf.com/reader/full/11096014-causes-and-effects-of-the-lehman-brothers-bankruptcy 11/26
11
Finally, as Morris and Shin (2002) have shown in a situation where
there are multiple equilibria, increasing public information is not necessarily
welfare enhancing, because it can lead to inefficient bank runs (Diamond
and Dybvig, 1983).
3. Lack of Transparency
The other major source of problems that contributed to the crisis was
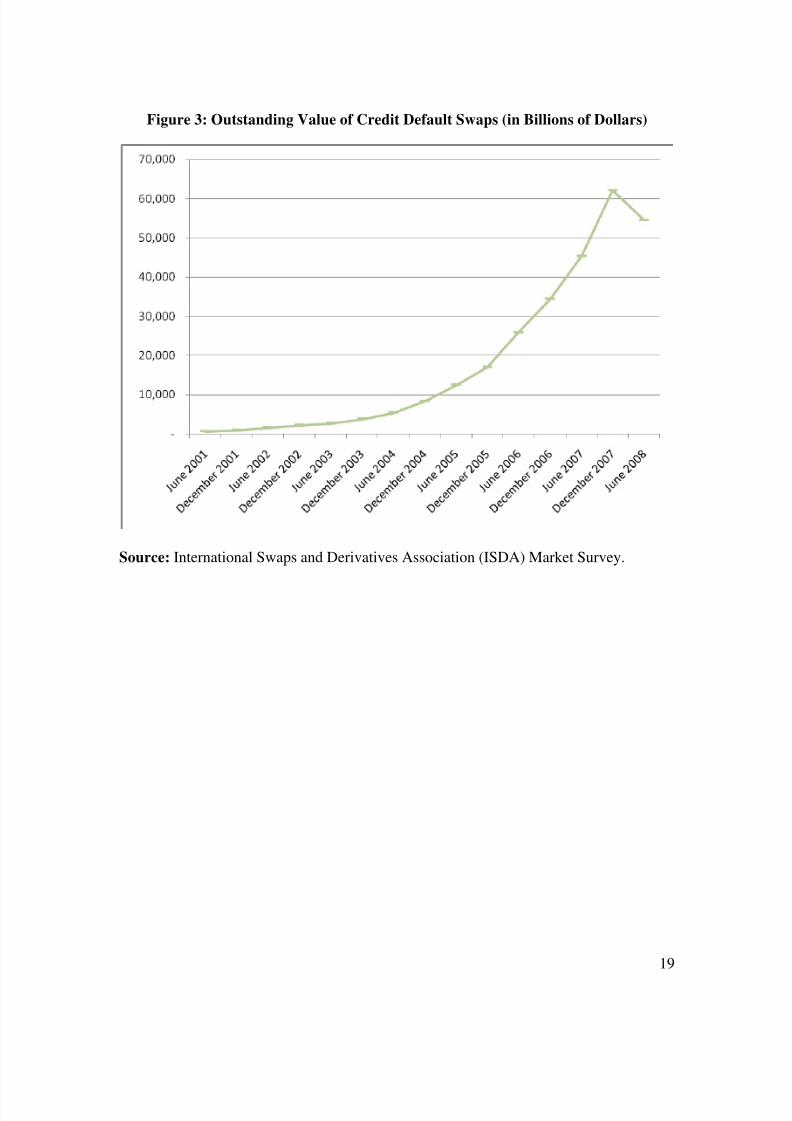
the lack of transparency in major markets. As Figure 3 shows, during the last
ten years the market for credit default swaps (CDS) grew unregulated from
almost zero to more than $44 trillion (more than twice the size of the U.S.
stock market). More importantly, the level of collateral posted for these
contracts was very low or non-existent, generating the possibility of a
systemic failure. If in the middle of the hurricane season all of a sudden all
Florida homeowners lost the insurance for their house, there would be an
enormous run to buy new insurance. Given that in the short term, insurance
capacity is limited, the prices will go to the roof. If some home owners could
not afford these prices, their mortgages will automatically default, triggering
foreclosures and a real estate crisis. This is one of the reasons why the
insurance market is regulated.
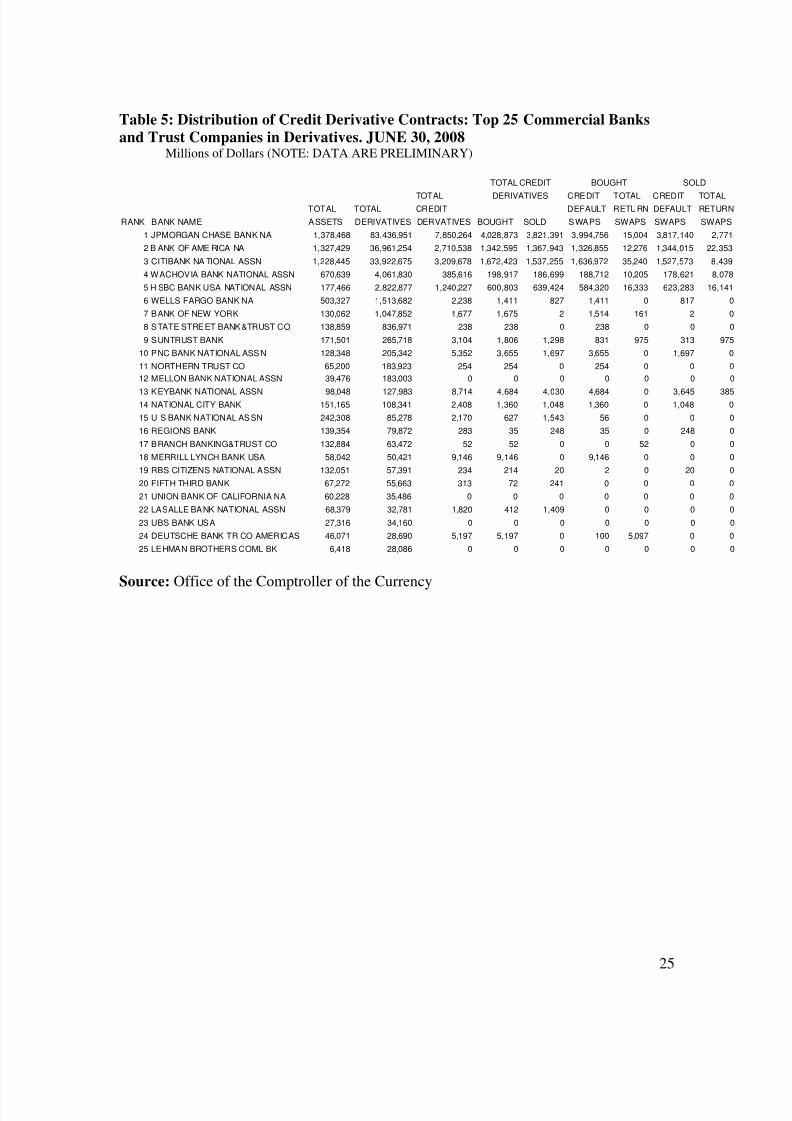
The same would be true if a large CDS player, like AIG, defaulted. As
Table 5 shows, large commercial banks have massive exposure to CDS.
Most of their positions are hedged; hence the net exposure is much smaller.
Nevertheless, if they a major player defaults, all the other ones will find
themselves un-hedged, triggering a run to buy insurance, with consequences
not dissimilar from the case described above. In spite of its potential
systemic effects, the market for CDS is completely unregulated.
The same is true for the mortgage-backed security market. In 2007
there were almost 6 trillion mortgage-backed securities outstanding (Gorton,
8/6/2019 11096014 Causes and Effects of the Lehman Brothers Bankruptcy
http://slidepdf.com/reader/full/11096014-causes-and-effects-of-the-lehman-brothers-bankruptcy 12/26
12
2008). Most of these securities were issued under the 144A rule, with
limited disclosure. This lack of transparency in the issuing process made it
difficult to determine who owned what. Furthermore, the complexity of
these repackaged mortgages is such that small differences in the assumed
rate of default can cause the value of some tranches to fluctuate from 50
cents on the dollar to zero. Lacking information on the nature and hence the
value of banks’ assets, the market grew reluctant to lend to them, for fear of
losing out in case of default. One often-used measure of this reluctance is the
spread between Libor and the overnight indexed swap (OIS) rate of the same
maturity. Before the beginning of the crisis the multi-year average of this
spread was 11 basis points. On August 10 2007 it was over 50 basis points
and it was over 90 basis points by mid-September. While fluctuating it has
mostly remained above that level ever since (Gorton, 2008).
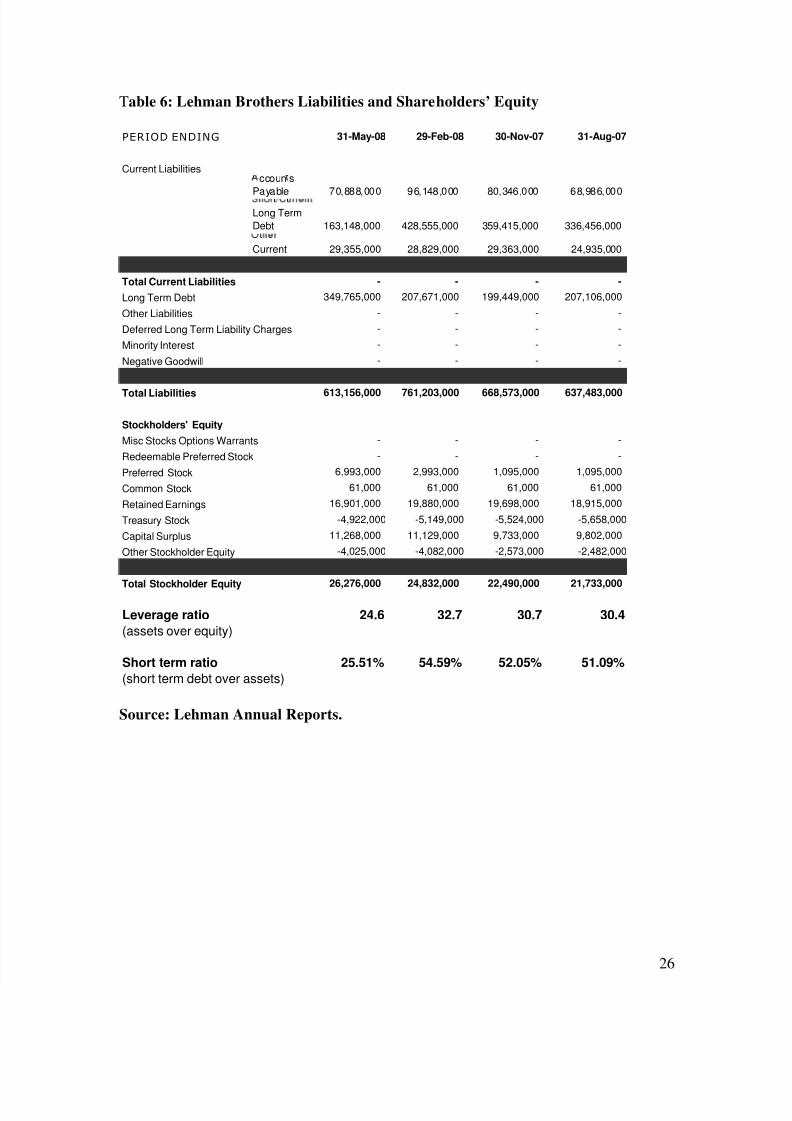
4. Lehman Financial Policy
In the case of Lehman (and other investment banks), this problem was
aggravated by two factors: the extremely high level of leverage (asset-to-
equity ratio) and the strong reliance on short-term debt financing. While
commercial banks are regulated and cannot leverage their equity more than
15 to 1, at the beginning of the crisis Lehman had a leverage of more than 30
to 1, i.e. only $3.30 of equity for every $100 of loans (Table 6). With this
leverage, a mere 3.3% drop in the value of assets wipes out the entire value
of equity and makes the company insolvent.
In turn, the instability created by the leverage problem was
exacerbated by Lehman’s large use of short-term debt, which financed more
than 50% of the asset at the beginning of the crisis (Table 6). In a low
interest rate environment, reliance on short-term borrowing is very profitable,
8/6/2019 11096014 Causes and Effects of the Lehman Brothers Bankruptcy
http://slidepdf.com/reader/full/11096014-causes-and-effects-of-the-lehman-brothers-bankruptcy 13/26
13
but increases the risk of “runs” similar to the ones bank face when they are
rumored to be insolvent. Any doubt regarding the solvency of the borrower
makes short-term lenders leery to renew their lending. These doubts can be
self-fulfilling, in that if enough short-term lenders withdraw their funds, the
borrower faces a liquidity shortage, which cannot be easily dealt with in the
current economic environment, forcing a firm to default.
After the beginning of the crisis, Lehman did try to reduce its leverage
and reduce its reliance on short term debt (see Table 6). But it was too little,
too late. Lehman succumbed.
The Lehman CEO will likely tell you that his company was solvent
and that it was brought down by a run. This is a distinct possibility. The
problem is that nobody knows for sure. When Lehman went down, it had
$20 billion in book equity, but the doubts about the value of its assets
combined with its high degree of leverage created a huge uncertainty about
the true value of this equity: it could have been worth $40 billion or negative
20. It is important to note that Lehman did not find itself in that situation by
accident; it was the unlucky draw of a consciously-made gamble.
5. Consequences of Lehman default
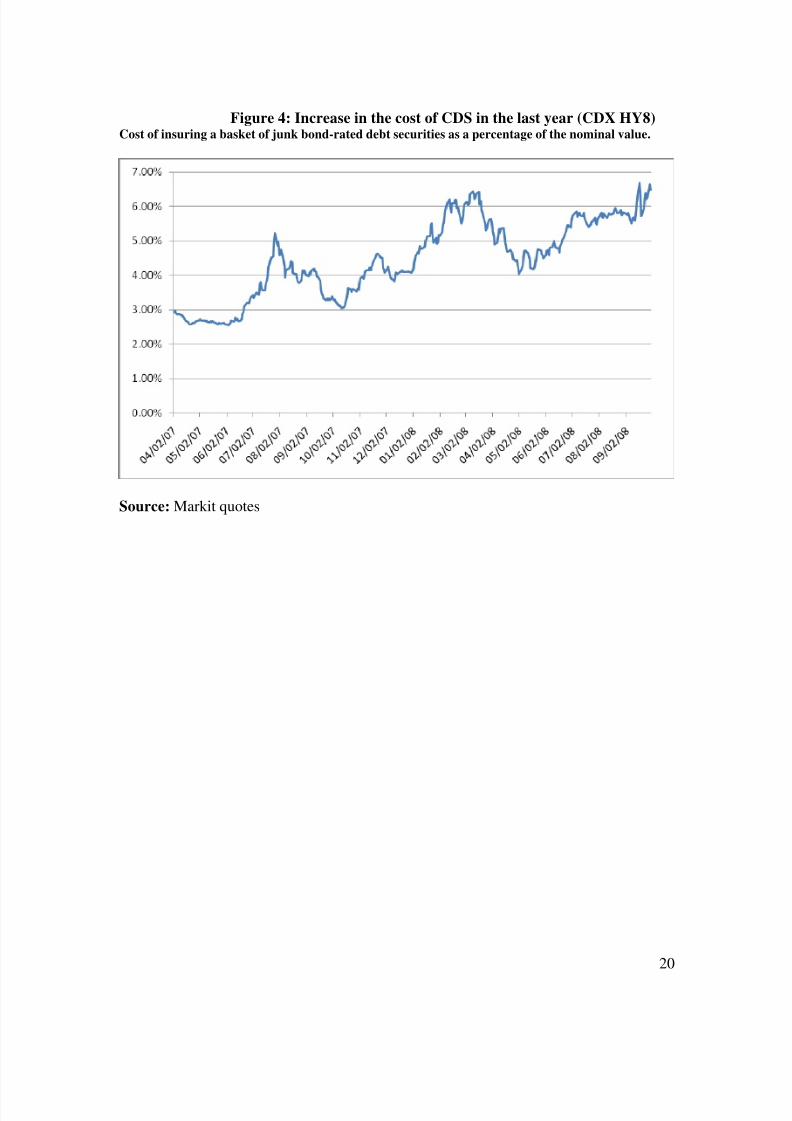
Lehman’s bankruptcy forced the market to reassess risk. As after a
major flood people start to buy flood insurance, after the demise of Lehman
the market started to worry about several risks previously overlooked. One
way to valuate quantitatively this reassessment of risk is to look at the price
of credit default swaps. Figure 4 reports the cost of insuring an index of junk
bond issuers during the last one and a half year. Before the crisis it cost only
$2.50 to insure $100 invested in junk bonds. In July 2007 the price moved
above $4. During the Bear Stearns crisis, the price shot above $6, to return to
about $4.50 in June. After the demise of Lehman the price returned slightly
8/6/2019 11096014 Causes and Effects of the Lehman Brothers Bankruptcy
http://slidepdf.com/reader/full/11096014-causes-and-effects-of-the-lehman-brothers-bankruptcy 14/26
14
above $6, a very high level, but comparable to the one experienced around
the time of the Bear Stearns crisis. Given that two different policy responses
-- Bear Stearns was saved, while Lehman not – lead to the same market
response, the most likely interpretation is that these extreme events force the
market to reassess the risk, regardless of the policy response adopted.
Lehman’s filing for bankruptcy had a more dramatic impact on
money market funds. On September 16th Primary Fund, a $62 billion fund,
announced that because of the total loss it suffered on its $785 million
holding of Lehman Brothers debt, it was forced to put a seven-day freeze on
redemptions, since the net asset value of its shares fell below $1. By
contradicting a long-standing belief that money market fund will never
“break the buck,” this decision did contribute to increase the sense of
uncertainty. The guarantee offered by the Government, however, has
minimized this side effect.
8/6/2019 11096014 Causes and Effects of the Lehman Brothers Bankruptcy
http://slidepdf.com/reader/full/11096014-causes-and-effects-of-the-lehman-brothers-bankruptcy 15/26
15
References
Ashcraft, Adam B. and Til Schuermann, 2008, “Understanding the Securitization of Subprime Mortgage Credit”, Wharton Financial Institutions Center WorkingPaper No. 07-43.
Benmelech, Efraim and Jennifer Dlugoszb, 2008, “The Alchemy of CDO CreditRatings”, Harvard University Working Paper.
Dell'Ariccia, Giovanni, Deniz Igan and Luc A. Laeven, 2008, “Credit Booms andLending Standards: Evidence from the Subprime Mortgage Market”, CEPRDiscussion Paper No. DP6683.
Diamond, D. and P. Dybvig, 1983, “Bank runs, Deposit Insurance and Liquidity”, Journal of Political Economy.
Demyanyk, Yuliya and Otto Van Hemert, 2008, “Understanding the Subprime MortgageCrisis”, Working Paper.
Dolan, Karen, 2008, “Ultrashort-Term Bond Funds Suffer Massive Blow”, Moningstar.com, 09-03-08.
Duffie, Darrell, 2004, “Irresistible Reasons for Better Models of Credit Rating”,Financial Times, Apr 16, 2004.
Evans, David, 2007, “Unsafe Havens”, Bloomberg Markets, October 2007.
Gorton, Gary, 2008, “The Panic of 2007”, NBER working paper n. 14358.
Keys, Benjamin J., Tanmoy Mukherjee, Amit Seru, Vikrant Vig, 2008, “DidSecuritization Lead to Lax Screening? Evidence From Subprime Loans”,University of Chicago Working Paper.
Labaton, Stephen, 2008, “Agency’s ’04 Rule Let Banks Pile Up New Debt, and Risk”, New York Times, 10-3-2008.
Mian, Atif R. and Amir Sufi, 2008, “The Consequences of Mortgage Credit Expansion:Evidence from the 2007 Mortgage Default Crisis”, University of ChicagoWorking Paper.
Mian, Atif R., Amir Sufi, and F. Trebbi, 2008, “The Political Economy of the U.S.Mortgage Default Crisis”, University of Chicago Working Paper.
Morris, S and H. Shin, 2002, “Social Value of Private Information”, American Economic
Review.
8/6/2019 11096014 Causes and Effects of the Lehman Brothers Bankruptcy
http://slidepdf.com/reader/full/11096014-causes-and-effects-of-the-lehman-brothers-bankruptcy 16/26
16
Nadauld, Taylor D. and Shane M. Sherlund, 2008, “The Role of the SecuritizationProcess in the Expansion of Subprime Credit”, Ohio State Working Paper.
Rajan, U, A. Seru, V. Vig, 2008, “The Failure of Models That Predict Failure: Distance,Incentives and Defaults”, University of Chicago Working Paper.
Rojas-Suarez, Liliana, 2008, Can International Capital Standards Strengthen Banks In
Emerging Markets?, Institute for International Economics Working Paper.
Ryan, G. Stephen, 2008, “Accounting in and for the Subprime Crisis”, Stern School of Business, New York University, March 2008.
Shiller, Robert J., 2005, “Irrational Exuberance”, Princeton University Press 2nd
edition.
Shiller, Robert J., 2008, “The Subprime Solution: How Today's Global Financial CrisisHappened, and What to Do about It”, Princeton University Press.
Whalen, R. Chrisopher, 2008, “The Subprime Crisis: Cause, Effect and Consequences”,Networks Financial Institute Policy Brief No. 2008-PB-04.
8/6/2019 11096014 Causes and Effects of the Lehman Brothers Bankruptcy
http://slidepdf.com/reader/full/11096014-causes-and-effects-of-the-lehman-brothers-bankruptcy 17/26
17
Figure 1: Abnormal rise in house prices in the new millennium
0
50
100
150
200
1880 1900 1920 1940 1960 1980 2000 2020
Year
I n d e x o r I n t e r e s t R a t e
0
10
20
30
40
50
60
70
80
90
10
Home Prices
Building Costs Population
Interest Rates
Source: Shiller (2005).
8/6/2019 11096014 Causes and Effects of the Lehman Brothers Bankruptcy
http://slidepdf.com/reader/full/11096014-causes-and-effects-of-the-lehman-brothers-bankruptcy 18/26
18
Figure 2: Importance of Structured Finance Products for Credit Rating Agencies
(Rating revenues by business unit: Structured Finance (in Millions of Dollars))
Source: Moody’s Annual Reports
8/6/2019 11096014 Causes and Effects of the Lehman Brothers Bankruptcy
http://slidepdf.com/reader/full/11096014-causes-and-effects-of-the-lehman-brothers-bankruptcy 19/26
19
Figure 3: Outstanding Value of Credit Default Swaps (in Billions of Dollars)
Source: International Swaps and Derivatives Association (ISDA) Market Survey.
8/6/2019 11096014 Causes and Effects of the Lehman Brothers Bankruptcy
http://slidepdf.com/reader/full/11096014-causes-and-effects-of-the-lehman-brothers-bankruptcy 20/26
20
Figure 4: Increase in the cost of CDS in the last year (CDX HY8)Cost of insuring a basket of junk bond-rated debt securities as a percentage of the nominal value.
Source: Markit quotes
8/6/2019 11096014 Causes and Effects of the Lehman Brothers Bankruptcy
http://slidepdf.com/reader/full/11096014-causes-and-effects-of-the-lehman-brothers-bankruptcy 21/26
21
Table 1: Decline in Delinquency Rates During the Boom Among Major Investor Groups
CMBSLife
CompaniesFannieMae*
FreddieMac
Banks &Thrifts
(30+ days and REO) (60+ days) (60+ days) (60+ days) (90+ days)
Year-end12/31/1996 n.a. 1.79% 0.68% 1.96% 1.58%
12/31/1997 0.39% 0.90% 0.37% 0.96% 1.18%
12/31/1998 0.54% 0.48% 0.29% 0.37% 0.94%
12/31/1999 0.51% 0.25% 0.12% 0.14% 0.73%
12/31/2000 0.81% 0.28% 0.04% 0.04% 0.69%
12/31/2001 1.26% 0.12% 0.33% 0.15% 0.92%
12/31/2002 1.47% 0.28% 0.13% 0.13% 0.86%
12/31/2003 1.72% 0.12% 0.13% 0.05% 0.78%
12/31/2004 1.29% 0.08% 0.10% 0.06% 0.61%
12/31/2005 0.85% 0.05% 0.27% 0.00% 0.53%
12/31/2006 0.41% 0.02% 0.08% 0.05% 0.56%
12/31/2007 0.40% 0.01% 0.08% 0.02% 0.80%
Source: Mortgage Bankers Association (Commercial-multifamily delinquency survey).
Definitions of delinquency rate for the respective companies: • CMBS: 30+ days delinquent or in REO;• Life company portfolios: 60+days delinquent;• Fannie Mae: 60 or more days delinquent;• Freddie Mac: 60 or more days delinquent;• Banks and thrifts: 90 or more days delinquent or in non-accrual.
8/6/2019 11096014 Causes and Effects of the Lehman Brothers Bankruptcy
http://slidepdf.com/reader/full/11096014-causes-and-effects-of-the-lehman-brothers-bankruptcy 22/26
22
Table 2: Underwriting Standards for Subprime Mortgages
Adjusted RateMortgages Share
InterestOnly Share
Low/NoDocumentation Share
Debt-to-Income Ratio
Average Loan-to-Value Ratio
Year
2001 73.00% 0.00% 28.50% 39.7 842002 80.00% 2.30% 38.60% 40.1 84.4
2003 80.10% 8.60% 42.80% 40.5 86.1
2004 89.40% 27.20% 45.20% 41.2 84.7
2005 93.30% 37.80% 50.70% 41.8 83.2
2006 91.30% 22.80% 50.80% 42.4 83.4
Source: Gorton (2008).
8/6/2019 11096014 Causes and Effects of the Lehman Brothers Bankruptcy
http://slidepdf.com/reader/full/11096014-causes-and-effects-of-the-lehman-brothers-bankruptcy 23/26
23
Table 3: HUD's official 2005 housing goals and Special Affordable Multifamily
subgoal performance figures for Fannie Mae and Freddie Mac
Housing goalsGoal
TargetsFannie Mae
ResultsFreddie Mac
Results
Low- and Moderate-Income 52% 55.06% 54.00%Central Cities, Rural Areas, and OtherUndeserved Areas 37% 41.43% 42.27%
Special Affordable 22% 26.28% 24.28%
Special Affordable Multifamily Subgoal
Fannie Mae = $ 5.49 Billons $ 10.39 Billons $ 12.35 Billons
Freddie Mac = $ 3.92 Billons
Source: U.S. Department of Housing and Urban Development's Homes andCommunities (http://www.hud.gov/news/release.cfm?CONTENT=pr06-136.cfm)
8/6/2019 11096014 Causes and Effects of the Lehman Brothers Bankruptcy
http://slidepdf.com/reader/full/11096014-causes-and-effects-of-the-lehman-brothers-bankruptcy 24/26
24
Table 4: Investments of Some of the Largest Money Market Funds in CDO
Commercial Paper.
Money MarketFund
Millions of Dollars investedin CDO Commercial Paper
Percentage ofHoldings
AIM 2,300 10.20%
Credit Suisse 1,800 8.00%
Fidelity Investments 1,500 1.50%
Morgan Stanley 1,060 4.00%
Wells Fargo 586 5.10%
Source: Evans (2007).
8/6/2019 11096014 Causes and Effects of the Lehman Brothers Bankruptcy
http://slidepdf.com/reader/full/11096014-causes-and-effects-of-the-lehman-brothers-bankruptcy 25/26
25
Table 5: Distribution of Credit Derivative Contracts: Top 25 Commercial Banks
and Trust Companies in Derivatives. JUNE 30, 2008Millions of Dollars (NOTE: DATA ARE PRELIMINARY)
TOTAL CREDIT TOTAL CREDIT TOTALTOTAL TOTAL CREDIT DEFAULT RETURN DEFAULT RETURN
RANK BANK NAME ASSETS DERIVATIVES DERVATIVES BOUGHT SOLD SWAPS SWAPS SWAPS SWAPS
1 JPMORGAN CHASE BANK NA 1,378,468 83,436,951 7,850,264 4,028,873 3,821,391 3,994,756 15,004 3,817,140 2,771
2 B ANK OF AME RICA NA 1,327,429 36,961,254 2,710,538 1,342,595 1,367,943 1,326,855 12,276 1,344,015 22,353
3 CITIBANK NA TIONAL ASSN 1,228,445 33,922,675 3,209,678 1,672,423 1,537,255 1,636,972 35,240 1,527,573 8,439
4 WACHOVIA BANK NATIONAL ASSN 670,639 4,061,830 385,616 198,917 186,699 188,712 10,205 178,621 8,078
5 H SBC BANK USA NATIONAL ASSN 177,466 2,822,877 1,240,227 600,803 639,424 584,320 16,333 623,283 16,141
6 WELLS FARGO BANK NA 503,327 1,513,682 2,238 1,411 827 1,411 0 817 0
7 BANK OF NEW YORK 130,062 1,047,852 1,677 1,675 2 1,514 161 2 0
8 STATE STREET BANK&TRUST CO 138,859 836,971 238 238 0 238 0 0 0
9 SUNTRUST BANK 171,501 265,718 3,104 1,806 1,298 831 975 313 975
10 PNC BANK NATIONAL ASSN 128,348 205,342 5,352 3,655 1,697 3,655 0 1,697 0
11 NORTHERN TRUST CO 65,200 183,923 254 254 0 254 0 0 0
12 MELLON BANK NATIONAL ASSN 39,476 183,003 0 0 0 0 0 0 0
13 KEYBANK NATIONAL ASSN 98,048 127,983 8,714 4,684 4,030 4,684 0 3,645 38514 NATIONAL CITY BANK 151,165 108,341 2,408 1,360 1,048 1,360 0 1,048 0
15 U S BANK NATIONAL ASSN 242,308 85,278 2,170 627 1,543 56 0 0 0
16 REGIONS BANK 139,354 79,872 283 35 248 35 0 248 0
17 BRANCH BANKING&TRUST CO 132,884 63,472 52 52 0 0 52 0 0
18 MERRILL LYNCH BANK USA 58,042 50,421 9,146 9,146 0 9,146 0 0 0
19 RBS CITIZENS NATIONAL ASSN 132,051 57,391 234 214 20 2 0 20 0
20 FIFTH THIRD BANK 67,272 55,663 313 72 241 0 0 0 0
21 UNION BANK OF CALIFORNIA NA 60,228 35,486 0 0 0 0 0 0 0
22 LASALLE BANK NATIONAL ASSN 68,379 32,781 1,820 412 1,409 0 0 0 0
23 UBS BANK USA 27,316 34,160 0 0 0 0 0 0 0
24 DEUTSCHE BANK TR CO AMERICAS 46,071 28,690 5,197 5,197 0 100 5,097 0 0
25 LEHMAN BROTHERS COML BK 6,418 28,086 0 0 0 0 0 0 0
DERIVATIVES
SOLDBOUGHTTOTAL CREDIT
Source: Office of the Comptroller of the Currency
8/6/2019 11096014 Causes and Effects of the Lehman Brothers Bankruptcy
http://slidepdf.com/reader/full/11096014-causes-and-effects-of-the-lehman-brothers-bankruptcy 26/26
Table 6: Lehman Brothers Liabilities and Shareholders’ Equity
31-May-08 29-Feb-08 30-Nov-07 31-Aug-07
ccoun s
Payable 70,888,000 96,148,000 80,346,000 68,986,000Long Term
Debt 163,148,000 428,555,000 359,415,000 336,456,000
Current 29,355,000 28,829,000 29,363,000 24,935,000
- - - -
349,765,000 207,671,000 199,449,000 207,106,000
- - - -
- - - -
- - - -
- - - -
613,156,000 761,203,000 668,573,000 637,483,000
- - - -
- - - -
6,993,000 2,993,000 1,095,000 1,095,000
61,000 61,000 61,000 61,000
16,901,000 19,880,000 19,698,000 18,915,000
-4,922,000 -5,149,000 -5,524,000 -5,658,000
11,268,000 11,129,000 9,733,000 9,802,000
-4,025,000 -4,082,000 -2,573,000 -2,482,000
26,276,000 24,832,000 22,490,000 21,733,000
Leverage ratio 24.6 32.7 30.7 30.4
(assets over equity)
Short term ratio 25.51% 54.59% 52.05% 51.09%
(short term debt over assets)
PERIOD ENDING
Current Liabilities
Total Current Liabilities
Long Term Debt
Other Liabilities
Deferred Long Term Liability Charges
Minority Interest
Negative Goodwill
Total Liabilities
Stockholders' Equity
Misc Stocks Options Warrants
Redeemable Preferred Stock
Preferred Stock
Other Stockholder Equity
Total Stockholder Equity
Common Stock
Retained Earnings
Treasury Stock
Capital Surplus
Source: Lehman Annual Reports.