lehman brothers g - yale school of management · yale program on financial stability case study...
TRANSCRIPT
yale program on financial stability case study 2014-3g-v1 october 1, 2014 revised: april 7, 2015
The Lehman Brothers Bankruptcy G:1
The Special Case of Derivatives
Rosalind Z. Wiggins2 Andrew Metrick3
Abstract
When it filed for bankruptcy protection in September 2008, Lehman Brothers was an active participant in the derivatives market and was party to 906,000 derivative transactions of all types under 6,120 ISDA Master Agreements with an estimated notional value of $35 trillion. The majority of Lehman’s derivatives were bilateral agreements not traded on an exchange but in the over-the-counter (OTC) market. Because derivatives enjoyed an exemption from the automatic stay provisions of the U.S. Bankruptcy Code, parties to Lehman’s derivatives could seek resolution and self-protection without the guidance and restraint of the bankruptcy court. The rush of counterparties to novate Lehman’s derivative contracts, and the confusion following contracts that were terminated after its bankruptcy filing, added to the stress of the financial crisis in two ways: (1) loss of value to the Lehman estate and (2) exacerbating the contagion effects of the bankruptcy. This case explores the disposition of Lehman’s derivatives and its impacts.
1 This case study is one of eight Yale Program on Financial Stability (YPFS) case modules considering the Lehman Brothers Bankruptcy. The others are:
• The Lehman Brothers Bankruptcy A: Overview. • The Lehman Brothers Bankruptcy B: Risk Limits and Stress Tests. • The Lehman Brothers Bankruptcy C: Managing the Balance Sheet Through the Use of Repo 105. • The Lehman Brothers Bankruptcy D: The Role of Ernst & Young. • The Lehman Brothers Bankruptcy E: The Effects on Lehman’s U. S. Broker-Dealer. • The Lehman Brothers Bankruptcy F: Introduction to the ISDA Master Agreement. • The Lehman Brothers Bankruptcy H: The Global Contagion.
Cases are available at the YPFS website, http://som.yale.edu/ypfs, or may be downloaded from the Social Science Research Network. 2 Project Editor, Case Study and Research, YPFS, Yale School of Management. The authors acknowledge helpful comments from Fernando Duarte. 3 Michael H. Jordan Professor of Finance and Management, and YPFS Program Director, Yale School of Management
_____________________________________________________________________
1. Introduction
Derivatives are complicated and sophisticated financial instruments that derive their value from some underlying asset, reference, or index. They vary widely from futures, to stock options, to interest rate swaps and credit default swaps (CDSs), to even more customized and exotic formulations. Some derivatives are traded on established exchanges, but most are private bilateral agreements in the unregulated over-the-counter (OTC) market.4 Derivatives began to be widely used in the 1970s, and by June 2008, the combined derivatives market had grown to an estimated $800 trillion in notional amount.5
Prior to the financial crisis, derivatives enjoyed an exemption from the automatic stay provisions of the United States (U.S.) Bankruptcy Code. Therefore when Lehman filed for bankruptcy protection in September 2008, parties could seek resolution without the guidance of the bankruptcy court. Lehman Brothers was an active participant in the OTC derivatives market and, at the time of its filing for bankruptcy, was party to 906,000 derivative transactions of all types under 6,1206 ISDA Master Agreements (the form of contract used most often for documenting derivative transactions), 7 with a notional value of $35 trillion. (Summe 2011,16,18.) The sheer size of Lehman’s derivatives book and how it was resolved raised questions about the systemic risk posed by this significant unregulated market. The rush of counterparties to novate Lehman’s derivative contracts (i.e., unwind them by replacing Lehman or the obligation with another party or substitute obligation, as allowed) and the sudden termination of hundreds of thousands of trades added to the stress of the financial crisis in two ways: (1) it resulted in loss of value to the Lehman estate, and (2) it spread the contagion effects of the bankruptcy.
Since the crisis, the regulatory exemption for OTC derivatives has been largely eliminated. Derivative reform was a major element of the Dodd-Frank Wall Street Reform and Consumer Protection Act of 2010 (Dodd-Frank), which now requires most derivatives to be centrally cleared and that dealers meet certain requirements. Several international authorities are also working with U.S. regulators to harmonize their laws in recognition of the cross-border nature of the market.
In this case, we will discuss (1) how Lehman’s book of derivatives was resolved and to evaluate the efficacy of the methods used, (2) how the regulation of derivatives has been modified with the adoption of Dodd-Frank, and (3) whether derivatives now pose more or less of a systemic risk to financial stability than they did in 2008.
The balance of this case is organized as follows: Section 2 provides a summary description of derivatives; Section 3 describes how derivatives are traded, while Section 4 summarizes the ISDA Master Agreement that governs most trades, and Sections 5 and 6 discuss limited regulation of derivatives and the exemption that they enjoyed under the Bankruptcy Code, respectively. Section 7 explains the disposition of Lehman’s derivatives, with Sections 8 and 9 addressing its exchange-traded derivatives and credit default swaps. Finally, Section 10 addresses the question of value destruction and impact, and Section 11 discusses the new regulations enacted as part of Dodd-Frank.
4 See Miller and Ruane (2012) for a discussion of how the exchanges and OTC markets work. 5 It should be noted, however, as discussed below, that the notional value usually is not indicative of the market value, the cost of replacing all open contracts at current prices, which is in most instances much less. An October 1997 report by the General Accounting Office (GAO) suggests that the market value of OTC derivatives represents "about 3 percent" of the notional amount. (CFTC 1998.) 6 “The exact total number of Lehman’s derivatives trades and contracts at the time of bankruptcy remains unclear. Reports by the Lehman estate variously put the number of trades at 906,000, 930,000, and 1,178,000 and the number of contracts at 6,120, 6,340, and 6,355. (Fleming and Sarkar 2014, 11, Fn 20.) 7 See McNamara and Metrick 2014F for further detailed discussion of the ISDA agreement.
2 LEHMAN BROTHERS BANKRUPTCY G: THE SPECIAL CASE OF DERIVATIVES
_____________________________________________________________________

Questions
1. What are the distinguishing characteristics of OTC versus exchange-traded derivatives?
2. Does the ISDA Master Agreement provide effective methods to discharge transactions in the event of the failure of a major dealer?
3. Were the Lehman methods used to dispose of the Lehman derivatives effective?
4. How can the disposition of derivatives be improved in the event of failure of a major dealer?
5. Will the changes made by Dodd-Frank prove sufficient to minimize any negative systemic effect of derivatives in the future?
2. Derivatives Defined
A derivative is a security whose value depends on (or derives from) the value of an underlying asset, reference rate or index (the “underlying”). The most common types of underlyings are commodities, stocks, bonds, indices, interest rates, currencies, or spreads between the value of such assets. The value of a derivative fluctuates with changes in the value of the underlying asset or index; this occurs even if the owner of the derivative does not own the underlying asset. (Miller and Ruane 2012, 1-2.) Common types of derivatives include forwards, futures contracts, options, interest rate swaps and credit default swaps, the basic characteristics of which are described in Figure 1.
Figure 1: Characteristics of Common Derivatives
Type of Derivative Description Underlying
Where Traded* Exchange/ Regulator OTC
Future
Provides an opportunity to purchase a certain commodity in the amounts, and at the price, stated in the agreement at a future date. Contracts are standardized to facilitate trading on futures exchange.
Commodity Yes/CFTC No
Forward
Provides an opportunity to purchase or sell a certain commodity in the amounts, and at the price, stated in the agreement on the specified date. Highly customizable as to commodity, amount, date, and payment. Often used for hedging.
Commodity No Yes
Call Stock Option
Provides an opportunity to purchase a certain stock in the amounts, and at the price, specified in the contract on a future date.
Equity Stock Yes/SEC No
Put Stock Option
Provides an opportunity to sell a certain stock in the amounts, and at the price, specified in the contract on a future date. Equity Stock Yes/SEC No
Interest Rate Swap
Provides that a party will pay the one stream of future interest rate payments in exchange for another with respect to the principal (“notional value”) stated in the contract.
Interest Rate or Index No Yes
Credit Default Swap
Insures a party against the risk of a company defaulting on its bonds or becoming insolvent.
Company Bond No Yes
Currency Swap Provides that a party will pay the exchange rate specified in the contract with respect to the stated principle.
Currency Rate or
Exchange No Yes
* Pre Dodd-Frank SEC – Securities and Exchange Commission CFTC – Commodities and Futures Trade Commission Source: Project Editor Notes.
3 LEHMAN BROTHERS BANKRUPTCY G: THE SPECIAL CASE OF DERIVATIVES
Money managers use derivatives to hedge positions and to address risks from volatility in interest rates, foreign exchange rates, commodity prices, and equity prices, among other things. For example, if a company requires a particular type of raw material, it can purchase futures in that material to lock in future prices and hedge against price fluctuations. Derivatives are also used to assume price risk in order to increase investment yields or to speculate on price changes. In addition, they may also be used as collateral for repo financings transactions and to create synthetic securities based on the returns from a portfolio of underlying securities.
Participants in the derivatives market include banks, other financial service providers, commercial corporations, insurance companies, pension funds, colleges and universities, and governmental entities. It is a widespread and highly interconnected global market. (CFTC 1998.)
3. How Derivatives are Traded
Derivatives are traded in two ways: (1) on specialized, regulated derivatives exchanges, and (2) OTC. Prior to the changes made by Dodd-Frank, futures contracts were traded on commodity exchanges and stock options were traded on stock exchanges, regulated by the Commodity Futures Trading Commission (CFTC) and the SEC, respectively. In an exchange-traded deal, the exchange matches the two sides of the deal and also acts as a clearing house guaranteeing each side, essentially assuming the parties’ obligations. Trades and prices are readily tracked on exchanges, facilitating greater transparency and readily available market valuations. When the markets became stressed in 2008, there was little effect on these types of derivatives. Holders could easily assess their risk, since they knew that the exchanges stood behind the derivatives and would match the published values. (Miller and Ruane 2012, 4).
In contrast to the exchanges, the OTC derivatives market consists of a network of dealers who stand ready to take either the long or short positions and make money on spreads and fees. Collateral was required for some transactions but not always, and large uncollateralized risks could occur. (Ibid.) The dealer absorbs the credit risk of customer default, and the customer faces the risk of dealer default. (Ibid.)
As Figure 2 shows, the OTC market grew dramatically in the 2000s. Prior to the changes implemented by Dodd-Frank, OTC derivatives were not regulated, and information did not have to be reported to any third party; thus, prices were not readily available. As a consequence of the non-public nature of the OTC market, Lehman’s bankruptcy caused panic and a run to novate in a market for which readily available prices were available.
After the financial crisis, in recognition of the role that OTC derivatives had played, new regulations were passed as part of Dodd-Frank, largely removing the exemption and requiring that derivative transactions be centrally cleared, facilitating data collection and reporting.
4 LEHMAN BROTHERS BANKRUPTCY G: THE SPECIAL CASE OF DERIVATIVES

Figure 2: Positions in OTC Derivatives Markets (in US$ trillions)
Source: Bank of International Settlements 2007
Size of the Market
By far, the overwhelming majority of derivatives are traded on the OTC market. As can be seen in Figure 3, as of June 2008, this market was $684 trillion in notional value,8 with exchange-traded derivatives amounting to $84 trillion. The market dipped during the financial crisis, with OTC derivatives dropping by $79 trillion (11.6%) from June 2008 to June 2009. However, by 2013, the market had returned to pre-crisis levels.
Figure 3: Global Derivatives Market
12/2006 6/2007 6/2008 6/2009 6/2010 6/2013 6/2014
Exchange Traded 70,444 95,097 84,287 63,449 75,418 66,311 73,463
OTC Traded 414,845 516,407 683,725 604,622 582,655 692,908 691,492
Market Value of OTC Derivatives*
9,691 11,140 20,353 25,372 24,673 20,158 17,423
* Cost of replacing all outstanding contracts at current market prices in US$ trillions. Source: Bank for International Settlements, November 2008, November 2009, May 2012, November 2014..
8 Notional value represents the “face value” of a derivative. For example, a corporation might purchase $10 billion notional value credit default swap to provide support for a position in Lehman bonds should Lehman falter. When Lehman was healthy, the financial, the economic value of this would be only a small fraction of the notional amount. (See Footnote 4 above.) However, in September 2008, when Lehman’s demise began to look imminent, the market value of its CDSs began to approximate the face value. See also the discussion regarding the auction of Lehman’s CDSs below.
5 LEHMAN BROTHERS BANKRUPTCY G: THE SPECIAL CASE OF DERIVATIVES
_____________________________________________________________________
Because of the slim likelihood that all derivatives will pay out at 100% at the same time, the market value of these amounts is usually estimated to be much smaller. In June 2008, estimated aggregate market value of the notional amount of OTC derivatives outstanding was $20,353 trillion.
4. The ISDA Master Agreement
The International Swaps and Derivatives Association (ISDA) is the major international trade association for derivatives issuers. ISDA published in 1992, and updated in 2002, a standardized form agreement that is the most widely used agreement documenting derivative transactions (the “ISDA Master Agreement.”) The agreement recognizes that parties often enter into numerous derivative transactions with each other and serves to streamline and order the process by allowing many transactions under one master agreement.9 (See McNamara and Metrick 2014F, which discusses the ISDA agreement in more detail.)
Valuing Derivatives in the Event of Default
The ISDA Master Agreement permits all transactions under the agreement to be netted against one another to determine a net liability of one party to the other. Upon a party’s (or guarantor’s) default, the non-defaulting party may terminate the transaction, or the contract may include a provision providing for automatic termination. The bankruptcy filing of Lehman Brothers Holding Inc., the parent company, was a default under most, if not all, of Lehman’s derivative contracts. As a result, Lehman’s contracts terminated automatically or were terminated by counterparties who had the right to seize collateral held, as their agreements provided.10 And just what those rights were depended on the particular terms of their individual agreements.
Market Quotation & Loss Methods
Under the 1992 Master Agreement, payments upon termination are based either on the “Market Quotation” or “Loss” approach. The Market Quotation approach requires the non-defaulting party to obtain at least three quotations from leading derivatives dealers on the amounts they would expect to pay or receive to enter into a replacement transaction with the non-defaulting party.11
If three quotations are not available, if the quotations result in a commercial unreasonable result (as determined in good faith by the non-defaulting party), or if the parties have already so chosen in the Master Agreement, the Loss approach will apply. The Loss approach requires the non-defaulting party to make a “good faith determination” of its total losses and costs (or gains) stemming from the termination. No specific methodology is specified.12
9 Lehman’s 906,000 derivatives transactions were based on just 6,125 ISDA agreements, a ratio of 148:1. Also see the discussion at Section 7 regarding Lehman’s big bank counterparties. 10 Also see Section 10 and McNamara and Metrick 2014F for the discussion of the odd situation where certain counterparties refused to terminate contracts and also refused to perform under them. 11 Each of the Market Quotation and Loss valuation methods has limitations. At first, the Market Quotation approach seems to provide a more objective outcome because it looks to market prices from third parties as its base. However, the market for some derivatives is thin, the valuation rules themselves embody a level of subjectivity, and, by their very nature, some derivatives can be difficult to value, even in normal times. In times of market stress when quotations from leading derivatives dealers for replacement transactions are not available, or when such quotations result in commercially unreasonable results, the Market Quotation method proves less reliable. 12 The Loss method does not depend on the existence of dealer quotations; it is highly subjective and involves a greater risk of manipulation by the non-defaulting party. It is not objectively clear what constitutes a good faith effort, and the non-defaulting party has a strong incentive to try and cover all its losses, whether actual, perceived, or anticipated. Valuations under this method can vary greatly and become the basis for disputes as parties try to persuade the other to their calculations.
6 LEHMAN BROTHERS BANKRUPTCY G: THE SPECIAL CASE OF DERIVATIVES
_____________________________________________________________________
If a gain is determined, the non-terminating party is to pay the terminating party. If a loss is determined, the non-terminating party requests payment of the terminating party or may seize collateral to make itself whole.
Close-Out Amount Approach
In an attempt to address the drawbacks of these two methods, the 2002 ISDA Master Agreement replaced the Market Quotation and Loss approaches with the “Close-Out Amount” approach, which was intended to provide greater flexibility. The Close-Out Amount approach requires the non-defaulting party to act in good faith and use commercially reasonable procedures to reach a commercially reasonable determination of the losses or gains resulting from replacing the terminated transaction. This may include using one or more firm or indicative quotations and/or relevant market data, such as rates, prices, yields, yield curves, volatilities and correlations, whether from third parties or internal sources.
The specific approaches applicable to a given transaction depend on the version of the Master Agreement used when entering into the transaction.13 Thus, although Lehman’s bankruptcy occurred in 2008, its derivatives book included transactions governed by the 1992 Master Agreement, as well as the 2002 Master Agreement, with all three valuation calculation methods at issue.
5. Derivative Regulatory and Bankruptcy Exemptions
As noted above, some derivatives, such as futures and stock options, were traded on exchanges subject to regulation and reporting. However, OTC derivatives have long enjoyed an exemption from regulation. As of June 1997, the outstanding volume of OTC derivatives was $28.733 trillion in notional value, a growth of 154.25% from the same period in 1994. (CFTC 1998, 3.) Concerns about this rapid growth led the U.S. CFTC to issue in May 1998 a concept paper exploring whether there should be greater oversight. While acknowledging that OTC derivatives “serve important economic functions,” the concept paper also posited that “like any complex financial instrument, [they] can present significant risks if misused or misunderstood by market participants.” (Ibid.)
Issued in an environment of deregulation, the CFTC’s concept paper and efforts were publicly resisted by the SEC and the U.S. Treasury, which did not want to stifle financial creativity. As a result, the CFTC’s efforts were quashed; derivatives remained unregulated, and they experienced phenomenal growth. Fast forward to June 2008, on the eve of the financial crisis, and the OTC derivatives market was nearly $700 trillion (notional value). Although derivatives were not at the heart of the financial crisis, as discussed below in Section 10, many commenters have agreed that widespread and aggressive use of derivatives may have led to the assumption of outsized risks and systemic weaknesses that preceded the crisis. This belief led to regulatory reforms being enacted in Dodd-Frank.
6. The Status of Derivatives under the Bankruptcy Code
The U.S. Bankruptcy Code provides that once a debtor files for protection under the code, most creditors are forbidden, “stayed” from seeking to recover payment from the debtor or seize its property, even if they are rightfully owed. A creditor has little incentive to maximize the price received for collateral held (the debtor’s property), as usually it has no rights to value in excess of its claim. It is easy to accept a price that
13 The introduction of the 2002 Master Agreement neither replaced the 1992 Master Agreements then in effect, nor required parties to use the 2002 Master Agreement when entering into new master agreements or transactions going forward. For many parties it may have been simpler to continue to do business as usual, executing new schedules as needed under their existing master agreements rather than slog through renegotiating a whole new master agreement, which inherently carries the risk that favorable terms may be renegotiated.
7 LEHMAN BROTHERS BANKRUPTCY G: THE SPECIAL CASE OF DERIVATIVES
_____________________________________________________________________
covers one’s exposure, even if it is less than the collateral’s actual value, thereby destroying value that the debtor could potentially reclaim. Any such attempts regarding a debtor that has filed bankruptcy are void, and, if occurring within 60 days prior to the bankruptcy filing, can be reversed by the bankruptcy court and the creditor held accountable for any loss to the debtor. This is because the stay supports the bankruptcy code’s philosophy of maximizing the pool of available assets and proportionately distributing it across classes of all creditors according to a statutorily determined hierarchy, not to favor individual creditors.
For example, assume that the creditor holds collateral worth $100 million and is due $95 million. It might be comfortable selling the collateral for $95 million to settle its account against the debtor. This results in a $5 million loss to the debtor, but is a simple solution for the creditor; it gets paid and washes its hands of the debtor. It isn’t at risk that the collateral may drop in value due to future market fluctuations, and it doesn’t have to hold onto excess amounts belonging to the debtor.
Certain financial instruments, including derivatives, enjoy an exemption from the code’s automatic stay provisions. Without the restraint of the stay, holders of Lehman’s derivatives rushed to protect themselves. Those that were unable to find substitute parties to replace Lehman on transactions sold the collateral they held and may have dumped it at low prices for fear of receiving less if they waited. There is no way of knowing how much value was lost to the Lehman estate in this manner, but see the discussion at Section 10 regarding value destruction.
7. Disposition of Lehman’s Derivatives
At the time it filed for bankruptcy, Lehman was a significant and active participant in the global derivatives market. Its estate included a portfolio of 906,000 derivative transactions under 6,120 ISDA Master Agreements, with an estimated notional value of $35 trillion.14 (Summe 2011.) Lehman derivatives were approximately 5% of the derivatives outstanding globally at the time. (Ibid.)
There was such concern about the impact of Lehman’s derivatives that officials at the U.S. Department of the Treasury and the Federal Reserve were strategizing how to gather more information about potential exposures without spooking the markets. (Parkinson et al. 2008.) As Lehman’s situation worsened, on September 14, a Sunday, ISDA convened a special trading session to allow counterparties to net their offsetting positions in Lehman’s derivatives. (ISDA 2008.) However, there was little trading during the session. (Fleming and Sarkar 2014, Fn18.)
The Lehman parent holding company’s filing for bankruptcy protection was an act of default under many of its derivative agreements, resulting in automatic termination of 733,000 transactions by November 12, 2008. (Ibid., 2104,12.)
However, even terminated transactions had to go through a series of steps before they were finally settled: (1) all trades were reconciled between the counterparty and Lehman, (2) each transaction was valued, and (3) settlement amounts with the counterparty were negotiated before any payment was made. The process was subject to review and approval by the bankruptcy court, often resulting in a contentious and lengthy process. In light of this and the sheer volume of agreements that needed to be settled and reviewed, the Lehman estate petitioned and received approval for special settlement procedures regarding derivatives. As shown in Figure 4 and analyzed in detail by Fleming and Sarkar 2014, Lehman’s OTC derivatives, which constituted 96 percent of its derivatives holdings were settled along three different paths of complexity and contention.
14 See footnote 6 regarding the number of Lehman’s derivatives. “While details of the component transactions representing Lehman Brothers’ derivatives portfolio are not public, based on data that the Office of the Comptroller of the Currency (OCC) and the Bank for International Settlements (BIS) publish, one could reasonably assume that its derivatives portfolio resembled the portfolios of most other major derivatives players, with two-thirds or more of the portfolio being foreign exchange and interest rate derivatives and credit derivatives being ten percent or less of the portfolio.” (Summe 2011, 6.)
8 LEHMAN BROTHERS BANKRUPTCY G: THE SPECIAL CASE OF DERIVATIVES
_____________________________________________________________________

Figure 4: Lehman’s Derivative Settlement Procedures
Source: Fleming and Sarkar 2014, 40.
Automatically Terminated
As noted above, a majority of Lehman’s derivative transactions were terminated shortly after its bankruptcy filing, either by automatic termination or by action of the counterparty. After termination, the counterparty was permitted to make a claim to Lehman based on a calculated termination value for the trade, utilizing the methods as prescribed under their particular agreement.
Efforts to agree to termination values were complicated by duplicate and inflated claims and the corporate complexity of the Lehman organization, which made identifying trades, locating collateral held by Lehman, and verifying customer records a challenge. Collateral held by Lehman could not easily be recovered, particularly if it had been repledged. However, the procedures approved by the court on December 16, 2008, permitted Lehman to reach settlement without the court reviewing each transaction. As shown on Figure 5, although 6% of ISDA contracts were settled by July 2009, by September 2010, 46% had been settled. By the end of 2012, a full 84 percent had been settled. (Fleming and Sarkar 2014, 12.)
9 LEHMAN BROTHERS BANKRUPTCY G: THE SPECIAL CASE OF DERIVATIVES
Figure 5: Timeline of Final Settlement of Lehman Derivative Claims
Settlement Date % Contracts Reconciled
% Contracts Valued)
% Contracts Finally Settled
Estimated Number of Contracts Not Finally
Settled*
7/31/2009 45 35 6 5,960
9/16/2009 53 44 11 5,643
11/05/2009 61 50 17 5,262
9/30/2010 95 87 46 3,449
3/31/2011 99 99 59 2,631
12/31/2012 --- --- 84 1,014
* Based on an initial number of contracts of 6,340 Source: Fleming and Sarkar 2014.
Out-of-the-Money Derivatives
Many of Lehman’s counterparties that were out-of-the-money (i.e., owing Lehman) refused to terminate their agreements or pay amounts due under the contracts, whether terminated or not. If terminated, Lehman and its counterparties often could not agree on the amount due under a contract. The illiquidity of the markets made valuing some derivative trades difficult. Or parties could not agree on the validity of the calculation method used. The choice of method under ISDA could have significant impact, as evidenced by the claim made by the Japanese financial company, Nomura. Prior to their termination of transactions on September 8, 2008, Nomura seemed to owe Lehman $484 million. Following Lehman’s bankruptcy, however, Nomura filed a claim stating that Lehman owed it $217 million, the $700 million difference being attributable to Nomura shifting from the Market Quotation method to the Loss method of calculation. (Fleming and Sakar 2014, 20, Fn 28.) Even if a settlement amount could be agreed upon, counterparties aggressively sought to net amounts that they might owe against amounts they claimed Lehman owed them.
The settlement procedures for this group established an alternative dispute resolution (ADR) process that permitted Lehman to assign unterminated contracts to third parties or agree to mutual termination, with the consent of the unsecured creditors and the counterparty, but without the need for further court approval. (Ibid., 13.) Assignment moved slowly because some contracts were uncollateralized, had weak credits, or involved long maturity instruments. (Ibid.,14.) But, as shown in Figure 6, the ADR process, approved in January 2009, helped move things along. Of the 2,667 contracts not terminated as of January 2009, more than half (1,566) were terminated by June 17, 2009. This left 1,068 contracts, representing just 5,858 transactions (less than 1% of the original 906,000 transactions), not terminated. (Ibid.)
Even though termination was just a first step in the resolution process, the sooner it occurred the sooner the estate could proceed to settlement negotiations.
10 LEHMAN BROTHERS BANKRUPTCY G: THE SPECIAL CASE OF DERIVATIVES
Big Bank Counterparties
Many of Lehman’s largest counterparties did not terminate their contracts or easily settle their transactions even if terminated; there were significant and lengthy disputes. Due to concentration in the derivatives market, Lehman’s transactions with its largest 30 counterparties, affiliates of just 13 big banks,15 accounted for a high percentage of trades. As shown in Figure 6, Lehman reported in January 2011 that, of the outstanding agreements, these big banks accounted for 85% of trades, 48% of the value, but only 5% of the number of agreements. (Fleming and Sarkar 2014, 14-15.)
A standardized methodology was agreed to by the court:
In particular, these derivatives contracts were valued at mid-market at the market close of a specified termination date [September 12, 2008] with an “additional charge” added, based on product-specific adjustments for the maturity and risk of the contracts. Also, the number of maturity “buckets” used for aggregating and offsetting exposures was reduced. (Ibid., 16.)
This settlement procedure helped the estate to reach settlement with eight of the 13 big banks by end of 2011. But it was not a cure all. Figure 7 shows the large gap between counterparty claims and amounts ultimately allowed that had to be negotiated. Lehman and the counterparties disagreed about all aspects of the settlement—the rates and prices used in the valuation model, the value of collateral, and offsetting. By the end of 2012, only half the outstanding contracts had been settled.
Figure 6: Lehman Derivative Claims of Large (“Big Bank”) Counterparties (as of January 13, 2011) Trades Claims($ billions) Contracts
Initial position, all counterparties 961,436 $45.31 2,961
Finally settled, all counterparties 69,684 $5.04 1,561
Outstanding, all counterparties 891,752 $40.37 1,400
Outstanding, 30 largest counterparties 817,221 $21.75 148
Share of remaining, 30 largest counterparties (%) 85 48 5
Source: Fleming and Sarkar 2014.
Figure 7: Estimated Recovery for Derivative Claims of Large Counterparties (as of May 13, 2011)
Claimants Asserted Claims ($Billions)
Allowed Claims ($Billions)
% Allowed to Asserted Claims
8 largest counterparties 9.6 6.2 64.6
30 largest counterparties 21.8 10.3 47.4 Source: Fleming and Sarkar 2014..
15 The thirteen major financial institutions illustrate the breadth and global reach of Lehman’s derivatives business: Bank of America, Barclays, BNP Paribas, Citigroup, Credit Suisse, Deutsche Bank, Goldman Sachs, JPM Chase, Merrill Lynch, Morgan Stanley, RBS, Societe Generale, and UBS. (Fleming and Sarkar 2014, 14, Fn 25.)
11 LEHMAN BROTHERS BANKRUPTCY G: THE SPECIAL CASE OF DERIVATIVES
_____________________________________________________________________

Recovery Rates
The average recovery rate for Lehman senior unsecured creditors was 28%, which Fleming and Sarkar (2014) conclude was below average when compared with historical numbers for comparable entities, even after accounting for possible mitigating factors (for example, the state of the economy and the credit cycle). Recovery rates varied; creditors of three Lehman derivatives subsidiaries received full recovery on their claims. Also, counterparties of centrally cleared securities were mostly made whole. However, many counterparties to Lehman’s OTC derivatives suffered losses. The average payout rate for unsecured creditors of LBSF, Lehman’s main OTC derivative subsidiary was 30.9%. (Fleming and Sarkar 2014, 3-4, 37.)
8. The Bulk Sale of Lehman’s Exchange-Traded Derivatives
Lehman cleared all trades for its combined subsidiaries through an account maintained by its broker-dealer subsidiary, Lehman Brothers Inc. (LBI), at the CME Group (CME).16 LBI maintained substantial proprietary—or “house”—positions in energy, interest rate, and equities (i.e., S&P 500, etc.) futures and options traded on CME exchanges, along with smaller positions in metals, agriculture, and foreign exchange. LBI’s combined margin requirements at the CME totaled roughly $2 billion for LBI’s proprietary positions and an additional $2 billion for LBI’s public customer positions.
On September 15, 2008, the CME determined (1) to place Lehman on a “liquidate only basis,” halting any further trading by it or in its positions, and (2) to sell or transfer Lehman’s house positions through a bulk auction. The committee reasoned that, given the size of Lehman’s positions and the turmoil in the markets, a more public process would be unwieldy: “[T]he CME believed it would not be prudent to conduct an open market liquidation of LBIʹs positions because of the size and complexity of the positions, as well as the credit and execution risk that would be associated with such a large open-market liquidation.” (Examiner’s Report, Vol. 5, 1845.)
On September 18, 2008, three days after the Lehman parent filed for protection, CME sold Lehman’s accounts to three entities, DRW Trading, Barclays and Goldman Sachs.17 As shown in Figure 8, with the derivative obligations, CME transferred $2 billion in LBI collateral (margin) and clearing deposits that it held, $1.2 billion in excess of the then market (close-of-business) value of the obligations absorbed. Thus, none of the excess margin and collateral at CME was returned to the Lehman estate.
The sales represented the only time that the CME had conducted a forced transfer/liquidation of a clearing member's proprietary house positions. It did this even though LBI had satisfied all financial requirements of a CME clearing member. In fact, LBI continued to meets its financial requirements at the CME throughout the remainder of that week.
16 The CME Group is the largest derivatives exchange comprised of four designated contract markets: the Chicago Board of Trade, the Chicago Mercantile Exchange, the New York Mercantile Exchange and COMEX (f/k/a Commodity Exchange, Inc.). The CME’s Clearing House Division confirmed, cleared and settled all derivatives contracts traded at the CME exchanges, acted as the central counterparty and provided a performance guaranty for all futures and options contracts cleared through these exchanges. 17 CME sought, and received permission from Lehman, to disclose its positions to the potential bidders. It invited six firms to participate in the bidding process for Lehman’s house positions—Barclays, Goldman Sachs, Morgan Stanley, JPMorgan, Citadel L.P., and DRW Trading. Bidders were chosen by the CME based on their capital, market concentration considerations and risk management expertise. On September 15, 2008, the firms submitted bids on five books of derivatives:(1) energy, (2) FX derivatives, (3) interest rates, (4) equities, and (5) agriculture. Even though it could have, CME did not require a minimum bid, and declined to utilize a SPAN calculation (the industry’s standard measure for calculating portfolio risk) to determine the amount of margin and collateral to be transferred with each book, which in some cases would have resulted in lesser amounts being transferred than were. See Figure 8.
12 LEHMAN BROTHERS BANKRUPTCY G: THE SPECIAL CASE OF DERIVATIVES
_____________________________________________________________________
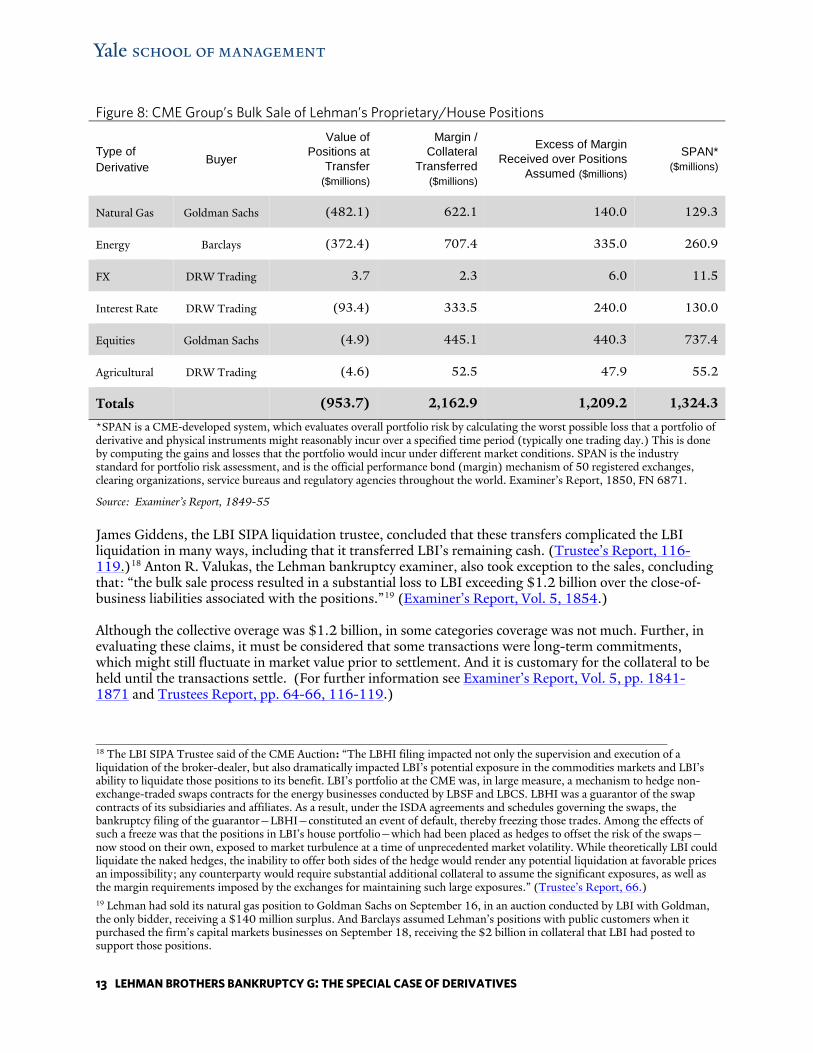
Figure 8: CME Group’s Bulk Sale of Lehman’s Proprietary/House Positions
Type of Derivative
Buyer
Value of Positions at
Transfer ($millions)
Margin / Collateral
Transferred ($millions)
Excess of Margin Received over Positions
Assumed ($millions) SPAN*
($millions)
Natural Gas Goldman Sachs (482.1) 622.1 140.0 129.3
Energy Barclays (372.4) 707.4 335.0 260.9
FX DRW Trading 3.7 2.3 6.0 11.5
Interest Rate DRW Trading (93.4) 333.5 240.0 130.0
Equities Goldman Sachs (4.9) 445.1 440.3 737.4
Agricultural DRW Trading (4.6) 52.5 47.9 55.2
Totals (953.7) 2,162.9 1,209.2 1,324.3
*SPAN is a CME‐developed system, which evaluates overall portfolio risk by calculating the worst possible loss that a portfolio of derivative and physical instruments might reasonably incur over a specified time period (typically one trading day.) This is done by computing the gains and losses that the portfolio would incur under different market conditions. SPAN is the industry standard for portfolio risk assessment, and is the official performance bond (margin) mechanism of 50 registered exchanges, clearing organizations, service bureaus and regulatory agencies throughout the world. Examiner’s Report, 1850, FN 6871.
Source: Examiner’s Report, 1849-55 James Giddens, the LBI SIPA liquidation trustee, concluded that these transfers complicated the LBI liquidation in many ways, including that it transferred LBI’s remaining cash. (Trustee’s Report, 116-119.)18 Anton R. Valukas, the Lehman bankruptcy examiner, also took exception to the sales, concluding that: “the bulk sale process resulted in a substantial loss to LBI exceeding $1.2 billion over the close‐of‐business liabilities associated with the positions.”19 (Examiner’s Report, Vol. 5, 1854.)
Although the collective overage was $1.2 billion, in some categories coverage was not much. Further, in evaluating these claims, it must be considered that some transactions were long-term commitments, which might still fluctuate in market value prior to settlement. And it is customary for the collateral to be held until the transactions settle. (For further information see Examiner’s Report, Vol. 5, pp. 1841-1871 and Trustees Report, pp. 64-66, 116-119.)
18 The LBI SIPA Trustee said of the CME Auction: “The LBHI filing impacted not only the supervision and execution of a liquidation of the broker-dealer, but also dramatically impacted LBI’s potential exposure in the commodities markets and LBI’s ability to liquidate those positions to its benefit. LBI’s portfolio at the CME was, in large measure, a mechanism to hedge non-exchange-traded swaps contracts for the energy businesses conducted by LBSF and LBCS. LBHI was a guarantor of the swap contracts of its subsidiaries and affiliates. As a result, under the ISDA agreements and schedules governing the swaps, the bankruptcy filing of the guarantor—LBHI—constituted an event of default, thereby freezing those trades. Among the effects of such a freeze was that the positions in LBI’s house portfolio—which had been placed as hedges to offset the risk of the swaps—now stood on their own, exposed to market turbulence at a time of unprecedented market volatility. While theoretically LBI could liquidate the naked hedges, the inability to offer both sides of the hedge would render any potential liquidation at favorable prices an impossibility; any counterparty would require substantial additional collateral to assume the significant exposures, as well as the margin requirements imposed by the exchanges for maintaining such large exposures.” (Trustee’s Report, 66.) 19 Lehman had sold its natural gas position to Goldman Sachs on September 16, in an auction conducted by LBI with Goldman, the only bidder, receiving a $140 million surplus. And Barclays assumed Lehman’s positions with public customers when it purchased the firm’s capital markets businesses on September 18, receiving the $2 billion in collateral that LBI had posted to support those positions.
13 LEHMAN BROTHERS BANKRUPTCY G: THE SPECIAL CASE OF DERIVATIVES
_____________________________________________________________________
9. Auction of Lehman Credit Default Swaps
At the time of its filing for bankruptcy, commenters estimated that there were between $200 and $440 billion notional value in credit default swaps (CDSs) outstanding, relating to $128 billion in outstanding senior bonds issued by Lehman’s parent company. Because Lehman’s bankruptcy occurred in the midst of incredible market turmoil, holders of its CDSs (private bilateral securities not traded on an exchange) scrambled to find the three market quotations for replacing their Lehman CDSs normally used to determine the termination amount under the ISDA Master Agreement (Market Quotation approach.) This proved difficult and confusing and further aggravated market uncertainty and disruption.
To address the disorder, on October 10, 2008, the ISDA held an auction to determine the value of Lehman’s bonds underlying the CDSs, and thus the payout required under Lehman CDSs. (LBHI’s filing was an act of default under the ISDA Master Agreement since LBHI, was a guarantor of its subsidiaries’ agreements.) It was a process that ISDA had used the prior week with the Federal National Mortgage Association (Fannie Mae) and the Federal Home Loan Mortgage Corporation (Freddie Mac), and for which it had issued a specific protocol.20 (For further information see ISDA Plain English Summary of the Auction Methodology in the ISDA 2008 Lehman CDS Protocol and Bowers, Simon, Derivatives worth hundreds of billions start to unwind)
The price determined at the auction was 8.625 cents on the dollar. Meaning that the sellers of Lehman CDSs would have to pay 91.375 cents as the payout ratio on the CDSs. However, once it was established what the CDSs were worth, parties could net amounts owed under Lehman CDSs with other Lehman-related transactions to determine their net close-out-value.
10. The Question of Value Destruction
The verdict is still out regarding what part derivatives played in Lehman’s demise or in the destruction of value of the estate. Summe (2011) argues that it was not significant—that not only did the derivatives market remain healthy after Lehman’s demise, but that it was the firm’s derivatives trading arm, Lehman Brothers Specialty Financing (LBSF), which added the most value to the bankruptcy estate. She argues that, within weeks of Lehman filing for bankruptcy, 80% of its derivatives contracts had been terminated. (Summe 2011.) And that derivative receivables were a primary reason for LBSF’s cash increasing from a paltry $7 million at September 14, 2008, to $925 million at January 2, 2009. (Ibid.,19.) Summe also notes that Anton R. Valukas, the Lehman bankruptcy examiner, never mentions derivatives as a cause of the bank’s failure in his voluminous investigative report. (Ibid.,16.) Others view these facts differently.
Shortly after Lehman’s bankruptcy filing, Harvey Miller, Lehman’s bankruptcy counsel, testified that a “massive destruction of value” could have been averted if an automatic stay had been in place for derivatives contracts. (Ibid.,18.)21 Bryan P. Marsal, the Lehman estate administrator, later asserted that as much as $75 billion in value was destroyed by the form of Lehman’s bankruptcy:
20 While such auctions were voluntary through 2009, they have become a standard provision of ISDA agreements from 2009 forward, thus becoming mandatory. 21 “Derivatives counterparties’ exemption from application of the automatic stay, which has been embedded in the U.S. Bankruptcy Code since 1978 for an expanding class of products, was actually designed to achieve the opposite of what Mr. Miller asserted—the mitigation of systemic risk arising from cascading bankruptcies of other entities. By providing a safe harbor from the stay for these contracts, the delays assumed to be inherent in the bankruptcy process would be avoided, and counterparties could reduce the losses that would otherwise result from the degradation of collateral pledged by the debtor. Dodd-Frank did not alter this accommodation to derivatives. Rather, it continued with the thirty-two year statutory approach of allowing derivative contracts to be exempt from the automatic stay of action that applies to all other creditors. Dodd-Frank thus followed the Federal Deposit Insurance Act in settling on a one-business-day stay.” (Summe 2011, .)
14 LEHMAN BROTHERS BANKRUPTCY G: THE SPECIAL CASE OF DERIVATIVES
_____________________________________________________________________
Lehman derivative contracts should have been transferred to a new, creditworthy party. The good assets of Lehman and the derivative contracts should have been transferred to a creditworthy acquirer, with help from the Fed. The bad assets, the toxic assets, should have been left with holdings, and then a bankruptcy filing should have occurred. The failure to do so cost creditors approximately $50 to 75 billion. (Spiegel Online International 2009.)
This figure, however, likely encompasses more than losses due to derivatives, as Marsal further stated to the Lehman bankruptcy examiner that “the bankruptcy resulted in the loss of 70% of $48 billion of receivables from derivatives that could otherwise have been unwound.” (Examiner’s Report, Vol. 3, 725 [footnotes omitted)].) Even so, $33.6 billion (70% of $48 billion) is not an insignificant number.
And even if Lehman was successful in recovering under many of its derivatives contracts, the picture does not seem to have been as rosy as Summe implies. The lengthy negotiations to settle terminated contracts added to the expense of the estate. The forced sale of Lehman’s house positons left other trades naked and hard to sell. Additionally, the 28% recovery rate to Lehman’s creditors was lower than historical norms, despite the fact that some derivative counterparties were made whole.
Systemic Impact
In addition to the impacts that the disposition of its derivatives had on the Lehman estate, there is also evidence of negative contagion and disruption in the greater derivatives market, at least in part related to the Lehman bankruptcy and its aftermath. Former U.S. Treasury Secretary Timothy Geithner stated that, “The market turmoil following Lehman’s bankruptcy was in part attributable to uncertainty surrounding the exposure of Lehman’s derivatives counterparties.”(Summe 2011, 18.)
Former Federal Reserve Chairman Ben Bernanke also testified that the disorderly unwinding of Lehman’s derivatives had a detrimental effect that had not been fully anticipated.
—but obviously OTC derivatives were a problem. They may not have been a causal problem, but they transmitted stocks. There were problems with the clearing of settlement of OTC derivatives. And there were problems with the risk management, AIG being the poster child example of that. (Bernanke 2009, 17.)22
In a 2010 policy paper the New York Federal Reserve (NYFED) reached a similar conclusion:
So, although OTC derivatives were not a central cause of the crisis, we find that weaknesses in the infrastructure of derivatives markets did exacerbate the crisis. As a result of failures of risk management, corporate governance, and management supervision, some market participants took excessive risks using these instruments. The complexity and limited transparency of the market reinforced the potential for excessive risk-taking, as regulators did not have a clear view into how OTC derivatives were being traded.” (Duffie, Liu and Lubke 2010,1.)
The NYFED also concluded that derivatives created systemic risk:
Counterparty credit risk rises to the level of systemic risk when the failure of a market participant with an extremely large derivatives portfolio could trigger large unexpected losses on its
22 AIG’s near collapse was due largely to its concentration in credit default swaps (CDSs) (a type of derivative that insures against a firm’s default and or insolvency), which were written widely across the financial landscape by its subsidiary AIG Financial Products. At the time of its bailout in September 2008, AIG’s book of derivatives was valued at $1 trillion notional value. Because of the fragility of the markets, AIG was facing higher than usual payout rates. The inability to meet its obligations would send tremors of doubt throughout a large span of the market, indicating that companies holding CDSs were not as protected as they thought. The government injected $180 billion into the firm during 2008-2009 to keep it from failing, the largest amount it invested in any one company during the crisis.
15 LEHMAN BROTHERS BANKRUPTCY G: THE SPECIAL CASE OF DERIVATIVES
_____________________________________________________________________

derivatives trades, which could seriously impair the financial condition of one or more of its counterparties. Systemic risk also arises when the fear of such a failure could lead counterparties to attempt to avoid potential losses by reducing their exposures to a large, weak market participant, possibly contributing to a “run” that indeed accelerates the failure of that market participant. An additional form of systemic risk that can arise from the actual or anticipated failure of a large OTC derivatives market participant is the potential for an accompanying ‘fire sale,’ which can lead to significant price volatility or price distortions (in both derivative markets and underlying asset markets) when counterparties suddenly attempt to replace their positions with the distressed firm, and otherwise attempt to sell risky assets in favor of safer assets, a ‘flight to quality.’ Through price impacts, such a fire sale or flight to quality could cause failure-threatening losses to some market participants, even those with no direct counterparty credit risk to the firm in question.” (Ibid., 5.)
(See also The Economist, Derivatives: A Nuclear Winter discussing the several ways that Lehman’s demise impacted facets of the derivatives market.)
Thus, even though the derivatives market did not totally seize up after Lehman’s demise, its failure caused much disruption. Just how much, and how much can be attributed to value destruction relating to derivatives, is still being studied.
Given these impacts and the recognition by some regulators that they were caught unawares of just how large, interconnected and potentially systemic the OTC derivatives market was, Dodd-Frank sought to address the identified problems.
11. The Dodd-Frank Fix
The OTC regulations are found in Title VII of Dodd-Frank, which divides regulation of swaps between the CFTC and the SEC. The SEC has jurisdiction over “securities-backed swaps,” which are defined as “[s]waps based on a single security or loan or a narrow-based group or index of securities or events relating to a single issuer or issuers of securities in a narrow-based security index.” These would include interest rate swaps and credit default swaps. The CFTC has authority over all other swaps, such as energy and agriculture swaps. The two agencies share authority over mixed swaps, those that are security-based, but which have a commodity component.
The swap regulations (1) require participants to register and subject them to oversight, (2) require swaps to be centrally cleared and impose recordkeeping and reporting obligations, and (3) impose margin requirements on participants.
Although the SEC has lagged behind the CFTC in its rule-making,23 significant new rules have been issued by the CFTC and became effective beginning at the end of 2012, when “swap dealers” first had to register. A swap dealer is defined as any party that holds itself out as a swap dealer, makes a market in swaps, regularly enters into swaps in the course of its business for its own account, or engages in activity causing it to be commonly known as a swap dealer or market maker in swaps. Registered swap dealers are subject to CFTC oversight, must adopt risk management and internal control systems, and must adhere to detailed record keeping and reporting requirements. Additionally, Dodd-Frank also imposes capital requirements on swap dealers to ensure that they can meet their obligations.
To promote transparency, all swaps required to be cleared must be executed on a designated contract market or swap execution facility, new markets created by Dodd-Frank. Further, Dodd-Frank requires swap dealers to collect and maintain full, complete, detailed and systematic records of each swap. To
23 See http://www.sec.gov/spotlight/dodd-frank/derivatives.shtml for the status of the SEC proposed rules.
16 LEHMAN BROTHERS BANKRUPTCY G: THE SPECIAL CASE OF DERIVATIVES
_____________________________________________________________________

facilitate recordkeeping and reporting, each new swap will be assigned a unique swap identifier (USI) and each swap type/class will be assigned its own unique product identifier (UPI). These identifiers,24 together with the requirement that each end user will also have a unique identifying number, a legal entity identifier (LEI), which it must provide to the counterparty to enter into a swap, are intended to permit ease of tracking and identification of risks across numerous trades. LEIs are intended to operate globally.
As of December 31, 2012, various data, including pricing and volume information about new swaps, is required to be reported to a registered swap data repository (SDR), of which currently there are four—the Chicago Mercantile Exchange Inc., DTCC Data Repository, ICE Trade Vault, and INFX SDR Inc. The SDRs must publicly disclose certain information about the swaps on a real-time basis. Beginning January 1, 2013, counterparties to swaps in existence on or after July 21, 2010 must also report information regarding their swaps. (For further information, see Morrison Foerster, A Dodd-Frank Derivatives Update and Nazareth and Gabriel, Swap Reporting: Who and When.)
In an effort to respond to Dodd-Frank and assist participants, in August 2012, ISDA issued the ISDA DF protocol which firms can use to amend, in aggregate, outstanding swaps to bring them into compliance with Dodd-Frank. (See ISDA D-F Protocol.)
Recognizing just how international the swaps market is, former CFTC Chairman Gary Gensler championed for the new rules to apply to cross-border swaps entered into by U.S. entities. After much discussion, the CFTC and the European Union (EU) entered into the Path Forward Statement (2013), agreeing to work to harmonize EU and U.S. rules and that EU rules could apply to swaps by U.S. entities conducted in Europe, provided that the rules were similar to those of the U.S., as determined by the CFTC. (See CFTC 2014 discussing progress relating to the implementation of the 2013 Path Forward Statement.)
References
Bank of International Settlements 2007, BIS Quarterly Review: International banking and financial market developments, December 2007, 24.
__________, Monetary and Economic Department, OTC derivatives market activity in the first half of 2008. (November 2008.)
__________, Monetary and Economic Department, OTC derivatives market activity in the first half of 2009. (November 2009.)
__________, Statistical Release, OTC derivatives statistics at end-June 2014. (November 2014.)
__________, Statistical Release, OTC derivatives statistics at end-December 2011. (May 2012.)
Bernanke, Ben, Chairman of the Federal Reserve, United States of America, Financial Crisis Inquiry Commission, Closed Session (November 17, 2009).
Bowers, Simon, “Derivatives worth hundreds of billions start to unwind”, The Guardian, October 10, 2008.
24 Title VII of Dodd-Frank also contains an end-user exception that permits an end user (such as a business corporation) to be exempt from the clearing and trade requirements if the end user is not a financial entity, uses swaps only to hedge or mitigate commercial risk, and notifies the CFTC of how it meets its financial obligations associated with non-cleared swaps.
17 LEHMAN BROTHERS BANKRUPTCY G: THE SPECIAL CASE OF DERIVATIVES
_____________________________________________________________________

Commodity Futures Trading Commission, CFTC issues concept release concerning Over-the-counter derivatives market, Release: #4142-98 (May 7, 1998).
__________, Statement by the CFTC and the European Commission on progress relating to the implementation of the 2013 Path Forward Statement (February 12, 2014).
Duffie, Darrell, Ada Li and Theo Lubke, Policy Perspectives on OTC Derivatives Market Infrastructure (Federal Reserve Bank of New York Staff Reports No. 424 (January 2010, Revised March 2010).
Fleming, Michael J. and Asani Sarkar, The Failure Resolution of Lehman Brothers, Economic Policy Review, Volume 20, Number 2 2014).
Giddens, James W. (Trustee for the SIPA Liquidation of Lehman Brothers Inc.), Trustees Preliminary Investigation Report and Recommendations, In Re Lehman Brothers Inc., Debtor, Case no. 08-01420 (JMP) SIPA. (Trustee’s Report.)
International Swaps and Derivatives Association, Inc., Lehman Risk Reduction Trading Session and Protocol Agreement (September 14, 2008).
__________, “Plain English Summary of the Auction Methodology in the 2008 Lehman CDS Protocol.” <http://www.isda.org/2008lehmancdsprot/docs/Lehman-Plain-English- Summary.pdf>. October 2008.
__________, Overview of U.S. and EU OTC Derivatives Regulatory Reforms, 2014.
__________, ISDA August 2012 DF Protocol, available at http://www2.isda.org/functional-areas/protocol-management/protocol/8.
Miller, Rena S. and Kathleen Ann Ruane, The Dodd-Frank Wall Street Reform and Consumer Protection Act: Title VII, Derivatives (Congressional Research Service), November 6, 2012.
Morrison and Foerster, A Dodd-Frank Derivatives Update, March 12, 2013.
__________, Comparison EU and US Derivatives Regulatory Regime.
McNamara, Christian and Andrew Metrick, The Lehman Brothers Bankruptcy F: Introduction to the ISDA Agreement, Yale Program on Financial Stability Case Study 2014-3F, October 2014.
Nazareth, Annette L., and Gabriel D. Rosenberg, Swap Reporting: Who and When? Futures Industry, March 2013, 50-53.
Parkinson, Patrick, M,. et. al. (Emails to/from, 08/08-18/2008), (FCIC 156050) FRB to LEH Examiner 002399 , (Exhibit to Examiners Report) Valukas, Anton R., Report of Examiner, United States Bankruptcy Court, Sydney, In Re. Lehman Brothers Holdings, Inc., et al, Chapter 11 case no. 08-13555, Vol. 3, p 725, Vol. 5, 1841-71.
Spiegel Online International, Interview with Lehman Brothers CEO Bryan Marsal: “The Global Banking Community Had a Heart Attack,” March 13, 2009.
Summe, Kimberly, Misconceptions about Lehman Brothers’ Bankruptcy and the Role Derivatives Played, 64 Stan. L Rev. Online 16 (November 28, 2011).
The Economist, A nuclear winter? The fallout from the bankruptcy of Lehman Brothers, September 18, 2008.
18 LEHMAN BROTHERS BANKRUPTCY G: THE SPECIAL CASE OF DERIVATIVES
Valukas, Anton R., Report of Examiner, United States Bankruptcy Court, Sydney, In Re. Lehman Brothers Holdings, Inc., et al, Chapter 11 case no. 08-13555, Vol. 3, p 725, Vol. 5, 1841-71 (Examiner’s Report).
Wiggins, Rosalind Z. and Andrew Metrick, The Lehman Brothers Bankruptcy E: The Effects on Lehman’s U.S. Broker-Dealer, Yale Program on Financial Stability Case Study 2014-3E, October 2014.
Wiggins, Rosalind Z. and Andrew Metrick, The Lehman Brothers Bankruptcy H: The Global Contagion Yale Program on Financial Stability Case Study 2014-3H, October 2014.
Zeissler, Arwin and Andrew Metrick, JP Morgan London Whale D: Derivatives Valuation, Yale Program on Financial Stability Case Study 2014-2B, October 2014.
Suggested citation: Wiggins, Rosalind Z., and Andrew Metrick, The Lehman Brothers Bankruptcy G: The Special Case of Derivatives, Yale Program on Financial Stability Case Study 2014-3G-V1, November 2014.
Development of this case has been supported by a generous grant from the Alfred P. Sloan Foundation to the Yale Program on Financial Stability.
Copyright 2014 © Yale University. All rights reserved. To order copies of this material or to receive permission to reprint any or all of this document, please contact the Yale Program for Financial Stability at [email protected].
19 LEHMAN BROTHERS BANKRUPTCY G: THE SPECIAL CASE OF DERIVATIVES