11 presentation to the portfolio committee on trade and industry 9 november 2010
TRANSCRIPT
11
Presentation to the Portfolio Committee Presentation to the Portfolio Committee on Trade and Industryon Trade and Industry
9 November 2010

2
Contents
• Background – 5 year comparison• Broad Areas of challenge• Comparison of actual expenditure• Actual drawings from fiscus as at 31 July and 31 Oct
based on cash flow• Projections versus expenditure• Way forward for the remainder of the 2010/11 financial
year• Savings identified & redirected
2

3
Background - Five year comparison of budget vs expenditure
2005/06 2006/07 2007/08 2008/09 2009/10
Budget 3,907,420 3,942,028 5,479,433 5,126,893 6,373,076
Expenditure 3,631,304 3,804,720 5,295,250 5,056,989 6,221,300
Unspent 276,116 137,308 184,183 69,904 151,776
% Unspent 7% 3% 3% 1% 2%
0
1,000,000
2,000,000
3,000,000
4,000,000
5,000,000
6,000,000
R'0
00
Budget
Expenditure
Unspent
% Unspent
4
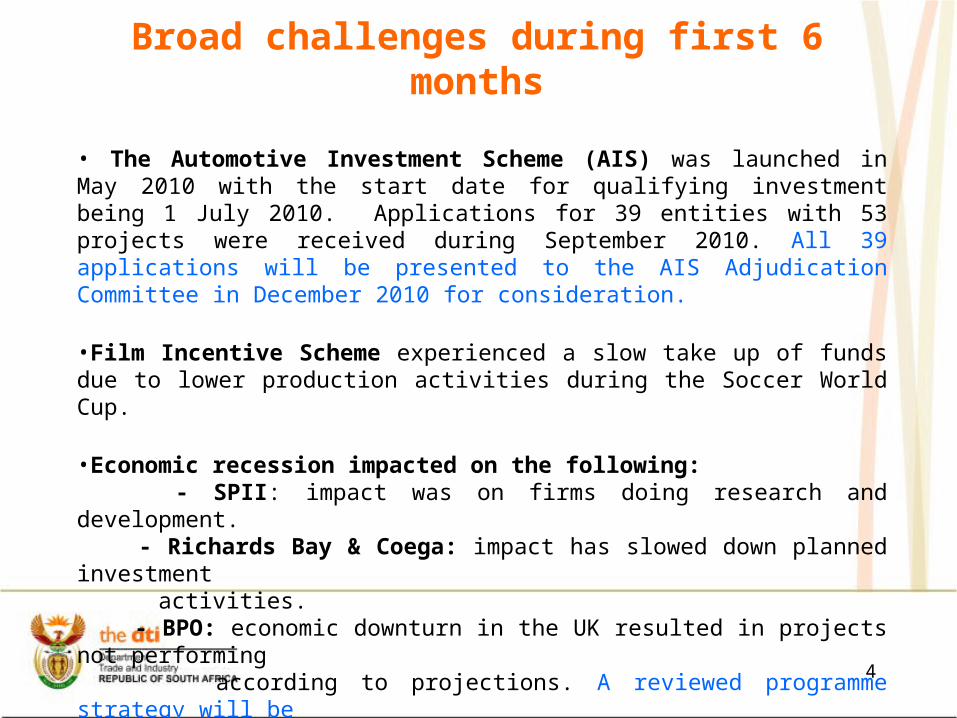
Broad challenges during first 6 months
• The Automotive Investment Scheme (AIS) was launched in May 2010 with the start date for qualifying investment being 1 July 2010. Applications for 39 entities with 53 projects were received during September 2010. All 39 applications will be presented to the AIS Adjudication Committee in December 2010 for consideration.
•Film Incentive Scheme experienced a slow take up of funds due to lower production activities during the Soccer World Cup.
•Economic recession impacted on the following: - SPII: impact was on firms doing research and development. - Richards Bay & Coega: impact has slowed down planned investment activities. - BPO: economic downturn in the UK resulted in projects not performing according to projections. A reviewed programme strategy will be implemented in the latter part of the year.
5
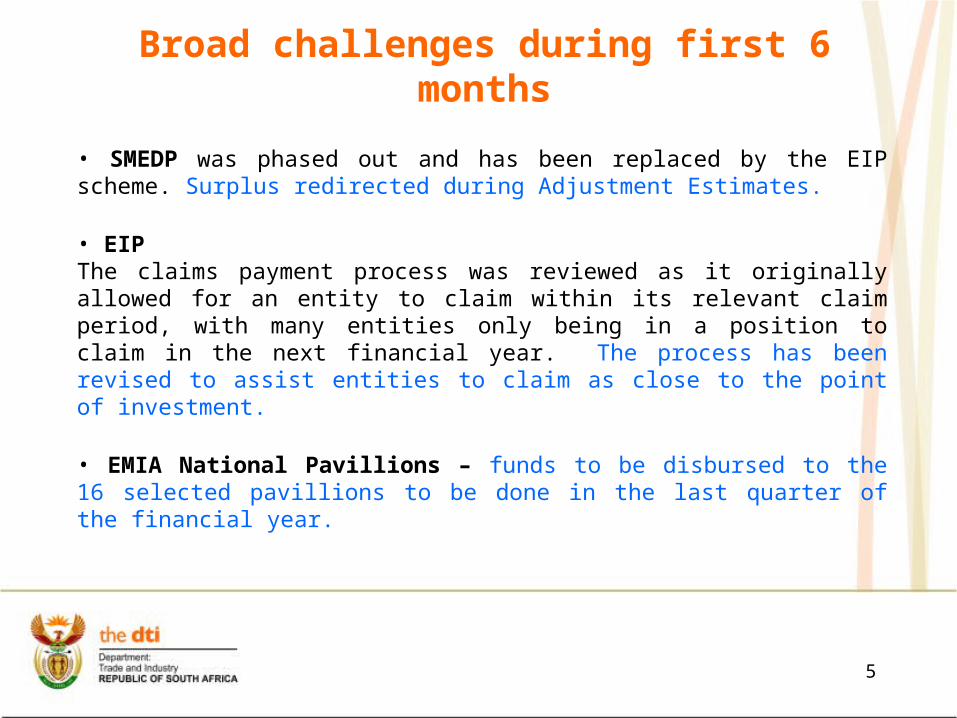
Broad challenges during first 6 months
• SMEDP was phased out and has been replaced by the EIP scheme. Surplus redirected during Adjustment Estimates.
• EIPThe claims payment process was reviewed as it originally allowed for an entity to claim within its relevant claim period, with many entities only being in a position to claim in the next financial year. The process has been revised to assist entities to claim as close to the point of investment.
• EMIA National Pavillions – funds to be disbursed to the 16 selected pavillions to be done in the last quarter of the financial year.

6
Broad challenges during first 6 months
• Foreign Mission Accounts – 2 months delay in receipt of mission accounts from DIRCO. To date, only accounts from March to July 2010 were received. Due to financial year end processes for all government departments, the March account was only received in June 2010. An estimate of R42 million was paid for the period under review. An MOU was signed with DIRCO to allow the department to pay an advance and reconcile that to the vouchers once received.
• Compensation of employees - Vacancies (17.9%) - Annual inflation linked salary increases due on 01/07/2010 will only be effected in November 2010 - Foreign mission accounts in respect of COLA
7
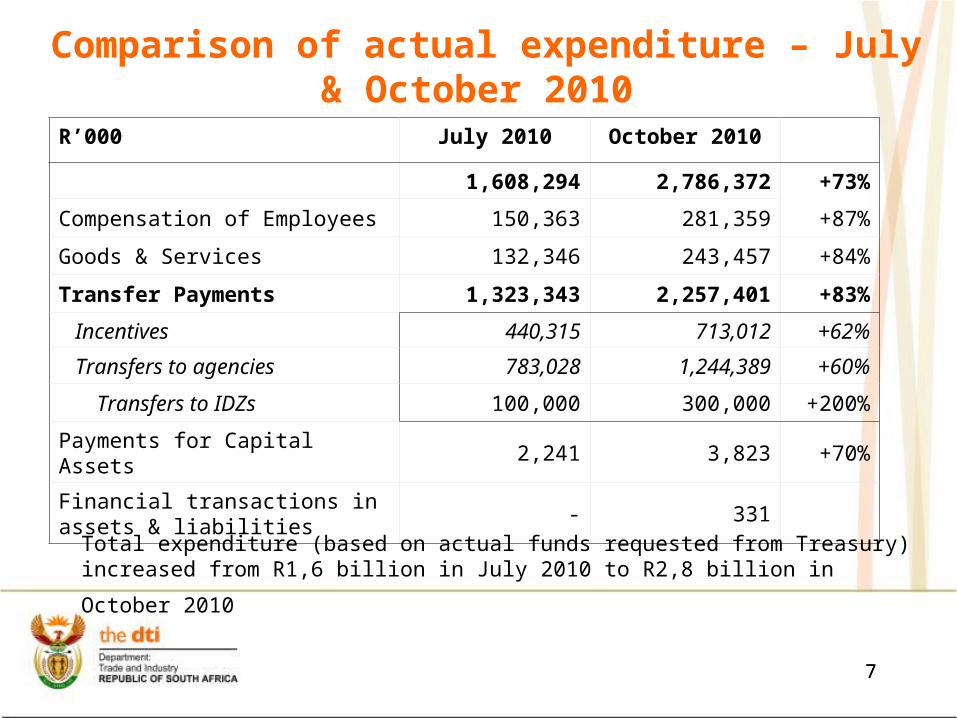
Comparison of actual expenditure – July & October 2010
7
R’000 July 2010 October 2010
1,608,294 2,786,372 +73%
Compensation of Employees 150,363 281,359 +87%
Goods & Services 132,346 243,457 +84%
Transfer Payments 1,323,343 2,257,401 +83%
Incentives 440,315 713,012 +62%
Transfers to agencies 783,028 1,244,389 +60%
Transfers to IDZs 100,000 300,000 +200%
Payments for Capital Assets 2,241 3,823 +70%
Financial transactions in assets & liabilities
- 331
Total expenditure (based on actual funds requested from Treasury) increased
from R1,6 billion in July 2010 to R2,8 billion in October 2010
8
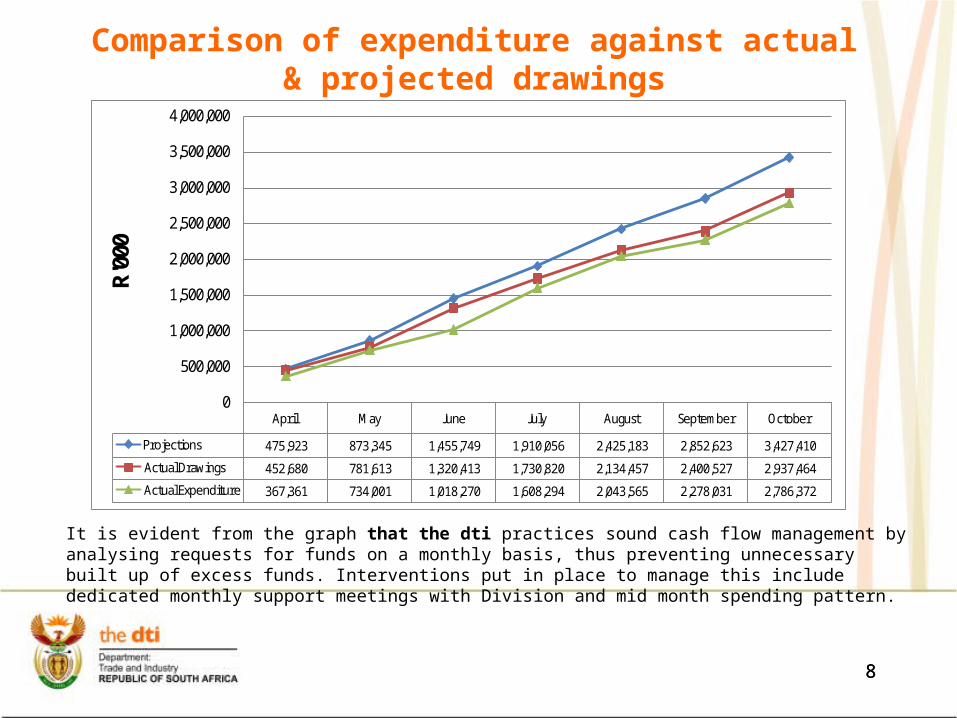
Comparison of expenditure against actual & projected drawings
April May June July August September October
Projections 475,923 873,345 1,455,749 1,910,056 2,425,183 2,852,623 3,427,410
Actual Drawings 452,680 781,613 1,320,413 1,730,820 2,134,457 2,400,527 2,937,464
Actual Expenditure 367,361 734,001 1,018,270 1,608,294 2,043,565 2,278,031 2,786,372
0
500,000
1,000,000
1,500,000
2,000,000
2,500,000
3,000,000
3,500,000
4,000,000R'000
8
It is evident from the graph that the dti practices sound cash flow management by analysing requests for funds on a monthly basis, thus preventing unnecessary built up of excess funds. Interventions put in place to manage this include dedicated monthly support meetings with Division and mid month spending pattern.
9
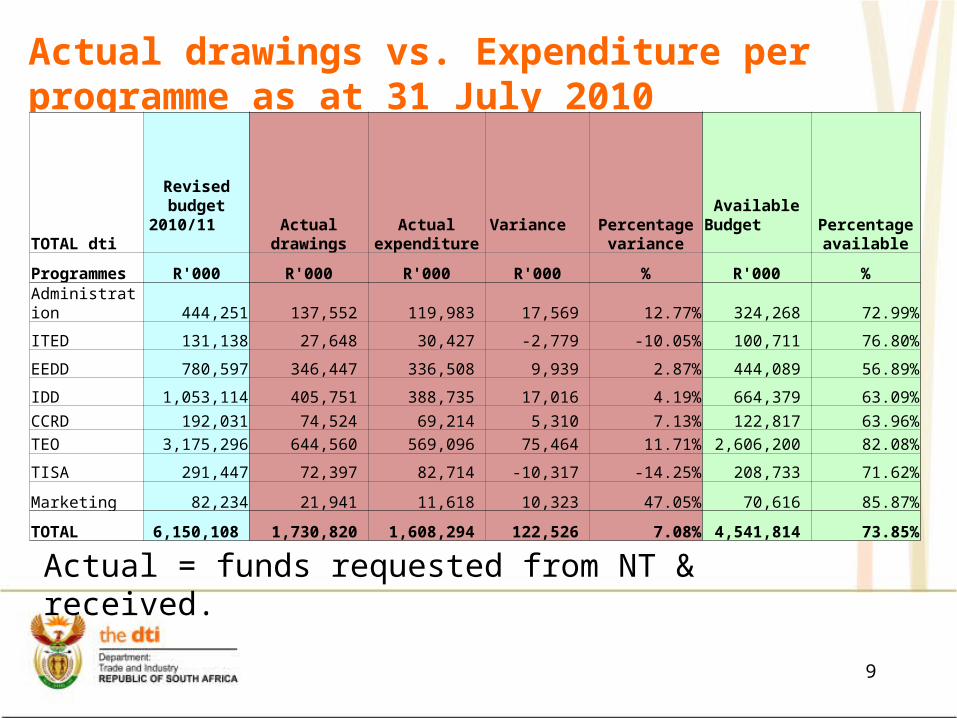
Actual drawings vs. Expenditure per programme as at 31 July 2010
Actual = funds requested from NT & received.
TOTAL dti
Revised budget
2010/11
Actual drawings
Actual expenditure Variance
Percentage variance
Available Budget
Percentage available
Programmes R'000 R'000 R'000 R'000 % R'000 %Administration 444,251 137,552 119,983 17,569 12.77% 324,268 72.99%
ITED 131,138 27,648 30,427 -2,779 -10.05% 100,711 76.80%
EEDD 780,597 346,447 336,508 9,939 2.87% 444,089 56.89%
IDD 1,053,114 405,751 388,735 17,016 4.19% 664,379 63.09%CCRD 192,031 74,524 69,214 5,310 7.13% 122,817 63.96%TEO 3,175,296 644,560 569,096 75,464 11.71% 2,606,200 82.08%
TISA 291,447 72,397 82,714 -10,317 -14.25% 208,733 71.62%
Marketing 82,234 21,941 11,618 10,323 47.05% 70,616 85.87%
TOTAL 6,150,108 1,730,820 1,608,294 122,526 7.08% 4,541,814 73.85%
10
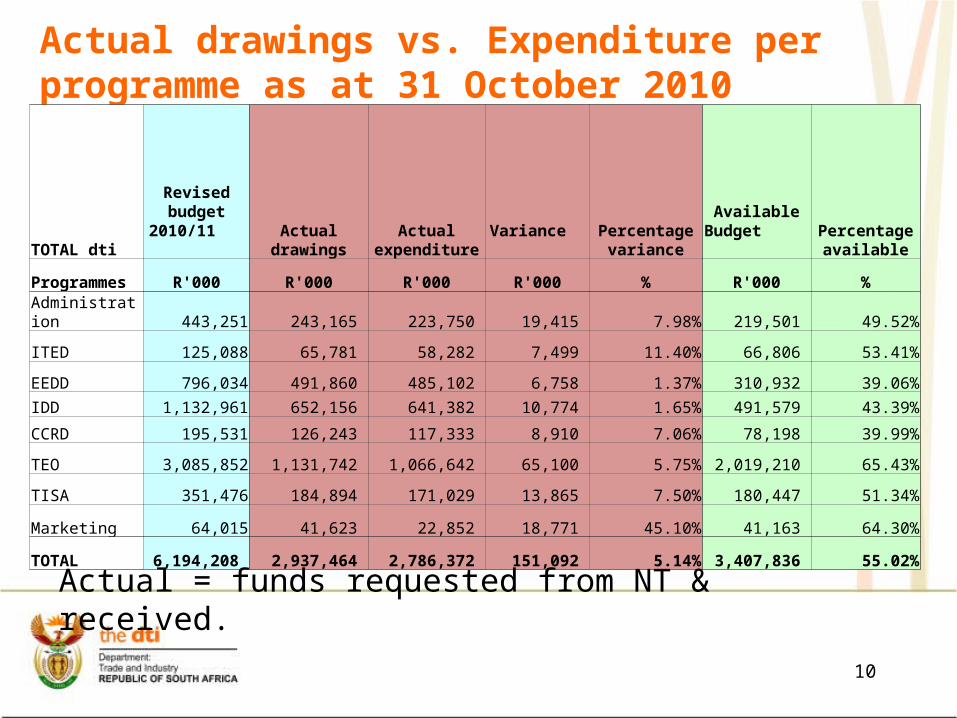
Actual drawings vs. Expenditure per programme as at 31 October 2010
TOTAL dti
Revised budget
2010/11
Actual drawings
Actual expenditure Variance
Percentage variance
Available Budget
Percentage available
Programmes R'000 R'000 R'000 R'000 % R'000 %Administration 443,251 243,165 223,750 19,415 7.98% 219,501 49.52%
ITED 125,088 65,781 58,282 7,499 11.40% 66,806 53.41%
EEDD 796,034 491,860 485,102 6,758 1.37% 310,932 39.06%
IDD 1,132,961 652,156 641,382 10,774 1.65% 491,579 43.39%
CCRD 195,531 126,243 117,333 8,910 7.06% 78,198 39.99%
TEO 3,085,852 1,131,742 1,066,642 65,100 5.75% 2,019,210 65.43%
TISA 351,476 184,894 171,029 13,865 7.50% 180,447 51.34%
Marketing 64,015 41,623 22,852 18,771 45.10% 41,163 64.30%
TOTAL 6,194,208 2,937,464 2,786,372 151,092 5.14% 3,407,836 55.02%
Actual = funds requested from NT & received.
11
Cautionary note on forward-looking statements
This presentation includes forward-looking statements. These statements are basedon currently available information as at 31 October 2010. They reflect the dti’s current expectations, projections and forecasts about future financialperformance. All forward-looking statements address matters that involve risks,uncertainties and assumptions. Based on a number of factors, actual results couldvary materially from those anticipated by the forward-looking statements. Thesefactors include, but are not limited to, the following:• Actual claims paid and the timing of such payments may vary from estimated
claims and estimated timings of payments, taking into account the preliminary nature of such estimates.
• Claims and loss activity may be greater or more severe than anticipated, including as a result of natural or man-made catastrophic events.
• Economic contraction or other changes in general economic conditions could adversely affect other factors relevant to the dti’s performance. The foregoing list of factors is not exhaustive, and should be read in conjunction with other cautionary statements that are included herein or elsewhere.
11

12
Way forward for the remainder of the financial year
12
• Although the 45% expenditure seems low after 7 months, some expenditure is however projected to be paid later in quarter 3 and 4, i.e:
R’000 Adjusted Appropriation
Comments
Automotive Production & Development Programme
547,000 R147m (Jan 2011); R200m (Feb 2011) & R200m (Mar 2011)
Infrastructure 632,000 (Coega) 414m; East London (198m) and Richards Bay (20m)
SMEDP 50,000
Research - ERPC 3,292
SEDA 15 ,000
IDC SPII 10,000
Export Marketing and Investment Assistance
94,000
Centurion Aerospace Village 32,454
Trade and Investment SA 18,151 Cola – FER allowances
SA Bureau of standards 11,490

13
Savings identified & redirected
13
Project Mthombo for the IDD Chemicals Sector DeskCase study for local production of benzene, toluence and xylene, styrene aromatics together with butadiene as proposed in IPAP.
This has been identified as downstream opportunities from the cost/benefit of the proposed new liquor fuel project Mthombo. The project will take 4 months to complete.
Scoping study on the alternative use of wood waste in SA This study will look at the alternative use of wood waste in SA to develop new opportunities for SMMEs. The project will take 6 months to be completed.
14
THANK YOU