presentation to the portfolio committee on trade and industry · presentation to the portfolio...
TRANSCRIPT
Presentation to the Portfolio Committee on Trade and Industry
NRCS Annual Report – 2013-2014 Financial year NRCS Quarterly Report – Quarter 1 of 2014
14 October 2014
1
In attendance from NRCS
2
Mr. Asogan MoodleyChief Executive Officer
Ms. Reshma MathuraChief Financial Officer
Mr. Edward MatembaChief Risk and Strategy Officer
Purpose
To brief the Portfolio Committee on Trade and Industry on:
• The Annual Report of the NRCS for the 2013 – 2014 Financial year
• The performance of the NRCS for Quarter 1 of the 2014 Financial year
3
Scope
Background Overview of strategic outcomes Annual report
• Performance information• Financial overview• Audit report
Quarterly report• Performance information• Financial overview
Challenges
4

Background
5

6
National Regulator for Compulsory Specifications Act(Act No. 5 of 2008)
Legal Metrology Act(Act No. 9 of 2014)
National Building Regulations and Building Standards Act(Act No. 103 of 1977)
The Foodstuffs, Cosmetics and Disinfectants Act (Act 54 of 1972)
Mandate of the NRCS is derived from the following Acts.
Legislative Mandate
Organisational MandateMission and Vision
7
Dedicated to protect South Africans by developing compulsory specifications and technical regulations, and maximizing compliance of regulated products and services
NRCS MissionA credible and respected
regulator for compulsory specifications and fair trade.
NRCS Vision
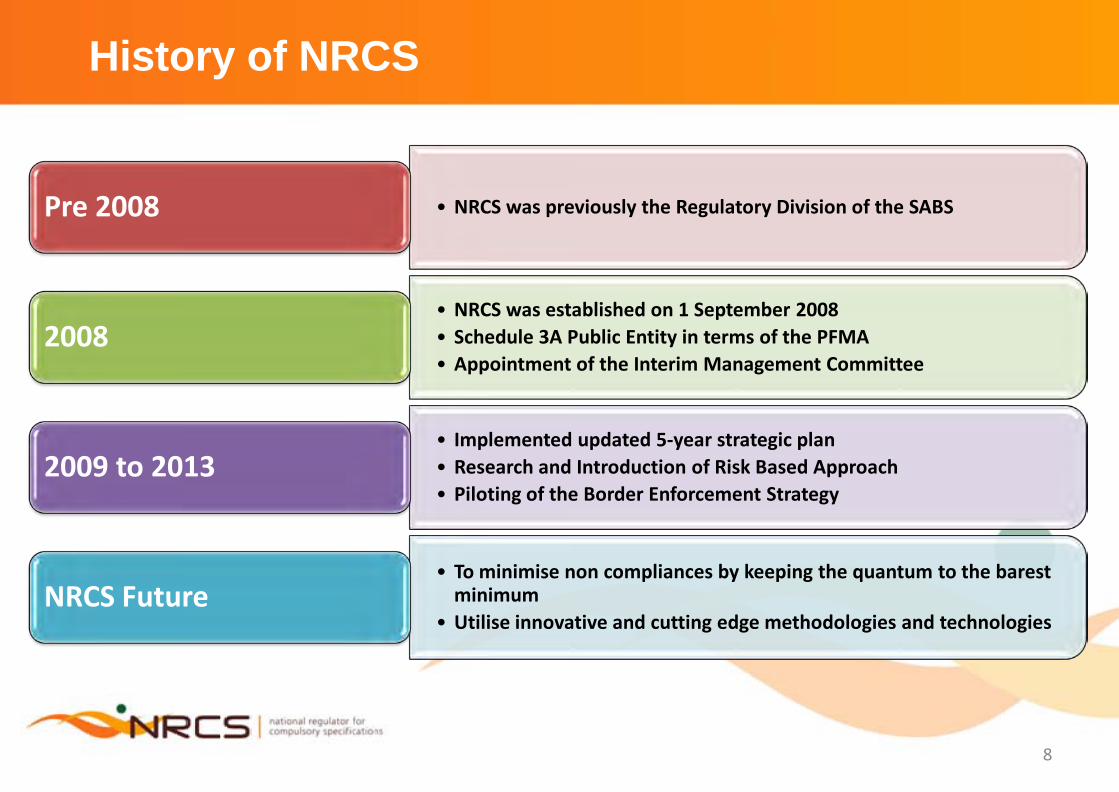
History of NRCS
8
• NRCS was previously the Regulatory Division of the SABSPre 2008
• NRCS was established on 1 September 2008• Schedule 3A Public Entity in terms of the PFMA• Appointment of the Interim Management Committee
2008
• Implemented updated 5-year strategic plan• Research and Introduction of Risk Based Approach• Piloting of the Border Enforcement Strategy
2009 to 2013
• To minimise non compliances by keeping the quantum to the barest minimum
• Utilise innovative and cutting edge methodologies and technologiesNRCS Future

Industries regulated by NRCS
9
Industry Sector Product regulated / Service renderedAutomotive Vehicles, Replacements components, Manufactures Importers and Builders
Chemicals, Materials and Mechanicals
Cement, chemicals, detergents, Personal protective equipment, safety shoes, building materials, treated timber, plastic bags, solar water heaters, plumbing equipment
Electro-technical Electrical appliances and products, Electronic appliances and products
Food and Associated Fishery products, canned meat and processed meat
Legal Metrology Calibration of measuring instruments, weights, measures and gaming equipment
Building Regulations Ensure uniform interpretation of NBR Act, administer review Board, set minimum regulatory requirements in standards, regulations, Building control officers convention and Building control officers training

NRCS Strategy and enablers
10
• Strategy to focus on Source Inspections– Source is point of entry or manufacture– lock out non-compliant products before the products enter point of trade and ensure
that NRCS is more efficient in regulating the market. – Retail and distributor inspections are meant for intelligence gathering and ensure that
non-compliant products are kept out of the market.
• Enablers– intelligent utilisation of information technology and effective supervision.– Collaboration with SARS, SABS, DAFF, NCC, DoH, SAPS, Home Affairs, – Effective risk profiling through SARS platform reducing delays at ports – Market Intelligence – Bill of lading, manifests

Highlights
11
• Held 3 destruction functions (CT, Dbn, Pta)– Goods to the value of R55m destroyed
• Over the past 5 years NRCS destroyed products amounting to R438m• Total value of non-compliant products for the 1st quarter 2014/15 was about
R115m, R61m was in Durban• Non-compliant pre-packed goods amounted to R 34,044m for Quarter 1. The major
contributors to the cost savings to consumers were imported seafood products and whisky, which amounted to about R19m, both of which were found to be of short mass/measure.
• Risk profiling through SARS platform reducing delays at ports• Implementation of the CRM System• Operationalised border enforcement at the following ports of entries: Durban, City
Deep, Cape Town, Port Elizabeth, Beitbridge and Libombo. • Improved performance reporting and management • Distributed 1500 compliant paraffin stoves to a number of informal settlements in
exchange of non-compliant ones• Settlement of Labour disputes

Overview of strategic outcomes
12

Overview of strategic outcomesPer the Strategic Plan
13
To ensure an optimally
capacitated institution
To develop, maintain
and administer compulsory
specifications and technical
regulations
To maximise compliance with all specifications
and technical regulations
To inform and educate our stakeholders
about the NRCS

Annual Report: Performance Information
14
15
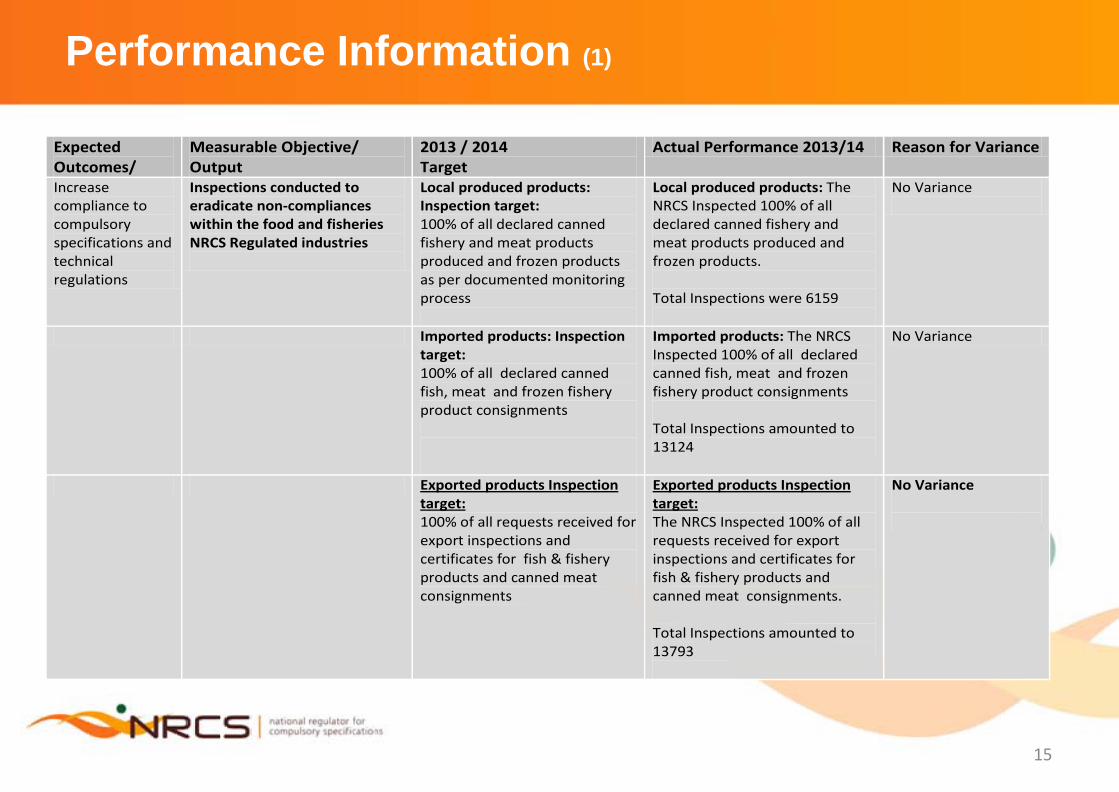
Performance Information (1)
Expected Outcomes/
Measurable Objective/ Output
2013 / 2014 Target
Actual Performance 2013/14 Reason for Variance
Increase compliance to compulsory specifications and technical regulations
Inspections conducted to eradicate non-compliances within the food and fisheries NRCS Regulated industries
Local produced products: Inspection target: 100% of all declared canned fishery and meat products produced and frozen products as per documented monitoring process
Local produced products: The NRCS Inspected 100% of all declared canned fishery and meat products produced and frozen products. Total Inspections were 6159
No Variance
Imported products: Inspection target: 100% of all declared canned fish, meat and frozen fishery product consignments
Imported products: The NRCS Inspected 100% of all declared canned fish, meat and frozen fishery product consignments Total Inspections amounted to 13124
No Variance
Exported products Inspection target: 100% of all requests received for export inspections and certificates for fish & fishery products and canned meat consignments
Exported products Inspection target: The NRCS Inspected 100% of all requests received for export inspections and certificates for fish & fishery products and canned meat consignments. Total Inspections amounted to 13793
No Variance

16
Performance Information (2)
Expected Outcomes/
Measurable Objective/ Output
2013 / 2014 Target
Actual Performance 2013/14 Reason for Variance
Increase compliance to compulsory specifications and technical regulations
Inspections conducted to eradicate non-compliances within the food and fisheries NRCS Regulated industries
Inspection target: Factory inspections: 272 Vessel inspections: 451
The NRCS inspected 446 factories The NRCS Inspected 403 fishing vessel
The variance is due to the closure of Squid Industry. Upon closure the vessels that were used by this industry did not require inspection as they are out of service.
Increase compliance to compulsory specifications and technical regulations
Inspections conducted to eradicate non-compliances within the Automotive, Electro-technical and chemical industries/sectors
Target for Chemicals, Materials and Mechanicals industry and products 4,960 inspections Target for Automotive industry and products: 4,000 inspections Target for Electro-technical industry and products: 4,000 inspections
The NRCS conducted 5192 inspections Chemicals, Materials and Mechanicals products The NRCS conducted 4054 inspections for Automotive products, manufacturers, builders and Importers The NRCS conducted 4338 Inspections for Electro-technical products

17
Performance Information (3)
Expected Outcomes/
Measurable Objective/ Output
2013 / 2014 Target
Actual Performance 2013/14 Reason for Variance
Increase compliance to compulsory specifications and technical regulations
Pre-market approvals to lock-out non-compliant products
Number of working days to issue an approval or to evaluate an application for approval: 21 working days
43,97% (3790 out of 8620) approval applications were approved within 21 working days
The NRCS experienced an increase in the approvals applications. The increase in applications is attributed to the increase in imported products and the success of the NRCS Border Enforcement approach. Due to the presents of NRCS at the ports of entry, the importers are forced to apply to the NRCS for the products to be allowed on the South African market.
Increase compliance to compulsory specifications and technical regulations
Inspections conducted to eradicate non-compliances within the Trade Metrology Domain
3,951 inspections The NRCS conducted 4,287 inspections within the Trade Metrology domain and as per the NRCS inspection procedure
18
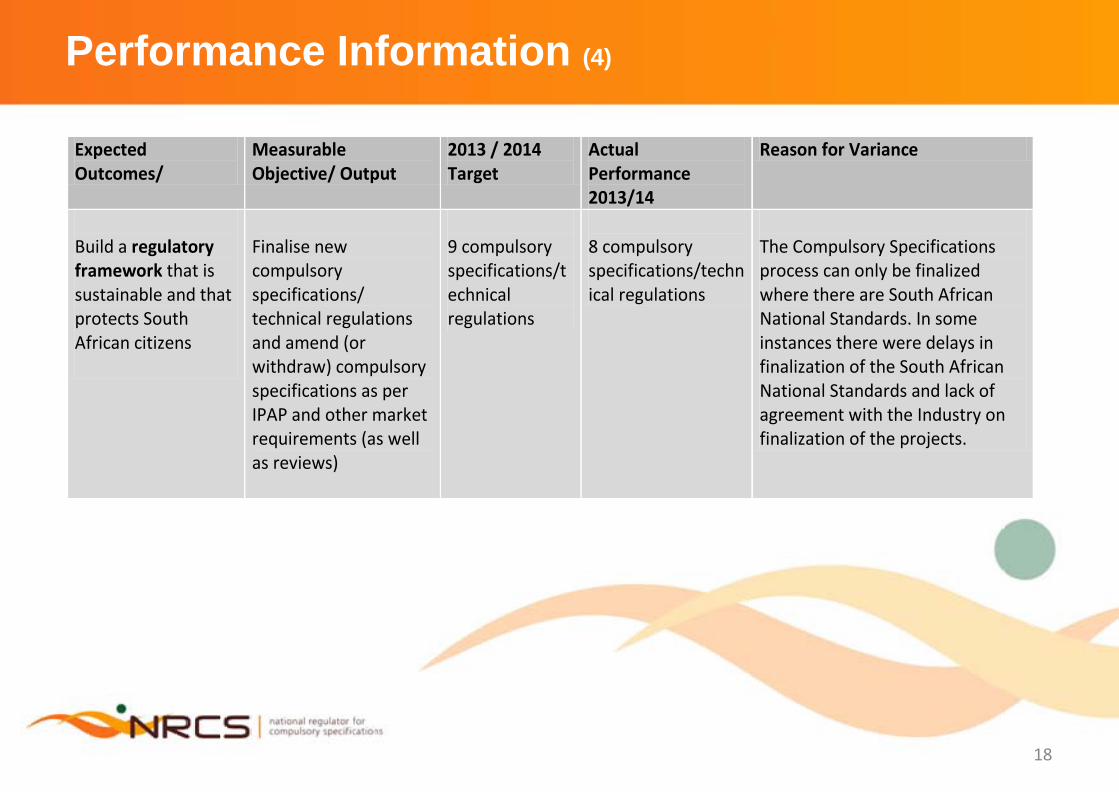
Performance Information (4)
Expected Outcomes/
Measurable Objective/ Output
2013 / 2014 Target
Actual Performance 2013/14
Reason for Variance
Build a regulatory framework that is sustainable and that protects South African citizens
Finalise new compulsory specifications/ technical regulations and amend (or withdraw) compulsory specifications as per IPAP and other market requirements (as well as reviews)
9 compulsory specifications/technical regulations
8 compulsory specifications/technical regulations
The Compulsory Specifications process can only be finalized where there are South African National Standards. In some instances there were delays in finalization of the South African National Standards and lack of agreement with the Industry on finalization of the projects.

Annual Report: Financial overview
19
Financial Overview
20
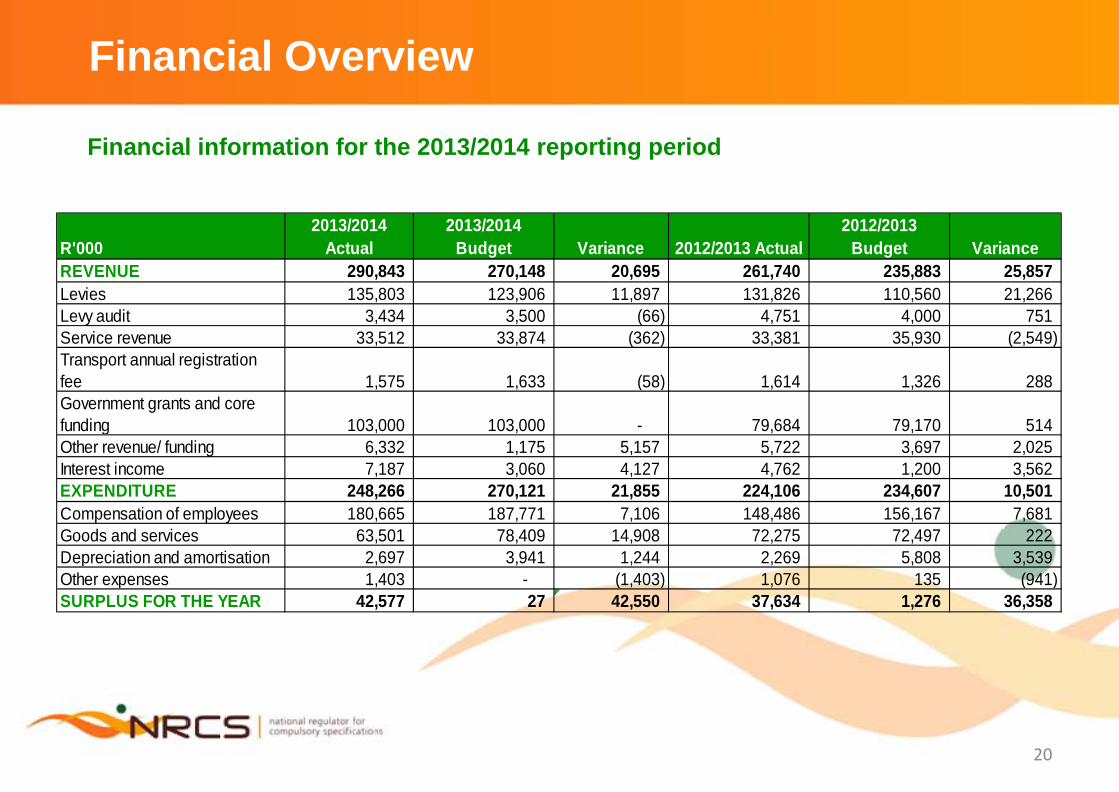
Financial information for the 2013/2014 reporting period
R'0002013/2014
Actual2013/2014
Budget Variance 2012/2013 Actual2012/2013
Budget VarianceREVENUE 290,843 270,148 20,695 261,740 235,883 25,857 Levies 135,803 123,906 11,897 131,826 110,560 21,266 Levy audit 3,434 3,500 (66) 4,751 4,000 751 Service revenue 33,512 33,874 (362) 33,381 35,930 (2,549) Transport annual registration fee 1,575 1,633 (58) 1,614 1,326 288 Government grants and core funding 103,000 103,000 - 79,684 79,170 514 Other revenue/ funding 6,332 1,175 5,157 5,722 3,697 2,025 Interest income 7,187 3,060 4,127 4,762 1,200 3,562 EXPENDITURE 248,266 270,121 21,855 224,106 234,607 10,501 Compensation of employees 180,665 187,771 7,106 148,486 156,167 7,681 Goods and services 63,501 78,409 14,908 72,275 72,497 222 Depreciation and amortisation 2,697 3,941 1,244 2,269 5,808 3,539 Other expenses 1,403 - (1,403) 1,076 135 (941) SURPLUS FOR THE YEAR 42,577 27 42,550 37,634 1,276 36,358
Financial Overview: Revenue
21
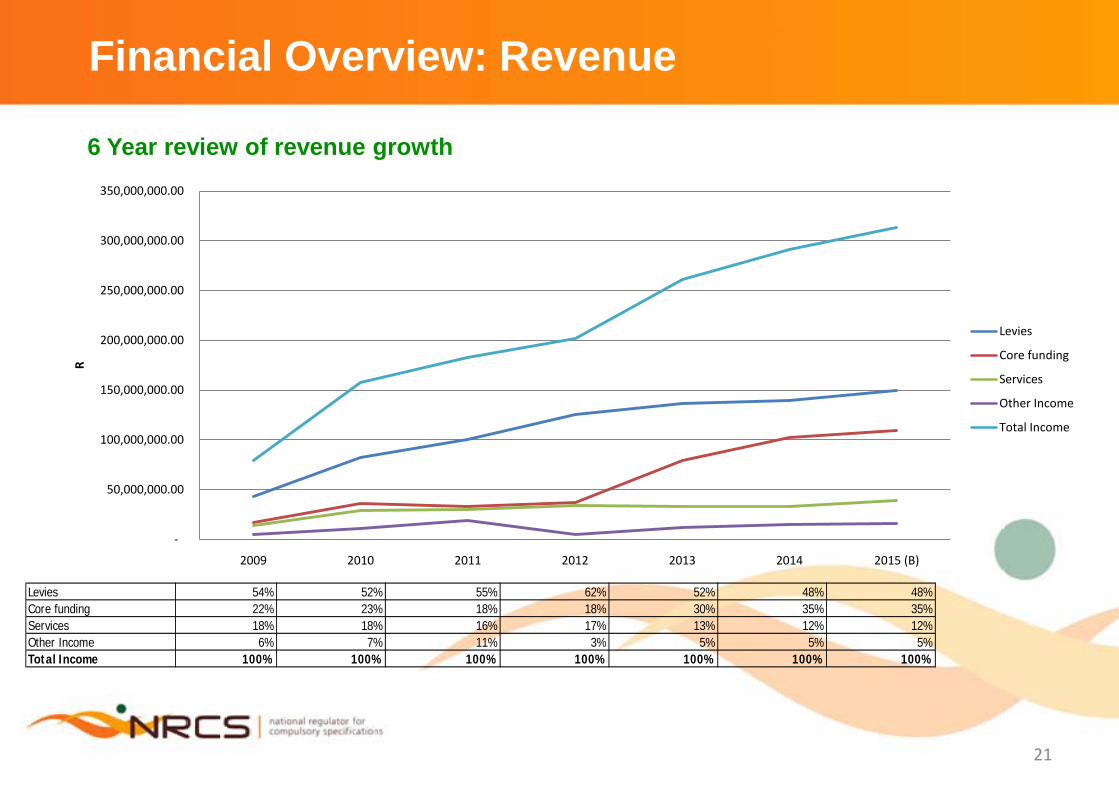
6 Year review of revenue growth
-
50,000,000.00
100,000,000.00
150,000,000.00
200,000,000.00
250,000,000.00
300,000,000.00
350,000,000.00
2009 2010 2011 2012 2013 2014 2015 (B)
R
Levies
Core funding
Services
Other Income
Total Income
Levies 54% 52% 55% 62% 52% 48% 48%Core funding 22% 23% 18% 18% 30% 35% 35%Services 18% 18% 16% 17% 13% 12% 12%Other Income 6% 7% 11% 3% 5% 5% 5%Total Income 100% 100% 100% 100% 100% 100% 100%
Financial Overview: Income vs. Expenditure
22
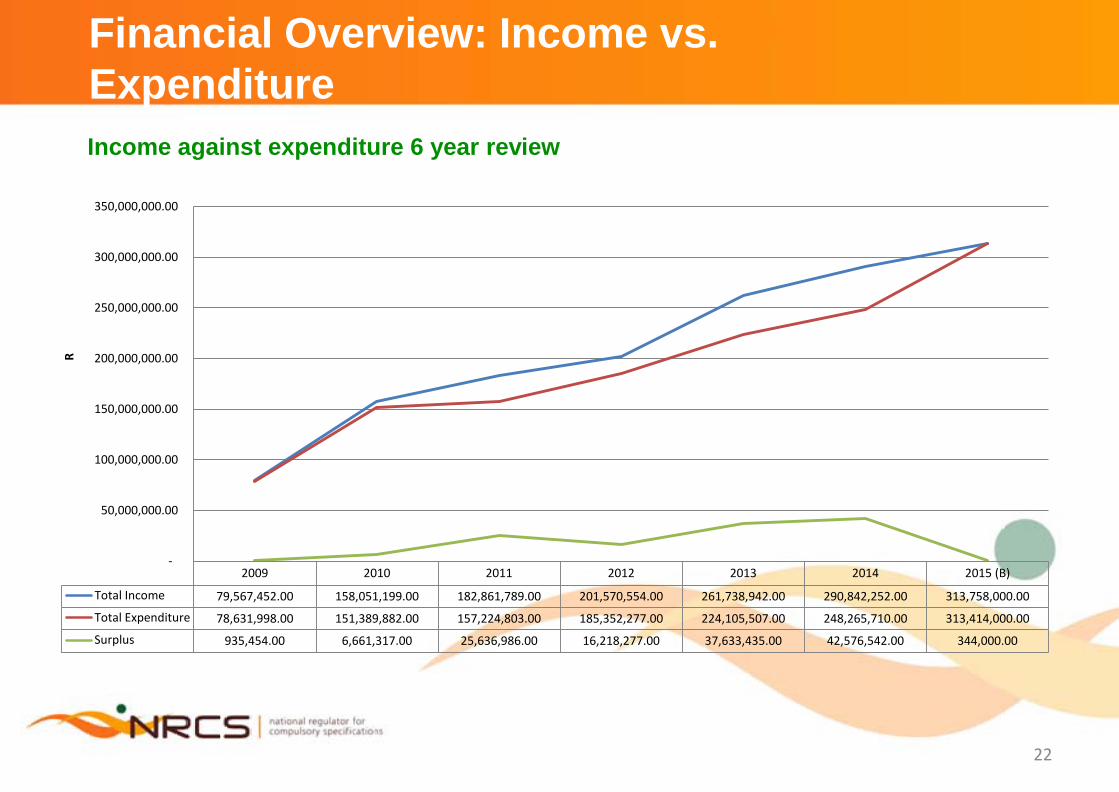
Income against expenditure 6 year review
2009 2010 2011 2012 2013 2014 2015 (B)
Total Income 79,567,452.00 158,051,199.00 182,861,789.00 201,570,554.00 261,738,942.00 290,842,252.00 313,758,000.00
Total Expenditure 78,631,998.00 151,389,882.00 157,224,803.00 185,352,277.00 224,105,507.00 248,265,710.00 313,414,000.00
Surplus 935,454.00 6,661,317.00 25,636,986.00 16,218,277.00 37,633,435.00 42,576,542.00 344,000.00
-
50,000,000.00
100,000,000.00
150,000,000.00
200,000,000.00
250,000,000.00
300,000,000.00
350,000,000.00
R

Annual Report: Audit Report
23

NRCS Audit report
24
Qualification Affected areas Management interventions Status
Revenue• First time qualification• Levy periods that have
been used for the past 20 years that are not aligned to the reporting periods in terms of GRAP 23
• Error could not be quantified by means of actuarial estimate as AG found revenue to not match inspection records
• Non-exchange revenue from levies for compulsory specifications
• Trade and other receivables from non-exchange transactions
• Gazette quarterly declaration of levies - Completed• Review total revenue ICT System functionality • Implement online customer portal, e-forms and for input of
levies • Review capacity in levy and levy audit sections and staff for
maximum efficiency - WIP• Annual valuation of levies (if required)• Integrate JDE, CRM, customer database, all other ICT
systems with appropriate exception reporting on levies• Establish levy payers not paying levies by comparing JDE to
inspection and approval information and customer database- Prior year - WIP
• Implement an integrated ERP for NRCS
In progress
Employee cost• First time qualification • A wage settlement
agreement was implemented that relied on appointment dates
• Appointment dates could not be accurately confirmed from inherited HR records
• Employee benefit obligations for long service leave awards
• Trade and other payables from exchange transactions for salary related accruals
• Provisions for leave pay
• Update all HR polices - WIP• Appoint Head of HR and HR Manager - WIP• Implement an HR management system • Implement an HR file plan - WIP• Audit all HR files for completeness. Prepare and implement a
plan of action for inconsistencies identified. - WIP• Issue letters of confirmation whenever there are changes to
individual's salaries• Recalculate the payroll for FY 2014 and YTD FY 2015 after
the full employee file audit is conducted. - WIP
In progress
Quarterly Report: Performance Information
25

26
Output Annual Target 1st Quarter milestones
Actual Achievement Comments Dashboard
Develop a set ofCompulsory Specifications/Technical Regulationsthat are responsive tomarket needs
12 CompulsorySpecifications/ Technical Regulations
0 CompulsorySpecifications/ Technical Regulations
0 CompulsorySpecifications/ TechnicalRegulations
There are 15 CopulsorySpecifications that arecurrently being developed
90 days from thedate NRCSreceives a reviewboard appeal tothe date the Boardissues a tribunalreport
90 days from the date NRCS receives areview board appealto the date the Boardissues a tribunalreport
0 cases adjudicated bythe review Board. Threecases were receivedduring the first quarter.
No Tribunal hearings wereheld during the Quarter dueto the suspension of servicesby the Review BoardChairperson.
The NRCS and the dti arecurrently in the process ofengaging the Chairperson toresolve the matter
100% of requeststo be attended towithin 90 days
100% of requests tobe attended to within90days
There were no requestsreceived for the quarterunder review. NRCShowever attended to twoinvestigations pertainingto the Tongaat Mall andthe JohannesburgMunicipal Power Stationbuilding collapse.
Ensure the uniformunderstanding &implementation of theNBRBS Act nationally
Strategic Goal 1; To develop, maintain and administer compulsory specifications and technical regulations
Performance Information (1)

27
Performance Information (2)
Output Performance Measureor Indicator
Annual Target 1st Quartermilestones
Actual Achievement Reason for Variance Dashboard
Number of working days to process approvals forthe automotive industry, being from the datereceived by the NRCS tothe date approved orrejected.
120 workingdays
120 working days 99.44% (1069 out of 1075processed within 120 days) 401applications were outstanding atthe beginning of the quarter, 1122 applications were received duringthe year and 448 applicationswere outstanding at the end ofthe quarter
Number of SourceInspections (excludingborder inspections)within the automotiveindustry
2400 720 590 There was concentrationon the source and retailmarket, as the NRCSdetected non-compliances at the retaillevel.
Number of Borderinspections within theautomotive industry
800 240 354
Number of retailinspections within theautomotive industry
800 240 319
Strategic Goal 2: To maximise compliance with all specifications and technical regulationsIncrease marketsurveillance activitiesand enforcecompliance throughregulations based onsound marketintelligence in theAutomotive Industry

28
Output Performance Measureor Indicator
Annual Target 1st Quartermilestones
Actual Achievement Reason for Variance Dashboard
Number of working days to process approvals forthe chemicals, materialsand mechanicalssectors, being from thedate received by theNRCS to the dateapproved or rejected.
120 workingdays
120 working days 79% (Processed 74 out of94 within 120 days)
Insufficient documentation submitted for approvalsprocess for theremaining applications.
Number of SourceInspections (excludingborder inspections)within the chemicals,materials andmechanicals sectors(CMM)
2240 672 338 The anticipated changesin the Compulsoryspecification of plasticbags have led to areduction in inspectionsin the sector and oneemployee is on maternityleave
Number of Borderinspections within CMMsectors
1120 336 224 There was concentrationon the retail market, asthe NRCS detected non-compliances at the retaillevel.
Number of retailinspections within CMMsectors
2240 672 935
Strategic Goal 2: To maximise compliance with all specifications and technical regulationsIncrease marketsurveillance activitiesand enforcecompliance throughregulations based onsound marketintelligence in thechemicals, materialsand mechanicalssectors.
Performance Information (3)
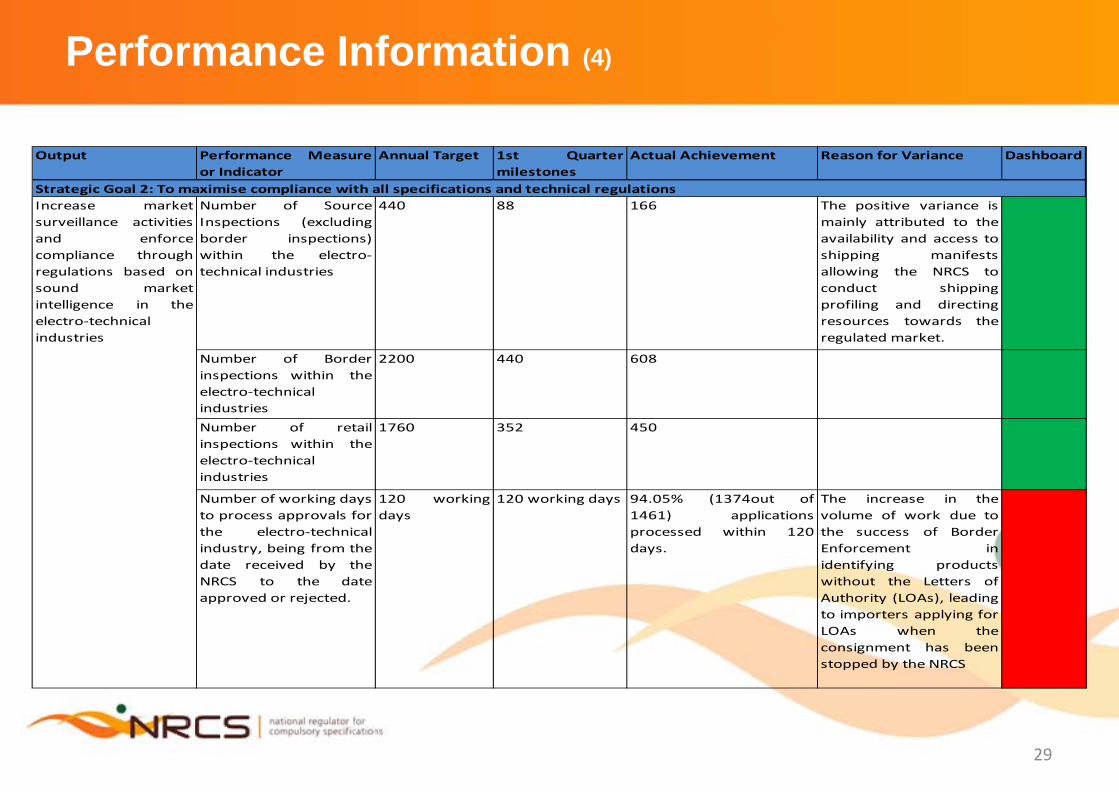
29
Output Performance Measureor Indicator
Annual Target 1st Quartermilestones
Actual Achievement Reason for Variance Dashboard
Number of SourceInspections (excludingborder inspections)within the electro-technical industries
440 88 166 The positive variance ismainly attributed to theavailability and access toshipping manifestsallowing the NRCS toconduct shippingprofiling and directingresources towards theregulated market.
Number of Borderinspections within theelectro-technical industries
2200 440 608
Number of retailinspections within theelectro-technical industries
1760 352 450
Number of working days to process approvals forthe electro-technicalindustry, being from thedate received by theNRCS to the dateapproved or rejected.
120 workingdays
120 working days 94.05% (1374out of1461) applicationsprocessed within 120days.
The increase in thevolume of work due tothe success of BorderEnforcement inidentifying productswithout the Letters ofAuthority (LOAs), leadingto importers applying forLOAs when theconsignment has beenstopped by the NRCS
Strategic Goal 2: To maximise compliance with all specifications and technical regulationsIncrease marketsurveillance activitiesand enforcecompliance throughregulations based onsound marketintelligence in theelectro-technical industries
Performance Information (4)

30
Output Performance Measureor Indicator
Annual Target 1st Quartermilestones
Actual Achievement Reason for Variance Dashboard
Number of SourceInspections within thelegal metrology domain
4151 1045 1441 The positive variance is dueto new inspectors thatqualified during the Quarter under review
Number of retailInspections within thelegal metrology domain
1038 261 324
Number of working daysto process typeapprovals for measuringinstruments, being fromthe date received by theNRCS to the dateapproved or rejected
120 workingdays
120 working days 100% of the 40 typeapproval applicationsprocessed was processedwithin 120 days.
Number of working daysto process approvals forthe gaming equipment,being from the datereceived by the NRCS tothe date approved orrejected.
21 workingdays
21 working days 89% (226) of the 255gaming applicationsprocessed was processedwithin 120 days.
Applications submittedwithout the correct TestReports and incompleteapplication formssubmitted to the NRCS.
Strategic Goal 2: To maximise compliance with all specifications and technical regulationsIncrease marketsurveillance activitiesand enforcecompliance throughregulations based onsound marketintelligence in the legalmetrology domain
Performance Information (5)

31
Output Performance Measure orIndicator
Annual Target 1st Quarter milestones Actual Achievement Dashboard
Percentage of Inspectionsconducted on locallyproduced canned fisheryand meat products
100% of all declaredlocally producedcanned fishery andmeat productsproduced.
100% of all declaredLocally producedcanned fishery andmeat productsproduced.
Inspected 100% of alldeclared canned fisheryand meat productsproduce. Canned Fish:687 Canned Meat: 1246
Number of inspectionsconducted on locallyproduced Frozen products
1033 frozen fishinspections
258 frozen fishinspection
Conducted 283inspections for Frozenproducts
Percentage of inspectionsconducted on all declaredImported canned fish, meatand frozen fishery productconsignments imported
100% of all declaredImported cannedfish, meat and frozenfishery productconsignments imported
100% of all declaredImported canned fish,meat and frozen fisheryproduct consignmentsimported
Inspected 100% of allImported canned fish,meat and frozen fisheryproduct consignmentsCanned and Frozen Fish:2045
Strategic Goal 2: To maximise compliance with all specifications and technical regulationsIncrease marketsurveillance activitiesand enforcecompliance throughregulations based onsound marketintelligence in thefoods and associatedindustries
Performance Information (6)

32
Output Performance Measure orIndicator
Annual Target 1st Quarter milestones Actual Achievement Dashboard
Percentage of inspectionsconducted on requests received for fish & fishery and canned meatexport productsconsignments
100% of all requestsreceived for exportinspections andcertificates for fish &fishery products andcanned meatconsignments
100% of all requestsreceived for exportinspections andcertificates for fish &fishery products andcanned meatconsignments
Inspected 100% of allrequests received forexport consignments forfish & fishery productsand canned meatconsignments Exportedproduct: 3423
Number of Inspectionsconducted on fishery andcanned meat processingfactories and vessels
1005 Facilitiesinspections
251 Facilitiesinspections
Conducted 234 facilitiesInspections
Strategic Goal 2: To maximise compliance with all specifications and technical regulationsIncrease marketsurveillance activitiesand enforcecompliance throughregulations based onsound marketintelligence in thefoods and associatedindustries
Performance Information (7)

Quarterly Report:Financial overview
33
Financial Overview
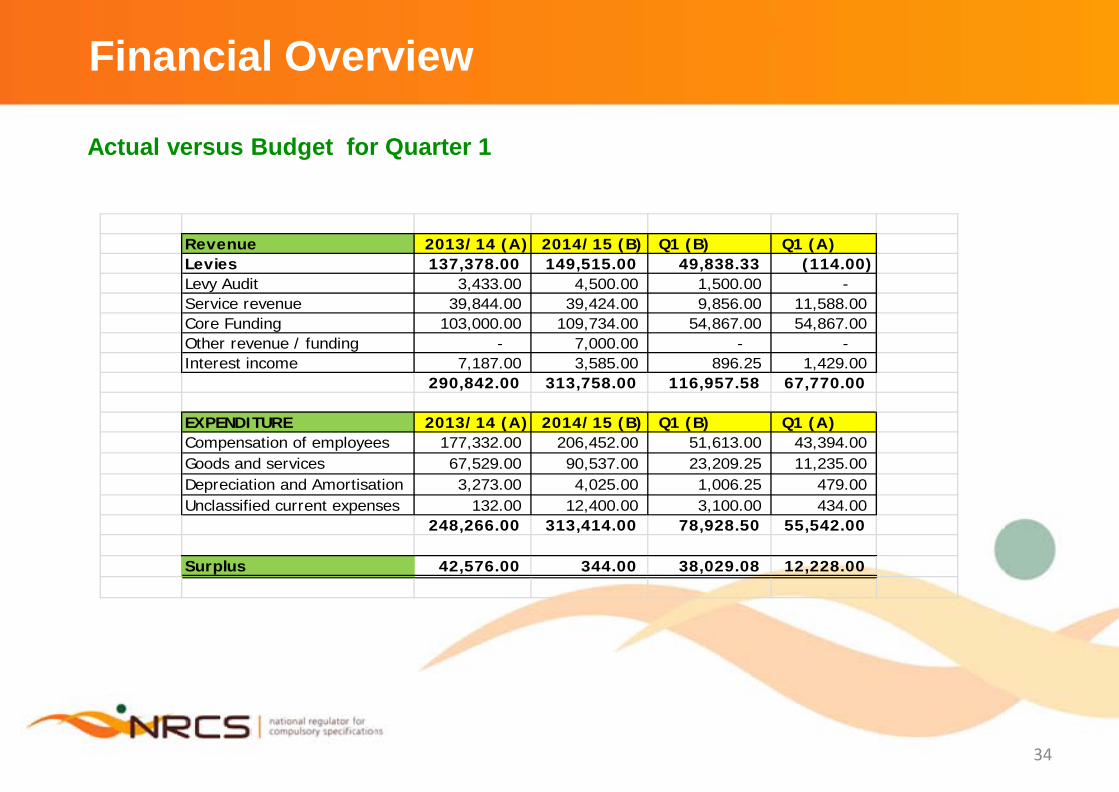
34
Actual versus Budget for Quarter 1
Revenue 2013/14 (A) 2014/15 (B) Q1 (B) Q1 (A)Levies 137,378.00 149,515.00 49,838.33 (114.00) Levy Audit 3,433.00 4,500.00 1,500.00 - Service revenue 39,844.00 39,424.00 9,856.00 11,588.00 Core Funding 103,000.00 109,734.00 54,867.00 54,867.00 Other revenue / funding - 7,000.00 - - Interest income 7,187.00 3,585.00 896.25 1,429.00
290,842.00 313,758.00 116,957.58 67,770.00
EXPENDITURE 2013/14 (A) 2014/15 (B) Q1 (B) Q1 (A)Compensation of employees 177,332.00 206,452.00 51,613.00 43,394.00 Goods and services 67,529.00 90,537.00 23,209.25 11,235.00 Depreciation and Amortisation 3,273.00 4,025.00 1,006.25 479.00 Unclassified current expenses 132.00 12,400.00 3,100.00 434.00
248,266.00 313,414.00 78,928.50 55,542.00
Surplus 42,576.00 344.00 38,029.08 12,228.00
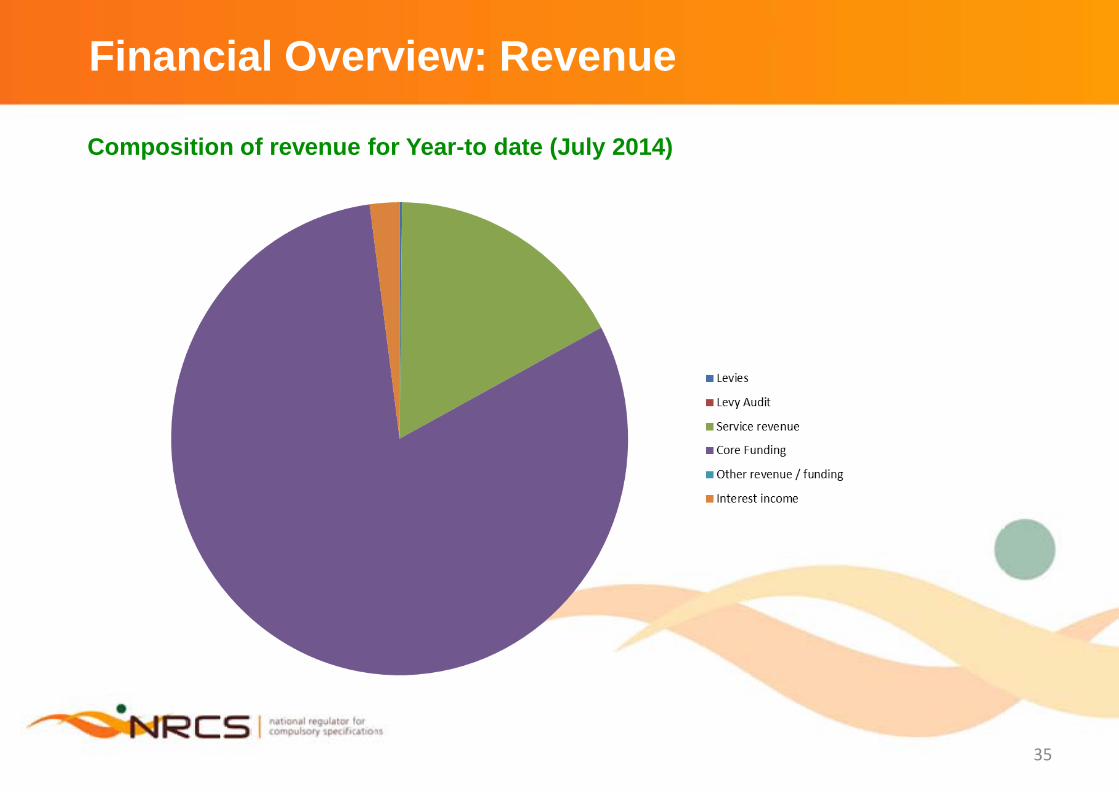
Financial Overview: Revenue
35
Composition of revenue for Year-to date (July 2014)

Financial Overview: Revenue
36
Actual versus budget revenue for each revenue stream compared to the prior year.Total revenue of R67 770 in relation to budget of R116 958
(20,000)
-
20,000
40,000
60,000
80,000
100,000
120,000
140,000
160,000
Levies Levy Audit Service revenue Core Funding Other revenue / funding
Interest income
2013/14 (A) 137,378 3,433 39,844 103,000 - 7,187
2014/15 (B) 149,515 4,500 39,424 109,734 7,000 3,585
Q1 (B) 49,838 1,500 9,856 54,867 - 896
Q1 (A) (114) - 11,588 54,867 - 1,429
R' '0
00
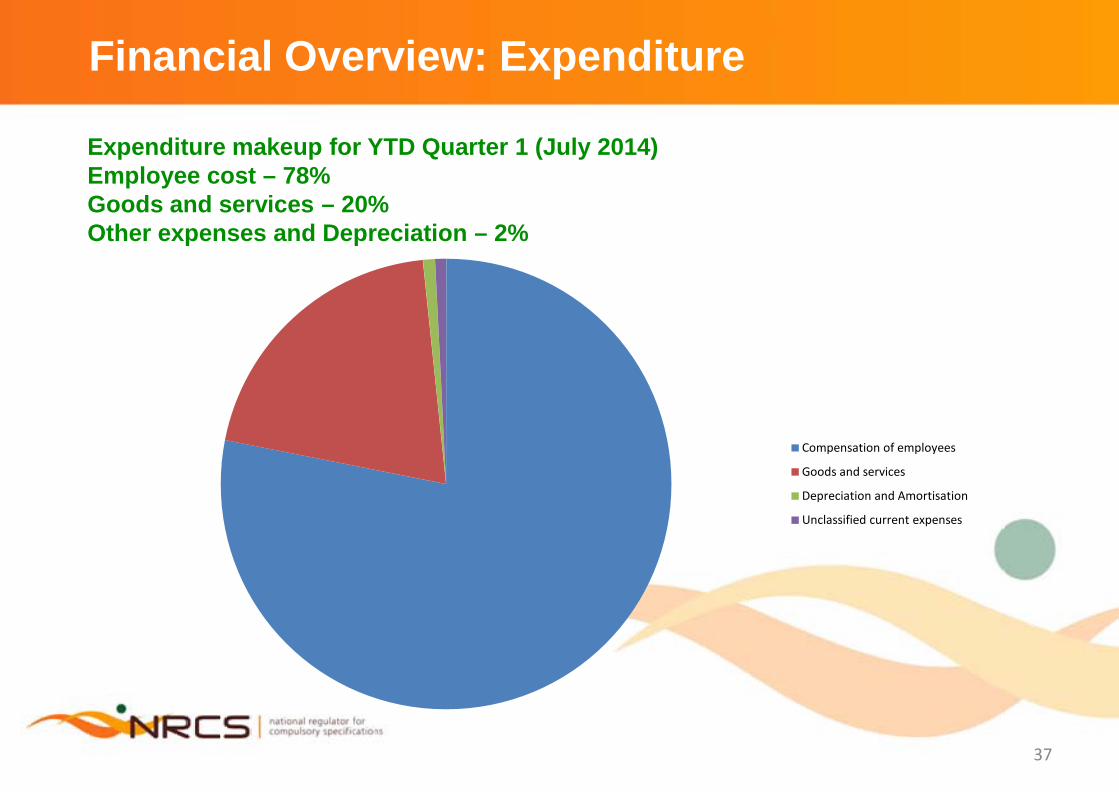
Financial Overview: Expenditure
37
Expenditure makeup for YTD Quarter 1 (July 2014)Employee cost – 78%Goods and services – 20%Other expenses and Depreciation – 2%
Compensation of employees
Goods and services
Depreciation and Amortisation
Unclassified current expenses

Financial Overview: Expenditure
38
Expenditure for Q1 compared to budget and actual
-
50,000
100,000
150,000
200,000
250,000
Compensation of employees
Goods and services Depreciation and Amortisation
Unclassified current expenses
2013/14 (A) 177,332 67,529 3,273 132
2014/15 (B) 206,452 90,537 4,025 12,400
Q1 (B) 51,613 23,209 1,006 3,100
Q1 (A) 43,394 11,235 479 434
R '0
00
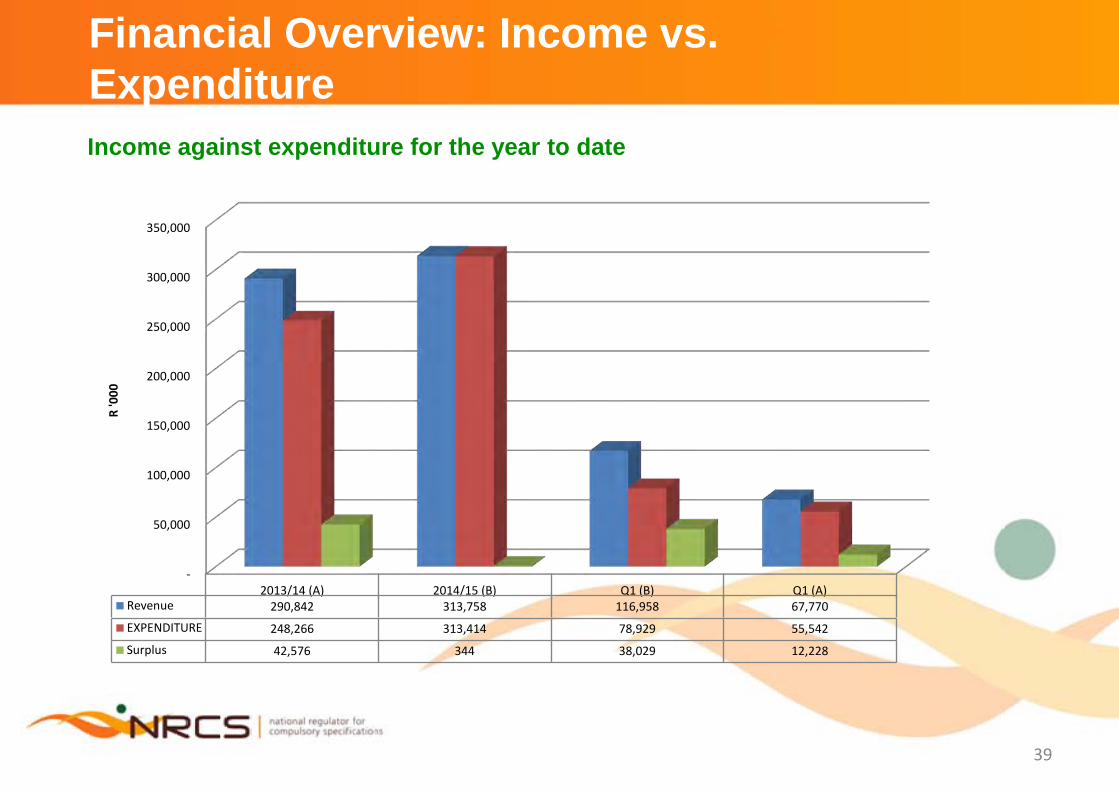
Financial Overview: Income vs. Expenditure
39
Income against expenditure for the year to date
-
50,000
100,000
150,000
200,000
250,000
300,000
350,000
2013/14 (A) 2014/15 (B) Q1 (B) Q1 (A)Revenue 290,842 313,758 116,958 67,770
EXPENDITURE 248,266 313,414 78,929 55,542
Surplus 42,576 344 38,029 12,228
R '0
00

Challenges
40

Organisational Challenges
External challenges faced by NRCS include:
• Inadequate testing facilities in South Africa for some regulated products e.g Motor cycle helmets
• Lack of qualified staff and the inability to recruit required specialist resources Capacity constraints: Evaluator capacity in Electro-technical approvals continues to be a major concern.
• The application and regulation of products covered under VCs that are outdated. • High transportation and storage costs for confiscated goods
Current challenges faced by NRCS include:
• Organisational maturity as NRCS is still in infancy stage • Generation of revenue reliant on trends and markets• Internal control weaknesses including procurement, asset management and HR• Labour relations and a range of staff and HR issues
41

The end
42