11 management of solid wastes - eeaa.gov.eg · 2007-04-02 · 151 introduction sound solid waste...
TRANSCRIPT

151
Introduction
Sound solid waste management needs to be dealt with from the perspective of multi-sided, multi-component and closely-linked integrated system, with each link being subsequent to the link before and mean-while forming the basis for the link after. In all cases, it is essential in each stage to employ suitable and adequate means matching with prevailing circumstances, available resources and existing determi-nants. This is embodied in the adoption of best options consistent with technical stan-dards, environmental safety, and social concord as well as with least possible costs, highest possible resource recovery, adher-ence to legislation and statutes together with marked flexibility and good under-standing of the birth-to-death life cycle.
Solid Waste Situation in Egypt
The aggregate quantity of generated solid wastes in Egypt is measured by 65-70 mil-lion tons annually according to 2005 esti-mates. Table (11-1) shows sources and types of waste including the solid, indus-trial and agricultural, the sludge ensuing from wastewater treatment processes, hos-pital waste and construction and demolition debris besides wastes from cleaning of ca-nals and drains. It includes as well solid municipal waste (garbage) and household waste (accounting for 60%), and waste from shops, commercial markets, service institutions such as schools, educational institutes, utilities, hospitals, administrative buildings, streets, gardens, markets, hotels and recreational houses not to mention waste of some small factories and camps.
11 Management of Solid Wastes

Management of Solid Wastes
152
Table (11-1) Sources and Types of Solid Waste
Source Standard Sources of Waste Types of Solid Waste
Residential Single and multi-family residences
Food, paper, carton, plastic, weaving and leather waste, as well as gardens, wood, glass, minerals and ashes waste and special kind of waste (relating
for example to large-sized varieties, consumer
electronics, white goods, batteries, oils, and car tires) as well as hazardous household
waste.
Industrial Heavy and light industries,
construction locations and non-hazardous energy stations.
Waste of cleaning, packaging material, and food,
construction and demolition debris, and special non-
hazardous waste
Commercial Shops, hotels, restaurants, markets, administrative buildings and others
Paper, carton, plastic, wood, food, minerals and special
wastes
Institutional Schools, prisons, and government centers
Same type of industrial and commercial waste
Construction and Demolition
New construction sites, road reparations, renovation works and
demolition operations.
Wood, iron and steel, dust and others
Localities’ Services
Cleaning of streets, cultivation, gardens, beaches and other
recreational areas, water treatment stations and liquefied wastes
Street wastes, remains of plant and tree pruning, public waste
from gardens, beaches and other recreational places besides sewerage sludge.
Treatment
Heavy and light industries, oil refineries, energy stations and
extraction of non-hazardous minerals and their treatment
Industrial treatment, scrap, non-conforming products, and non-hazardous mines waste.

153
Management of Solid Wastes
Solid Waste Problem in Egypt: The solid waste problem in Egypt can summed up in the fact that existing sys-tems neither meet the needs of the society nor provide appropriate service to all its classes due to overarching inadequacy as regards different components, resources, capabilities and potential of the entire sys-tem alongside lack of favorable general atmosphere. This has been reflected in widespread garbage pile-ups in several places which form hotbeds of pollution, foresee numerous health-detrimental and environmental risks in applying certain means of handling, transfer and disposal. Table (11-2) shows quantities of accumu-lations at the level of the Arab Republic of Egypt in accordance with 2005 estimates.
Figure (11-1) Impact of the Solid Waste Problem on Environment
Solid Waste Problem ImpactsSolid Waste Problem Impacts
Solid Waste Accumulation ImpactSolid Waste Accumulation Impact Other ImpactsOther Impacts Economic ImpactsEconomic Impacts
Multiple Health Multiple Health Changed quality Changed quality Of EnvironmentOf Environment
IntesIntes OthOthResResSoilSoil AirAir WaterWater
** Increased potential accidents espe-Increased potential accidents espe-cially firescially fires
** Sanitary drainage network blockageSanitary drainage network blockage ** Intercepted Irrigation network inter-Intercepted Irrigation network inter-
ceptionception
** Increased waste ratesIncreased waste rates ** Affected tourismAffected tourism ** Downgraded placesDowngraded places ** Lost job opportunitiesLost job opportunities
Figure (11-1) shows environmental and y implications of the solid waste problem
Gover-norate
Accumula-tions m3
Gover-norate
Accumula-tions m3
Alexandria 334,830 Kafr El Sheikh
227,000
Beheira 600,000 Demiatta 100,000
Monofia 280,000 Gharbia 1,500,000
Sharqia 510,000 Daqahlia 1,300000
Mersa Matrouh
146,429 North Sinai 140,000
Port Said 359,040 South Sinai 512,000
Ismailia 350,000 Suez 1,168550
Fayoum 292,500 Red Sea 11,885000
Menya 951,000 Beni Suef 150,000
Sohag 281,845 Assiut 250,000
Luxor 107,022 Qena 258,480
Aswan 385,240
Aggregate accumulations upon their removal from Cairo, Guiza, and
Qalubia and the deletion of 14 million m3
22,098,936
Table (11-2) Amount of accumulated waste in some governorates according to 2005 estimates

Management of Solid Wastes
154
Causes of the Problem
1. Absence of the institutional infrastruc-ture capable of planning, regulating, and implementing the integrated system
2. Low-level efficiency of covering col-lection and transport services that was reduced to less than 30% in some small cities and a maximum of around 50% in some regions of metropolitan cities, and was almost non-existent in informal and rural areas.
3. Operational problems, deficiency of maintenance capabilities and inadequa-cies in workshops and garages.
4. Meager qualified and trained technical cadres for management and operation processes and their low-level remunera-tions and wages which discourage req-uisite expansions to operate further in this field and rather nurture disinterest in it.
5. Massive shortfall in finance provided from all sources plus absence of respec-tive budgets.
6. Lack of sufficient controlled public landfills that conform to environmental conditions besides absence of sanitary dumpsites for safe disposal of solid waste remains.
7. Default on effectuating laws to achieve acceptable levels of the integrated sys-tem.
8. Low-level public awareness regarding the solid waste issue thus negatively impacting on attitudes and resulting in the masses’ indifference about substan-tial involvement in the resolution of the problem in question.
Table (11-3) shows different quantities of solid waste varieties which garbage and agricultural trash account for almost 55% of the total of such wastes.
Table (11-4) shows percentages of contents of municipal solid waste in Egypt in com-pliance with 2005 estimates
Table (11-3) Different quantities of waste varieties in accordance with 2005 estimates
Type of Waste Annual Estimated Quantity
Municipal (Garbage) 15-16 million tons
Industrial 4.5-5 million tons
Agricultural 25-30 million tons
Sludge 1.5-2 million tons
Waste from cleaning of drains and waterways
20 million tons
Hospitals 0.1-0.12 million tons Construction and demolition debris
3-4 million tons
Table (11-4) Percentages of contents of municipal solid waste in Egypt in accordance with 2005
estimates
Type of Waste Percentage (%)
Organic 50-60
Paper and Carton 10-25
Plastic 3-12
Glass 1-5
Minerals 1.5-7
Rags 1.2-7
Other Materials 11-30
(Relative density 0.3 ton/m3., humidity 30-40%)

155
Management of Solid Wastes
State Efforts To Counter Chal-lenges Posed To Solid Waste Man-agement 5
1-Removal of Historic Accumula-tions
The government represented by the Minis-try of State for Environmental Affairs had envisaged an integrated plan for the re-moval of historic accumulations from Greater Cairo (Cairo-Giza-Qalyobia) where the quantity of historic accumula-tions inside Greater Cairo amounted to al-most 14 million m3 Figure (11-2) shows accumulated quantities in each of the three governorates. Phased removal of accumu-lations had begun in September 2004 in cooperation with the Military Forces Na-tional Service Agency.
During 2005, about 7.75 million m3. of historic ac-cumulations had been removed from within Greater Cairo governorates:
a. Approximately 2.5 million m3. of ac-cumulations were transferred to sani-tary dumpsites within each Greater Cairo-located governorate (Al Wafaa Wa Al Ammal Dumpsite in Cairo, Shobrament Dumpsite in Giza and Abu Zabaal Dumpsite in Qalyubia).
b. Around 8 million cubic meters of ac-cumulations (mostly demolition and construction debris) had been leveled and covered.
c. Establishment of gardens in Cairo and Giza over an area of around 20.000 meter squares.
d. Leveling operations, fire-extinctions and clean soil coverage for an area of approximately 185,000 meters plus a sand barrier that is 2.5 meter high and 5 km in perimeter that encircles the Rubeiki landfill in the 10th of Rama-dan City had been carried out.
Tables (11-5, 11-6, 11-7, 11-8) illustrates stages of handling historic accumulations
Figure (11-2) Greater Cairo Accumulations in million m3
0
2
4
6
8
10
Cairo Guiza Qalyubya

Management of Solid Wastes
156
Stages of Accumulation Removals
Quantities removed were estimated at approxi-mately 600,000 m3. Demolition and construction debris being the remainder of the gross quantity in these sites had been leveled.
Quantities removed are estimated at approximately 500,000 m3. Demolition and construction debris, being the remainder of the gross quantity in these sites, had been leveled.
Picture (11-1) Ard El Lewa – Guiza Governorate
Before After
Picture (11-2) Musturod Landfill - Qalyubia
Before After
Governorate Site Quantity of accumula-tions (m3)
Cairo Ezbet El Zabaleen in Katamia
250,000
Informal landfill in Katamia
(Degla Valley– Wadi Degla)
250,000
Al Dakhet Al Aley Street in Nasr City
(Madinet Nasr)
250,000
Sand Stone 50,000
Ezbet El Haganah 30,000
Leveling works 30,000 m2 –
Rubeiki landfill
Total 830,000 m3
Guiza Kafr El Gabal nearby Kafr El
Gabal compound and Gamal Abdul
Nasser Street
50,000
Abu Rawash 250,000
Teraat El Zomor 250,000
Teraat Abdul Al Street
20,000
Total 570,000 m3
Gross Quantity 1,400,000 m3
Table (11-6) – Second Stage
Governorate Site Accumulation Quantity (m3)
Cairo Al Gabal Al Ahmer
2,500,000
Ezbet Al Walda 150,000
Leveling works 55000 m2 in
Rubeiki Landfill
Total 2,650,000 m3
Guiza Beshtil 100,000
Ard El Lewa 50,000
Al Barageel 50,000
Embaba Airport 150,000
Ring Road Tunnels 150,000
Total 500,000 m3
Qalyubia Musturod Landfill 250,000
Total 250,000 m3
Gross Quantity
3,400,000 m3
Table (11-5) First Stage

157
Management of Solid Wastes
Quantities removed are estimated at approximately 500,000 m3. Demolition and construction debris, being the remainder of the gross quantity in these sites, had been leveled.
Picture (11-3) Ezbet Al Hagana – Cairo
Before After
Picture (11-4) Boulak District – Giza Governorate
After Before
After Before
Picture (11-5) Salah Eddin Schools – Cairo Governorat
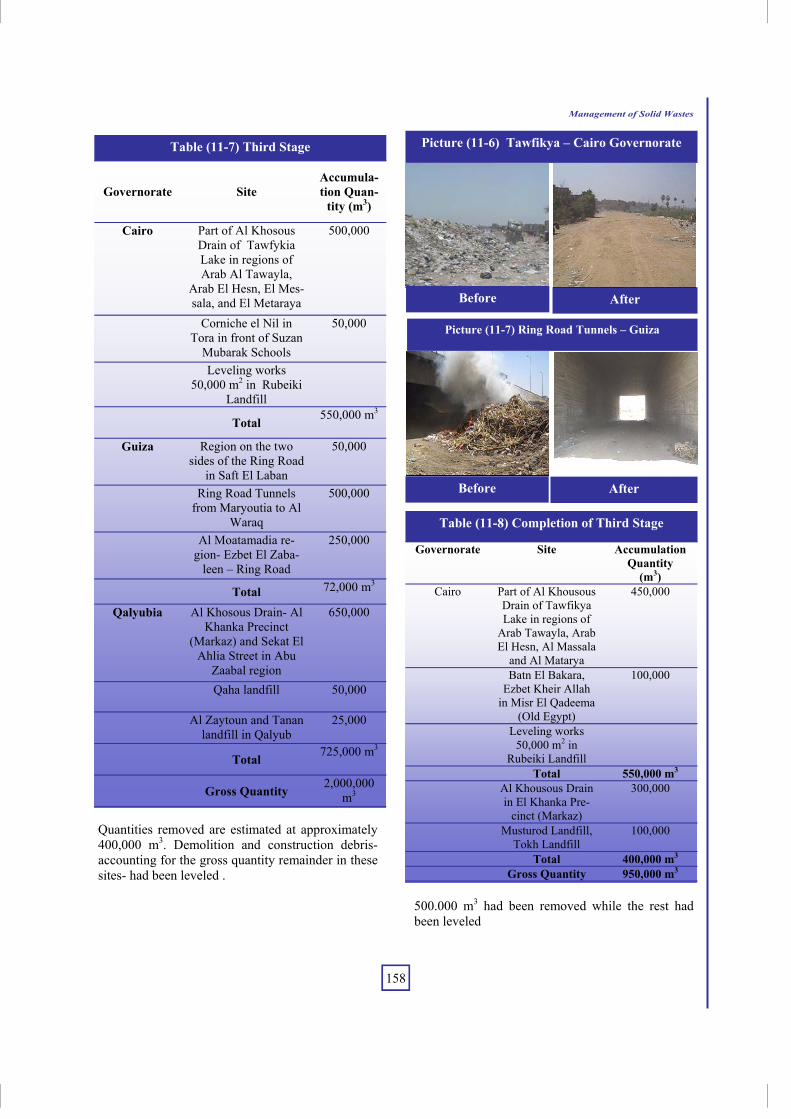
Table (11-7) Third Stage
Gover-norate Site
Accumu-lation
Quantity (m3)
Cairo Part of Al Khosous Drain of Tawfykia Lake
in regions of Arab Al Tawayla, Arab El
Hesn, El Messala, and El Metaraya
500,000
Corniche el Nil in Tora in front of Suzan Muba-
rak Schools
50,000
Leveling works 50,000 m2 in Rubeiki Landfill
Total 550,000 m3
Giza Region on the two sides of the Ring Road in Saft
El Laban
50,000
Ring Road Tunnels from Maryoutia to Al Waraq
500,000
Al Moatamadia region- Ezbet El Zabaleen –
Ring Road
150,000
Total 725,000 m3
Qalyubia Al Khosous Drain- Al Khanka Precinct
(Markaz) and Sekat El Ahlia Street in Abu Zaa-
bal region
650,000
Qaha landfill 50,000
Al Zaytoun and Tanan landfill in Qalyub
25,000
Total 725,000 m3
Gross Quantity 2,000,000 m3
Management of Solid Wastes
158
Quantities removed are estimated at approximately 400,000 m3. Demolition and construction debris- accounting for the gross quantity remainder in these sites- had been leveled .
500.000 m3 had been removed while the rest had been leveled
Table (11-7) Third Stage
Governorate Site Accumula-tion Quan-
tity (m3)
Cairo Part of Al Khosous Drain of Tawfykia Lake in regions of Arab Al Tawayla,
Arab El Hesn, El Mes-sala, and El Metaraya
500,000
Corniche el Nil in Tora in front of Suzan
Mubarak Schools
50,000
Leveling works 50,000 m2 in Rubeiki
Landfill
Total 550,000 m3
Guiza Region on the two sides of the Ring Road
in Saft El Laban
50,000
Ring Road Tunnels from Maryoutia to Al
Waraq
500,000
Al Moatamadia re-gion- Ezbet El Zaba-
leen – Ring Road
250,000
Total 72,000 m3
Qalyubia Al Khosous Drain- Al Khanka Precinct
(Markaz) and Sekat El Ahlia Street in Abu
Zaabal region
650,000
Qaha landfill 50,000
Al Zaytoun and Tanan landfill in Qalyub
25,000
Total 725,000 m3
Gross Quantity 2,000,000 m3
After
Picture (11-6) Tawfikya – Cairo Governorate
Before
After Before
Picture (11-7) Ring Road Tunnels – Guiza
Governorate Site Accumulation Quantity
(m3) Cairo Part of Al Khousous
Drain of Tawfikya Lake in regions of
Arab Tawayla, Arab El Hesn, Al Massala
and Al Matarya
450,000
Batn El Bakara, Ezbet Kheir Allah
in Misr El Qadeema (Old Egypt)
100,000
Leveling works 50,000 m2 in
Rubeiki Landfill
Total 550,000 m3 Al Khousous Drain
in El Khanka Pre-cinct (Markaz)
300,000
Musturod Landfill, Tokh Landfill
100,000
Total 400,000 m3 Gross Quantity 950,000 m3
Table (11-8) Completion of Third Stage

159
Management of Solid Wastes
Development of Informal Areas
After Before
Picture (11-8) Al Khousous Extension- Qalyubia Governorate
Picture (11-9) Al Khousous Extension – Qalyubia Governorate
After Before
Before
Picture (11-10) Ezbet Kheir Allah – Cairo Governorate
After
Description of Works Quantity
Transporting wastes to con-trolled dumpsites 40.000 m3
Leveling of demolition and construction debris and
providing clean soil cover-age
18.500 m2
Mastic works on pavements 2.000 m2
Bordure-paints works 1500 m/t
Works related to plant-beds and arborization 15
Table (11-9) Development of Informal Areas – Al Maasara region (August 2005)
Before After
Picture (11-11) Teraat El Khashab – Al Maasara
Picture (11-12) Al Rashah Street – Al Maasara
After Before

Management of Solid Wastes
160
Second: Upgrading the Efficiency of Collection and Transport Op-erations
To avoid recurrence of accumulations, gov-ernorates of Guiza, Qalyubia, Daqahlia and Gharbia are supported by equipment speci-fied in Table (11-10).
3-Garbage Recycling and Produc-
tion of Organic Compost (Composting)
Aerobic composting in windrows with re-cyclables recovery is considered one of the appropriate technologies consistent with Egyptian circumstances, types of wastes and their organic content. Thus it was rec-ommendable to have it included in the en-vironmental action plan for 1992, and ac-cordingly a well studied plan had been de-veloped in collaboration with the Ministry of Local Development and the Ministry of Military Production represented in military factories set to furnish production lines of garbage and waste recycling for the pro-duction of organic compost and the recov-ery of other waste components such as
plastic, glass, paper, etc. Therefore, 66 fac-tories had been developed and established up till 2005 to transfer garbage into organic compost. Table (11-11) indicates garbage recycling and organic compost production plants. It can be observed that out of 66 factories, 13 factories are not in operation and 17 not fully operated.
Table (11-10) Equipment-Supported Gover-norates
Governorate
Total Gharbia Daqahlia Qalyubia Giza
13 2 2 6 3 Vehicle 20 Tons
22 — — 15 7 Trailers
5 — — — 5 Dump-
ing Trucks
9 — — — 9 Pick-up Trucks
2 — — 1 1 Bull-dozers

161
Management of Solid Wastes
Table (11-11) Statement on the Current Situation of all Factories – Statement on Garbage Recycling in Governorates
Gover-norate Number
Management
Remarks Government Private
Cairo 15 -- 13 2
10 plants are privately- operated in Katamya and 15 May City. 3 more factories are oper-ated in Katamya through the private sector.
Work in 2 factories in Salam City is sus-pended due to their deteriorated technical
condition.
Giza 4 2 2 --
2 factories are operated by the private sector in Shobrament while 2 factories in Abu
Rawash are government- operated.
Qalyubia -- -- -- -- ----------- Alexan-
dria 3 -- 3 -- Private Sector-operated
Al Be-heira 3 1 -- 2
The two Damanhour and Kafr El Dawar plants are suspended. Edko Factory is func-tional with a one-year guarantee period and
run by the government sector.
Matrouh 1 -- -- 1 Suspended for the factory’s degraded techni-cal condition
Monofia 1 1 -- --
The factory is located in the City of Menouf and is operated within the jurisdiction of the
government sector
Gharbia 3 1 2 --
2 factories are operated in Dafra Village-Tanta by the private sector and one factory in Al Mahala El Kobra through the government
sector
Kafr El Sheikh 3 1 1 1
Kafr El Sheikh factory is dysfunctional, Beila Factory is privately operated while Sidi Salem Factory is run by the government sector with
a one-year guarantee period.
Demiatta 3 2 -- 1
Demiatta Factory is government-operated with a one-year guarantee period, however not fully operated. Ras El Bar Factory is not
operational.
Daqahlia 7 6 -- 1
Two Mansoura-based factories are not fully operational, and so is one factory in Beshla
Village – Meet Ghamr Precinct, another one in Belqas City and 2 factories in Aga Precinct.
All these factories are administered through the government sector while one factory in Al
Mataria City is already dysfunctional.
North Sinai 1 -- -- 1 The factory is located in Al Arish City and not
operational
Dysfunc-tional
Factories

Management of Solid Wastes
162
Governorate Number Management Dysfunctional
Factories Remarks
Government Private South Sinai 1 -- -- 1 The factory is located in Sharm El
Sheikh City. It was set ablaze but no prosecution decree has been
issued in this regard. The Ministry of Military Production was as-
signed by the governorate to con-duct a study to rehabilitate the
given factory, however the case is as is, awaiting investigation find-
ings. Port Said 1 -- 1 -- It is fully operated as part of pri-
vate sector activity. Ismailia 2 2 -- -- One factory not fully operational
and another dysfunctional. These factories are located on the Is-
mailia-Suez desert road. Suez 1 --- 1 -- Private sector-driven fully opera-
tional factory. Sharqia 3 1 1 1 Al Zakazik Factory is not fully
operational, Abu Kbeer Factory is run by the private sector however not fully operational, and Belbis
Factory is dysfunctional. Beni Suef 2 2 -- -- New Beni Suef and Samsta facto-
ries are government sector-operated however not fully opera-
tional. Menya 2 1 -- 1 Malawi Factory is government-
run however not fully operational. New Menya City Factory is not in
operation. Fayoum 1 -- -- 1 Fayyoum-located factory is dys-
functional. Assuit 1 1 -- -- Government-operated factory is
not fully functional. New Valley 1 1 -- -- Factory is located in Gharga City.
It is run by the government sector however not fully operational.
Sohag 1 1 -- -- Factory is not fully operational.
Qena 2 2 -- -- Qena City Factory is government-operated however not fully opera-tional. Nagaa Hamadi Factory is
functional with a one-year guaran-tee period.
Table (11-11) Statement on the Current Situation of all Factories – Statement on Garbage Recycling in Governorates

163
Management of Solid Wastes
Problems Related to Garbage-Recycling Factories and the Pro-duction of Organic Compost Can be Attributed to the Following Reasons:
1. Absence of sound management to oper-ate factories with high efficiency
2. Lack of trained labor 3. Periodic dysfunctions and shortage of
spare parts 4. Unstable electric currents in most plants 5. Low quality of organic compost produc-
tion of many factories due to multiple impurities such as glass
Final Disposal Sites There are three types of solid waste final disposal sites in Egypt: 1-Open Informal and Public Landfills
These are the locations for open and unsys-tematic disposal of wastes. They provide an environmentally unsound method that leads to spread of fires, reproduction of in-sects and rodents and contamination of ground water. It also impairs the health of dealers with land filling whether garbage
collectors (Zabaleen) or pickers. Further environmental conditions in dumpsites of local units and in cities are unfavorably met. 2-Government Public Landfills
These are more controlled places for waste disposal where vehicles are allowed in and out and wastes are promptly covered with sand and dust by placing them in layers well pressed and properly covered in at least 15 cm dust thickness. 3-Sanitary Dumpsites
These are land sites designated to health and environmentally safe waste disposal. They are designed and managed in compli-ance with engineering rules where wastes are spread in layers and adequately pressed and covered with inert substance for wastes to remain safely buried between layers of earth alongside due precautions whether by safe recovery or discharge of resulting gases or sound discharge or treatment of leachate so as to ward off pollution of wa-ter sources.
Table (11-11) Statement on the Current Situation of all Factories – Statement on Garbage Recycling in Governorates
Governorate Number Management Dysfunctional Factories Remarks
Government Private Aswan 2 -- 2 -- Aswan and Idfu Factories
were delivered to the Care Service Company to be operated under its super-vision however still not set in operation.
Red Sea 1 -- 1 -- Hurghada Factory is run by the private sector but not yet fully operational.
Luxor 1 -- 1 -- Its Factory is privately operated.
Total 66 25 28 13

Management of Solid Wastes
164
Table (11-12) shows standards applied in determining sanitary dumpsites.
52 sanitary dumpsites within the Repub-lic’s governorates had been identified as indicated in the following diagram Figure (11-3). A digital map had also been deliv-ered showing selected waste sanitary dumpsites for each governorate. Exclusion of agricul-
tural lands Remoteness from lakes’
beaches > 3km. Exclusion of tourist
areas Remoteness from
ground water wells > 1km.
Remoteness from resi-dential areas >1.5 km.
Remoteness from val-leys’ network > 1km.
Remoteness from sides of main roads > 1km.
Remoteness from ports and airports > 6kms.
Remoteness from sides of sub-roads > 250m.
Remoteness from bor-ders of natural reserva-
tions > 5kms. Remoteness from water-
way banks > 2kms. Remoteness from natu-
ral schisms > 1km. Remoteness from Nile River banks > 5kms.
Remoteness from hu-mid lands > 1km.
Remoteness from Coast-line > 3kms.
Table (11-12) Standards Taken into Considera-tion on Identifying Appropriate Places That Can
Be Utilized as Sanitary Dumpsites
Map (11-1) Selected Sanitary Dumpsites for Cairo Governorate
6
1 1 1
2
1
2
1
2 2
3
1 1
5
4
1
7
4
1
4
2
0
1
2
3
4
5
6
7
8
Assi
utLu
xor
Ism
ailia
Red
Sea
Beh
eira
Gui
zaD
aqah
liaS
uez
Sha
rqia
Fay
yium
Cai
roQ
alyu
bia
Mon
ofia
Men
yaB
eni S
uef
Por
t S
aid
Sou
th S
inai
Qen
aK
afr
El S
heik
hM
arsa
Soha
g
No.
of D
umps
ites
Figure (11-3) Sanitary Dumpsites Within the Re-public’s Governorates

165
Management of Solid Wastes
Agricultural Waste Based on Table (11-3), the quantity of agricultural waste is estimated at approximately 25-30 million tons annually as shown in Figure (11-4). Benefiting from such wastes in Egypt can be illustrated as follows:
Areas of Benefiting from Agricultural Waste in Egypt
25-30 Million Tons Annually
Others Organic Compost Food Production • Rice Straw Media Cultivation • Mushroom Production
Energy Production • Biogas • Thermal Gas
Unconventional animal feed • Urea Treatment • Ammonia Injection
Figure (11-4) Quantity of Agricultural Waste for 2005
0.51.2 1.5 1.4
4.5
3.2 3
6.9
5.03
0
1
2
3
4
5
6
7
8
tebe
ensh
e3ee
r3r
oosh
bang
arba
kaya
faw
akeh
hata
b ko
tn
hata
b do
ra
3oro
osh
khod
raw
at
Ric
e St
raw
tebn
kam
h
mas
asa
kasb
wastes types
mill
ion
ton

Management of Solid Wastes
166
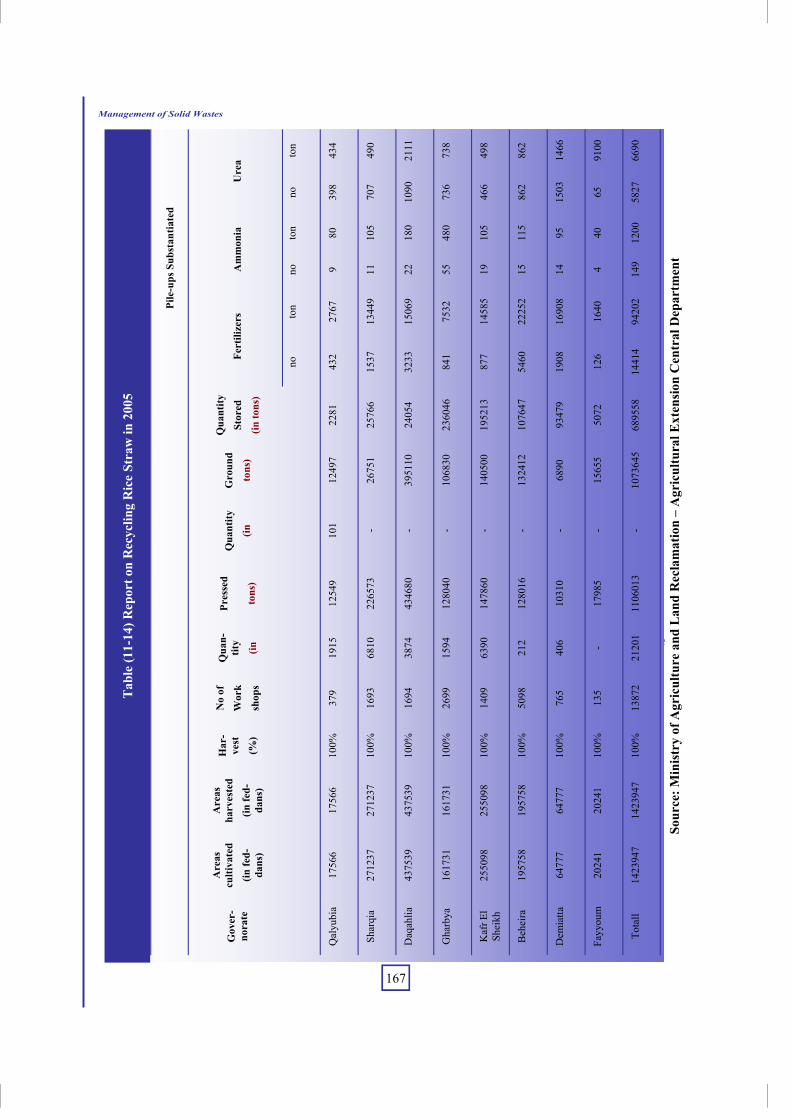
Among the most crucial problems in con-nection with agricultural waste is burning, particularly as regards rice straw which eventually yields massive and harmful air pollution. Figure (11-5) shows rice-cultivated areas in 2005 while Table (11-13) shows resulting straw quantities for the same year.
Table (11-14) indicates the distribution of quantities handled in each rice-producing governorate.
Stages of Recycling (Rice Straw)
Minced or non-pressed Straw Pressed Straw
Unconventional animal feed
Assembling Centers
Organic Compost
Mushroom Production
Biogas
Plants Unconventional animal feed
Rice Straw me-dia Cultivation
Thermal Gas Production
Organic Compost Ammonia
Injection
Total cultivated area 1.4 million tons
Total resulting straw quan-tity
3 million tons
Quantity pressed 1,106,012 tons
Quantity ground 1, 073, 645 tons
Quantity stored 689,558 tons
Fertilizer pile-ups 94202 tons
Ammonia pile-ups 1200 tons
Urea pile-ups 6690 tons
Table (11-13) Current Situation of Straw Quanti-ties Ensuing from Rice Straw Cultivation (2005)
Figure (11-5) Statement of Rice-Cultivated Areas in Governorates for 2005
17.566
271.237
437.539
161.731
255.098195.758
64.77720.241
050
100150200250300350400450500
Qal
yubi
a
Shar
qia
Daq
ahlia
Gha
rbia
Kaf
r El
She
ikh
Beh
eira
Dam
ietta
fayy
ium
1000
fedd
ans
167
Management of Solid Wastes
Problems of Agricultural Waste T
able
(11-
14) R
epor
t on
Rec
yclin
g R
ice
Stra
w in
200
5
Pile
-ups
Sub
stan
tiate
d
Ure
a A
mm
onia
Fe
rtili
zers
Q
uant
ity
Stor
ed
(in to
ns)
Gro
und
tons
)
Qua
ntity
(in
Pres
sed
tons
)
Qua
n-tit
y
(in
No
of
Wor
k
shop
s
Har
-ve
st
(%)
Are
as
harv
este
d (in
fed-
dans
)
Are
as
culti
vate
d (in
fed-
dans
)
Gov
er-
nora
te
ton
no
ton
no
ton
no
434
398
80
9 27
67
432
2281
12
497
101
1254
9 19
15
379
100%
17
566
17
566
Qal
yubi
a
490
707
105
11
1344
9 15
37
2576
6 26
751
- 22
6573
68
10
1693
10
0%
2712
37
2712
37
Shar
qia
2111
10
90
180
22
1506
9 32
33
2405
4 39
5110
-
4346
80
3874
16
94
100%
43
7539
43
7539
D
aqah
lia
738
736
480
55
7532
84
1 23
6046
10
6830
-
1280
40
1594
26
99
100%
16
1731
16
1731
G
harb
ya
498
466
105
19
1458
5 87
7 19
5213
14
0500
-
1478
60
6390
14
09
100%
25
5098
25
5098
K
afr E
l Sh
eikh
862
862
115
15
2225
2 54
60
1076
47
1324
12
- 12
8016
21
2 50
98
100%
19
5758
19
5758
B
ehei
ra
1466
15
03
95
14
1690
8 19
08
9347
9 68
90
- 10
310
406
765
100%
64
777
64
777
Dem
iatta
9100
65
40
4
1640
12
6 50
72
1565
5 -
1798
5 -
135
100%
20
241
20
241
Fayy
oum
6690
58
27
1200
14
9
9420
2
1441
4
6895
58
1073
645
-
1106
013
21
201
13
872
10
0%
1423
947
14
2394
7
Tota
ll
Sour
ce: M
inis
try
of A
gric
ultu
re a
nd L
and
Rec
lam
atio
n –
Agr
icul
tura
l Ext
ensio
n C
entr
al D
epar
tmen
t

Management of Solid Wastes
168
Map
(11-
2) A
gric
ultu
ral W
aste
at t
he P
reci
nct L
evel
(Ric
e St
raw
) Sha
rqyi
a G
over
nora
te

169
Management of Solid Wastes
Problems of Agricultural Waste Recycling
1. Urging farmer to speedily dispose of ag-ricultural waste to vacate and prepare lands for the cultivation of winter crops.
2. Lack of (compressors- grinders -tractors) in sufficient quantities during short time periods to handle agricultural waste in terms of compression, grinding and transport to areas for utilization.
3. Limited involvement of the private sec-tor and investors in agricultural waste recycling operations given high invest-ment cost of such processes.
4. Dispersed agricultural land possessions hinder the process of handling agricul-tural waste regarding compression.
Efforts of the Ministry of State for Environmental Affairs in Han-dling Agricultural Waste during 2005
1. Training good farmers who are well versed in agricultural waste and uncon-ventional animal feed recycling and their rehabilitation as a source of infor-mation and experience to forge as a model for other farmers to emulate. This can be achieved in cooperation with the Ministry of Agriculture.
2. Organizing extension classes for agricul-tural guides and small farmers concern-ing the transfer of agricultural wastes into organic compost or untraditional special animal feed.
3. Urea pile-ups had been substantiated.
4. Ammonia pile-ups had been substanti-ated.
5. Following up on processes of pressing, grinding and storing rice straw as well
as on the production of organic compost. In this respect.
a) The Armed Forces National Service Agency (Queen Service Corporation) took part in the processes of collecting, pressing, and transporting rice straw in the Sharqiya Governorate through 4 Precincts (Markaz): namely Belbis- Mashtoul El Souk-Menya El Qamh- Abu Hamad) and provided support in the form of supplying 140 rice straw automated compressors and 60 tractors.
b) Upgrading the operational efficiency of
294 rice straw compressors through the Automated Agriculture Sector at the Ministry of Agriculture and their distri-bution among Delta Governorates dur-ing the rice straw harvest season.
Picture (11-13) Rice Straw Pressing Operations
Picture (11-14) Rice Straw Press-ing Operations

Management of Solid Wastes
170
c) Operating (2) rice straw-made organic compost plants by the Arab Industriali-zation Authority in the Sharqyia Gov-ernorate in the two sites of (Al Qareen and Al Khattara) with an absorption capacity amounting to 150,000 tons of rice-straw/ factory for the production of 70,000 tons of organic compost for
each factory.
6. Supporting the establishment of (10) mushroom production sites in the Dak-halia Governorate.
7. Helping dedicated civil associations set up agricultural waste recycling centers besides the provision of technical assis-tance to this end.
8. Disseminating environmental awareness among farmers to the effect of prevent-ing the burning of rice straw and rather availing of it as a profitable income.
Future Plan 2007-2012
1. Evaluate village waste management al-ternatives
2. Take stock of the Egyptian experience in composting
3. Boost the establishment of integrated waste management systems applicable in urban regions in governorates.
4. Build standard sanitary dumpsites.
5. Implement pilot projects for solid waste management in villages.
6. Promote agricultural waste management projects and ensure their economic util-ity
7. Step up collection and transport opera-tions in governorates of priority
8. Establish stationing and moving inter-mediate facilities in some governments
9. Complete the implementation of the plan of removing historic accumulations from Greater Cairo
10.Dispose of remaining informal landfills within Greater Cairo districts
11.Expand waste recycling projects to maximize their benefit
12.Raise environmental awareness by way of holding training courses for environ-ment officials in different governorates and at the civil society level.
Picture (11-15) Rice Straw Pressing Operations
Picture (11-16) Organic Compost Factory

171
Management of Solid Wastes
References
(1) National Strategy for Integrated Management of Municipal Solid Waste 2000
(2) Baseline Document of Solid Waste System in Egypt 2001