1003(g) school improvement grant (sig) 2018-19 performance
TRANSCRIPT

1003(g) School Improvement Grant (SIG) 2018-19 Performance Management – Mid-Year Report
September 1, 2018 –January 31, 2019 (Non-Receivership Schools Only)
Name of School District Name of school School BEDS Code SIG Model/Cohort
Buffalo City Schools
Dr. Antonia Pantoja Community School of Academic Excellence - #18
140600010018 SIG: Model: Transformation
Cohort: 7
School Principal Grade
Configuration
High School Graduation Rate (If applicable, please provide the most recent
graduation rate data available.):
Enrollment
Name Date of Appointment PreK - 8 Not Applicable
Total enrollment: ELL %: 34 SWD%: 22
Aakta Patel October 27, 2016
District Person Responsible for Program Oversight and Report
Validation
Implementation Status of the School as Rated by the District
Brief Analysis/Report Out of Overall Implementation Status
Name and Contact Information (Red/Yellow/Green) Dr. Antonia Pantoja #18 has made positive strides with the implementation of our initiatives as aligned to our DTSDE Report, SIG application and needs assessment teacher survey. We have ongoing support from the Office of School Leadership in a variety of ways to support teachers/administrators in order to increase student achievement. The implementation of the school-wide mathematics and ELA plan is carefully monitored, reviewed and modified when necessary. Additionally, we have a solid framework for addressing and meeting our students’ social emotional needs. Lastly, there has been on- going job embedded professional development occurring on a regular basis, including weekends.
Darlene Jesonowski [email protected]
Key Green Expected results for this phase of the project are fully met,
work is on budget, and the school is fully implementing this strategy with impact.
Yellow Some barriers to implementation / outcomes / spending exist; with adaptation/correction school will be able to achieve desired results.
Red Major barriers to implementation / outcomes / spending encountered; results are at-risk of not being realized; major strategy adjustment is required.

Dr. Antonia Pantoja – Community School of Academic Excellence - 2
Attention –This document serves as the Progress Review Report for schools that are not Persistently Struggling or Struggling schools but are receiving School Improvement Grant (SIG) funds. The document is intended to be completed by the Superintendents of Schools and/or their designee and submitted electronically to [email protected].
Directions - District and school staff should respond to the Analysis/Report Out sections of this document by both analyzing and summarizing the implementation of the key strategies of the 2018-19 SIG plan this year to date and the impact of those key strategies on student learning outcomes.
1. METRICS
Academic Achievement - Please complete the prompts/questions below. If necessary, attach separate charts, tables, and/or graphs that summarize on-going and
formative data used to address student needs and determine progress toward student achievement goals.
Key Questions/Prompts Analysis / Report Out
Describe performance trends in student assessment data in core content areas (e.g., student sub-groups, grade levels, subjects, classrooms, etc.).
Dr. Antonia Pantoja – Community School of Academic Excellence - 3
Academic Achievement - Please complete the prompts/questions below. If necessary, attach separate charts, tables, and/or graphs that summarize on-going and
formative data used to address student needs and determine progress toward student achievement goals.

Dr. Antonia Pantoja – Community School of Academic Excellence - 4
Academic Achievement - Please complete the prompts/questions below. If necessary, attach separate charts, tables, and/or graphs that summarize on-going and
formative data used to address student needs and determine progress toward student achievement goals.
NYSESLAT 2016-2017
Number of students Entering - 16 Emerging – 28 Transitioning – 56 Expanding – 87 Commanding - 14
NYSESLAT 2017-2018
Number of students Entering - 4 Emerging – 24 Transitioning – 51 Expanding – 90 Commanding - 20
New York State (NYS) Gr 3-8 Assessment Data The comparative data from 2016 – 2017 school NYS assessment and New York State English as a Second Language Achievement Test (NYSESLAT) to 2017 – 2018 school NYS assessment and NYSESLAT have yielded the following: In ELA, grades 3-8 increased proficiency rates from 13% to 15%
1. 3rd grade decreased from 20% to 15% proficient 2. 4th grade increased from 13% to 23% proficient 3. 5th grade decreased from 12% to 5% proficient 4. 6th grade increased from 11% to 22% proficient 5. 7th grade decreased from 16% to 6% proficient 6. 8th grade increased from 8% to 15% proficient

Dr. Antonia Pantoja – Community School of Academic Excellence - 5
Academic Achievement - Please complete the prompts/questions below. If necessary, attach separate charts, tables, and/or graphs that summarize on-going and
formative data used to address student needs and determine progress toward student achievement goals.
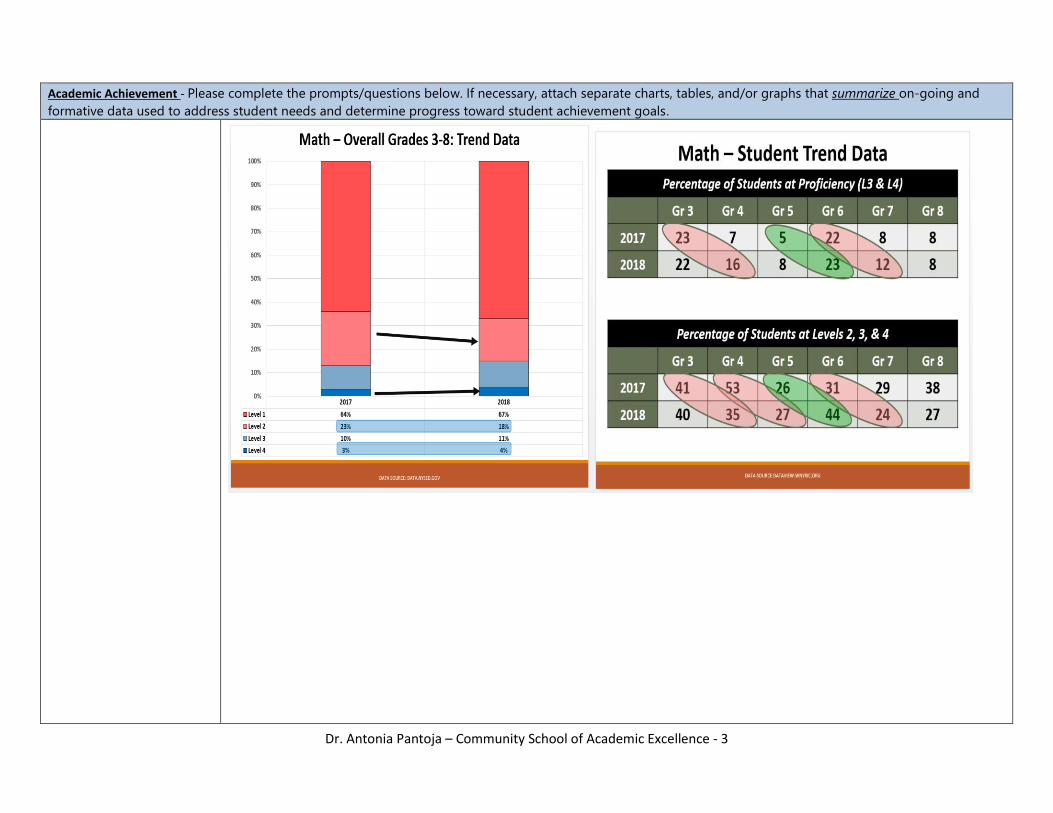
In Mathematics, grades 3-8 increased proficiency rates from 13% to 15%
1. 3rd grade decreased from 23% to 22% proficient 2. 4th grade increased from 7% to 16% proficient 3. 5th grade increased from 5% to 8% proficient 4. 6th grade increased from 22% to 23% proficient 5. 7th grade increased from 8% to 12% proficient 6. 8th grade remained the same at 8% proficient
Subgroup: Limited English Proficient (LEP) – Proficiency rates in grades 3 - 8
1. Tested student population proficiency increased from 2% to 3% proficient in ELA from 2017 to 2018 2. Tested student population proficiency decreased from 8% to 5% proficient in mathematics from 2017 to 2018
Subgroup: Students with Disabilities (SWD) – Proficiency rates in grades 3 - 8
1. ELA data: 2017 and 2018 remained the same at 1% proficient 2. Math data: proficiency increased from 1% in 2017 to 4% in 2018
How do these data/trends suggest the need for specific strategy adjustment or intervention to ensure targets will be met? Please identify specific school actions to be taken.
BPS 18 Data: Based on the data above, the following strategy adjustments/interventions have been implemented: ELA support:
Literacy coaching has been provided to teachers. This has made a shift in grade level meetings and discussions. Teachers, during grade levels, focus on a four-week cycle. Week 1 – Lesson Tuning, Week 2 – Student work (using targeted
student’s papers), Week 3 – Data Driven Instruction (DDI), Week 4 – Monitor and adjust Response to Intervention (RtI) groups. Targeted students were chosen using NYS Assessment and DIBELS data. Teachers chose five high level 2 students and three high level 1 students to focus on during the grade level meetings. They discuss student work and trends that are visible on student work of the identified 8 students, then discussions open to other trends visible within the classroom.
Grade level meeting work is used to inform instruction and create action plans that are used during either core or RtI time during the school day.
The Reading teacher pulls out the most intensive students in grades 1-7 in small groups. Focus has been on phonics and phonemic awareness instruction using the Direct Instruction (DI) program for grades 1-6 and with Lexia support for grade 7.
Teachers continue to utilize the District question stems (oral and written from previous NYS assessments) Coaches and Administration continue to assist teachers in creating their own higher order questions for instruction during RtI
instructional periods. Creating a common language for answering 2-point and 4-point, using the strategy RACE and RADD from grades K – 8 was
implemented in a building wide writing plan.
Monthly teacher and student surveys are taken to ensure that the writing plan can be modified to meet the needs of the

Dr. Antonia Pantoja – Community School of Academic Excellence - 6
Academic Achievement - Please complete the prompts/questions below. If necessary, attach separate charts, tables, and/or graphs that summarize on-going and
formative data used to address student needs and determine progress toward student achievement goals.
students. RtI groupings are based on student skills using data, utilizing a singular source of data – DIBELS (DTSDE, Tenet 2, 2018), groups are
monitored and adjusted every four cycles. Math support:
Math coaching has been provided to teachers. This has made a shift in grade level meetings and discussions. Teachers, during grade levels, focus on a four-week cycle. Week 1 – Lesson Tuning, Week 2 – Student work (using targeted
student’s papers), Week 3 – Data Driven Instruction (DDI), Week 4 – Monitor and adjust Response to Intervention (RtI) groups. Targeted students were chosen using NYS Assessment and DIBELS data. Teachers chose five high level 2 students and three high level 1 students to focus on during the grade level meetings. They discuss student work and trends that are visible on student work of the identified 8 students, then discussions open to other trends visible within the classroom.
Grade level meeting work is used to inform instruction and create action plans that are used during either core or RtI time during the school day.
Creating a common language for answering 2-point and 3-point, using the strategy RRDW and CUBE from grades K – 8 was implemented in a building wide action plan.
Monthly teacher and student surveys are taken to ensure that the writing plan can be modified to meet the needs of the students. Math coaching has been provided to teachers to backwards map modules to ensure all skills and standards will be taught prior to NYS
Assessments. RtI mathematics
Dedicated block of 30 minutes every day grades K - 6 Strategies RtI groupings are based on student skills using data, using results from – K-4 STAR Math and 5-8 easycbm.com. Teachers are
also using standards checklists to monitor and adjust groups every four cycles (DTSDE, Tenet 2, 2018) RtI schedule this year includes Talk Tuesdays. This is to address the weakness of students being able to work through multiple step problems where they need to explain their thinking.
In ELA, teachers present text, do a shared inquiry to talk about the text, and students orally respond and explain their thinking.
In Math, teachers present a number story or problem where students mentally solve and orally respond to explain their thinking.
Multiple choice questions were introduced into talk Tuesdays in the form of a four-corner activity. On the other days, students work through four learning areas:
ELA RtI Areas (60 Minutes per day) Math RtI Areas (30 Minutes per day)
Teacher Led Teacher Led
Fluency Fluency
Writing Hands-on math play with manipulatives
Computer Computer

Dr. Antonia Pantoja – Community School of Academic Excellence - 7
Academic Achievement - Please complete the prompts/questions below. If necessary, attach separate charts, tables, and/or graphs that summarize on-going and
formative data used to address student needs and determine progress toward student achievement goals.
Next Steps:
Math and Literacy Coaches continue to
Model lessons for teachers Backward plan with teachers to ensure that skills will be taught prior to the State Assessment Provide differentiated coaching support sessions to individual and groups of teachers Provide professional development via one-on-one coaching sessions to new teachers
Work with teachers to address targeted needs of building Continue vertical grade level meetings that focus on instruction, student work, RtI cycle, and data.
Continue Literacy and math coaching sessions with teachers. Continue 4- week RtI checkpoints at week 12, 16, 20, 24, 28, 32, and 36 to monitor and adjust ELA RtI groups and Math RtI standards
and focus skills.
Monitor the implementation of a single source of data for RtI grouping. Continue to develop and use a data collection tool to monitor student progress throughout the school year for teachers (DTSDE,
Tenets 2 and 3). NYSESLAT Data: Based on the data above, the following strategy adjustments/interventions have been implemented:
ENL teachers schedules continue to reflect maximum time with Limited English Proficient (LEP) students One-hour pull out for entering and emerging – implementation of IRLA (Independent Reading Level Assessment) continues
(Grades K-6), 40 minutes for seventh grade through eighth grade. One-hour push in for emerging, entering, transitioning, expanding, commanding, and Formerly Limited English Proficient
(FLEP) students (Grades K-6), 40 minutes for seventh grade through eighth grade. ENL teachers attend weekly grade level meetings with the grade level they are assigned. ENL teachers have a designated RtI grade level meeting every four weeks.
Next Steps:
Continuation of 30 minutes 1x/week on “E” day 9:30 - 10:00 ENL teachers meet to discuss IRLA data and implementation. Continuation of Quarterly Reports
Report cards sent home by the ENL teacher regarding student progress that is aligned to the NYSESLAT standards. Continue to monitor one-hour pull out sessions every 4 weeks at the RtI checkpoint grade level meetings.
Continue to monitor IRLA Pace Report for the following: Students Power Goals. Students’ progressions through the reading levels.
Dr. Antonia Pantoja – Community School of Academic Excellence - 8
Academic Achievement - Please complete the prompts/questions below. If necessary, attach separate charts, tables, and/or graphs that summarize on-going and
formative data used to address student needs and determine progress toward student achievement goals.
Professional Development: Continue to support teachers in the implementation of the following as requested:
Step-Up to Writing (SUTW) strategies with a focus on two-column notes and color-coding will continue to occur and be monitored within the classroom.
Higher Order Questioning will be supported. Number talks and Math Talk PD training and classroom modeling will continue to be offered. ZSpace training for new computer interactive computer lab.
Common planning time: Teachers are given the opportunity to meet by grade level once per cycle.
Time is spent planning lessons, differentiating daily lessons and activities, scaffolding instruction, creating higher order
questions, and creating exit tickets and assessments using eDoctrina.
Coaches provide support as needed throughout the planning meetings. Vendors/partners: WestEd
Math Consultant support: works monthly with math coach and grades 1-8 math teachers to unit plan, lesson plan, and provide professional development on word problems.
Leadership Coaching: to engage in on-site leadership coaching with Math and Literacy coaches as well as the Leadership Team
Leadership coaching is provided to the school on goals, strategies and actions. Notably, Ms. Patel developed and continues to use a system of providing immediate feedback on teacher instruction with a customized SmartSheet template for her informal coaching visits. This tool enables the principal to directly and immediately give feedback to teachers, to serve as reminder to include specific, critical examples from teaching practices, and to provide meaningful suggestions on how to improve, to align the feedback to school priorities, and to facilitate expeditious support from the Literacy and Math coaches for follow up with targeted skill support.
WestEd Protocols selected to use with staff when working at grade level meetings and coaching sessions. These protocols allow for opportunities to facilitate instructional change through group analysis and collaboration around planning a lesson, teaching and observing it, and analyzing the teaching and learning that took place during it. The purpose of the protocols is to engage team members in a cycle of instructional inquiry designed to demonstrably improve teaching and student learning. WestEd's VITAL Collaboration protocols enable our coaches to lead a structured conversation that creates opportunities for teachers to collectively improve their teaching one session at a time. The inclusion of norms of collaboration at these meetings has also served to increase the positive norms that facilitate productive dialogue.
To facilitate training, support and coaching for the principal, assistant principals, and/or leadership team members with a focus on developing capacity to sustain improvement efforts.
Leadership involves both technical and adaptive challenges. Each school may seek to implement similar solutions (curriculum, instructional practices, assessments, professional development, etc.), but realizing the vision of those solutions in each school involves successfully navigating the adaptive challenges by attending to the values, beliefs and norms within the school. Through coaching conversations, we have routinely explored these facets of our implementation efforts, including through discussions around:
Continuing to use evidence-based strategies

Dr. Antonia Pantoja – Community School of Academic Excellence - 9
Academic Achievement - Please complete the prompts/questions below. If necessary, attach separate charts, tables, and/or graphs that summarize on-going and
formative data used to address student needs and determine progress toward student achievement goals.
Strengthening and expanding leadership Engaging critical stakeholders Mapping out activities in stages
Other reflections on the work with WestEd:
Teacher mathematics professional development on unit and lesson planning has begun to yield collaborative conversations regarding
implementation of Math modules with fidelity, expectations of student work and rigor throughout the grades.
Mathematics professional development has encompassed teacher's ability to choose where they would like support, instructionally.
This strategy has yielded an open communication between coach, WestEd partner and teachers in discussing lesson planning.

Dr. Antonia Pantoja – Community School of Academic Excellence - 10
Student Attendance - Please complete the prompts/questions below.
2018-19 Baseline (%) 2018-19 Target Year to Date
Average Daily Student Attendance Rate (%)
90.9% 93.8% 94.11%
Key Questions/Prompts Analysis / Report Out
Describe patterns of student attendance data (e.g., late/miss first period, chronic absenteeism among certain students, grade levels, etc.).
Student attendance by grade level trend data. Overall, 94.11% average daily attendance as of 01.02.19 PreK: 93.93% 3rd: 95.76% 7th: 92.71% Kindergarten: 94.72% 4th: 94.53% 8th: 93.10% 1st: 93.21% 5th: 92.93% 2nd: 96.85% 6th: 94.79%
Year to date-grade level attendance concerns (%): Although we are currently achieving our 2018-2019 target, it is important for us to recognize that there are areas we can improve on to increase attendance rates. As we analyzed the data, we noticed that our trend data suggests a need to focus on 1st and 7th grade student attendance to increase student achievement. Chronic Attendance issues: We have 58 students on the chronic absentee list. There are 18 kids in Check-In Check-Out as of 12.13.18 for attendance issues. The other 40 children are being addressed in Social Academic Intervention Groups (SAIG). Below is the breakdown for the school by attendance category: Sat (Satisfactory attendance 0-4.99%, Risk (at risk) 5 – 9.99%, Chron (Chronic absences) - 10 - 19.99%, Sev (Severe absences) 20% or more.
Note: Students move from category to category based on average daily attendance rates.
How do these data/patterns suggest the need for specific strategy adjustment or intervention to ensure targets will be met? Please identify
To support our students that are chronically absent, and to incentivize students to come to school, the following occurs within the building:
1. Phone calls Classroom teachers call home to check in on students Support staff calls home of targeted at-risk students that have been identified by the Attendance Teacher

Dr. Antonia Pantoja – Community School of Academic Excellence - 11
Student Attendance - Please complete the prompts/questions below.
specific school actions to be taken.
Parent facilitator will call home to identified parents by the Attendance teacher 2. Home visits are conducted by
Attendance teacher Social Worker
Family Support Specialist- Say Yes 3. Letters Home
Attendance teacher sends them based on chronic absences. There is a mass mailing for 58 students going out 01.02.19.
4. Incentive program for students who are on the chronic list. Monthly prizes will be given to the students with the most improved attendance rates.
5. Perfect attendance Effective November 2018, homerooms with perfect attendance earn various prizes
Effective second marking period, students with perfect attendance earn certificates every marking period
6. Attendance Focus Groups (members include) Attendance teacher
Guidance Counselor Family Support Specialist- Say Yes
Parent Facilitator 7. Multi-Tiered Systems of Support for Behavior (MTSS-B)
School-wide incentives, booster assembly Monthly student recognition Snow Cones

Dr. Antonia Pantoja – Community School of Academic Excellence - 12
Teacher Attendance - Please complete the prompts/questions below.
2018-19 Baseline (%) 2018-19 Target Year to Date
Average Daily Teacher Attendance Rate (%)
92.6% 89.2% 90.17%
Key Questions/Prompts Analysis / Report Out
Describe patterns of teacher attendance data (e.g., long-term, excused vs. unexcused, chronic/patterned absenteeism among certain teachers, etc.).
2018 - 2019 school year teacher data: 1. Total absences - 372 (Does not include Board Business, Union, Professional Development (PD), CSE coverage, Exam admin or
suspension hearings) 2. Long term leave- 3 teachers
Grade 2 ENL teacher – return date 01.02.19 - vacancy with rotating substitutes from September to January Art teacher – Early November with no return date noted as of 01.02.19
7/8 Science teacher – Late November with rotating substitutes until 01.02.19 How do these data/patterns suggest the need for specific strategy adjustment or intervention to ensure targets will be met? Please identify specific school actions to be taken.
To help increase teacher attendance, the following will be implemented: 1. Administration will work with Human Resources and English as New Language Director for staffing purposes
Staffing positions have been filled as of 01.02.19 Art position is awaiting documentation prior to filling with a temporary position - attempting to procure a permanent
substitute for continuity 2. Principal parking spot winner
Will be awarded multiple times in the winter 3. Incentive Awards
Will be given every few months based on specific criteria 4. Certificates
Will be given at every meeting beginning in February 5. Gift Cards
Will be given every other month based on specific criteria

Dr. Antonia Pantoja – Community School of Academic Excellence - 13
Office Discipline Referrals – Number of Office Discipline Referrals (ODRs). The total number of Office Discipline Referrals for any reasons that disrupt the educational process. This data should be reported here as total number for the school year to date.
2018-19 Baseline (#) 2018-19 Target Year to Date
Office Discipline Referrals (#)
832 1,111 87
Key Questions/Prompts Analysis / Report Out
Describe patterns of office discipline referrals (e.g., period, location, classroom, grade level, repeat offenders, etc.).
Student Data: 100% of student population Data Start: 09.06.18 Data End: 01.02.19 Data compiled from Infinite Campus / Data Dashboard There are 87 ODRs in Data Dashboard as of 01.02.19 1.Location of ODRs:
Classroom - 62 Cafeteria - 3 Gym – 8 Hallway - 12 Bus - 1 On School - 2 Other - 2 Bus Loading - 1
2. Days of the week: Monday - 15 Tuesday - 13 Wednesday - 21 Thursday - 21 Friday - 21
3. Top 3 ODRs by time: 1. 2:00-2:30 (26)
2. 3:00 - 3:30 (18) 3. 1:00- 1:30 (11)
4. ODRs by grade: K - 1 1st - 0 2nd - 3 3rd - 0 4th -2 5th - 28 (There are two 12:1:1 classrooms in this grade level)

Dr. Antonia Pantoja – Community School of Academic Excellence - 14
Office Discipline Referrals – Number of Office Discipline Referrals (ODRs). The total number of Office Discipline Referrals for any reasons that disrupt the educational process. This data should be reported here as total number for the school year to date.
6th - 15 7th - 21 8th - 21
5. Top 3 ODRs by offense type: 1. Fighting - 24 2. Verbal or Physical Threat – 12 3. Disrespectful behavior - 11
Suspensions- 49 total (from Data Dashboard)
*5 of which led to long term suspensions: Subgroups - 3 general education, 2 special education
*44 of which led to short term suspensions: Subgroups – 12 general education, 32 special education By grade level for short term suspension:
5th grade - 12 6th grade – 5 7th grade - 4 8th grade - 8
By grade level for long term suspension: 5th - 1 8th - 1
Infinite Campus Data: In lieu of parent meetings - 29
Phone Calls to the Office tracked: October (22 school days) - 208 November (18 school days) - 232 December (15 school days) - 204
How do these data/patterns suggest the need for specific strategy adjustment or intervention to ensure targets will be met? Please identify specific school actions to be taken.
Next Steps: In order to address the two highest areas of incidents, the classrooms and hallways, the following plans have been put into place:
1) Classroom a) Continued training for Aides and Assistants with School Specialists from the District, School Social Worker, and
Administration. Training consists of developing Assistant’s and Aide’s skillsets in handling classroom behaviors through classroom management strategies and Behavior Intervention Program (BIP) strategies. Behavior Data is used to guide professional development needed to support Aides and Assistants.
b) Training provided to all encore teachers on BIP implementation and effective classroom management strategies for dealing with challenging behaviors. Student Support Team and Administration is working with encore teachers to provide support through classroom coaching on challenging behaviors.
c) MTSS-B team is sharing monthly data on patterns of behavior at meetings, in meeting minutes, and in the weekly bulletin. In addition, MTSS-B shares behavior data out at monthly faculty meeting regarding ODR data, suspension data, and intervention data put into place. Following each presentation is a discussion with feedback to target data points focused

Dr. Antonia Pantoja – Community School of Academic Excellence - 15
Office Discipline Referrals – Number of Office Discipline Referrals (ODRs). The total number of Office Discipline Referrals for any reasons that disrupt the educational process. This data should be reported here as total number for the school year to date.
on. d) In addition, goals are being developed in the weekly bulletin to target specific behaviors that had a high frequency during
the week (ex: elopement) i) A list of strategies/interventions to try for the targeted behavior are included
ii) Data is then shared for the week to assess if goal was met iii) This allows for transparency of data between MTSS-B team and staff regarding effectiveness of interventions.
e) Development and implementation of the Alternative to Suspension Mindfulness Room. This program is used as part of the progressive discipline model the school uses. The restorative approach focuses on repairing harm caused by student and serving time in detention. This alternative to suspension allows students to receive a consequence without missing school days.
f) Restorative Conversations (at least 60 meetings held so far this school) i) Focuses on repairing harm and returning students to class so they do not miss extended instruction time.
Conversations facilitates self – awareness and empathy in students. Also gives students an opportunity to repair harm caused and rebuild relationships. This intervention focuses on decreasing recidivism rate of repeat offenders.
ii) Restorative conversations are held by Student Support Team and occur between students as well as students and teachers as necessary.
iii) Follow up email sent to all adults involved in situation to inform them on how situation was addressed and next steps that were agreed to during restorative conversation.
g) Special Education Coaches, school specialist, and state representatives continue to provide support to teachers on classroom management strategies, support in classroom for implementation of BIPS and IEPS and PD around target areas/skills identified for improvement.
h) Continued Behavior grade levels for 7th and 8th grade teachers every E/F day for both general education teachers and special education teachers to address individual students with high number of ODRs/Suspensions and implement child specific plan to address. Also, parent meetings held with identified students to engage parent in child’s success at school.
i) Office of School Climate coaches working with grade levels to identify and implement behavior strategies to address areas of concern by grade level at PD before school (ex: developing a calming area in room, developing incentive monthly for 7th and 8th graders, etc.). The goal being to increase classroom management strategies in the classroom.
2) Hallway/Transitions a) Continued use of hallway monitors in hall during high need times to assist. Administration presence during transitions on
3rd floor for middle school students.
b) Teachers tracking bathroom use with a sign out sheet to limit number of students using bathroom to avoid excessive number of students in the hall.
c) New rules implemented: no bathroom use during first 5 minutes of class, last 5 minutes of class, or last period of the day. d) Modified transition plan after lunch for 7th and 8th graders to eliminate issues with students not transitioning to class
appropriately. e) Continued use of staff surveys to monitor new interventions implemented.

Dr. Antonia Pantoja – Community School of Academic Excellence - 16
Office Discipline Referrals – Number of Office Discipline Referrals (ODRs). The total number of Office Discipline Referrals for any reasons that disrupt the educational process. This data should be reported here as total number for the school year to date.
Training and intervention that has been implemented based on data trends: Training includes:
Restorative Practice training
Trauma informed care training
BIP and SDI implementation and tracking
Classroom management strategies/De-escalation strategies
Active Supervision Training Other strategies of intervention include:
Re-entry plans with Assistant Principal, Support Staff member and Teacher (if possible).
Meetings with outside providers and families to assist with our students who are receiving Tier 3 levels of support.
Problem Solving Meetings with members of the student support team, administration, and community partners Best-Self and/or Say Yes Program.
Continued monthly MTSS-B Team meetings to analyze behavior data and implement necessary interventions.
Continued collaboration with community partners: Lawyers for Learning, Best-Self, Paws for Love Therapy Dog Program, Backpack program, Say Yes.
Teacher created plans to improve student behavior: o Continue to develop, implement, modify, and adjust plans for middle school students during behavior grade levels to
increase success o Ongoing data analysis of behavior interventions at monthly MTSS-B team meetings, SBMT meetings, Faculty meetings, and
SLT meetings including data from surveys to ensure that multiple perspectives have been used to assess effectiveness of interventions.
Dr. Antonia Pantoja – Community School of Academic Excellence - 17
Extended Learning Time – Average Extended Learning Time (ELT). Please respond to the prompts below with respect to extended learning opportunities offered to all students throughout the course of the school year.
Key Questions/Prompts Analysis / Report Out
Describe how ELT is configured at this school: in terms of days of the week and number of hours per week. What programs are provided to meet students’ needs? How is ELT staffed? How does the school oversee the ELT programs to ensure that academic programs are rigorous, aligned to the Common Core Learning Standards, and are meeting students’ needs?
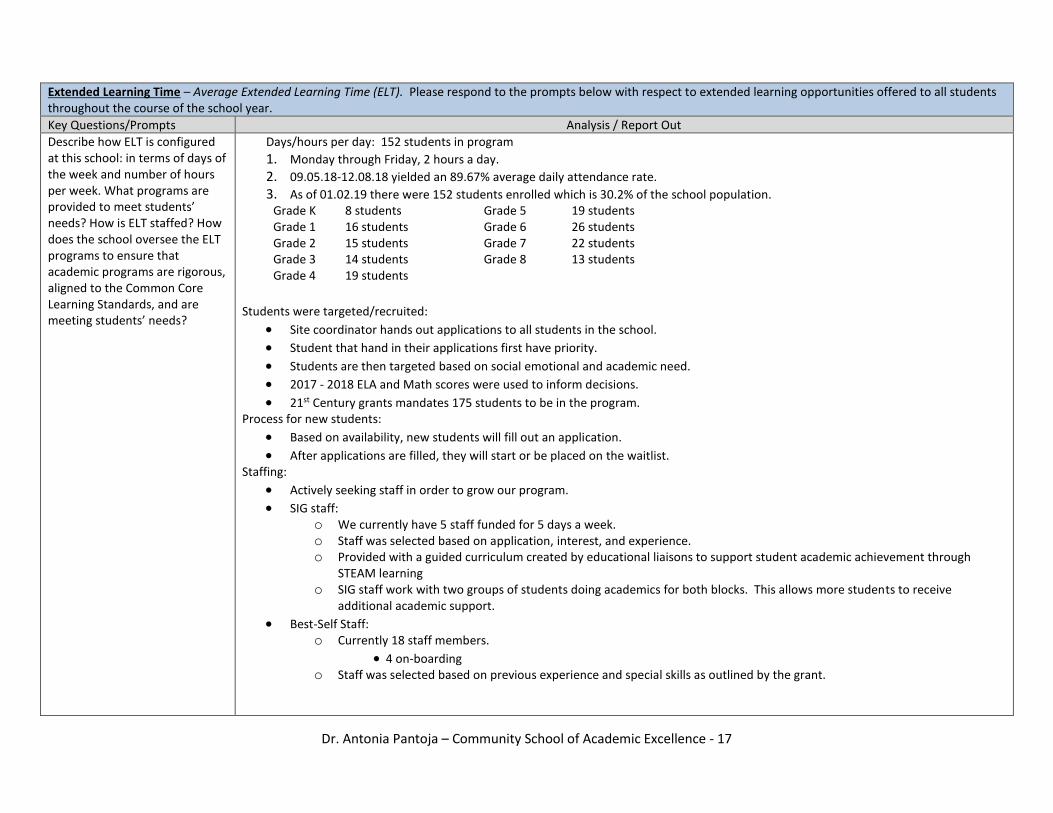
Days/hours per day: 152 students in program
1. Monday through Friday, 2 hours a day. 2. 09.05.18-12.08.18 yielded an 89.67% average daily attendance rate. 3. As of 01.02.19 there were 152 students enrolled which is 30.2% of the school population.
Grade K 8 students Grade 5 19 students Grade 1 16 students Grade 6 26 students Grade 2 15 students Grade 7 22 students Grade 3 14 students Grade 8 13 students Grade 4 19 students
Students were targeted/recruited:
Site coordinator hands out applications to all students in the school. Student that hand in their applications first have priority.
Students are then targeted based on social emotional and academic need. 2017 - 2018 ELA and Math scores were used to inform decisions. 21st Century grants mandates 175 students to be in the program.
Process for new students:
Based on availability, new students will fill out an application.
After applications are filled, they will start or be placed on the waitlist. Staffing:
Actively seeking staff in order to grow our program. SIG staff:
o We currently have 5 staff funded for 5 days a week. o Staff was selected based on application, interest, and experience. o Provided with a guided curriculum created by educational liaisons to support student academic achievement through
STEAM learning o SIG staff work with two groups of students doing academics for both blocks. This allows more students to receive
additional academic support. Best-Self Staff:
o Currently 18 staff members. 4 on-boarding
o Staff was selected based on previous experience and special skills as outlined by the grant.

Dr. Antonia Pantoja – Community School of Academic Excellence - 18
Extended Learning Time – Average Extended Learning Time (ELT). Please respond to the prompts below with respect to extended learning opportunities offered to all students throughout the course of the school year.
Professional Development for Best-Self Staff
Based on data points (specifically reviewing student write-ups for after school program), professional development was created, and staff were trained in monitoring and deescalating student behavior. Staff have received training in trauma informed care. A continued Professional Development Plan is being created for staff.
Academic Programs: 1. SIG teacher's implementation of monthly STEAM curriculum 2. Engineering for kids - Science, Technology, Engineering, and Mathematics (STEM) based 3. MyOn an online library to increase reading fluency/comprehension skills 4. Lexia – ELA based 5. Prodigy an online Math video game to support math problems 6. Lawyers for Learning tutoring and mentoring services
Curriculum Components 1) Academic Curriculum -Educational Liaisons from Buffalo Public Schools partnered with Best-Self to create monthly lesson plans
Curriculum consists of STEAM incorporated lesson plans focusing on interactive, hands-on learning experiences that are linked to Math and ELA standards (ex: making sugar skills, forming spider webs, service projects, and dioramas).
SIG teachers teach the curriculum with the support of Best-Self staff in each room to help support program.
Bulletin board outside main office displays STEAM activities and student work for school, staff, and community members to see.
2) Social–Emotional Curriculum
Social-Emotional Coordinator ensures Devereux Students Strengths Assessment (DESSA) rating scales are completed for at-risk students and that students with severe scores are put into a social emotional group during after school program.
Mindfulness Room developed and implemented as an alternative consequence to service our afterschool students that demonstrate negative behaviors. Social workers work with student for the first half hour to address student behavior and repair harm. Remaining time is spent completing school work.
Enrichment Programs:
1. STEAM Based Programming (Escape Room/Spy Kids investigation, Creative Building, Coding programs, Junior Geologist, Osmo) 2. Modern Charm School 3. Social Emotional Learning (Mind Up) 4. Anti-Bullying Workshops 5. F-Bites (Culinary skills) 6. Empower Girls 7. Young Audiences

Dr. Antonia Pantoja – Community School of Academic Excellence - 19
Extended Learning Time – Average Extended Learning Time (ELT). Please respond to the prompts below with respect to extended learning opportunities offered to all students throughout the course of the school year.
8. Photography 9. Physical Activities (Co-op games, basketball, Soccer for Success, Yoga) 10. Dance and Music workshops (African Drumming) 11. Arts and Crafts (Sew What, Albright internship) 12. Technology (iPads) 13. Girl Scouts
Schedule:
Dinner: 3:40 p.m. - 4:15 p. m. Block 1: 4:20 p.m. - 5:00 p.m. Transition 5:00 p.m. - 5:05 p.m.
Block 2: 5:05 p.m. - 5:55 p.m. Dismissal: 5:55 p.m. - 6:05 p.m.
Partner/Community Based Organization (CBO):
Best Self Behavioral Health is providing some of the academic and enrichment programs. Young Audiences is providing students the opportunity for dance and other performing arts. EPIC is providing educational and prize bags as well as, social and emotional life skills to our students and parents.

Dr. Antonia Pantoja – Community School of Academic Excellence - 20
Extended Learning Time – Average Extended Learning Time (ELT). Please respond to the prompts below with respect to extended learning opportunities offered to all students throughout the course of the school year.
Describe the type, nature and frequency of assessments that measure the impact of ELT, as well as trends in progress noted through analysis of data.
After School Students ELA DBA#1 K - 8 data below:
Dr. Antonia Pantoja – Community School of Academic Excellence - 21
Extended Learning Time – Average Extended Learning Time (ELT). Please respond to the prompts below with respect to extended learning opportunities offered to all students throughout the course of the school year.
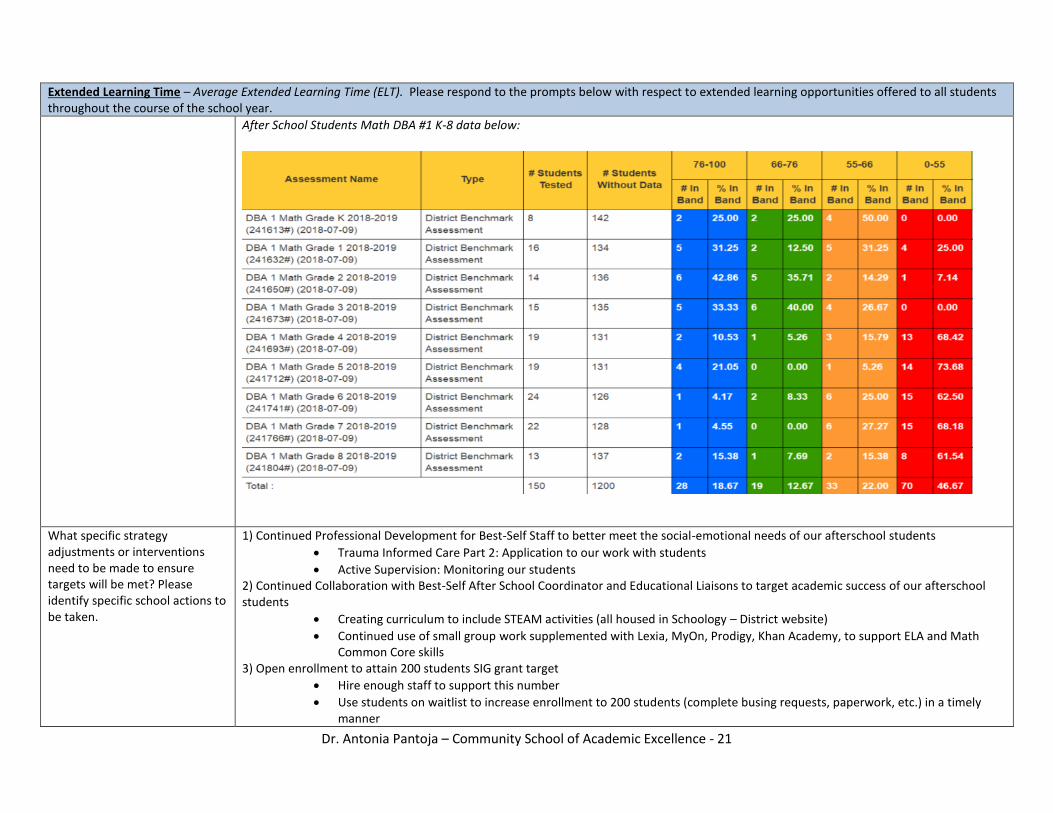
After School Students Math DBA #1 K-8 data below:
What specific strategy adjustments or interventions need to be made to ensure targets will be met? Please identify specific school actions to be taken.
1) Continued Professional Development for Best-Self Staff to better meet the social-emotional needs of our afterschool students
Trauma Informed Care Part 2: Application to our work with students
Active Supervision: Monitoring our students 2) Continued Collaboration with Best-Self After School Coordinator and Educational Liaisons to target academic success of our afterschool students
Creating curriculum to include STEAM activities (all housed in Schoology – District website)
Continued use of small group work supplemented with Lexia, MyOn, Prodigy, Khan Academy, to support ELA and Math Common Core skills
3) Open enrollment to attain 200 students SIG grant target
Hire enough staff to support this number
Use students on waitlist to increase enrollment to 200 students (complete busing requests, paperwork, etc.) in a timely manner

Dr. Antonia Pantoja – Community School of Academic Excellence - 22
2. PROJECT PLAN IMPLEMENTATION Key Strategies - Identify any key strategies being implemented during the current reporting period that are not described above, but are embedded in the approved
intervention plan/budget and are instrumental in meeting projected school improvement outcomes. (Add additional rows as needed.)
Key Strategies List the Key Strategy from your approved SIG Continuation Plan
Implementation Status Identify strategy as R/Y/G
Identify the evidence that supports your assessment of implementation of key strategies, the connection to goals, and the likelihood of meeting targets set forth in the SIG Continuation Plan.
1. Professional Development A. Faculty Meetings PD
B. Saturday PD C. Grade level PD D. Common Planning Time(CPT) PD E. Special Education (CPT)
A. Faculty Meeting Professional Development (PD) topics: a. 09.04.18 - Opening Day Professional Development included:
i. NYS data – school staff only
ii. Differentiated Professional Development: 1. Encore Area Teachers
a. BIP information b. Protocols and Procedures c. Information on Special Education students
2. Reviewing Data to create individualized instruction plans b. September through January Faculty Meeting structure:
i. 15 minutes on MTSS-B data 1. Building attendance data 2. ODR data 3. Next steps – small group discussions
ii. 15 minutes on MTSS-A data 1. Coaching data 2. Newest academic data 3. Next steps – review data and student work samples in small group
discussions iii. 20 minutes on building wide concerns based on surveys or upcoming events
B. Saturday 1/200th PD’s: a. 12.15.18 - ZSpace training, Make and Take, and Lesson planning
i. In attendance 24 teachers, 2 coaches, 2 teacher aides, 2 administrators C. Grade Level Professional Development:
a. 10.11.18, 11.07.18, 11.28.18 Magic Penny PD during grade level time D. Common Planning Time Professional Development:
a. 10.15.18 Literacy coach attended ½ day training b. Coach provided Lexia support to teachers during various grade level – CPT c. 11.15.18 Lexia 4-hour PD during preps, lunch, CPT with consultant d. 12.04.18 Lexia and Apple Classroom PD for Gr. 5 & 6

Dr. Antonia Pantoja – Community School of Academic Excellence - 23
Key Strategies - Identify any key strategies being implemented during the current reporting period that are not described above, but are embedded in the approved
intervention plan/budget and are instrumental in meeting projected school improvement outcomes. (Add additional rows as needed.)
E. Special Education Common Planning Time Meeting: a. 12.19.18 - 8 faculty members attended
Connection to Goals:
1. Create school structures and systems that support instruction and maximize time on task. 2. Increase the use of data and viewing student work to drive instruction. 3. Increasing student achievement in Math and ELA through the development of student assessment,
data review, and informed instructional practices. Evidence:
1. Attendance for Saturday training was 24 teachers. 2. Weekly bulletin identifies look-for’s that are generated by topics covered in professional
development. Next Steps:
1. Review instructional practices to create an individualized professional development plan for teachers. 2. Administrators monitor 1/200th Saturday learning and topics during their walk-throughs and APPR
sessions. 3. Administrators will continue to use their smart sheet to note whether implementation of professional
development learning and topics is being used during instruction. 2. Writing/Reading Initiatives Reading Strategies:
1. Implement Step Up to Writing (SUTW) strategy of color coding of text to help students to comprehend text
2. Implement SUTW strategy of 2 column notes to help students with active reading and processing information in note form. Notes then will assist students in their writing.
Writing Strategies:
1. Building wide plan was writing from PreK – 8th grades a. Implementation included roll out of how the following strategies were taught explicitly (RACE
and RADD) b. Surveys for teachers on implementation were given ever 4 weeks c. Beginning in January student surveys on implementation of the writing strategies was given.
NOTE: data from surveys is then presented at our MTSS-A meetings and adjustments are then made to the building-wide writing plan.

Dr. Antonia Pantoja – Community School of Academic Excellence - 24
Key Strategies - Identify any key strategies being implemented during the current reporting period that are not described above, but are embedded in the approved
intervention plan/budget and are instrumental in meeting projected school improvement outcomes. (Add additional rows as needed.)
Grade level vertical teams: 1. Teachers are vertically sharing reading comprehension strategies during grade level meetings. 2. Viewing of student work using chunking and coding strategies allows for valuable, academic
conversations District ELA Instructional Guides Grades 3-6: 1. After Unit 2 a one-week review was added to address how to answer multiple choice questions and vocabulary questions using the inside out strategy. SUTW tools, NYS released tests and District DBA’s used for review.
1. After Unit 3 a one-week review was added to address how to answer 2-point short response questions using SUTW tools and NYS released tests and questions.
2. After Unit 4 a one-week review was added to address how to answer 4-point extended response questions using SUTW tools and NYS released tests and questions.
Evidence: How will it be measured?
1. District Benchmark Assessments and Teacher created assessments. 2. Look at data to determine if SUTW strategies are assisting with well-developed writing.
3. Math Initiatives
STAR Math 1. Students of K - 4 are assessed BOY, MOY, and EOY. 2. Data is used to differentiate instruction and instructional groupings.
Math RtI 1. Teachers used 21-day planner to implement small group rotation in order to differentiate instruction
for remediation and enrichment time. 2. Teachers incorporate Number Talks/Math Talks on a monthly basis to promote mathematical
discourse among students. Read Re-read Draw Write (RRDW) Implementation:
1. Teachers at various grade levels have created scaffolds and graphic organizers to differentiate RRDW process for their students.
2. Strategies implemented K - 8. Grade level vertical teams:
1. Teachers are vertically sharing RRDW strategies on multiple choice and multi-step word problems during grade level meetings.
2. Viewing of student work using RRDW strategies allows for valuable, academic conversations 3. Allows for discussions on foundational standards, including prerequisite and future skills.
Evidence: How will it be measured?

Dr. Antonia Pantoja – Community School of Academic Excellence - 25
Key Strategies - Identify any key strategies being implemented during the current reporting period that are not described above, but are embedded in the approved
intervention plan/budget and are instrumental in meeting projected school improvement outcomes. (Add additional rows as needed.)
1. District Benchmark Assessments and Teacher created assessments. 2. Look at data to determine if RRDW strategies are assisting with multi-step word problems including
multiple choice, constructed response, and extended response questions. 4. ELA/Math Interventions in grades K -
8
Dedicated Daily ELA and Math RtI block K-6 Assessment:
1. 12-week RtI checkpoint January 2019 Connection to Goals:
1. Create school structures and systems that support instruction and maximize time on task. 2. Increase the use of data to drive instruction. 3. Increasing student achievement in ELA and Math through the development of student assessments,
data review at grade level meetings, action plans, and informed instructional process. Evidence:
1. Small ELA RtI groups are adjusted every four weeks based on ELA DIBELs data, Programmatic data, and informal data.
2. Building Reading Teacher- is providing small group instruction and the push in model is being implemented.
3. Math RtI areas are adjusted every six weeks based on programmatic, informal, and teacher observation data.
5. Use of technology 1) Next Lesson 2) MyOn 3) IRLA 4) PK Istation 5) Reflex Math Grant 6) Online Gr. 3-6 7) IPads
a) One-to-one in grades 3-8
b) Set of 6 in Kindergarten (December 2017)
c) Set of 6 in Pre Kindergarten
8) Lexia:
Next Lesson 1. Planning to incorporate into our ELT program.
MyOn: 1. MyOn used during Core time 2. Based on DIBELS data, teachers turned off the audio for the students reading at the appropriate level
to improve comprehension. IRLA (Independent Reading level Assessment) online diagnostic/formative assessments
1. Implemented during RtI block – 1 hour for entering and emerging students only (per District) PK iPads
1. iPads used in small groups on activities and 1x1 for testing iStation (Indicators of Progress (ISIP™) measure student growth with engaging, computer-adaptive diagnostic and screening programs.)
Kindergarten iPads:
1. Teachers using iPads during center time by taking pictures and making video of student work to share

Dr. Antonia Pantoja – Community School of Academic Excellence - 26
Key Strategies - Identify any key strategies being implemented during the current reporting period that are not described above, but are embedded in the approved
intervention plan/budget and are instrumental in meeting projected school improvement outcomes. (Add additional rows as needed.)
a) Core 5 Gr. K-5
b) Power-Up Gr. 6-8
at grade level meetings. 2. Teachers will continue work to with District ITC in April - June 2018 as needed. 3. Students will use iPads for STAR Math MOY, progress monitoring, and BOY testing.
Grades 1-2 received iPad class set of 6: 1. teachers received iPads 2. teachers work with small groups/areas
Grades 5-6 iPads: 1. Schoology is used to house assignments for ELA and Math that teachers upload and then provide
feedback to students on their work. 2. Teachers work on projects with support from the District Instructional Technology Coach (ITC). 3. Teacher taught students to create an iMovie in Social Studies. 4. Students can access certain apps to support ELA and Math skills. 5. Students can access Think Central to support Journey’s Reading program online materials.
Grades 7 - 8 laptops: 1. Students receive laptops 2. Teachers work to implement technology with the District Instructional Technology Coach (ITC) 3. Teachers begin to use Schoology for assignments 4. Students will access certain apps to support ELA and Math skills.
Lexia: 1. Used as an area during RtI time 2. Teachers monitor data and pull small groups during RtI based on skill deficits.
(For all SIG Cohort 6 and 7 schools that selected the Innovation Framework Model ONLY) Identify the school’s Design Framework and its EPO.
Identify as RED, YELLOW or GREEN.
Identify the evidence that supports your assessment of implementation of the design framework and its connection to your goals. This assessment should take into account and describe the manner in which the EPO is involved in framework development and implementation.
Not Applicable

Dr. Antonia Pantoja – Community School of Academic Excellence - 27
3. BUDGET/FISCAL * Budget Analysis
The LEA/school should propose expenditures that are reasonable and necessary to support the identified Receivership school’s initiatives and goals. The LEA/school should provide appropriate and complete required budget elements identified below.
Expenditures *** Expenditures are from July 2018 – December 2018 SIG DM19
Status(R/Y/G) If expenditures from the approved 16-17 FS-10 and Budget Narrative are on target, describe their impact with regard to the implementation of the plan. If there is a challenge
with expenditures, discuss the course correction to be put in place for QR#3.
Salaries for professional staff-Code 15 $292,277 YTD $89,850 – 31% @ December 2018
G Staff is in place. Professional development has been planned.
Salaries for Support Staff- code 16 $1,777 YTD $268 – 15% @ December 2018
Teacher Aides will be attending professional development.
Purchased services-code 40 $77,631 YTD $64,688 – 83% @ December 2018
Contract with WestEd is in place and work is being done. The monies for the DTSDE review is no longer needed so an amendment has been completed to move those funds.
Purchased services-code 45 $2,362 YTD $ZERO – ZERO% @ December 2018
The district is now paying for Next Lesson so that money is part of an amendment.
Travel expenses-code 46 $NONE YTD $ZERO – ZERO% @ December 2018
N/A
Employee Benefits-code 80 $113,864 YTD $36,636 - 32% @ December 2018
Expended per BPS schedule.
Indirect cost-code 90- COMPLETED AT THE END OF THE PROJECT.
* Supporting fiscal documents should be available upon request.