1€¦ · web viewsupplementary information. lineage. divergence, local . adaptation. across. a ....
TRANSCRIPT

Supplementary Information
Lineage divergence, local adaptation across a biogeographic
break, and artificial transport, shape the genetic structure in
the ascidian Pyura chilensis
Nicolás I. Segovia1,2,3, Cristian Gallardo-Escárate2, Elie Poulin3 & *Pilar A. Haye1,2
1Departamento de Biología Marina, Facultad de Ciencias del Mar, Universidad Católica
del Norte, 1781421, Coquimbo, Chile.2Interdisciplinary Center for Aquaculture Research (INCAR), Departamento de
Oceanografía, Universidad de Concepción, 4070386, Concepción, Chile. 3Instituto de Ecología y Biodiversidad, Departamento de Ciencias Ecológicas, Facultad
de Ciencias, Universidad de Chile, 7800003, Santiago, Chile.
*Corresponding author: Pilar A. Haye, E-mail: [email protected]
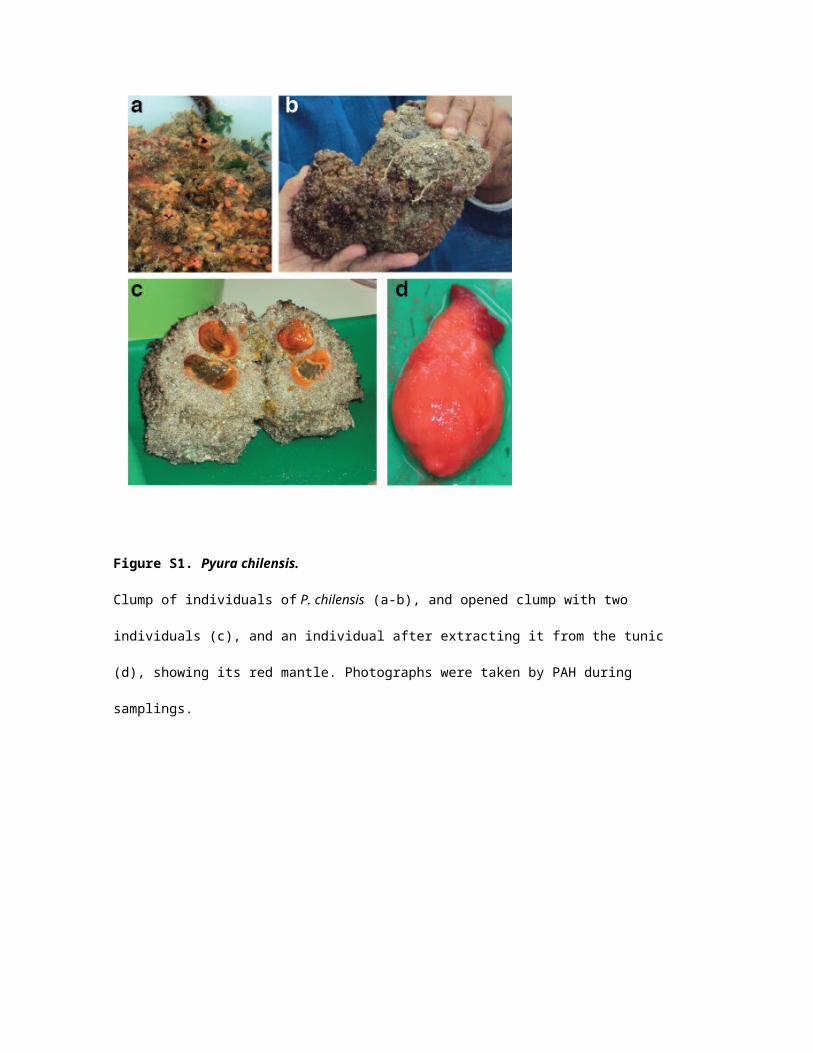
Figure S1. Pyura chilensis.
Clump of individuals of P. chilensis (a-b), and opened clump with two individuals (c),
and an individual after extracting it from the tunic (d), showing its red mantle.
Photographs were taken by PAH during samplings.

Figure S2. SNP loci FST outlier analysis for Pyura chilensis.
Results of Bayescan analysis to identify SNPs with outlier FST values for 2332 SNPs. The
X-axis is the log of the posterior probabilities (q-value) and the dashed line represents
the threshold for posterior probabilities using a False Discovery Rate (FDR) of 0.05.
Values of q < 0.05 are considered as neutral markers, and q > 0.05 as outlier markers.

Figure S3. Shipping lines and artisanal fishing routes for the Study Area.
Maps for marine commercial activity (blue lines) and artisanal fishery modeling (red to
blue pixels) were obtained and modified from the Global Map of Cumulative Human
Impact project data, available in https://www.nceas.ucsb.edu/globalmarine/data
(Halpern et al. 2015) and plotted in ArcMap 10.4 (ESRI 2011) with the base maps of the
coastline of GEODAS, NG, NOAA (https://www.ngdc.noaa.gov/mgg/shorelines/), using

Coastline Extractor Software to filter the study area
(https://www.ngdc.noaa.gov/mgg/geodas/geodas.html ) . Cumulative influence of
commercial and artisanal fishing routes in: (a) South America (data from 2008-2013),
(b) detail of the study area, (c) close up of La Herradura (LH) site, and (d) close up of
the Los Molinos (LM) site. Scale 1 km2 per pixel.
References:
ESRI 2011. ArcGIS Desktop: Release 10. Redlands, CA: Environmental Systems
Research Institute.
Halpern, B. S. et al. Spatial and temporal changes in cumulative human impacts on
the world’s ocean. Nat. Commun. 6:7615 doi: 10.1038/ncomms8615 (2015).

Table S1: Mitochondrial haplogroup assignment
COI haplogroup assignment of each individual of Pyura chilensis analyzed with GBS
data according to the haplogroups detected by Haye & Muñoz-Herrera30.
Site
Haplogroup 1
Haplogroup 2
Haplogroup 3
PA 15 0 0CP 14 1 0LH 8 7 0TH 6 4 0LM 0 3 12AC 11 2 2