1 verification introduction holly c. hartmann department of hydrology and water resources university...
TRANSCRIPT

1
Verification Introduction
Holly C. Hartmann
Department of Hydrology and Water ResourcesUniversity of Arizona
RFC Verification Workshop, 08/14/2007

2
• General concepts of verification• Think about how to apply to your operations• Be able to respond to and influence NWS verification program• Be prepared as new tools become available• Be able to do some of their own verification • Be able to work with researchers on verification projects• Contribute to development of verification tools (e.g., look at various options)• Avoid some typical mistakes
Goals

3
1. Introduction to Verification- Applications, Rationale, Basic Concepts- Data Visualization and Exploration- Deterministic Scalar measures
2. Categorical measures – KEVIN WERNER- Deterministic Forecasts- Ensemble Forecasts
3. Diagnostic Verification- Reliability- Discrimination- Conditioning/Structuring Analyses
4. Lab Session/Group Exercise- Developing Verification Strategies- Connecting to Forecast Operations and Users
Agenda

4
Why Do Verification? It depends…Why Do Verification? It depends…
Administrative: logistics, selected quantitative criteria
Operations: inputs, model states, outputs, quick!
Research: sources of error, targeting research
Users: making decisions, exploit skill, avoid mistakes
Concerns about verification?

5
Need for Verification MeasuresNeed for Verification Measures
Verification statistics identify- accuracy of forecasts- sources of skill in forecasts- sources of uncertainty in forecasts- conditions where and when forecasts are
skillful or not skillful, and why
Verification statistics then can inform- improvements in terms of forecast skill
and decision making with alternate forecast sources (e.g., climatology, persistence, new forecast systems)
Adapted from: Regonda, Demargne, and Seo, 2006

6
Skill versus ValueSkill versus Value
Assess quality of forecast system
i.e. determine skill and value of forecast
A forecast has skill if it predicts the observed conditions well according to some objective or subjective criteria.
A forecast has value if it helps the user to make better decisions than without knowledge of the forecast.
• Forecasts with poor skill can be valuable (e.g. extreme event forecasted in wrong place)
• Forecasts with high skill can be of little value (e.g. blue sky desert)Credit: Hagedorn (2006) and Julie Demargne

7
Common across all groups
Uninformed, mistaken about forecast interpretation
Use of forecasts limited by lack of demonstrated forecast skill
Have difficulty specifying required accuracy
Unique among stakeholders
Relevant forecast variables, regions (location & scale), seasons, lead times, performance characteristics
Technical sophistication: base probabilities, distributions, math
Role of of forecasts in decision making
Common across many, but not all, stakeholders
Have difficulty distinguishing between “good” & “bad” products
Have difficulty placing forecasts in historical context
Stakeholder Use of HydroClimate Info & Forecasts

8
Forecast evaluation concepts
All happy families are alike; each unhappy family
is unhappy in its own way. -- Leo Tolstoy (1876)
All perfect forecasts are alike; each imperfect forecast
is imperfect in its own way. -- Holly Hartmann (2002)
What is a Perfect Forecast?

9
“Today’s high will be 76 degrees, and it will be partly cloudy, with a 30% chance of rain.”
Deterministic
Categorical
Probabilistic
Different Forecasts, Information, Evaluation

10
“Today’s high will be 76 degrees, and it will be partly cloudy, with a 30% chance of rain.”
Deterministic
Categorical
ProbabilisticProbabilisticCategoricalDeterministic
How would you evaluate each of these?
Different Forecasts, Information, Evaluation
Rain
No rain
30%
76°
11
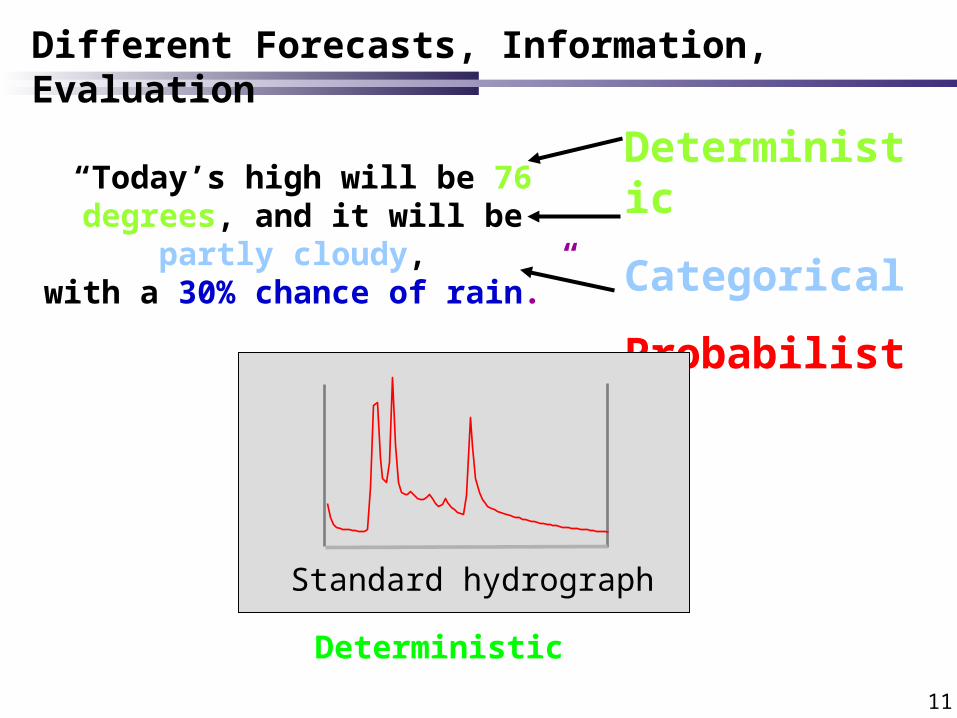
“Today’s high will be 76 degrees, and it will be partly cloudy, with a 30% chance of rain.”
Deterministic
Categorical
Probabilistic
Different Forecasts, Information, Evaluation
Standard hydrograph
Deterministic

12
ESP Forecasts: User preferences influence verification
From: California-Nevada River Forecast Center

13
ESP Forecasts: User preferences influence verification
From: California-Nevada River Forecast Center

14
ESP Forecasts: User preferences influence verification
From: California-Nevada River Forecast Center

15
ESP Forecasts: User preferences influence verification
From: California-Nevada River Forecast Center

16
Deterministic
Bias
Correlation
RMSE
• Standardized RMSE
• Nash-Sutcliffe
Linear Error in Probability Space
CategoricalHit Rate
Surprise rateThreat ScoreGerrity ScoreSuccess Ratio
Post-agreementPercent Correct
Pierce Skill ScoreGilbert Skill ScoreHeidke Skill Score
Critical Success indexPercent N-class errors
Modified Heidke Skill ScoreHannsen and Kuipers Score
Gandin and Murphy Skill Scores…
Probabilistic
Brier Score
Ranked Probability Score
Distributions-oriented Measures
• Reliability
• Discrimination
• Sharpness
So Many Evaluation Criteria!

17
RFC Verification System: MetricsRFC Verification System: Metrics
CATEGORIES DETERMINISTIC FORECAST VERIFICATION METRICS
PROBABILISTIC FORECAST VERIFICATION METRICS
1. Categorical(predefined threshold, range of values)
Probability Of Detection (POD),
False Alarm Ratio (FAR),
Probability of False Detection (POFD)
Lead Time of Detection (LTD),
Critical Success Index (CSI), Pierce Skill Score (PSS), Gerrity Score (GS)
Brier Score (BS),
Rank Probability Score (RPS)
2. Error (accuracy)
Root Mean Square Error (RMSE),
Mean Absolute Error (MAE),
Mean Error (ME), Bias (%),
Linear Error in Probability Space (LEPS)
Continuous RPS
3. Correlation Pearson Correlation Coefficient, Ranked correlation coefficient, scatter plots
4. Distribution Properties Mean, variance, higher moments for observation and forecasts
Wilcoxon rank sum test, variance of forecasts, variance of observations, ensemble spread, Talagrand Diagram (or Rank Histogram)
Source: Verification Group, courtesy J. Demargne

18
RFC Verification System: MetricsRFC Verification System: Metrics
CATEGORIES DETERMINISTIC FORECAST VERIFICATION METRICS
PROBABILISTIC FORECAST VERIFICATION METRICS
5. Skill Scores (relative accuracy over reference forecast)
Root Mean Squared Error Skill Score (SS-RMSE) (with reference to persistence, climatology, lagged persistence),
Wilson Score (WS),
Linear Error in Probability Space Skill Score (SS-LEPS)
Rank Probability Skill Score,
Brier Skill Score (with reference to persistence, climatology, lagged persistence)
6. Conditional Statistics (based on occurrence of specific events)
Relative Operating Characteristic (ROC),
reliability measures,
discrimination diagram,
other discrimination measures
ROC and ROC Area,
other resolution measures,
reliability diagram,
discrimination diagram,
other discrimination measures
7. Confidence (metric uncertainty)
Sample size,
Confidence Interval (CI)
Ensemble size, sample size,
Confidence Interval (CI)
Source: Verification Group, courtesy J. Demargne

19
Accuracy - overall correspondence between forecasts and observations
Bias - difference between average forecast and average observation
Consistency - forecasts don’t waffle around
Possible Performance Criteria
Good consistency

20
Accuracy - overall correspondence between forecasts and observations
Bias - difference between average forecast and average observation
Consistency - forecasts don’t waffle around
Sharpness/Refinement – ability to make bullish forecast statements
Not Sharp
Sharp
Possible Performance Criteria

21
What makes a forecast “good”?What makes a forecast “good”?
Forecasts should agree with observations, with few large errors
Accuracy
Forecast mean should agree with observed mean Bias
Linear relationship between forecasts and
observations
Association
Forecast should be more accurate than low-skilled reference forecasts (e.g., random chance, persistence, or climatology)
Skill
Adapted from : Ebert (2003)

22
What makes a forecast “good”?What makes a forecast “good”?
Binned forecast values should agree with binned observations (agreement between categories)
Reliability
Forecast can discriminate between events & non-events
Resolution
Forecast can predict with strong probabilities (i.e., 100% for event, 0% for non-event)
Sharpness
Forecast represents the associated uncertainty Spread (Variability)
Adapted from : Ebert (2003)

23
False Alarms Surpriseswarning without event event without warning
No fire
“False Alarm Ratio” “Probability of Detection”
A forecaster’s fundamental challenge is balancing these two.
Which is more important?Depends on the specific decision context…
Forecasting Tradeoffs
Forecast performance is multi-faceted
24
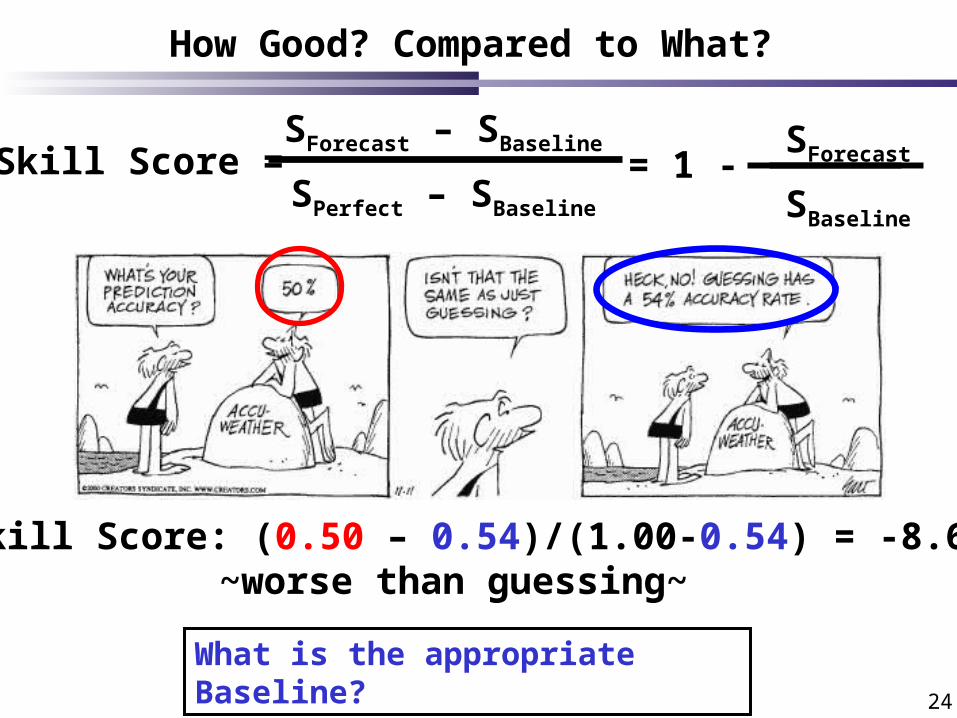
Skill Score: (0.50 – 0.54)/(1.00-0.54) = -8.6%~worse than guessing~
Skill Score =SForecast – SBaseline
SPerfect – SBaseline
How Good? Compared to What?
What is the appropriate Baseline?
= 1 - SForecast
SBaseline

25
GraphicalForecast Evaluation

26
Historical seasonal water supply outlooks
Colorado River Basin
Basic Data Display
Morrill, Hartmann, and Bales, 2007

27
Historical seasonal water supply outlooks
Colorado River Basin
Scatter plots
Morrill, Hartmann, and Bales, 2007

28
Historical seasonal water supply outlooks
Colorado River Basin
Histograms
Morrill, Hartmann, and Bales, 2007

29
IVP Scatterplot Example
Source: H. Herr

30
Empirical distribution of forecast probabilities for different observations categories
Goal: Widely separated CDFs
Cumulative Distribution Function (CDF): IVP
Cat 1 = No Observed Precipitation
Cat 2 = Observed Precipitation (>0.001”)
Source: H. Herr, IVP Charting Examples, 2007

31
Probability Density Function (PDF): IVP
Cat 1 = No Observed Precipitation
Cat 2 = Observed Precipitation (>0.001”)
Empirical distribution for 10 bins for IVP GUI
Goal: Widely separated PDFs
Source: H. Herr, IVP Charting Examples, 2007

32
“Box-plots”: Quantiles and Extremes
Based on summarizing CDF computation and plot
Goal: Widely separated box-plots
Cat 1 = No Observed Precipitation
Cat 2 = Observed Precipitation (>0.001”)
Source: H. Herr, IVP Charting Examples, 2007
33
ScalarForecast Evaluation

34
BiasMean forecast = Mean observed
Correlation CoefficientVariance shared between forecast and observed (r2)Says nothing about bias or whether forecast variance = observed variancePearson correlation coefficient: assumes normal distribution, can be + or – (Rank r: only +, non-normal ok)
Root Mean Squared ErrorDistance between forecast/observation valuesBetter than correlation, poor when error is heteroscedasticEmphasizes performance for high flows Alternative: Mean Absolute Error (MAE)
fcstobs
Observed
Fo
reca
st
Standard Scalar Measures

35
1943-99 April 1 Forecasts for Apr-Sept Streamflow at
Stehekin R at Stehekin, WA
For
ecas
t (1
000’
s ac
-ft)
Observed (1000’s ac-ft) Observed (1000’s ac-ft)
1954-97 January 1 Forecasts for Jan-May Streamflow at
Verde R blw Tangle Crk, AZ
Bias = 22Corr = 0.92RMSE = 74.4
Bias = -87.5Corr = 0.58RMSE = 228.3
Standard Scalar Measures (with Scatterplot)

36
IVP: Deterministic Scalar Measures
ME: smallest; + and – errors cancel
MAE vs. RMSE: RMSE influenced by large errors for large events
MAXERR: largest
Sample Size: small samples have large uncertainty
Source: H. Herr, IVP Charting Examples, 2007

37
IVP: RMSE – Skill Scores
Skill compared to Persistence Forecast
Source: H. Herr, IVP Charting Examples, 2007