1 us energy market: uni- and bivariate extreme value analysis nik tuzov purdue university ntuzov/ m....
TRANSCRIPT
1
US Energy Market: US Energy Market: uni- and bivariate uni- and bivariate
Extreme Value analysisExtreme Value analysisNik TuzovNik Tuzov
Purdue UniversityPurdue University
http://www.stat.purdue.edu/~ntuzov/http://www.stat.purdue.edu/~ntuzov/
M. Pilar MunozM. Pilar MunozTechnical University of CataloniaTechnical University of Catalonia
[email protected]@upc.edu

22
Structure of US Energy MarketStructure of US Energy Market
Electricity and n/gas are traded at Electricity and n/gas are traded at many locations, but only a few of many locations, but only a few of them are tied to energy derivativesthem are tied to energy derivatives
Physically, trading happens every Physically, trading happens every day but exchanges are closed on day but exchanges are closed on weekendsweekends
Live example:Live example: http://www.powerlytix.com/frontend/landingpage/Power.shtmlhttp://www.powerlytix.com/frontend/landingpage/Power.shtml
33
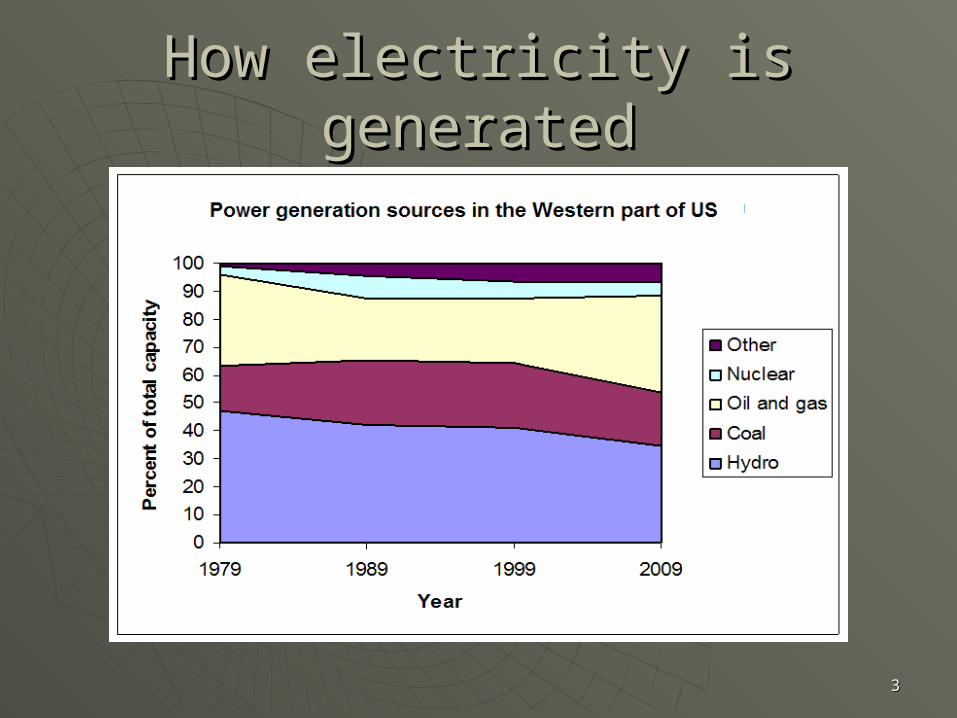
How electricity is generatedHow electricity is generated

44
Possible important factorsPossible important factors Precipitation (for hydro-plants)Precipitation (for hydro-plants) Temperature (affects demand)Temperature (affects demand) Natural Gas priceNatural Gas price Fuel Oil / Heating Oil priceFuel Oil / Heating Oil price Coal priceCoal price Nuclear Fuel PriceNuclear Fuel Price Cost of power plant emissions (emission Cost of power plant emissions (emission
allowances can be purchased via emission allowances can be purchased via emission derivatives)derivatives)
??????

55
Our objectiveOur objective
To check what variables influence To check what variables influence the power price, in particular at the power price, in particular at extreme levelsextreme levels
66
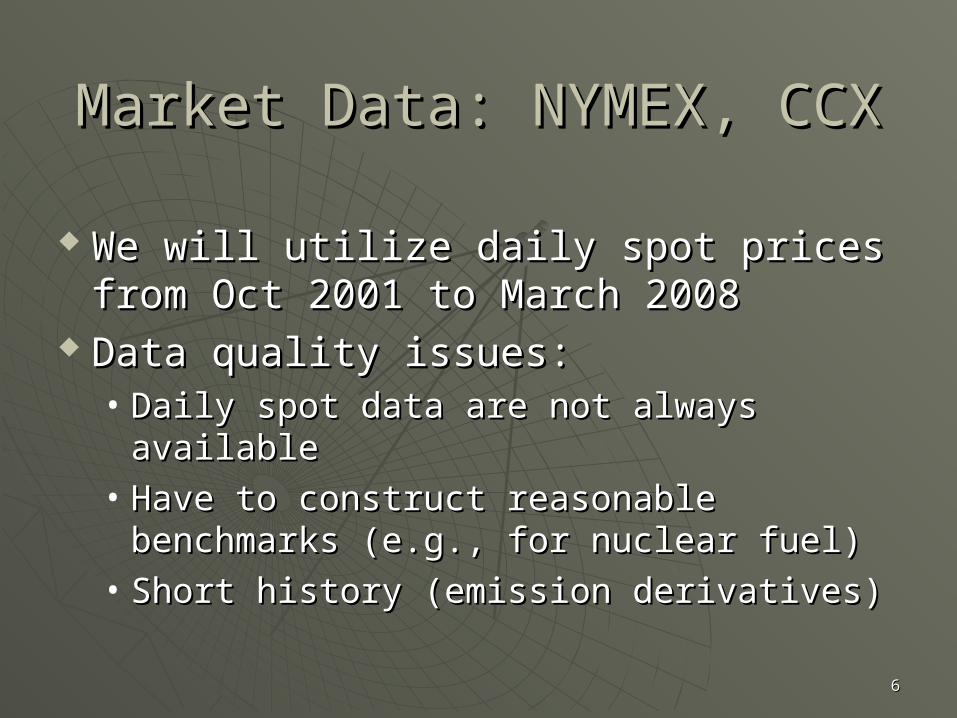
Market Data: NYMEX, CCXMarket Data: NYMEX, CCX
We will utilize daily spot prices from We will utilize daily spot prices from Oct 2001 to March 2008Oct 2001 to March 2008
Data quality issues: Data quality issues: • Daily spot data are not always availableDaily spot data are not always available• Have to construct reasonable Have to construct reasonable
benchmarks (e.g., for nuclear fuel)benchmarks (e.g., for nuclear fuel)• Short history (emission derivatives)Short history (emission derivatives)
77
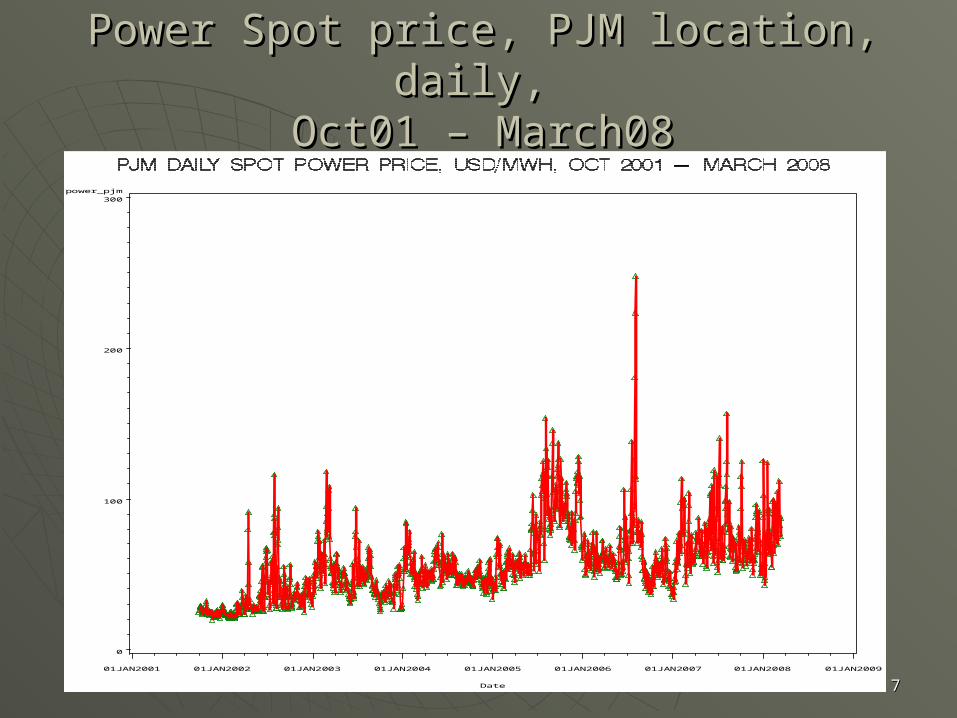
Power Spot price, PJM location, daily, Power Spot price, PJM location, daily, Oct01 – March08Oct01 – March08
power _ pj m
0
100
200
300
Dat e
01J AN2001 01J AN2002 01J AN2003 01J AN2004 01J AN2005 01J AN2006 01J AN2007 01J AN2008 01J AN2009
88
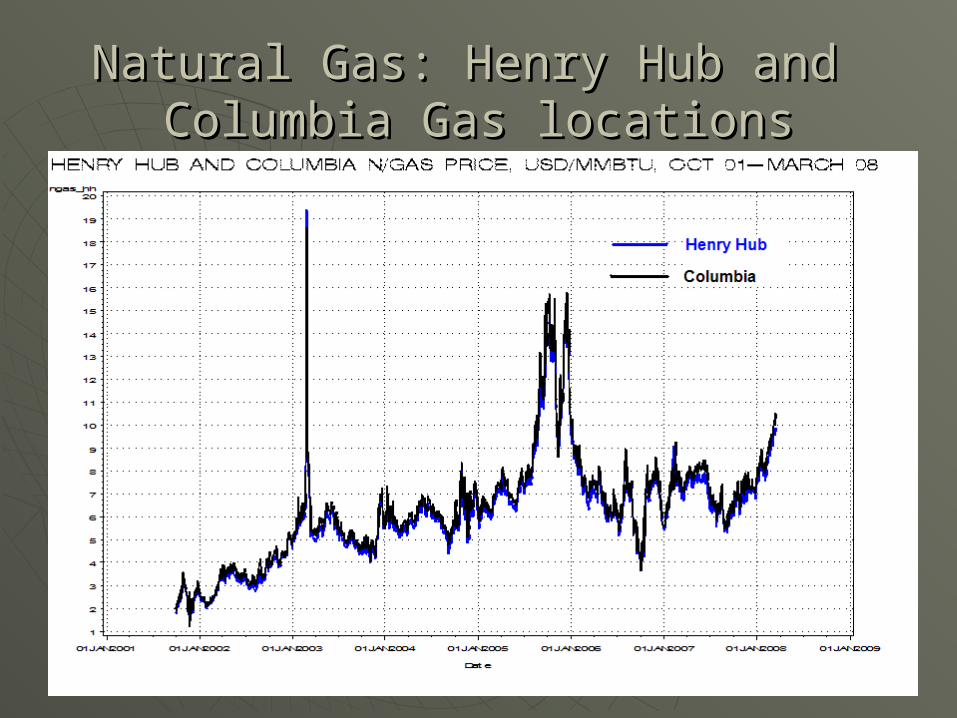
Natural Gas: Henry Hub and Natural Gas: Henry Hub and Columbia Gas locationsColumbia Gas locations

99
Heating Oil Heating Oil (similar in composition to Diesel fuel )(similar in composition to Diesel fuel )
oi l
0
100
200
300
400
Dat e
01J AN2001 01J AN2002 01J AN2003 01J AN2004 01J AN2005 01J AN2006 01J AN2007 01J AN2008 01J AN2009

1010
CoalCoalcoal
20
30
40
50
60
70
80
90
Dat e
01J AN2001 01J AN2002 01J AN2003 01J AN2004 01J AN2005 01J AN2006 01J AN2007 01J AN2008 01J AN2009
1111
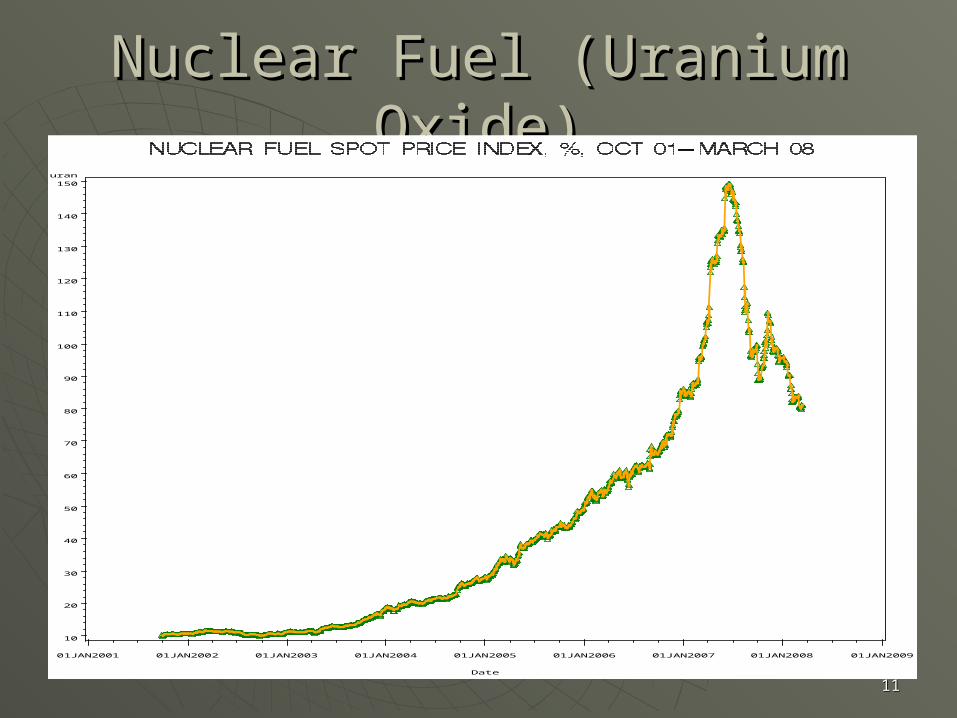
Nuclear Fuel (Uranium Oxide)Nuclear Fuel (Uranium Oxide)ur an
10
20
30
40
50
60
70
80
90
100
110
120
130
140
150
Dat e
01J AN2001 01J AN2002 01J AN2003 01J AN2004 01J AN2005 01J AN2006 01J AN2007 01J AN2008 01J AN2009
1212
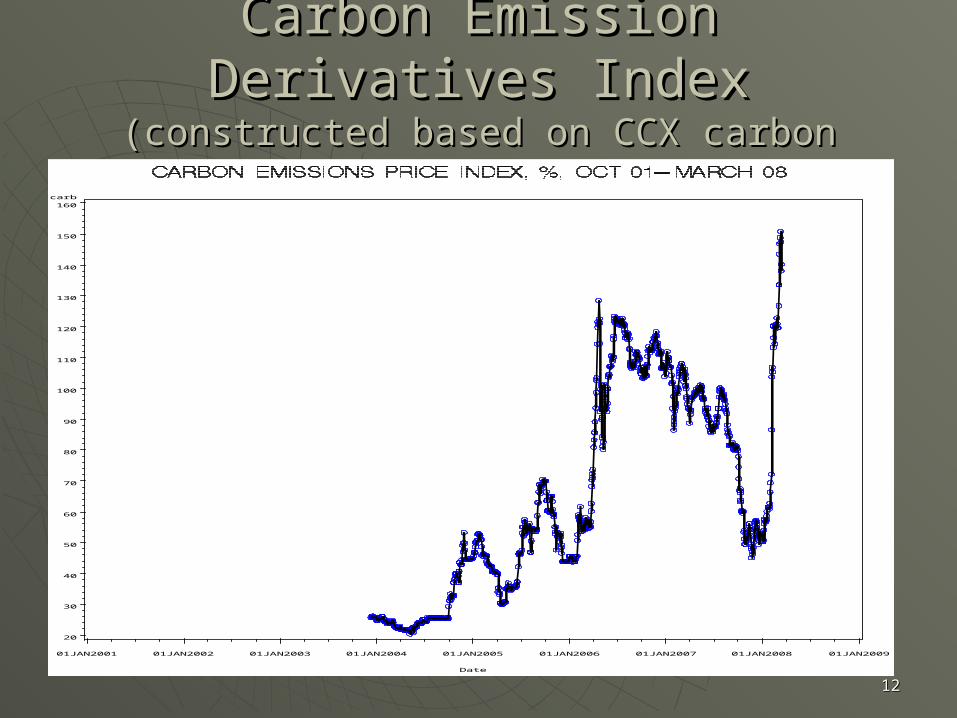
Carbon Emission Derivatives IndexCarbon Emission Derivatives Index(constructed based on CCX carbon vintages)(constructed based on CCX carbon vintages)
car b
20
30
40
50
60
70
80
90
100
110
120
130
140
150
160
Dat e
01J AN2001 01J AN2002 01J AN2003 01J AN2004 01J AN2005 01J AN2006 01J AN2007 01J AN2008 01J AN2009

1313
Sulfur and Nitrogen Emission Indices (CCX)Sulfur and Nitrogen Emission Indices (CCX)sul f
300
400
500
600
700
800
900
1000
1100
1200
1300
1400
1500
1600
1700
Dat e
01J AN2001 01J AN2002 01J AN2003 01J AN2004 01J AN2005 01J AN2006 01J AN2007 01J AN2008 01J AN2009
ni t r o
0
100
200
300
Dat e
01J AN2001 01J AN2002 01J AN2003 01J AN2004 01J AN2005 01J AN2006 01J AN2007 01J AN2008 01J AN2009

1414
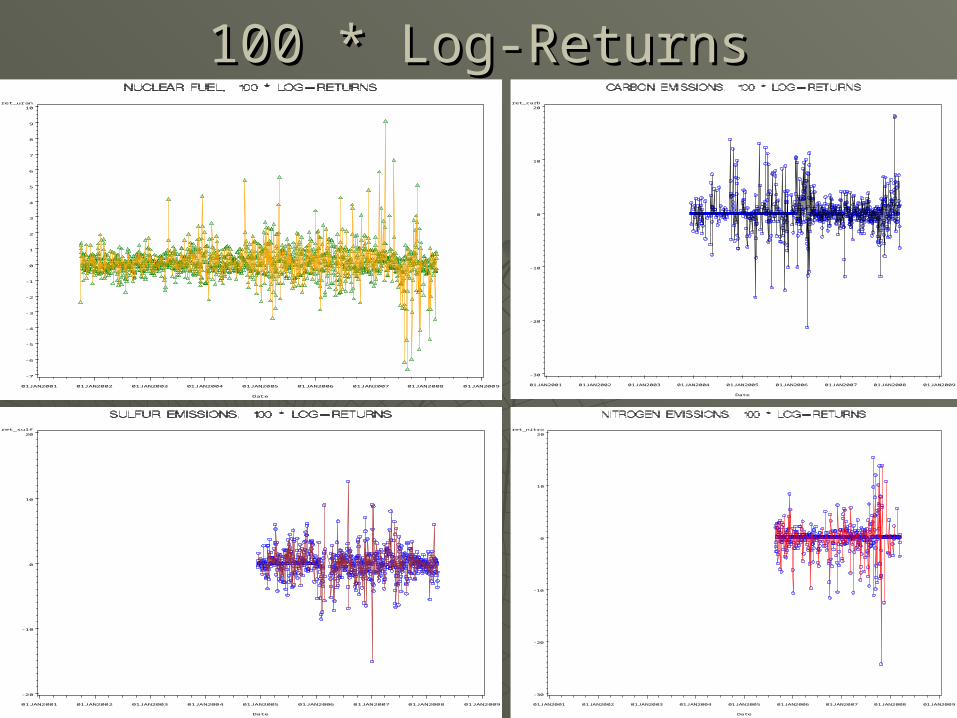
100 * Log-Returns100 * Log-Returnsr et _ power _ pj m
- 90
- 80
- 70
- 60
- 50
- 40
- 30
- 20
- 10
0
10
20
30
40
50
60
70
80
90
100
Dat e
01J AN2001 01J AN2002 01J AN2003 01J AN2004 01J AN2005 01J AN2006 01J AN2007 01J AN2008 01J AN2009
r et _ ngas_ hh
- 60
- 50
- 40
- 30
- 20
- 10
0
10
20
30
40
50
60
70
Dat e
01J AN2001 01J AN2002 01J AN2003 01J AN2004 01J AN2005 01J AN2006 01J AN2007 01J AN2008 01J AN2009
r et _ oi l
- 10
0
10
20
Dat e
01J AN2001 01J AN2002 01J AN2003 01J AN2004 01J AN2005 01J AN2006 01J AN2007 01J AN2008 01J AN2009
r et _ coal
- 20
- 10
0
10
20
Dat e
01J AN2001 01J AN2002 01J AN2003 01J AN2004 01J AN2005 01J AN2006 01J AN2007 01J AN2008 01J AN2009
1515
100 * Log-Returns100 * Log-Returnsr et _ ur an
- 7
- 6
- 5
- 4
- 3
- 2
- 1
0
1
2
3
4
5
6
7
8
9
10
Dat e
01J AN2001 01J AN2002 01J AN2003 01J AN2004 01J AN2005 01J AN2006 01J AN2007 01J AN2008 01J AN2009
r et _ car b
- 30
- 20
- 10
0
10
20
Dat e
01J AN2001 01J AN2002 01J AN2003 01J AN2004 01J AN2005 01J AN2006 01J AN2007 01J AN2008 01J AN2009
r et _ sul f
- 20
- 10
0
10
20
Dat e
01J AN2001 01J AN2002 01J AN2003 01J AN2004 01J AN2005 01J AN2006 01J AN2007 01J AN2008 01J AN2009
r et _ ni t r o
- 30
- 20
- 10
0
10
20
Dat e
01J AN2001 01J AN2002 01J AN2003 01J AN2004 01J AN2005 01J AN2006 01J AN2007 01J AN2008 01J AN2009
1616
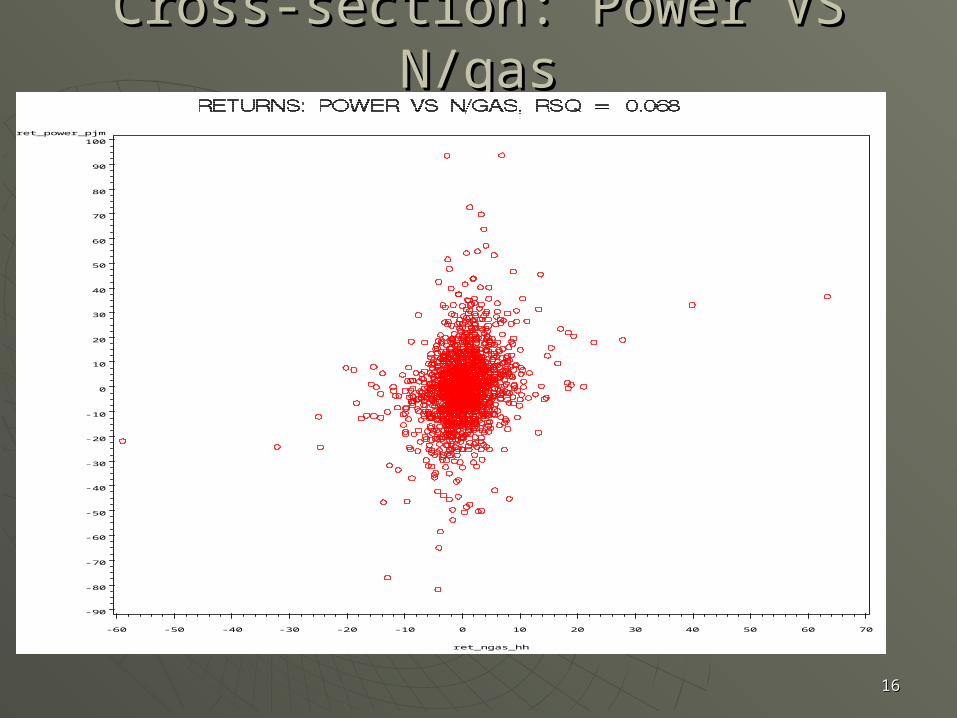
Cross-section: Power VS N/gasCross-section: Power VS N/gas
r et _ power _ pj m
- 90
- 80
- 70
- 60
- 50
- 40
- 30
- 20
- 10
0
10
20
30
40
50
60
70
80
90
100
r et _ ngas_ hh
- 60 - 50 - 40 - 30 - 20 - 10 0 10 20 30 40 50 60 70

1717
Cross-section: Power VS OilCross-section: Power VS Oilr et _ power _ pj m
- 90
- 80
- 70
- 60
- 50
- 40
- 30
- 20
- 10
0
10
20
30
40
50
60
70
80
90
100
r et _ oi l
- 10 0 10 20
1818
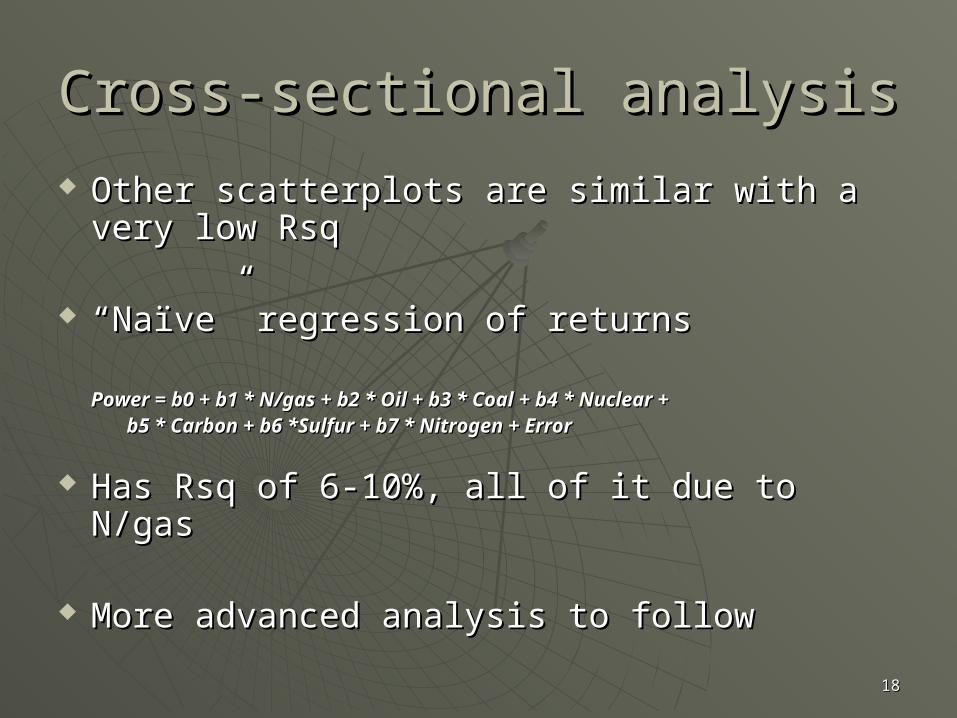
Cross-sectional analysisCross-sectional analysis
Other scatterplots are similar with a very Other scatterplots are similar with a very low Rsqlow Rsq
““Naïve” regression of returns Naïve” regression of returns
Power = b0 + b1 * N/gas + b2 * Oil + b3 * Coal + b4 * Nuclear + Power = b0 + b1 * N/gas + b2 * Oil + b3 * Coal + b4 * Nuclear + b5 * Carbon + b6 *Sulfur + b7 * Nitrogen + Errorb5 * Carbon + b6 *Sulfur + b7 * Nitrogen + Error
Has Rsq of 6-10%, all of it due to N/gasHas Rsq of 6-10%, all of it due to N/gas
More advanced analysis to followMore advanced analysis to follow

1919
Univariate Time Series analysis - PowerUnivariate Time Series analysis - Power
- 90 - 80 - 70 - 60 - 50 - 40 - 30 - 20 - 10 0 10 20 30 40 50 60 70 80 90 100
0
5
10
15
20
25
30
35
40
Percent
r et _ power _ pj m
- 4 - 3 - 2 - 1 0 1 2 3 4
- 100
- 75
- 50
- 25
0
25
50
75
100
ret_power_pjm
Nor mal Quant i l es

2020
Univariate Time Series analysis - PowerUnivariate Time Series analysis - Power

2121
AR(p,q)-GARCH(p’,q’), EGARCH, AR(p,q)-GARCH(p’,q’), EGARCH, GARCH-m with normal and GARCH-m with normal and
t-distributions have been fitted t-distributions have been fitted
(SAS proc autoreg)(SAS proc autoreg)
Best model: AR(5,6) – GARCH(1,1), Best model: AR(5,6) – GARCH(1,1), normal, 10 non-zero parametersnormal, 10 non-zero parameters
Univariate Time Series analysis - PowerUnivariate Time Series analysis - Power

2222
Diagnostics for standardized residuals - PowerDiagnostics for standardized residuals - Power

2323
Diagnostics for standardized residuals - PowerDiagnostics for standardized residuals - Power
- 4 - 3 - 2 - 1 0 1 2 3 4
- 6
- 4
- 2
0
2
4
6
8
std_res
Nor mal Quant i l es
Serial correlation is much reduced, but Serial correlation is much reduced, but fat tails persistfat tails persist
2424
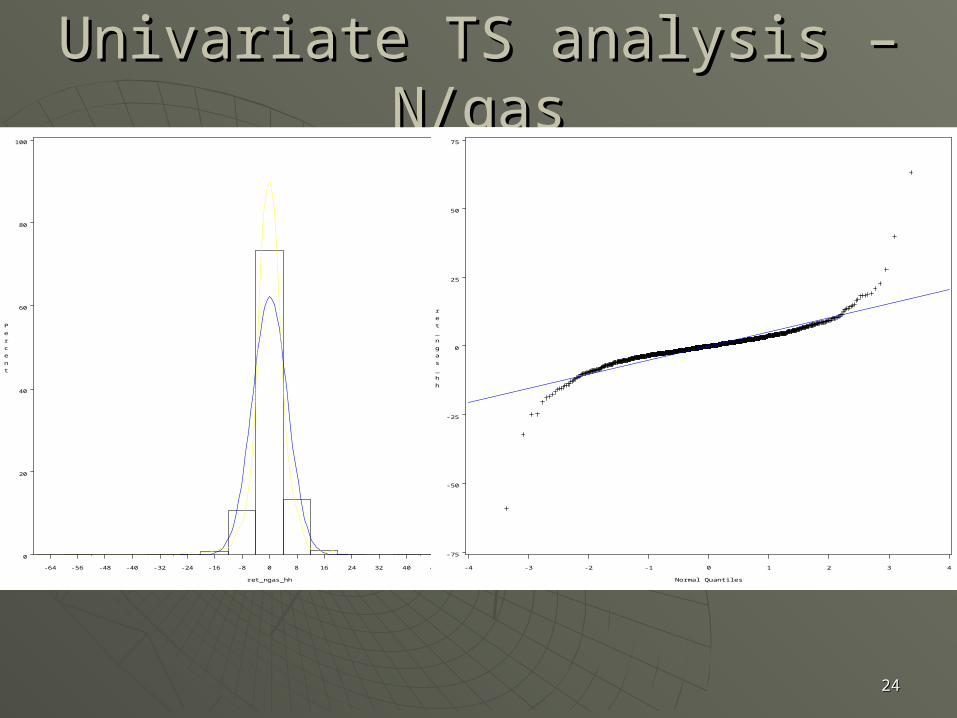
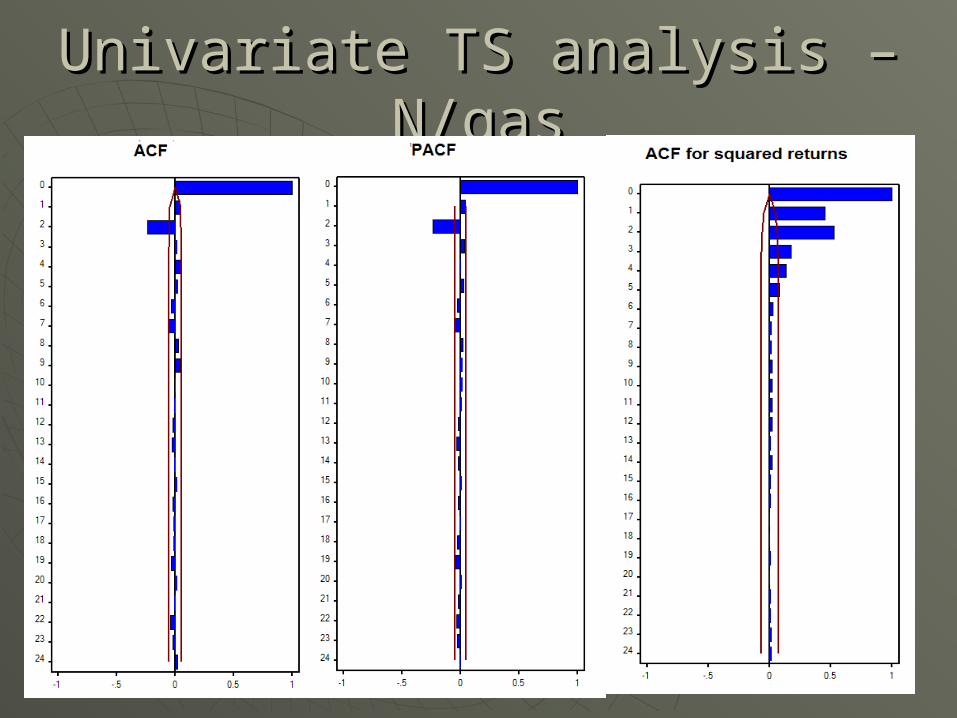
Univariate TS analysis – N/gasUnivariate TS analysis – N/gas
- 64 - 56 - 48 - 40 - 32 - 24 - 16 - 8 0 8 16 24 32 40 48 56 64
0
20
40
60
80
100
Percent
r et _ ngas_ hh
- 4 - 3 - 2 - 1 0 1 2 3 4
- 75
- 50
- 25
0
25
50
75
ret_ngas_hh
Nor mal Quant i l es
2525
Univariate TS analysis – N/gasUnivariate TS analysis – N/gas
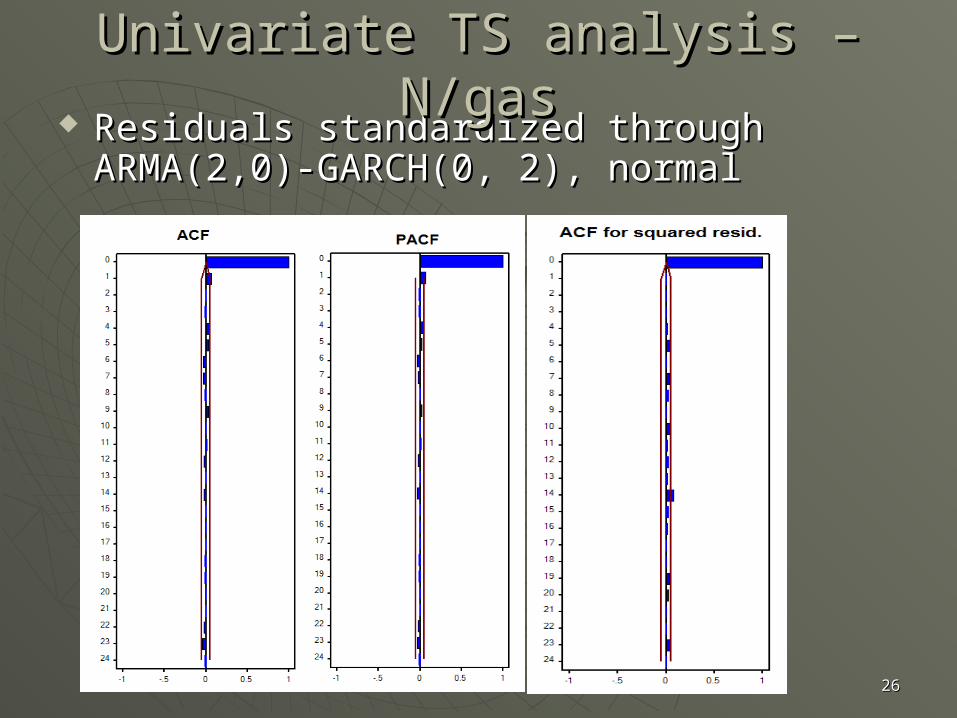
2626
Residuals standardized through Residuals standardized through ARMA(2,0)-GARCH(0, 2), normalARMA(2,0)-GARCH(0, 2), normal
Univariate TS analysis – N/gasUnivariate TS analysis – N/gas
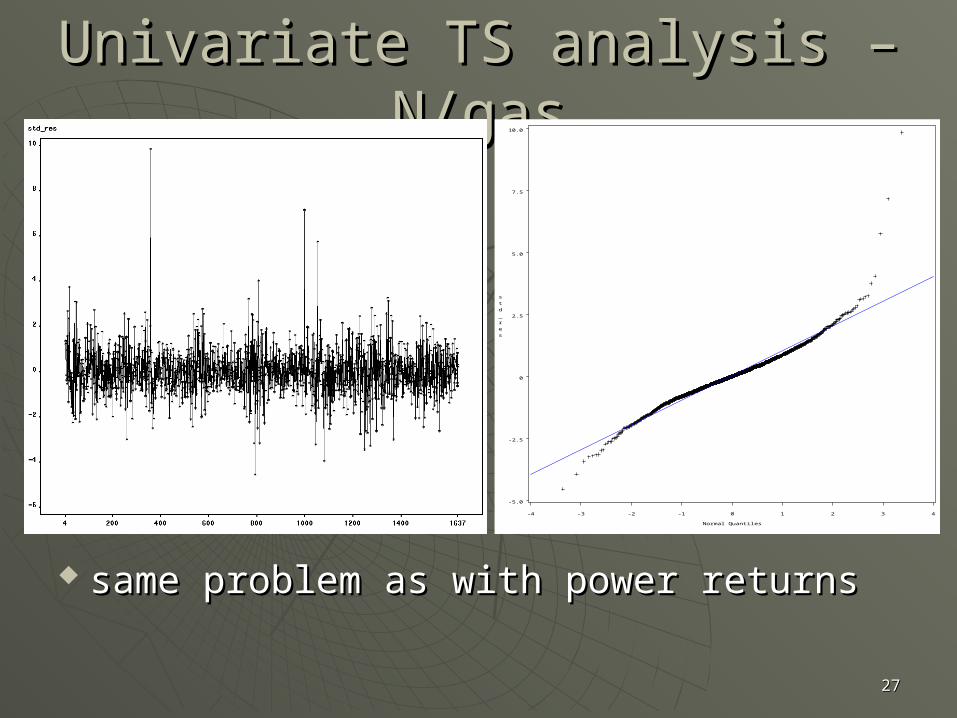
2727
same problem as with power returnssame problem as with power returns
Univariate TS analysis – N/gasUnivariate TS analysis – N/gas
- 4 - 3 - 2 - 1 0 1 2 3 4
- 5. 0
- 2. 5
0
2. 5
5. 0
7. 5
10. 0
std_res
Nor mal Quant i l es
2828
Extreme Value analysisExtreme Value analysis
Interested in extremely negative power Interested in extremely negative power returnsreturns
Therefore, will utilize standardized Therefore, will utilize standardized residuals of power and n/gas series residuals of power and n/gas series multiplied by (-1)multiplied by (-1)
Apply Peaks-Over-Threshold (POT) to Apply Peaks-Over-Threshold (POT) to power and n/gas separately and then power and n/gas separately and then jointlyjointly
2929
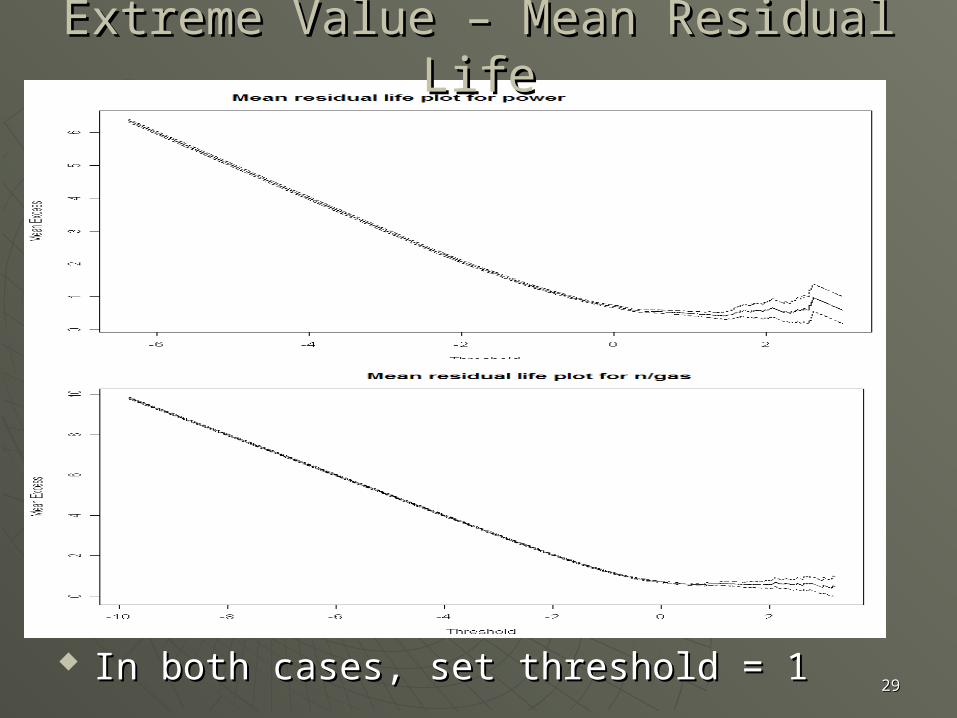
In both cases, set threshold = 1In both cases, set threshold = 1
Extreme Value – Mean Residual LifeExtreme Value – Mean Residual Life
3030
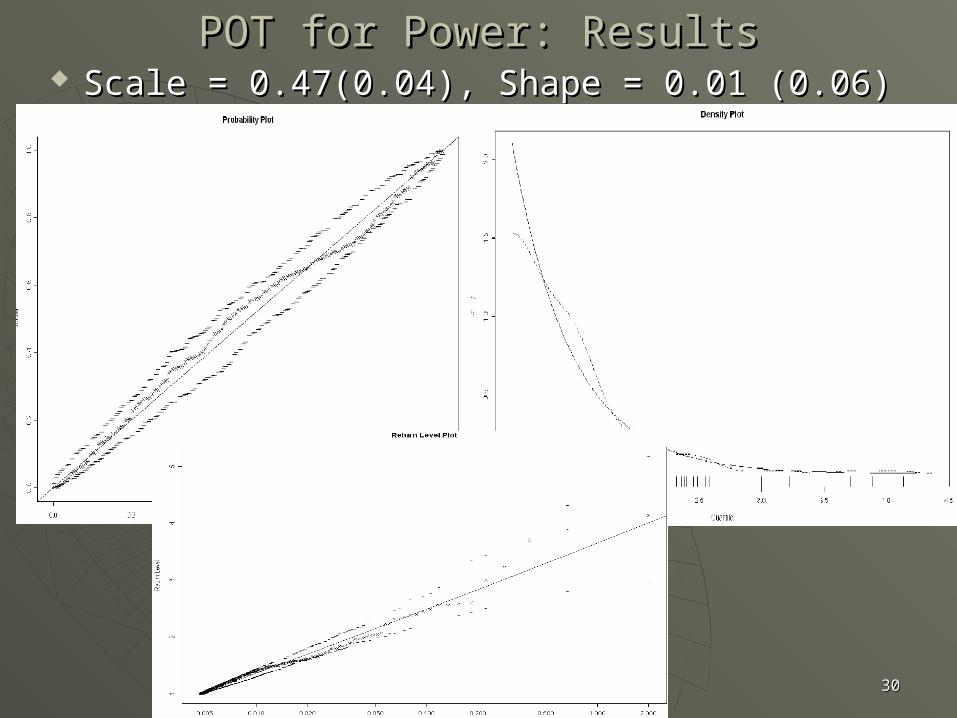
POT for Power: ResultsPOT for Power: Results Scale = 0.47(0.04), Shape = 0.01 (0.06)Scale = 0.47(0.04), Shape = 0.01 (0.06)
3131
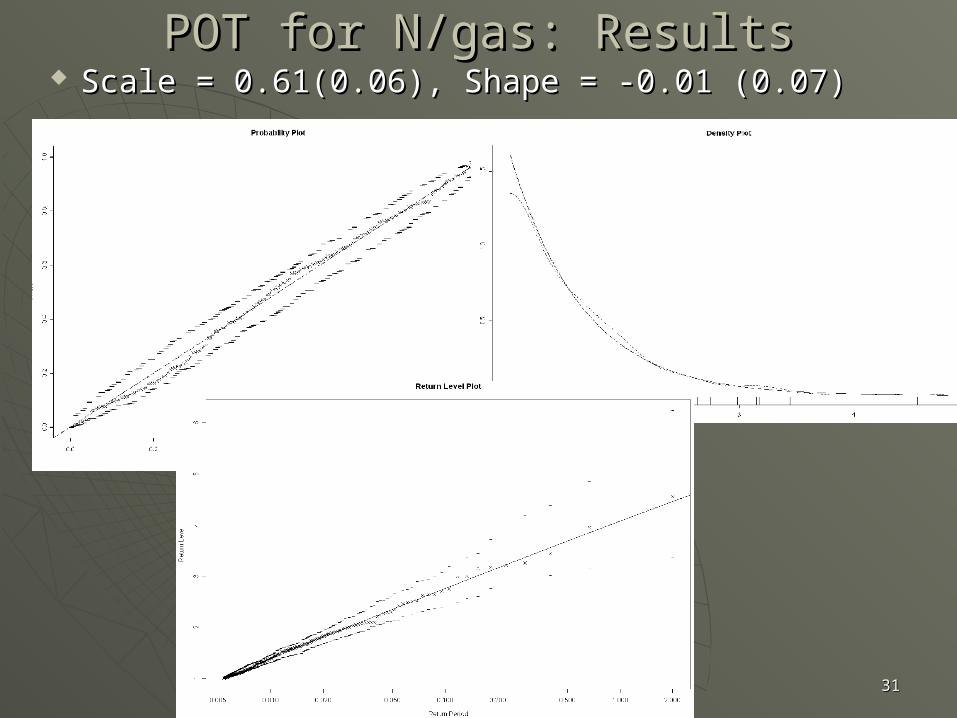
POT for N/gas: ResultsPOT for N/gas: Results Scale = 0.61(0.06), Shape = -0.01 (0.07)Scale = 0.61(0.06), Shape = -0.01 (0.07)
3232
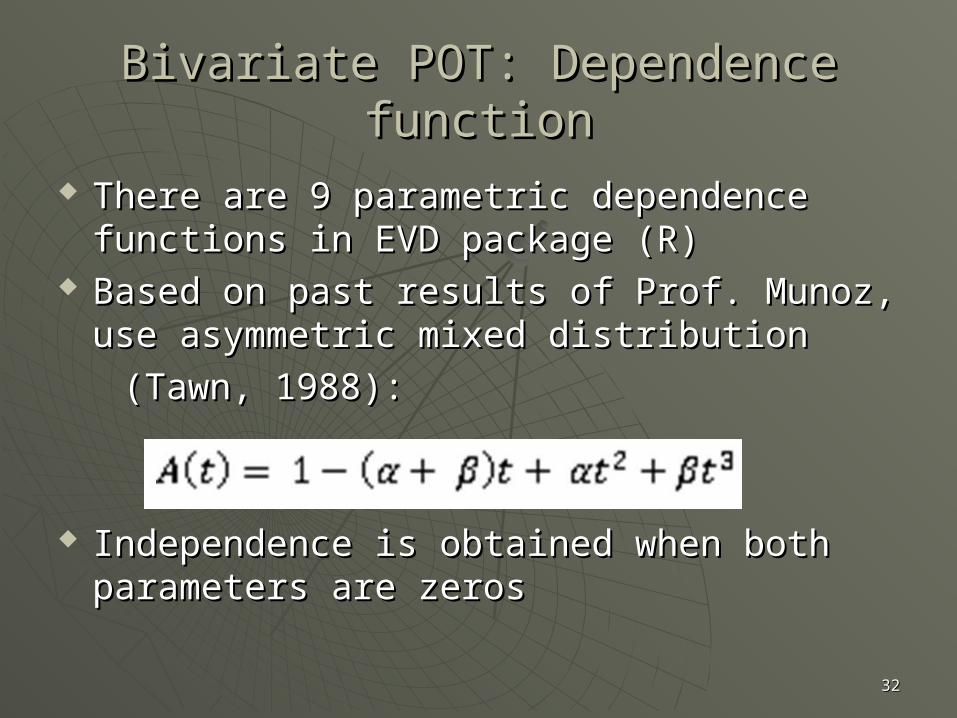
Bivariate POT: Dependence functionBivariate POT: Dependence function
There are 9 parametric dependence There are 9 parametric dependence functions in EVD package (R)functions in EVD package (R)
Based on past results of Prof. Munoz, use Based on past results of Prof. Munoz, use asymmetric mixed distribution asymmetric mixed distribution
(Tawn, 1988):(Tawn, 1988):
Independence is obtained when both Independence is obtained when both parameters are zerosparameters are zeros
3333
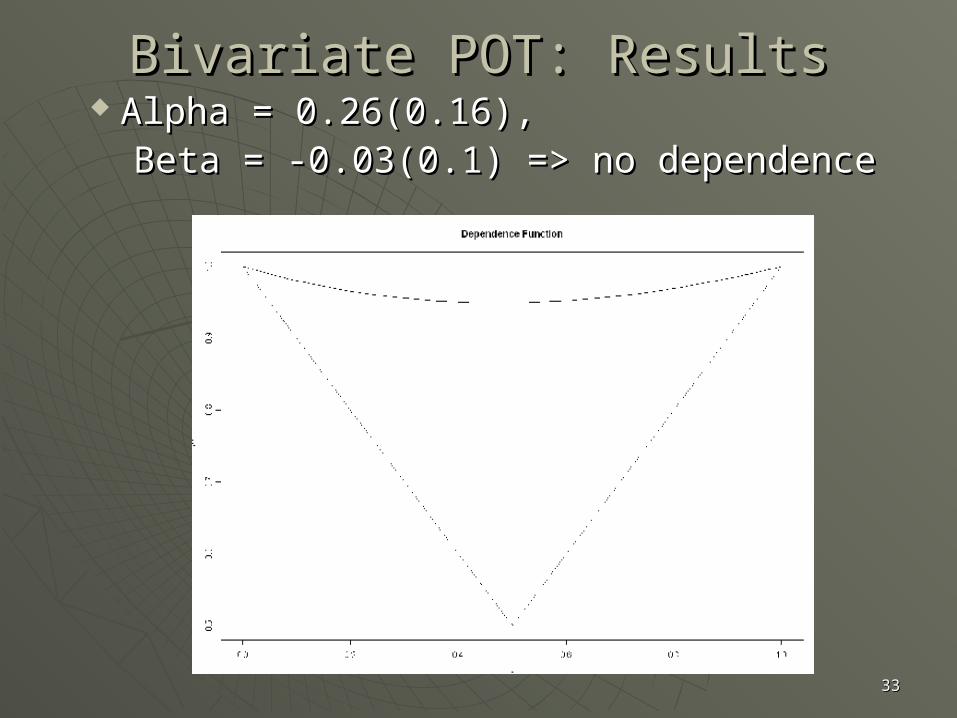
Bivariate POT: ResultsBivariate POT: Results Alpha = 0.26(0.16), Alpha = 0.26(0.16), Beta = -0.03(0.1) => no dependenceBeta = -0.03(0.1) => no dependence

3434
Bivariate POT: ResultsBivariate POT: Results
However, there can be dependence in the bottom-left However, there can be dependence in the bottom-left corner corner
3535
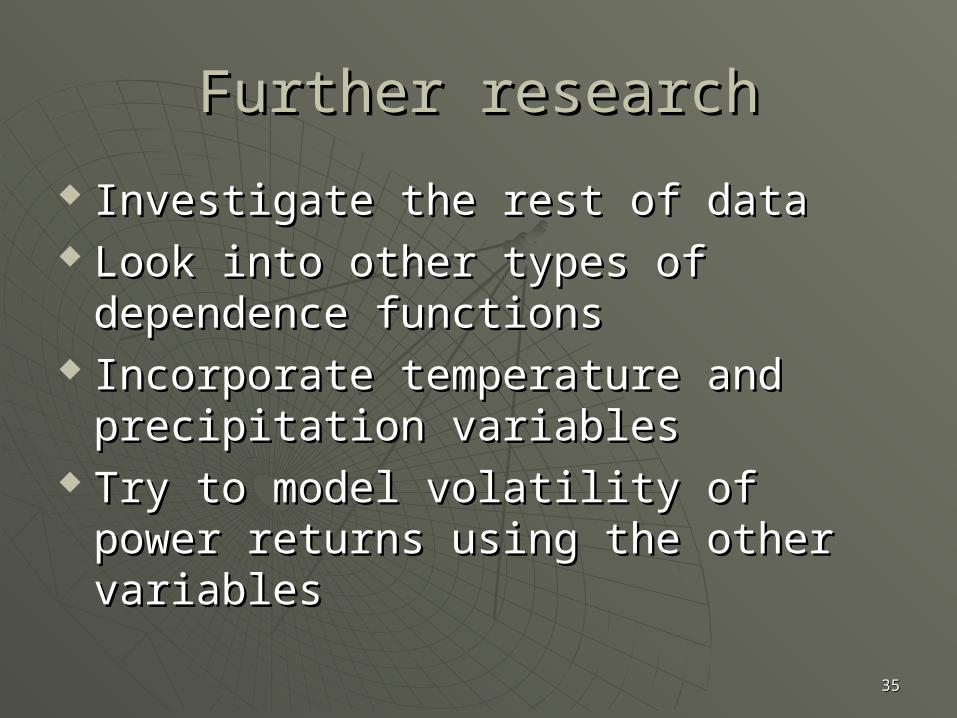
Further researchFurther research
Investigate the rest of dataInvestigate the rest of data Look into other types of dependence Look into other types of dependence
functionsfunctions Incorporate temperature and Incorporate temperature and
precipitation variablesprecipitation variables Try to model volatility of power Try to model volatility of power
returns using the other variablesreturns using the other variables
3636
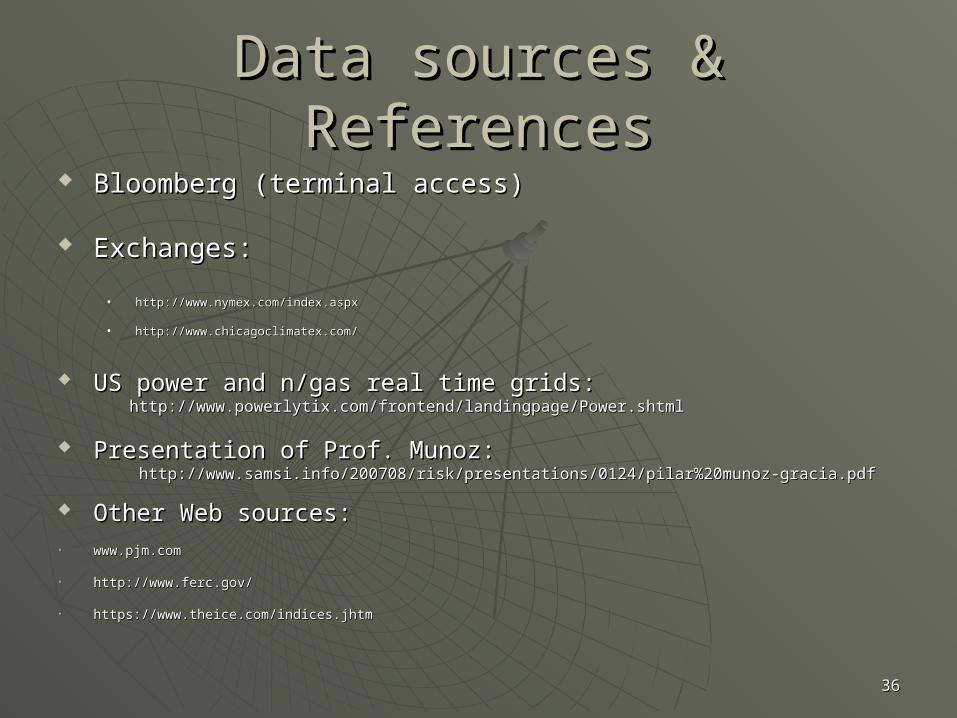
Data sources & ReferencesData sources & References Bloomberg (terminal access)Bloomberg (terminal access)
Exchanges:Exchanges:
• http://www.nymex.com/index.aspxhttp://www.nymex.com/index.aspx
• http://www.chicagoclimatex.com/http://www.chicagoclimatex.com/
US power and n/gas real time grids:US power and n/gas real time grids: http://www.powerlytix.com/frontend/landingpage/Power.shtmlhttp://www.powerlytix.com/frontend/landingpage/Power.shtml
Presentation of Prof. Munoz:Presentation of Prof. Munoz: http://www.samsi.info/200708/risk/presentations/0124/pilar%20munoz-gracia.pdfhttp://www.samsi.info/200708/risk/presentations/0124/pilar%20munoz-gracia.pdf
Other Web sources:Other Web sources: • www.pjm.comwww.pjm.com
• http://www.ferc.gov/http://www.ferc.gov/
• https://www.theice.com/indices.jhtmhttps://www.theice.com/indices.jhtm