1 the approach to performance measurement
TRANSCRIPT
THE APPROACH TOPERFORMANCEMEASUREMENT
1
1 The approach to performancemeasurement
1.1 Aims of the Review
Australian governments established the Review of Commonwealth/State ServiceProvision (the Review) to provide information on the effectiveness and efficiency ofCommonwealth, State and Territory services (see terms of reference, p. XVII).
The Review has two key roles:
• to provide ongoing comparisons of the performance of government services(which is the function of this Report); and
• to report on service provision reforms that governments have implemented or areconsidering.
The Steering Committee for the Review defines performance as how well a servicemeets its objectives, recognising the influence of external factors. This fifth Reporton Government Services contains performance information on 12 key service areas.These government services have a number of similar features:
• their key objectives are common across jurisdictions; and
• they make an important contribution to the economy and/or community.
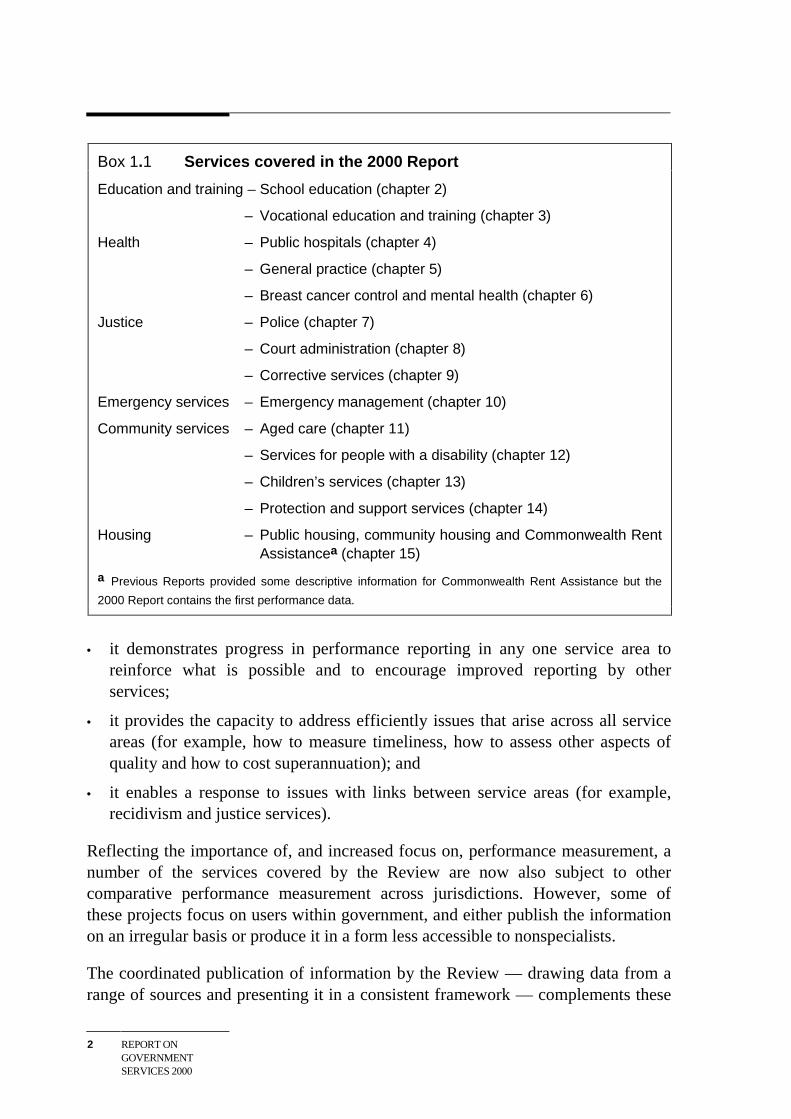
The scope of the Report is summarised in box 1.1. This year’s Report has beenextended to include performance information on Commonwealth Rent Assistance inhousing services.
Publishing performance comparisons across services in a single annual report has anumber of benefits:
• it facilitates use of a common method across services, which is convenient anduseful for people interested in more than one service area;
• it generates the opportunity to share insights into approaches to performanceassessment across services;
2 REPORT ONGOVERNMENTSERVICES 2000
Box 1.1 Services covered in the 2000 Report
Education and training – School education (chapter 2)
– Vocational education and training (chapter 3)
Health – Public hospitals (chapter 4)
– General practice (chapter 5)
– Breast cancer control and mental health (chapter 6)
Justice – Police (chapter 7)
– Court administration (chapter 8)
– Corrective services (chapter 9)
Emergency services – Emergency management (chapter 10)
Community services – Aged care (chapter 11)
– Services for people with a disability (chapter 12)
– Children’s services (chapter 13)
– Protection and support services (chapter 14)
Housing – Public housing, community housing and Commonwealth RentAssistancea (chapter 15)
a Previous Reports provided some descriptive information for Commonwealth Rent Assistance but the
2000 Report contains the first performance data.
• it demonstrates progress in performance reporting in any one service area toreinforce what is possible and to encourage improved reporting by otherservices;
• it provides the capacity to address efficiently issues that arise across all serviceareas (for example, how to measure timeliness, how to assess other aspects ofquality and how to cost superannuation); and
• it enables a response to issues with links between service areas (for example,recidivism and justice services).
Reflecting the importance of, and increased focus on, performance measurement, anumber of the services covered by the Review are now also subject to othercomparative performance measurement across jurisdictions. However, some ofthese projects focus on users within government, and either publish the informationon an irregular basis or produce it in a form less accessible to nonspecialists.
The coordinated publication of information by the Review — drawing data from arange of sources and presenting it in a consistent framework — complements these

THE APPROACH TOPERFORMANCEMEASUREMENT
3
service-specific projects. According to survey data, many Report readers use anumber of chapters. About 30 per cent of readers from line agencies use two ormore chapters, and more than half of readers from central agencies use five or morechapters (SRCSSP 1998). Moreover, service agencies may improve their ownreporting by applying insights into performance measurement in other services.
1.2 Why measure comparative performance?
There are a number of reasons for measuring the comparative performance ofgovernment services. Such services are important to the community and absorbsignificant government expenditure, so governments should be accountable for theperformance of their services. Reporting on a comparative basis can also facilitateongoing performance improvements.
Understanding the importance of government services
All government services included in this Report have some effect on thecommunity. Some services form an important part of the nation’s safety net (forexample, public housing) and some are provided to people with specific needs (forexample, aged care and disability services), while other services are typically usedby each person in the community at some stage during their life (for example,school education, police and emergency services).
Government social services are concerned with:
• improving the equitable distribution of income or wealth by providing services(or direct income transfers). This role includes the provision of services such aseducation, health, public housing, nursing home and some aged care services;
• enforcing property rights, checking abuses of power and upholding the rule oflaw. By maintaining law and order, governments are able to reduce transactioncosts in a society (Messick 1999). This role includes the work of police, thecourts and corrective services; and
• managing adverse events (such as disease and flood control). The role ofgovernment is to manage and mitigate the incidents that may have an impact onlife or property. This aspect of government services includes sanitation, publichealth and emergency services.
Government sponsored social services have a significant effect on wealth andincome equality. According to Harding (1995), for the 30 per cent of Australianswith the lowest income, the benefits from government spending on health,education and public housing amount to at least one third of their final income (after

4 REPORT ONGOVERNMENTSERVICES 2000
housing costs are deducted). Families with children and the elderly derive thegreatest benefits, primarily from education and health outlays.
The services covered in the Report absorb a significant level of governmentexpenditure. They accounted for approximately $55 billion in 1998-99 (figure 1.1),representing around 26 per cent of government expenditure in that year (equivalentto about 9 per cent of gross domestic product).
Figure 1.1 Estimated government recurrent and capital expenditure onservices covered by the Report, 1998-99a, b, c
Education ($20.5 billion)
Housing($2.9 billion) Community
services($8.4 billion)
Emergency management ($1.7 billion)
Justice ($6.1 billion)
Health ($15.4 billion)
a 1998-99 data were not available for all services: the Report uses 1997-98 data for school education, publichospitals, general practice services, public and community housing, and 1998 data for vocational educationand training. b Capital expenditure data were not available for all services; only recurrent expenditure datawere available for public hospitals, courts, corrections, fire and ambulance services, and aged care andprotection and support services. There may also be some double counting where both expenditure data(including depreciation) and capital expenditure are included. c These figures are not directly comparable tothose reported in SCRCSSP (1998b) because some service areas have used different data sources. d Healthexpenditure only includes data for public hospitals and general practice services, because includingexpenditure on breast cancer management and mental illness management would have involved some doublecounting. Expenditure on breast cancer management ($93 million in 1993-94) and mental illness management($2.1 billion in 1996-97) includes expenditure on a variety of health services, including public hospitals andgeneral practice.
Sources: Relevant chapters.
Helping improve performance
Comparative performance information can help jurisdictions identify potentialbenchmarks, strengthen incentives to improve performance, and informgovernments about the effectiveness of their current set of services (for example,the mix of prevention or early detection services relative to treatment services forbreast cancer management).

THE APPROACH TOPERFORMANCEMEASUREMENT
5
Traditionally, much of the effort to improve the effectiveness of governmentservices has focused on increasing the level of resources. This focus overlooksanother important means of enhancing services — that is, finding better ways to useexisting resources, and encouraging productivity growth. Productivity growth hashad an important influence on living standards in Australia, accounting for themajor part of the increase in real average income per person over the past threedecades (IC 1997). Innovation (the introduction of new products or processes) canbe important to productivity growth in all sectors, including government services.
Providing performance information across jurisdictions can help spread innovation(and thus facilitate performance improvement) by identifying potential jurisdictionsfrom whom other jurisdictions may learn. People involved in producing the Reportand others in the Report’s primary target audience (considered to be directors and/ormanagers responsible for strategic planning and policy planning in central and lineagencies) were surveyed in July 1998. The survey revealed that 61 per cent of lineagency users and 80 per cent of central agency users considered the Report to be‘important’ or ‘very important’ for identifying other jurisdictions with whom toshare information on services (SRCSSP 1998).
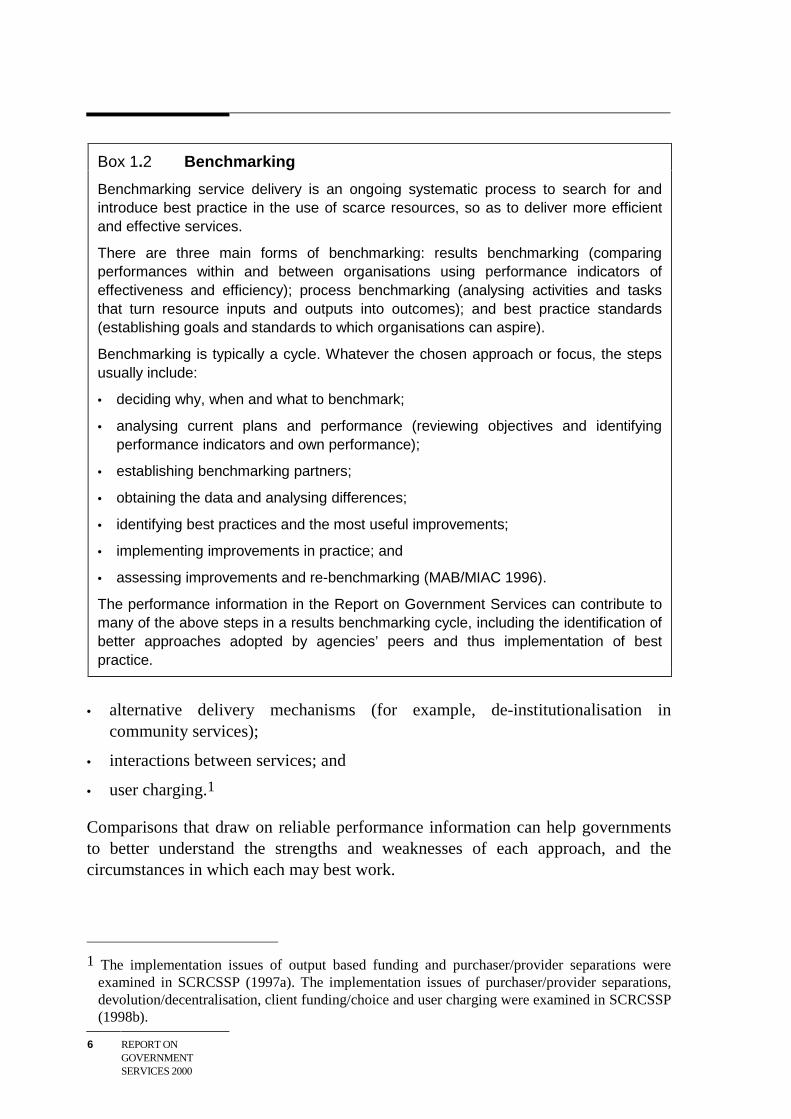
Reporting comparative performance can foster yardstick competition by promotinggreater debate about comparative performance. Performance reporting is animportant step in benchmarking (box 1.2). Reporting on comparative performancecan also help government assess whether the community is receiving the best set ofservices, and whether these services are being provided to those most in need, so asto achieve the best outcomes in the community. The 1998 survey of Report usersfound that over three quarters rated the information in the Report as ‘important’ or‘very important’ for strategic and policy planning and policy evaluation.
Performance information that aids comparisons across jurisdictions can facilitate aprocess of learning from the diversity of experience, particularly as governmentsimplement different policy approaches. Governments have considered a range ofgeneral policy approaches when deciding how to supply services in recent years.These approaches include:
• output based funding;
• purchaser/provider separations (for example, outsourcing, separation offunctions and corporatisation);
• devolution/decentralisation;
• client funding/choice;
6 REPORT ONGOVERNMENTSERVICES 2000
Box 1.2 Benchmarking
Benchmarking service delivery is an ongoing systematic process to search for andintroduce best practice in the use of scarce resources, so as to deliver more efficientand effective services.
There are three main forms of benchmarking: results benchmarking (comparingperformances within and between organisations using performance indicators ofeffectiveness and efficiency); process benchmarking (analysing activities and tasksthat turn resource inputs and outputs into outcomes); and best practice standards(establishing goals and standards to which organisations can aspire).
Benchmarking is typically a cycle. Whatever the chosen approach or focus, the stepsusually include:
• deciding why, when and what to benchmark;
• analysing current plans and performance (reviewing objectives and identifyingperformance indicators and own performance);
• establishing benchmarking partners;
• obtaining the data and analysing differences;
• identifying best practices and the most useful improvements;
• implementing improvements in practice; and
• assessing improvements and re-benchmarking (MAB/MIAC 1996).
The performance information in the Report on Government Services can contribute tomany of the above steps in a results benchmarking cycle, including the identification ofbetter approaches adopted by agencies’ peers and thus implementation of bestpractice.
• alternative delivery mechanisms (for example, de-institutionalisation incommunity services);
• interactions between services; and
• user charging.1
Comparisons that draw on reliable performance information can help governmentsto better understand the strengths and weaknesses of each approach, and thecircumstances in which each may best work.
1 The implementation issues of output based funding and purchaser/provider separations were
examined in SCRCSSP (1997a). The implementation issues of purchaser/provider separations,devolution/decentralisation, client funding/choice and user charging were examined in SCRCSSP(1998b).

THE APPROACH TOPERFORMANCEMEASUREMENT
7
1.3 Purchaser and provider roles of government
Governments manage and fund the service provision system (a ‘purchaser’ role),and may produce services (a ‘provider’ role). The purchaser and provider roles areconceptually separate. Governments may not provide services that they fund, whichinstead are delivered by external agencies (for example, charitable or for-profitorganisations).
Governments can fund externally provided services by:
• subsidising users (via rent assistance for example), who then purchase servicesfrom external providers;
• directly funding external providers (with disability services for example); or
• using a mix of these systems.
Funding from government may not meet the full cost of providing a service to thecommunity, and not-for-profit organisations or users may also contribute funding(see further discussion in box 1.3 in section 1.4).
This Report examines performance for the service elements for which governmentis responsible and accountable. Thus, where government is a purchaser,performance of the service provision system as a whole is reported; wheregovernment is also a service provider, performance is also reported at an operationallevel.
The focus of the Review is on government expenditure linked to the purchase orsupply of specific services rather than general government income support. Thus,the Report covers aged care (but not the aged pension), disability services (but notdisability pensions) and children’s services (but not family payments).
1.4 Approach to reporting performance of services
A number of the objectives (or desired outcomes) for each government-fundedservice are similar across jurisdictions, although the priority that jurisdictions giveto each objective may differ. The Steering Committee’s approach to performancereporting is to focus on the extent to which each shared objective for a service hasbeen met.
The basic relationship between objectives, inputs, outputs and outcomes is asfollows:
• governments have a number of desired community outcomes;

8 REPORT ONGOVERNMENTSERVICES 2000
• to achieve these outcomes, governments fund service providers and products;
• service providers transform these funds/resources (inputs) into services(outputs); and
• the outputs contribute to the achievement of a government’s desired outcomes(figure 1.2).
Figure 1.2 Service process
Program or serviceobjectives/desired
outcomes Inputs Outputs Actual outcomes
Improved health of the community
Recurrentexpenditure
(labour and other costs)Assets
Case mix adjusted separations
Improved health of the community
Example: public hospitals
Source: Adapted from Commonwealth Department of Finance (1994).
The Steering Committee has developed a general framework for performanceindicators (figure 1.3). Within the framework, performance is assessed in terms ofeffectiveness and efficiency. Effectiveness relates to how well a service achieves itsdesired outcomes, and efficiency relates to how well governments use theirresources to produce units of services.
Effectiveness indicators in this Report cover:
• overall outcomes;
• access and equity;
• appropriateness; and
• quality.
The generally used indicator of efficiency is the level of government inputs per unitof output.
Service provision can involve a tradeoff between effectiveness and efficiency.2 Achange in service delivery may increase the level of resources per unit of output (adecrease in measured efficiency) but lead to better outcomes; for example, astandard unit of service may be less costly to produce but less effective in meeting
2 The Review has adopted the effectiveness and efficiency terms common in the program
evaluation literature.

THE APPROACH TOPERFORMANCEMEASUREMENT
9
each client’s specific needs. Thus, performance assessment should consider bothefficiency and effectiveness indicators.
Adding to performance information, each chapter also includes descriptiveinformation about services and the context of their delivery, a discussion of futuredirections in performance reporting, and comments from each jurisdiction.
Figure 1.3 A general framework and examples of performance indicators
Effectiveness
Outcomes
Access and equity
Quality
Efficiency Inputs per output unit
Appropriateness
PERFORMANCE
Skill profile (vocational
education and training)
Waiting times (aged care)
Variations in intervention rates
(health)
Condition of housing stock (housing)
Cost per case (courts)
Outcomes
Outcomes refer to the consequences of a service. They should reflect the objectivesof a service, so it is important to measure performance in relation to outcomes.Outputs are the services delivered by, or on behalf of, government for clients.
Some indicators could be described as outcome or output indicators. In correctiveservices, for example, the secure housing of prisoners is a prison output but also anoutcome indicator (linked to the objective of containment and supervision). If thereis an established link between the indicator and the objective, then the indicator has

10 REPORT ONGOVERNMENTSERVICES 2000
validity as a performance indicator regardless of whether it is output or outcomerelated.
Outcomes may be short term or longer term. Short term outcomes are usually moreclosely linked to the services, whereas longer term outcomes can be more affectedby other factors — for example, in child protection:
Long term outcome measures … are vital for showing what happens in children’s lives,but they have considerable weaknesses as a stand-alone measure of the effectiveness ofchild welfare services since many factors help shape the circumstances of a child’s life.(Gain and Young 1998, p. 3)
Outcomes may also be intermediate or final. The issue again is the closeness of thelink to the services. A police random breath testing program, for example, mayachieve the intermediate outcome of fewer drunk drivers, but the final outcome ofreduced road deaths will also could be affected by other factors such as the qualityof cars and roads.
The approach in this Report is to:
• use both short term (or intermediate) and long term (or final) outcome indicators;and
• explain that the service is only one contributing factor and, where possible, pointto data on other possible factors (for example, see appendix A).
The Steering Committee draws on line agency experience (accessible throughservice-specific working groups) and on external expertise and internationalexperience to develop outcome approaches and indicators for specific services. TheSteering Committee has released its work in each case quickly (typically on its Webpage) so others can comment and draw on work to date. This approach has aidedtimely improvements in the indicators.
During 1999 the Steering Committee commissioned an international literaturereview of relevant client satisfaction survey methods for children’s services (seechapter 13). The client satisfaction survey in disability services (see chapter 11) wasan outcome of an international literature review (also commissioned by the SteeringCommittee) of relevant client satisfaction survey methods (E-Qual 1998).Improvements in outcome indicators for protection and support services (seechapter 14) have been guided by an international literature review and criticalanalysis of child protection and alternative placement outcome indicators (Gain andYoung 1998).
Such work reflects the Steering Committee’s preference for drawing on existingdevelopments where possible. It also reflects the Steering Committee’s open

THE APPROACH TOPERFORMANCEMEASUREMENT
11
approach to the development of information. This approach is likely to allow morerapid implementation of improved performance indicators, reduce developmentcosts, facilitate iterative improvements, and possibly enable comparisons withresults overseas.
Access and equity
Achieving access to services is an important reason for government to fundservices. The objective may be to ensure access by all in the community (forexample, school education and police services) or access by a particular targetgroup (for example, housing services for those having difficulties accessing housingin the private sector).
Access has two main dimensions: preventing discrimination and preventing unduedelay or cost. This Report focuses on:
• service provision to those who may have special difficulties accessing services;and
• service timeliness and affordability.
Groups with special difficulties
A number of criteria can be used to classify those who may have special difficultiesin accessing government services. These include:
• language or literacy proficiency;
• gender;
• age;
• physical or mental capacity;
• race or ethnicity; and
• geographic location.
In May 1997, the Prime Minister (with the support of the Premiers and ChiefMinisters) requested that the Review give particular attention to the performance ofmainstream services in relation to Indigenous Australians. (Table 1.3 in section 1.5summarises the progress in this area.)
Information on access by groups with special difficulties can be useful for tworeasons. First, if government aims to provide access to all groups, then informationon the extent to which people from groups with special difficulties are able toaccess services can help determine whether special strategies are needed to address

12 REPORT ONGOVERNMENTSERVICES 2000
access barriers. Second, if government has already implemented such strategies,then their effectiveness can be assessed.
Identifying service recipients as members of groups with special difficulties poseschallenges, particularly when relying on client self identification. If members ofsuch groups are required to identify themselves, the accuracy of the data will partlydepend on how a group perceives the advantages (or disadvantages) ofidentification and whether these perceptions change over time. Varying definitionsof these groups in data collections across jurisdictions and service areas may alsocreate comparability problems.
The Report often uses the proportion of each target group in the broader communityas a proxy indicator of the group’s need for a particular service. This simpleassumption is clearly sensible for some services (for example, schools), but itshould be treated with caution for other services (for example, aged care). Anotheroption is to collect more direct indicators of need (for example, the SupportedAccommodation Assistance Program collects data on the characteristics of thoseseeking assistance).
Where geographic location is used to identify groups with access difficulties, accessis normally compared for metropolitan, rural and remote areas. These geographicclassifications are based on population density and distances to large populationcentres (DPIE and DHSH 1994). Such comparison by location has been criticisedbecause it is an imperfect indicator of the time and cost spent reaching the point ofservice. Further, it does not consider the client’s capacity to bear the cost ofreceiving the service (Griffith 1998). However, locations would then be classifieddifferently depending on the service, because each service may not be available atthe same location.
Timeliness and affordability
Timeliness and affordability can also be important access issues for those in thecommunity who rely on publicly funded services. Timeliness indicators used tomeasure access in this Report include waiting times (for example, in publichospitals and for aged care services). Affordability indicators relate to theproportion of income spent on particular services (for example, out-of-pocketexpenses in children’s services).
Appropriateness
Appropriateness relates to how well service delivery directly meets client needs. Anappropriateness indicator for the Supported Accommodation Assistance Program,
THE APPROACH TOPERFORMANCEMEASUREMENT
13
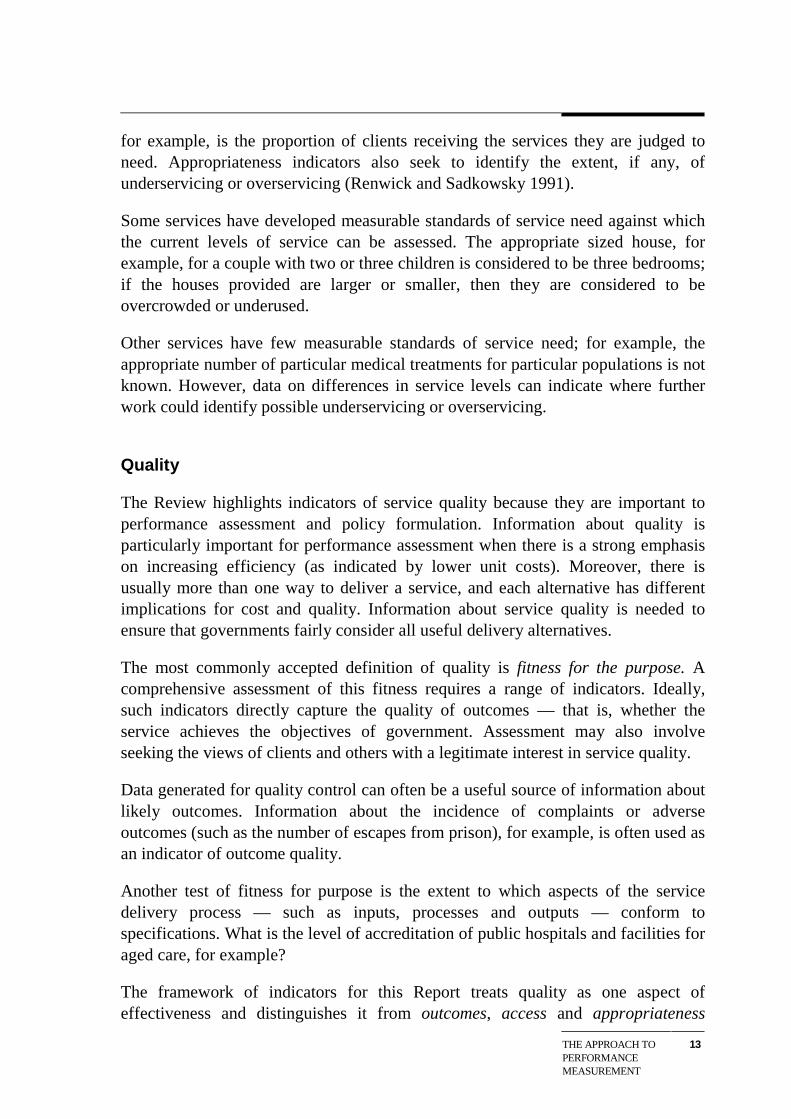
for example, is the proportion of clients receiving the services they are judged toneed. Appropriateness indicators also seek to identify the extent, if any, ofunderservicing or overservicing (Renwick and Sadkowsky 1991).
Some services have developed measurable standards of service need against whichthe current levels of service can be assessed. The appropriate sized house, forexample, for a couple with two or three children is considered to be three bedrooms;if the houses provided are larger or smaller, then they are considered to beovercrowded or underused.
Other services have few measurable standards of service need; for example, theappropriate number of particular medical treatments for particular populations is notknown. However, data on differences in service levels can indicate where furtherwork could identify possible underservicing or overservicing.
Quality
The Review highlights indicators of service quality because they are important toperformance assessment and policy formulation. Information about quality isparticularly important for performance assessment when there is a strong emphasison increasing efficiency (as indicated by lower unit costs). Moreover, there isusually more than one way to deliver a service, and each alternative has differentimplications for cost and quality. Information about service quality is needed toensure that governments fairly consider all useful delivery alternatives.
The most commonly accepted definition of quality is fitness for the purpose. Acomprehensive assessment of this fitness requires a range of indicators. Ideally,such indicators directly capture the quality of outcomes — that is, whether theservice achieves the objectives of government. Assessment may also involveseeking the views of clients and others with a legitimate interest in service quality.
Data generated for quality control can often be a useful source of information aboutlikely outcomes. Information about the incidence of complaints or adverseoutcomes (such as the number of escapes from prison), for example, is often used asan indicator of outcome quality.
Another test of fitness for purpose is the extent to which aspects of the servicedelivery process — such as inputs, processes and outputs — conform tospecifications. What is the level of accreditation of public hospitals and facilities foraged care, for example?
The framework of indicators for this Report treats quality as one aspect ofeffectiveness and distinguishes it from outcomes, access and appropriateness

14 REPORT ONGOVERNMENTSERVICES 2000
(figure 1.3). However, this distinction is somewhat artificial because other aspectsof service provision — except efficiency (unit costs), quantity of outputs(throughput) and access (targeting) — have the potential to contribute to ameaningful picture of quality.
No perfect indicator of service quality exists; each has its own strengths andweaknesses. Selection of an indicator requires trading off desirable characteristics(such as timeliness, cost and validity) against each other. The approach here is toconsider the use of acceptable, albeit imperfect, quality indicators that are already inuse or available in Australia or internationally. Adopting these indicators can lowerdevelopment costs and, equally importantly, reduce delays in the implementation ofquality indicators.
Efficiency
Efficiency relates to how well organisations use their resources to produce units ofservices. This Report mostly focuses on achieving better value for the broadercommunity from the use of government resources, so government funding per unitof service is typically used as the efficiency indicator — for example, recurrentfunding per annual curriculum hour for vocational education and training. However,such an efficiency indicator should not be interpreted as encompassing a service’sfull cost to society (box 1.3).
Where possible, full unit costs are used as the indicator of efficiency. However,where there are shortcomings in the existing data, other indicators of efficiency(including partial productivity ratios such as staff level per student in governmentschools and assets per prisoner in corrective services) are used.
Comparisons of unit cost of a service are a more meaningful input to public policywhen they use the full cost to government, accurately accounting for all resourcesconsumed in providing the service. Problems can occur when some costs ofproviding services are overlooked or treated inconsistently (for example,superannuation or overheads). The Steering Committee believes data, where fullcost information is not available in the short term, should at least be calculatedconsistently across jurisdictions. Further, treatment should be fully transparent.

THE APPROACH TOPERFORMANCEMEASUREMENT
15
Box 1.3 Cost to government and to non-government organisations
The Report seeks, where possible, to provide information about the cost of services togovernment. Some argue that if non-government groups such as charities alsocontribute resources for the services covered by the Report, then these costs shouldbe taken into account.
The purpose of this Report is to provide information to assist government decisionmaking. The relevant cost information depends on the type of assessment that needsto be made to support a decision. When government directly delivers services it maywish to assess the internal management of the service; on other occasions it may wishto assess the decision to deliver directly or purchase the service, or even the choice offrom whom to purchase (or part fund or subsidise).
Sometimes a charitable organisation will offer to deliver a service at a lower price togovernment than the cost of an equivalent government provider, even though thecharity uses at least as many resources as used by the government provider. Thecharitable organisation may be able to charge less because it operates the service asan adjunct to another activity, or because it has access to resources such asdonations, church buildings or volunteers. If all inputs were costed at ‘normal’ marketrates, a not-for-profit provider may be as costly — in some instances, more costly —than a government agency.
If a government delivers services directly, it is accountable for all resources used (andthis Report tries to ensure all costs are included). If a government decides to purchase,part fund or subsidise services, it should aim to maximise the benefit to the communityfrom this use of government funds. When focusing on government decision making inthe role of direct service provider, the Report aims to compare the full cost ofgovernment service delivery in each State and Territory. This allows governments tocompare the internal management of their services with that of their counterparts inother jurisdictions.
The Report also compares the cost to government of services delivered by non-government and government service providers; this information allows governments toassess their purchase decisions. This Report has not sought to facilitate comparisonsbetween the internal management of government delivered services and that of non-government providers. As a result, it has not attempted to compare the full cost ofdelivery by non-government organisations with the full cost of delivery by governmentservice providers.
Consequently, for services delivered by non-government agencies, this Reportemphasises the costs to government, along with outputs, outcomes and servicequality.

16 REPORT ONGOVERNMENTSERVICES 2000
1.5 Developments in performance measurement
Developments in 1999
This is the fifth Report on Government Services produced by the Review. Reportingis an iterative process and each year the Steering Committee endeavours to build ondevelopments in previous years. Developments in 1999 occurred in:
• the quality and comparability of the data — the quality of financial data hasimproved for emergency management, corrective services, vocational educationand training, public acute care hospitals and services for people with a disability;the quality of effectiveness data has improved for general practice and breastcancer management;
• new indicators — reporting for police has been separated into four servicedelivery areas with ten new indicators (and reporting for many of these); newoutcome, quality and efficiency indicators have been developed for childprotection and supported placements (with some reporting); four new indicatorshave been developed for aged care (with reporting); there are two newperformance indicators for general practice, four for breast cancer managementand one in mental health services;
• the refinement of existing indicators — one indicator was further developed forcourt administration; a client and carer views survey was undertaken for servicesfor people with a disability (with reporting); a pilot client views survey wasundertaken for community housing (with reporting for two participatingjurisdictions); the scope of the employer views survey has been expanded forvocational education and training; two indicators were redefined and aconsultancy investigating the feasibility of undertaking a client views survey wasundertaken for children’s services;
• reporting on existing indicators — client views survey results for the FamilyCourt of Australia, WA and NSW have been reported in court administration;first-time performance reporting has been included for Commonwealth RentAssistance; data on preschools providing nonstandard hours of care have beenincluded for children’s services; there has been improved reporting of fourindicators for acute care hospitals and ten indicators for general practice; thereare new data on year 12 completion rates by target group for school education;and
THE APPROACH TOPERFORMANCEMEASUREMENT
17
• contextual information — there is a summary of State based assessments oflearning outcomes by year, subject area and target group for school education;there is policy information on specialist courts, Indigenous access to the courtsystem and technological access to court services for court administration; andthere is information on accreditation in centre based long day care, and servicesby management type for children’s services.
The effort to improve reporting has benefits for other public policy initiatives. Thefocus on identifying and monitoring outputs and outcomes, for example, aligns withmoves across government to output based funding. These types of performanceindicators are also routinely identified in service charters.
Full costing of services
As mentioned earlier, it is the objective of the Review to account for the full cost togovernment for the funding or delivery of services. Reporting of full costs improvesthe comparability of efficiency measures across jurisdictions and services. Where itis not yet possible to account for the full range of costs, the Review seeks to reportcosts on a comparable basis. The Steering Committee has identified three priorityareas for improving the comparability of costs across several services:
• including superannuation on an accrual basis;
• accounting for differences in the treatment of payroll tax; and
• including the full range of capital costs (both the user cost of capital and thedepreciation of non-current physical assets).
The treatment of superannuation is a significant issue when measuring the unit costfor many services because it often makes up a major component of overall costs andcan be treated differently across services and jurisdictions. The Review researchedthe current treatment of superannuation costs and developed approaches to improveits treatment (SCRCSSP 1998c). The Review is helping services to improve theconsistency of treatment of superannuation in cost estimates. The extent to whichindividual agencies consistently report actuarial estimates of superannuation costsdepends on the implementation of accrual accounting systems by jurisdictions.
Payroll tax makes up a small but significant part of the reported cost of manygovernment funded and delivered services. It is particularly significant for serviceswith a high proportion of labour costs, and can be around 5 per cent of total servicecosts. Consequently differences in the treatment of payroll tax can affect thecomparability of unit costs across jurisdictions and services. Differences occur inpayroll tax exemptions, marginal tax rates and tax-free thresholds, and clawbackarrangements. Accounting for the effect of payroll tax on unit costs is important for
18 REPORT ONGOVERNMENTSERVICES 2000
improving the comparability of the unit costs of private and public serviceproviders.
A Steering Committee paper (SCRCSSP 1999b) recommended two approaches toimprove the comparability of cost data. The first is to include a hypothetical payrolltax amount in cost estimates for exempt services. This approach is to be used whenthe majority of services are taxable, and it is most appropriate where private sectorproviders are also subject to payroll tax. This is the recommended strategy forreporting on vocational education and training, corrective services, emergencymanagement, and public and community housing services.
The second approach involves deducting the payroll tax amount from the costs ofthose government services that are taxable. This approach is to be used where themajority of services are tax exempt, and it is most appropriate where private sectorproviders are either exempt from payroll tax or fall below the payroll tax-freethreshold, or where there are no private providers. This is the recommended strategyfor reporting on schools, health services, police, court administration, aged careservices, disability services, children’s services, and protection and support services.(Individual chapters note whether these two approaches were able to beimplemented for this Report.)
Capital costs in an accrual sense comprise two distinct cost elements —depreciation and the user cost of capital. The focus is on the capital used in aparticular year rather than the cash expenditure incurred in its purchase (forexample, the purchase costs of a new building). Depreciation is defined as theannual consumption of non-current physical assets used in providing governmentservices. The user cost of capital is the opportunity cost of funds tied up in thecapital used to deliver services (for example, houses in public housing).
It is important to fully incorporate capital costs, wherever possible, in costcomparisons. Capital costs are often a significant component of the cost of services,and they are currently treated inconsistently (costed in full for contracted elementsof service delivery but effectively costed at zero for services traditionally deliveredby budget sector agencies).
The comparability of unit costs is improved when depreciation costs are reported onan accrual basis. Community housing is still reporting under a cash accountingregime, while others are in transition, with data that is partly on a cash basis andpartly accrual. Where services report recurrent expenditure under cash accounting,unit costs tend to be underestimated. To improve the comparability of unit costsacross services and jurisdictions, the Steering Committee decided that the user costof capital rate should be applied to all non-current physical assets and workingcapital, less the costs of government capital charges and interest on borrowings. The

THE APPROACH TOPERFORMANCEMEASUREMENT
19
user cost of capital rate would be based on a weighted average of rates nominatedby jurisdictions (currently 8 per cent).
Other costing issues include the apportionment of costs that are shared acrossservices, and the treatment of revenues. In most services, the available data allowreporting of net costs to government, but in some areas it has not been possible toaccount for revenues (notably, unit cost data for public hospitals). Moreover, forsome services, it may be appropriate to examine both the gross cost (to assess theefficiency of government providers) and net costs (to assess the efficiency ofgovernment decisions to purchase from their own agencies effectively).
Table 1.1 provides an overview of the current status of some key elements thataffect the comparability of costs in the Report.
Table 1.1 Progress of unit cost comparability in the Report
For the majority of jurisdictionsa
What is theaccountingregime?b
Is depreciationincluded?
Is the user costof capitalincluded?
Is superincluded on anaccrual basis?
Is payroll taxtreated in aconsistentmanner?
School education Transition x x x ✓
Vocational educationand training
Accrual ✓ ✓ ✓ ✓
Public hospitals Accrual x x ✓ ✓
General practicec Accrual .. .. .. ..Health management Accrual x x na naPolice services Accrual ✓ ✓ ✓ ✓
Court administration Accrual ✓ ✓ ✓ ✓
Corrective services Accrual ✓ ✓ ✓ ✓
Fire services Accrual ✓ x na naAmbulance services Accrual ✓ x na naAged cared .. .. .. .. ..Disability services Transition x x x xChildren’s services Transition x x na naChild protection na na x na xSupported placementsd .. .. .. .. ..Supported accomm.
and assistanced.. .. .. .. ..
Public housing Accrual ✓ ✓ na ✓
Community housing Cash x x na naCommonwealth Rent
AssistancecAccrual .. .. .. ..
a ✓ Majority of jurisdictions have included this item or reported it separately, or included superannuation on anaccrual basis. x Majority of jurisdictions have not included or reported this item, or not includedsuperannuation on an accrual basis. b Accrual: majority of jurisdictions reported in accrual terms for this year.Cash: majority of jurisdictions reported in cash terms for this year. Transition: majority of did not report oneither a pure cash or accrual basis. c Costs comprise mostly Commonwealth transfer payments to privateservice providers or households. d Costs comprise mostly Commonwealth or State/Territory transferpayments to service providers or households. na Not available. .. Not applicable.
Sources: Relevant chapters.

20 REPORT ONGOVERNMENTSERVICES 2000
Progress on reporting indicators
To simplify comparisons across service areas, effectiveness indicators in eachservice area can be generally grouped under the four broad headings: overalloutcomes, access and equity, appropriateness and quality (table 1.2). Some serviceareas have not explicitly adopted these four broad effectiveness headings in theirframeworks. Emergency management, for example, has adopted the PPRR(prevention and mitigation, preparedness, response and recovery) framework.However, the four broad headings are still relevant. The dollar loss from fires couldbe considered a dimension of overall outcome for fire services, for example. Wherethe general framework is not adopted, indicators have been judged as to whetherthey may fit under the general framework’s broad headings.
The information presented does not assess the quality of the indicator (including itscomprehensiveness). Table 1.2 merely indicates the first year when at least oneindicator under each broad heading has been reported on a comparable basis. Forschool education, for example, data on learning outcomes for middle primary schooland junior secondary school in mathematics and science were reported in 1997.However, the Steering Committee does not regard these data as satisfying reportingrequirements for outcome indicators, because the data are from an irregularinternational exercise.
Table 1.2 illustrates differences in current reporting across services. Many servicesface similar reporting challenges despite some recent improvements (partly drivenby the need to measure outputs and to demonstrate the maintenance of quality inpurchaser/provider and contracting arrangements).
Progress on reporting on performance in relation to Indigenous Australians
In May 1997, the Prime Minister (with the support of all Premiers and ChiefMinisters) asked the Review to give particular attention to the performance ofmainstream services in meeting the needs of Indigenous Australians. Improvingreporting of Aboriginal and Torres Strait Islander peoples’ access to mainstreamservices is a priority for all areas of the Review. This is also an important priorityfor a number of ministerial councils and their related performance reportingactivities. The Ministerial Council for Aboriginal and Torres Strait Islander Affairsendorsed the approach of using the Review to encourage better reporting in thisarea.

THE APPROACH TOPERFORMANCEMEASUREMENT
21
Table 1.2 First reporting of at least one comparable indicatora, b
When at least one national comparableindicator was first reportedc
Framework service
Firstcoverageof service
Overalloutcomes
Accessand
equityAppro-
priateness QualityClientviews Efficiency
School education 1995 1995 na na na na 1995Vocational
education andtraining
1995 1995 1995 1995 1995 1995 1997
Public hospitals 1995 na 1995 1995 1995 na 1995Police services 1995 1995 1999 na 1995 1997 1997Court administration 1995 na 1995 na 1995 na 1995Corrective services 1995 1995 1998 na 1995 na 1995Child protection 1995 na na na na na naSupported
placements1995 na na na 1997 na na
Supportedaccommodationand assistance
1995 1998 na 1999 1998 na na
Public housing 1995 1995 1995 1995 1997 1997 1997Aged care services 1997 na 1999 2000 2000 2000 2000Services for people
with a disability1997 1997 1997 1997 2000 2000 na
Children’s services 1997 na 1997 na na na naCommunity housing 1997 na na na na na naBreast cancer
management1998 2000 2000 na 2000 na na
Fire services 1998 1999 na na na 2000 naAmbulance services 1998 na na na na 2000 naGeneral practice 1999 1999 1999 2000 2000 na 2000Mental health
services1999 1999 na 1999 2000 na 1999
CommonwealthRent Assistance
1999 2000 2000 2000 2000 2000 2000
a In the Report on Government Services. b Not all frameworks in this Report necessarily follow the generalframework set out in figure 1.3. However, all service types should be reporting on indicators that cover thesegeneral areas. Where this framework is not followed, an estimate has been made as to whether any indicatorshave been reported in these areas. c Refers to year in which Report was published, not year of data. na Notavailable.
Sources: SCRCSSP (1995, 1997b, 1998b, 1999c).
More complete and consistent information on the access of Indigenous people tomainstream services can help improve policy by:
• contributing to assessments of progress towards the objective of ensuring thatIndigenous Australians receive no less a provision of services than that for otherAustralians;
• influencing the development of improvements in programs and the allocation ofresources; and

22 REPORT ONGOVERNMENTSERVICES 2000
• underpinning a more whole-of-government approach to developing clear andagreed outcomes, methods for joint planning and compatible monitoringprocesses (AADWA 1999).
The Ministerial Council has endorsed strategies which will enable the developmentof improved reporting in coordination with the Review process. Aboriginal affairsdepartments in all jurisdictions will work to actively identify potential indicatorsand, where possible, existing data sources. Each of the Review’s relevant service-specific working groups will consider during 2000 the feasibility of reporting andimplementation, with the aim of hastening improvements in reporting for the 2001Report.
The Australian Bureau of Statistics has put in place an ongoing program to developand improve Indigenous data flowing from Commonwealth and State and Territoryadministrative systems. The bureau is working with other agencies to ensure thatIndigenous identifiers are included in relevant systems and that the ensuing statisticsare of adequate quality. Initial priority is being given to the improvement of birthsand deaths statistics in all States and Territories. Other priorities include hospitals,community services, education, housing and law and justice statistics. TheAustralian Bureau of Statistics is also working with other agencies to develop andsupport National Indigenous Information Plans, Indigenous performance indicatorsand Indigenous task forces on a number of topics. The Health Ministers’ AdvisoryCouncil, for example, approved a list of proposed indicators in March 1998 and theprocess of evaluating and refining the indicators is expected to be finalised by 2000,after which reporting will commence.
The Australian Bureau of Statistics is also working towards improving the qualityof Indigenous data from the 2001 Census. In parallel, it is expanding its HouseholdSurvey Program to collect more regular Indigenous statistics, including regularIndigenous general social surveys, Indigenous sample supplementation in regularhealth surveys, and annual Indigenous labour force estimates. The Review will drawon these initiatives in future Reports.
This important task is complicated by the administrative nature of many datacollections that do not distinguish between Indigenous and non-Indigenous clients.The level of self identification of Indigenous persons appears to vary acrossjurisdictions, while the form of questions used to identify Indigenous status stilldiffers but is becoming more consistent based on the Australian Bureau ofStatistics’ recommendations.
There are data on services to Indigenous clients, although the extent of reportingvaries across both services and jurisdictions. Table 1.3 provides a stocktake,indicating which services and jurisdictions have at least partial data included in this

THE APPROACH TOPERFORMANCEMEASUREMENT
23
Report. The table also shows whether the data available are descriptive, whetherthey relate to performance directly and, if so, whether similar data are available forall jurisdictions. It does not signify the quality of that data.
Table 1.3 Data in this Report on services to Indigenous clientsa
Similar data Additional State-specific data
Framework serviceavailable for all
jurisdictionsb NSW Vic Qld WA SA Tas ACT NT
School education D P P P Pf ** ** ** **Vocational education and
trainingcDP ** ** ** ** ** ** ** **
Public hospitals Pf Pf Pf Pf Pf Pf na Pf Pf
Breast cancer management Pf ** ** ** ** ** ** ** **General practice na na na na na na na na naMental health services na na na na na na na na naPolice services P ** ** P P P P P PCourt administration na na na na na na na na naCorrective services DfP ** ** ** ** ** ** ** **Fire services na na na na D na na na DAmbulance services na na na na na na na na naAged care servicesd DP ** ** ** ** ** ** ** **Services for people with a
disabilityeDP ** ** ** Pf ** ** ** **
Children’s services DP ** ** ** ** ** ** ** **Child protection D ** ** ** ** ** ** ** **Supported placements na DP na DP DP DP DP DP DSupported accommodation
and assistanceDP ** ** ** ** ** ** ** **
Public housing na D D D D D D D DCommunity housing na Df na Df na na Df Df Df
Commonwealth RentAssistance
DfPf ** ** ** ** ** ** ** **
a D means descriptive data are reported (for example, number of clients or total expenditure); P meansperformance indicators are reported. b Refers to where data on an indicator or descriptor are available forevery State or Territory but are not necessarily perfectly comparable. c Subject to different average modulecompletion durations and competencies achieved by students across jurisdictions. d Persons listing theirIndigenous status as unknown have been distributed pro rata. e Relies on ‘snapshot day’ data, which may notbe a typical of an average day. f New for 2000 Report. na Not available, meaning no relevant information onIndigenous persons’ access to services is available in this area. ** No State-specific data are available for thisservice in addition to descriptive data or indicators for every State or Territory.
Sources: Relevant chapters.
1.6 Interpreting performance indicators
The Report aims to present performance indicators that allow users to assessperformance. Many government objectives involve tradeoffs, such as choosingwhether to improve the average level of service or better target services to those

24 REPORT ONGOVERNMENTSERVICES 2000
most in need. The Steering Committee cannot know each government’s priorities,tradeoffs or targets, which may change over time. Presenting performanceindicators as a suite encourages users to assess performance on all indicatorscollectively, rather than by individual indicator. Moreover, each user is left to judgethe appropriate tradeoffs between objectives.
The use of reported information to assess performance must also account for otherimportant issues. The broader environment in which a service operates affects theperformance of each service in each jurisdiction. There may be significantdifferences in clients, available inputs, prices and geography, and any comparisonof performance across jurisdictions needs to consider these differences.
To help identify and account for environmental differences, the Report includes adescriptive statistics appendix (see appendix A). This appendix provides a range ofgeneral descriptive information for each jurisdiction, including age profile,population distribution, income levels, education levels, tenure of dwellings, andcultural heritage (such as aboriginality and ethnicity). It has two parts: a descriptionof the main distinguishing characteristics of each jurisdiction, and a set of sourcetables which will help users to compare jurisdictional performances.
The Steering Committee does not adjust results provided by jurisdictions fordifferences that may affect service delivery. Rather, it leaves this task to users whocan better make the necessary judgments, maybe having additional informationabout their jurisdiction’s circumstances or priorities. The Commonwealth GrantsCommission adopts a different approach, but this reflects its different role (box 1.4).
When comparing performance information across jurisdictions, users also need toconsider the effect of differences and variations in the quality of data collectionmethods and systems. Data on the use of disability services, for example, related toa snapshot day for some jurisdictions, but to a 12-month period for WA. Definitionsof terms may also vary, such as the definitions of notification in child protection.Notes to tables or figures highlight differences in data collection methods ordefinitions.
One particularly important aspect of government services is how they collectivelyaddress social issues (box 1.5) and community needs that require integratedservices. All services in the Report have some form of interaction with otherservices (for example, police and courts). There are challenges in using theindividual service-focused measurement frameworks to assess the performance ofthese interactions. The Steering Committee has made some progress in this matterin the justice sector where performance indicators for the sector as a whole arepresented (see ‘Justice preface’). However, similar approaches for other groups of

THE APPROACH TOPERFORMANCEMEASUREMENT
25
services are likely to prove more difficult. Overall, consistent approaches tocommon issues of performance reporting will help.
Box 1.4 Adjusting results for external factors — the CommonwealthGrants Commission approach
The Commonwealth Grants Commission (like the Review) collects and publishes dataon actual expenditure across a range of government services. The terms of referenceof both lead to some expenditure being excluded. The Grants Commission excludes,for example, expenditure associated with some specific purpose payments, while theReview does not cover some government services.
However, the Grants Commission also publishes data adjusted to account fordifferences (or ‘disabilities’) outside the control of the States that influence either theirrelative demand for services or their unit cost of providing them. It adjusts levels ofexpenditure for things such as:
• input costs (mainly, the cost of labour);
• scale of operations (at both central offices and service delivery sites);
• geographic dispersion of the population; and
• differences in the client mix (the proportion of clients of various ages, or from anIndigenous or non-English speaking background).
This approach reflects the Grants Commission’s role of recommending the distributionof general revenue assistance to States and Territories. This role requires it todetermine adjustments to the Australian average expenditure that would allow eachState to provide the same level of service if it achieved the same level of efficiency. Ituses the best available information on disabilities to make these adjustments, butrecognises the data are ‘often incomplete or fragmentary, broad-brush orimpressionistic, or indicative rather than precisely relevant’. As a result, it notes there isfrequently a considerable role for informed judgment about the extent of disability thateach State faces in providing services (p. 10).
In contrast, the role of the Review allows it to leave others to judge the extent to whichvariation in results reflects factors outside a State’s control or differences inperformance. The Review seeks to provide the best set of information available (whichis still inevitably incomplete) which can be combined with local knowledge aboutcircumstances and policy priorities. The data can then be adjusted in ways appropriateto each decision, be it an assessment of policies, agencies or budget settings.
Neither the Review nor the Grants Commission make judgments about appropriatelevels of expenditure or services, or about the efficiency of services. However, readerscan use data from both sources to inform judgments about policy choices.
Source: Commonwealth Grants Commission (1999).
26 REPORT ONGOVERNMENTSERVICES 2000
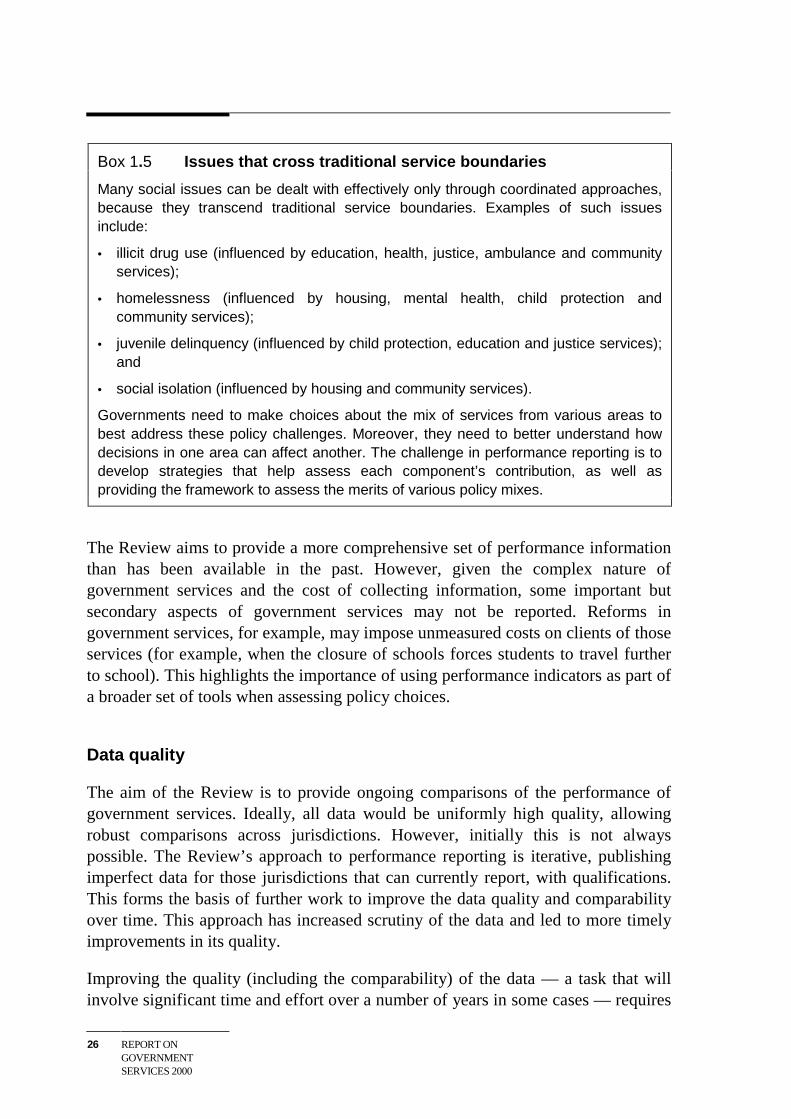
Box 1.5 Issues that cross traditional service boundaries
Many social issues can be dealt with effectively only through coordinated approaches,because they transcend traditional service boundaries. Examples of such issuesinclude:
• illicit drug use (influenced by education, health, justice, ambulance and communityservices);
• homelessness (influenced by housing, mental health, child protection andcommunity services);
• juvenile delinquency (influenced by child protection, education and justice services);and
• social isolation (influenced by housing and community services).
Governments need to make choices about the mix of services from various areas tobest address these policy challenges. Moreover, they need to better understand howdecisions in one area can affect another. The challenge in performance reporting is todevelop strategies that help assess each component’s contribution, as well asproviding the framework to assess the merits of various policy mixes.
The Review aims to provide a more comprehensive set of performance informationthan has been available in the past. However, given the complex nature ofgovernment services and the cost of collecting information, some important butsecondary aspects of government services may not be reported. Reforms ingovernment services, for example, may impose unmeasured costs on clients of thoseservices (for example, when the closure of schools forces students to travel furtherto school). This highlights the importance of using performance indicators as part ofa broader set of tools when assessing policy choices.
Data quality
The aim of the Review is to provide ongoing comparisons of the performance ofgovernment services. Ideally, all data would be uniformly high quality, allowingrobust comparisons across jurisdictions. However, initially this is not alwayspossible. The Review’s approach to performance reporting is iterative, publishingimperfect data for those jurisdictions that can currently report, with qualifications.This forms the basis of further work to improve the data quality and comparabilityover time. This approach has increased scrutiny of the data and led to more timelyimprovements in its quality.
Improving the quality (including the comparability) of the data — a task that willinvolve significant time and effort over a number of years in some cases — requires

THE APPROACH TOPERFORMANCEMEASUREMENT
27
a high level of cooperation among jurisdictions, and between the Review andparticipating agencies. Much of the work of the Review involves collecting specificinformation on which to base useful qualifications about existing data. (Section 1.5highlights the improvements in the quality and comparability of data this year.)
Some people have raised concerns about the risks of some imperfect or incompletedata being misused in decision making. Minimising this risk is a major focus duringthe preparation of this Report and in seminars with users around the country, andspecific examples of inadvertent data misuse are rare.
For each service area, the performance indicator framework shows which data areprovided on a comparable basis and which are not strictly comparable.Qualifications for data that are not strictly comparable are also noted within the text.Data may not be strictly comparable if:
• definitions or counting rules differ, or are so broad that they result in differentinterpretations (for example, with depreciation rules);
• the scope varies (for example, the waiting time for elective surgery); and
• benchmarks differ (for example, literacy standards).
These differences may result in biased estimates. However, it is often not clear thatbiases (if any) will necessarily be materially large. Even where they are significant,in many cases the differences may be able to be resolved by relatively simpleadjustments. Jurisdictions levy payroll tax of 5–7 per cent on wages and salaries, forexample, but the tax rate differences are likely to be outweighed by other factorsaffecting comparisons (see the above discussion on adjusting data).
Imperfect data can be useful for improving the transparency and accountability ofservices, providing more timely information, and acting as a catalyst for dataimprovement. Further, for policy making the best estimates (with the necessaryqualifications) may often be better than the alternative of no data and just anecdotes.Moreover, in a time of rapid change, timely but 95 per cent accurate informationmay be more valuable than more precise information that is 2 years old.
The data contained in this Report vary in the extent to which they have beenreviewed or validated; at a minimum, all data have been subject to peer review bythe working group for each service (box 1.6).
Users of the Report are an important source of feedback on issues relating to theimprovement of performance reporting. The Steering Committee welcomesfeedback, which can be forwarded to the Secretariat (see the contact details insidethe front cover of the Report).
28 REPORT ONGOVERNMENTSERVICES 2000
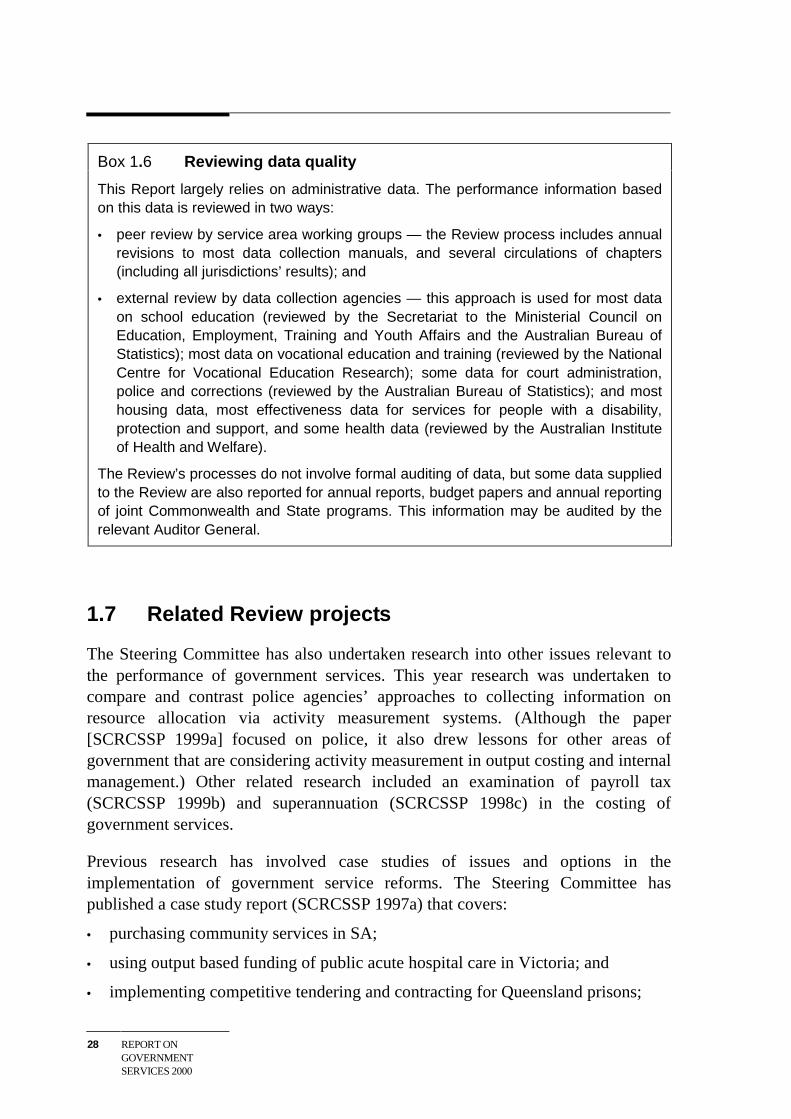
Box 1.6 Reviewing data quality
This Report largely relies on administrative data. The performance information basedon this data is reviewed in two ways:
• peer review by service area working groups — the Review process includes annualrevisions to most data collection manuals, and several circulations of chapters(including all jurisdictions’ results); and
• external review by data collection agencies — this approach is used for most dataon school education (reviewed by the Secretariat to the Ministerial Council onEducation, Employment, Training and Youth Affairs and the Australian Bureau ofStatistics); most data on vocational education and training (reviewed by the NationalCentre for Vocational Education Research); some data for court administration,police and corrections (reviewed by the Australian Bureau of Statistics); and mosthousing data, most effectiveness data for services for people with a disability,protection and support, and some health data (reviewed by the Australian Instituteof Health and Welfare).
The Review’s processes do not involve formal auditing of data, but some data suppliedto the Review are also reported for annual reports, budget papers and annual reportingof joint Commonwealth and State programs. This information may be audited by therelevant Auditor General.
1.7 Related Review projects
The Steering Committee has also undertaken research into other issues relevant tothe performance of government services. This year research was undertaken tocompare and contrast police agencies’ approaches to collecting information onresource allocation via activity measurement systems. (Although the paper[SCRCSSP 1999a] focused on police, it also drew lessons for other areas ofgovernment that are considering activity measurement in output costing and internalmanagement.) Other related research included an examination of payroll tax(SCRCSSP 1999b) and superannuation (SCRCSSP 1998c) in the costing ofgovernment services.
Previous research has involved case studies of issues and options in theimplementation of government service reforms. The Steering Committee haspublished a case study report (SCRCSSP 1997a) that covers:
• purchasing community services in SA;
• using output based funding of public acute hospital care in Victoria; and
• implementing competitive tendering and contracting for Queensland prisons;

THE APPROACH TOPERFORMANCEMEASUREMENT
29
and one (SCRCSSP 1998a) that covers:
• devolving decision making in Victorian Government schools;
• using competitive tendering for NSW public hospital services;
• offering consumer funding and choice in WA disability services; and
• pricing court reporting services in Commonwealth courts.
The Steering Committee has also developed checklists on some common issues inimplementing these reforms, such as:
• timing program implementation;
• decentralising decision making;
• measuring and assessing performance;
• measuring quality;
• directly linking funding to performance; and
• charging users (SCRCSSP 1998a).
The Steering Committee will continue to focus on research that is related toperformance measurement and thus better linked to efforts to improve reporting forindividual services.
1.8 Summary
The Review of Commonwealth/State Service Provision has been conducted for oversix years. Measuring each dimension of performance and collecting those data arenot straightforward tasks. The Steering Committee’s approach to performancereporting has been iterative, making incremental and manageable improvementsover each of the five Reports published.
The aim of the Review is to provide objective government performance informationto facilitate well informed judgments and sound public policy action. The SteeringCommittee relies on guiding principles to achieve this aim, including:
• an outcomes focus — that is, performance indicators should focus on theoutcomes of government services, reflecting whether service objectives havebeen met;
• comparability — that is, data should be comparable across jurisdictionswherever possible. Reporting comparable data across jurisdictions has a higherpriority than using a better indicator that allows no comparison. Where data arenot yet comparable, time series analysis is particularly important for yardstick
30 REPORT ONGOVERNMENTSERVICES 2000
comparison. Data for many services have been published in each of the fiveReports so time series comparisons have been made where possible to addanother dimension to performance comparisons; and
• comprehensiveness — that is, the performance indicator framework should be ascomprehensive as possible, assessing performance against all importantobjectives.
• progressive data availability — the ultimate aim is comparable data for alljurisdictions. However, progress differs across jurisdictions. So data arepresented for those jurisdictions that can currently report, rather than waitinguntil data are available for all jurisdictions.