1 takehome one 2008. 2 3 month treasury bill rate
Post on 19-Dec-2015
220 views
TRANSCRIPT

11
Takehome OneTakehome One
20082008
22
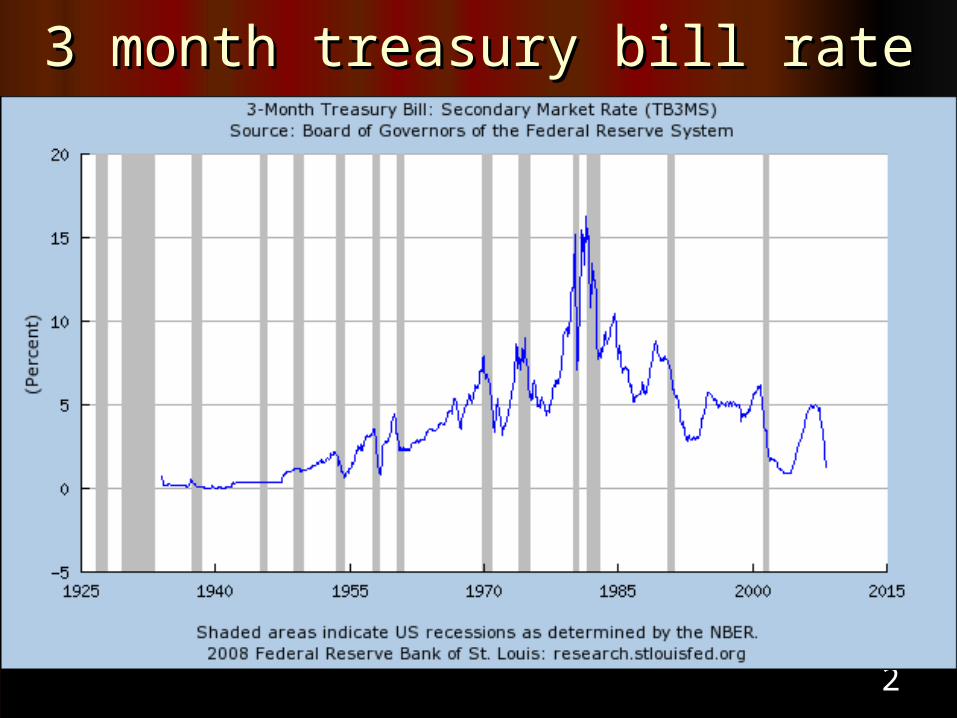
3 month treasury bill rate3 month treasury bill rate
33
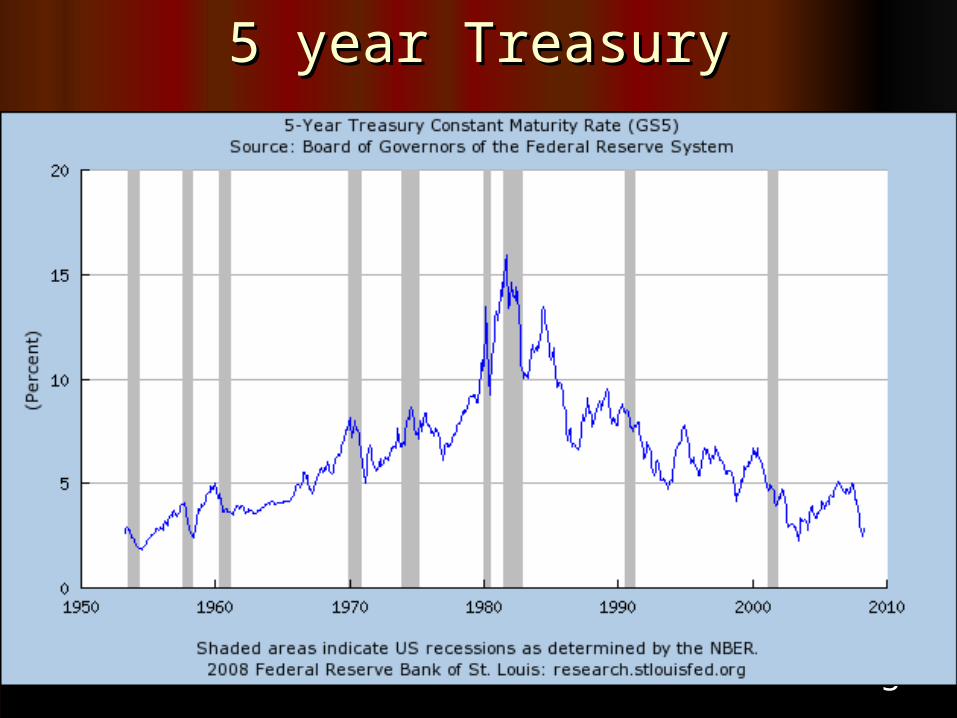
5 year Treasury5 year Treasury

44
0
4
8
12
16
20
55 60 65 70 75 80 85 90 95 00 05
GS5 TB3MS
3 month bill and 5 year treasury: April 1953-April 2008
55
66
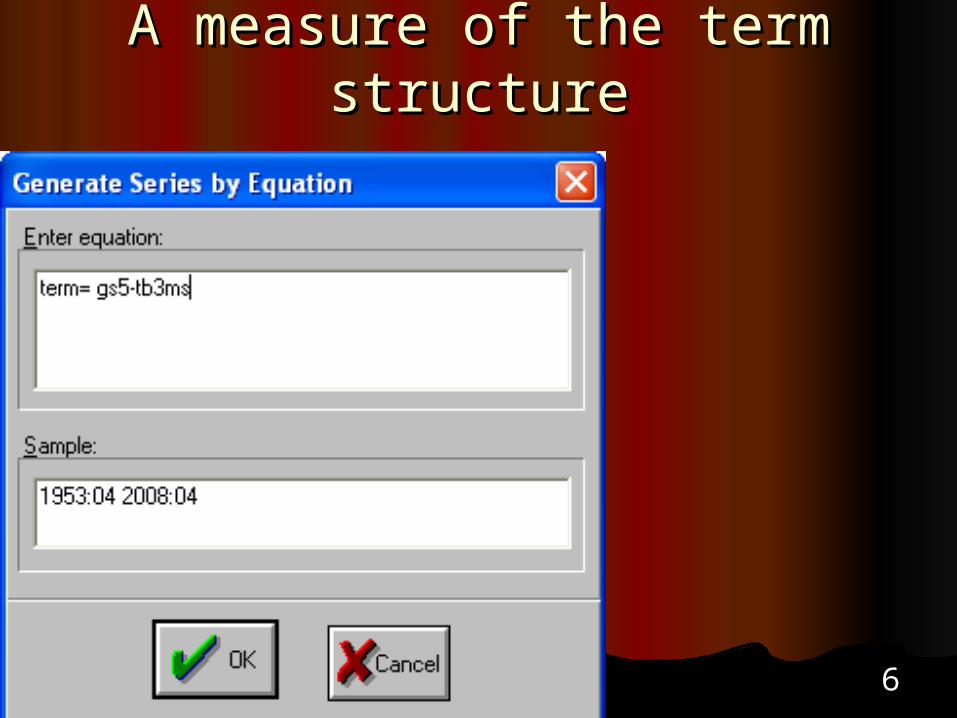
A measure of the term structureA measure of the term structure

77
-4
-2
0
2
4
6
55 60 65 70 75 80 85 90 95 00 05
TERM
term = GS5 - TB3MS
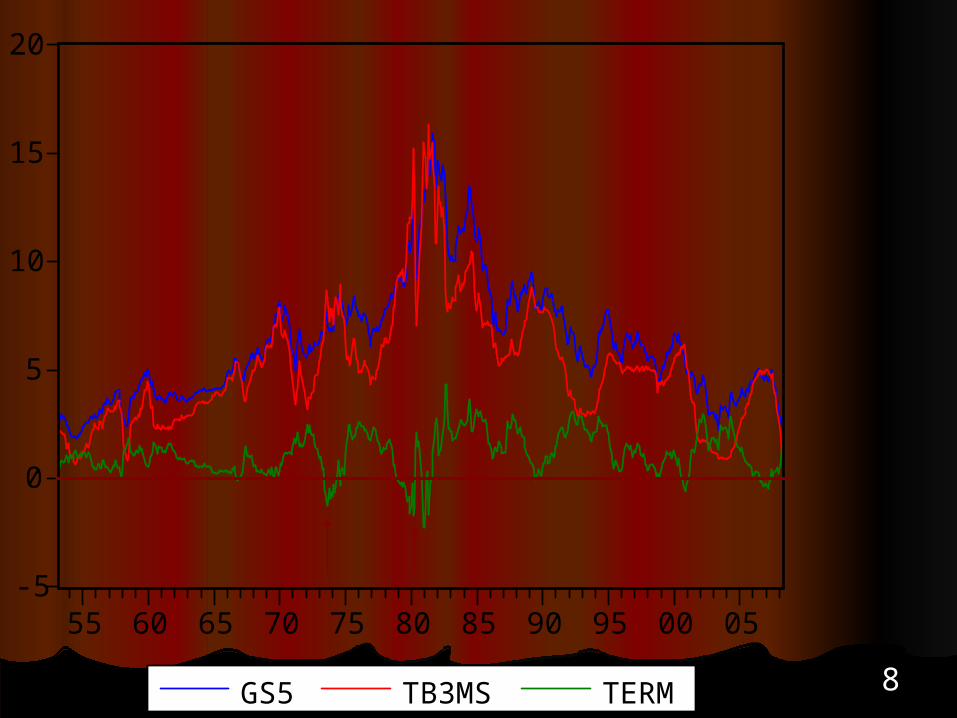
88
-5
0
5
10
15
20
55 60 65 70 75 80 85 90 95 00 05
GS5 TB3MS TERM

99
1. You should try this so that you know at least one way of obtaining time series from FRED. If you have difficulty, an Excel file called Takeone, is available on the class page.2. Generate a time series called term that is the difference between GS5 and TB3MS.3. Is term stationary, i.e. are GS5 and TB3ms co-integrated?4. Is term normally distributed?5. Estimate your best autoregressive model for term.6. Estimate your best ARMA model for term through April 2007 and see how well a forecast for this model fits the next 12 months.7. Re-estimate your best model for term through April 2008 and forecast for the remaining months of 2008.
Questions: Takehome OneQuestions: Takehome One

1010
0
20
40
60
80
2 4 6 8 10 12 14 16
Series: GS5Sample 1953:04 2008:04Observations 661
Mean 6.240393Median 5.850000Maximum 15.93000Minimum 1.850000Std. Dev. 2.756402Skewness 0.978683Kurtosis 3.850276
Jarque-Bera 125.4318Probability 0.000000
GS5: Rate for Five Year Treasury
Histogram and Stats for Five Histogram and Stats for Five YearYear

1111

1212
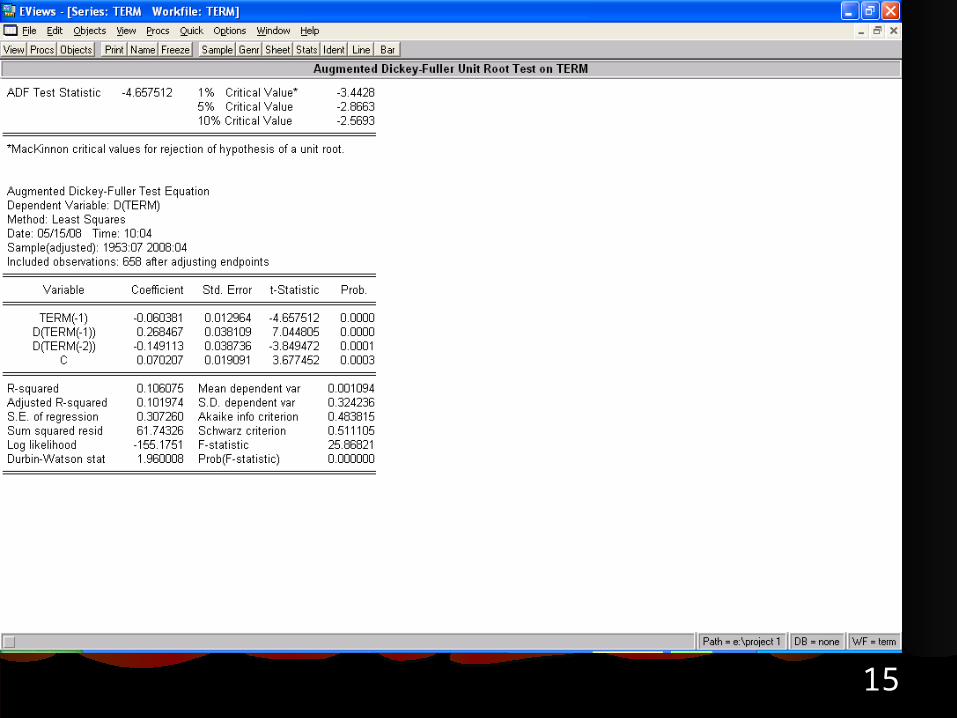
Unit Root test for GS5Unit Root test for GS5

1313
Histogram and Stats for TermHistogram and Stats for Term
0
20
40
60
80
100
-2 -1 0 1 2 3 4
Series: TERMSample 1953:04 2008:04Observations 661
Mean 1.146051Median 1.130000Maximum 4.330000Minimum -2.250000Std. Dev. 0.957974Skewness -0.045212Kurtosis 3.247015
Jarque-Bera 1.905692Probability 0.385642
Histogram and Stats for Term = GS5 - TB3ms
1414
1515
1616
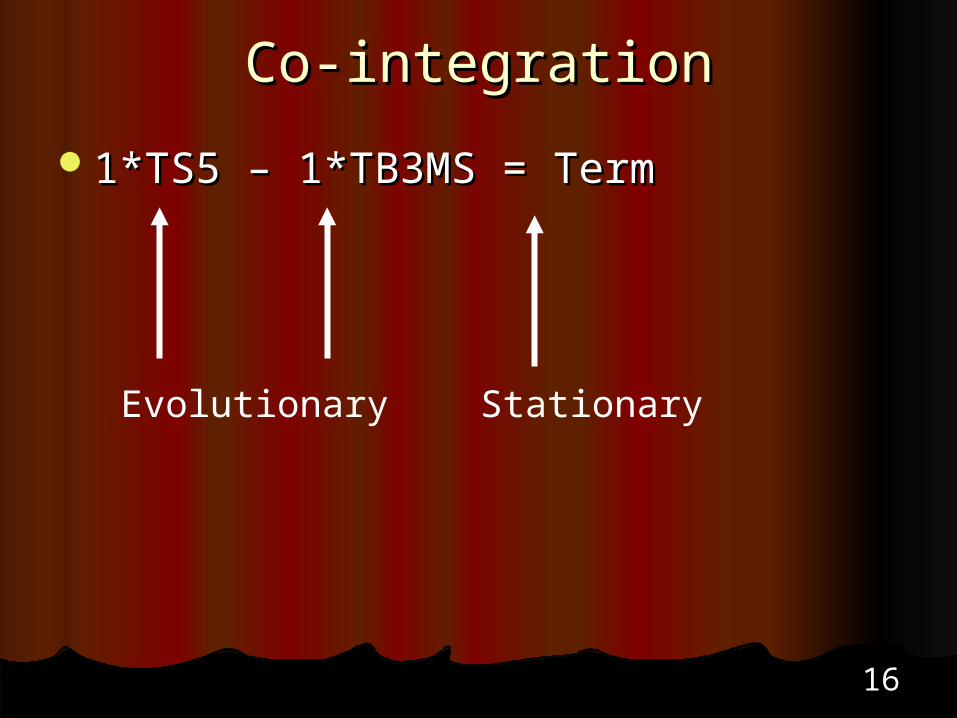
Co-integrationCo-integration
1*TS5 – 1*TB3MS = Term1*TS5 – 1*TB3MS = Term
Evolutionary Stationary
1717
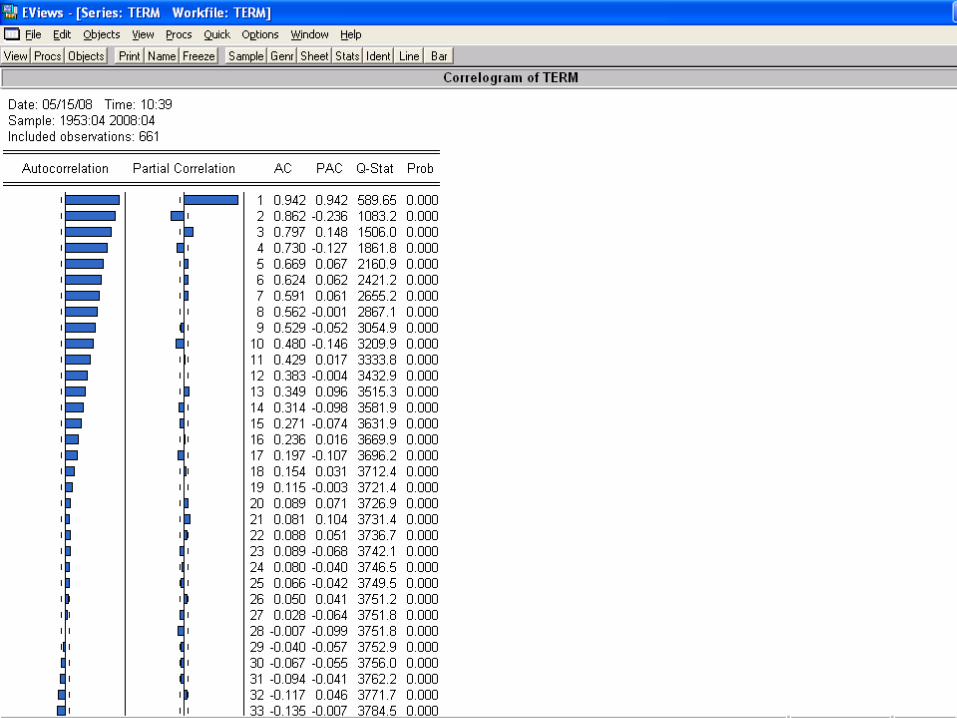
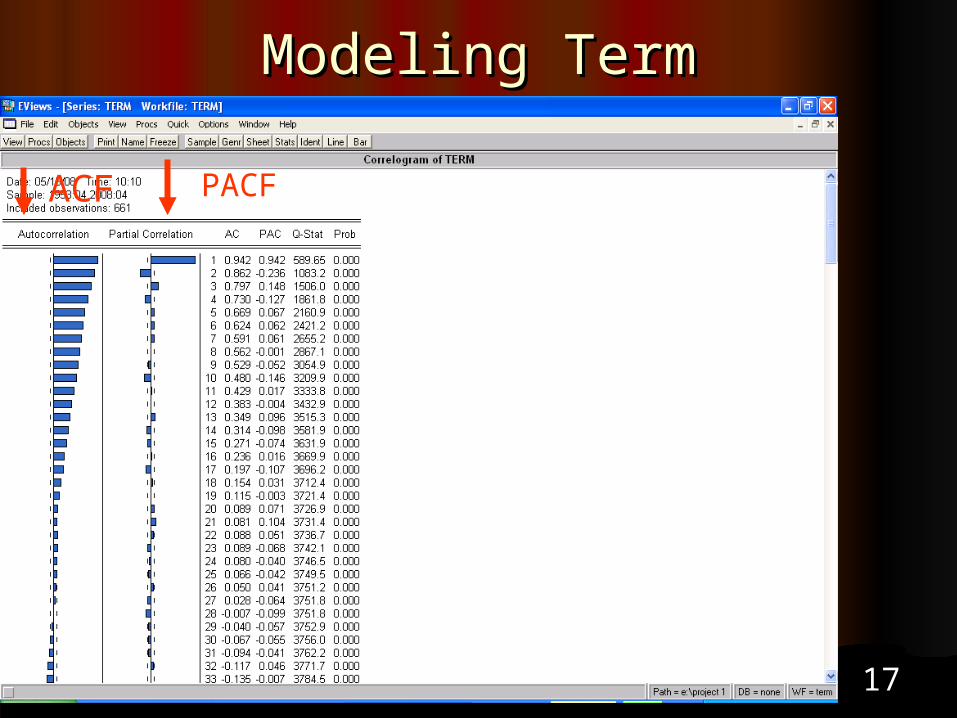
Modeling TermModeling Term
PACFACF
1818
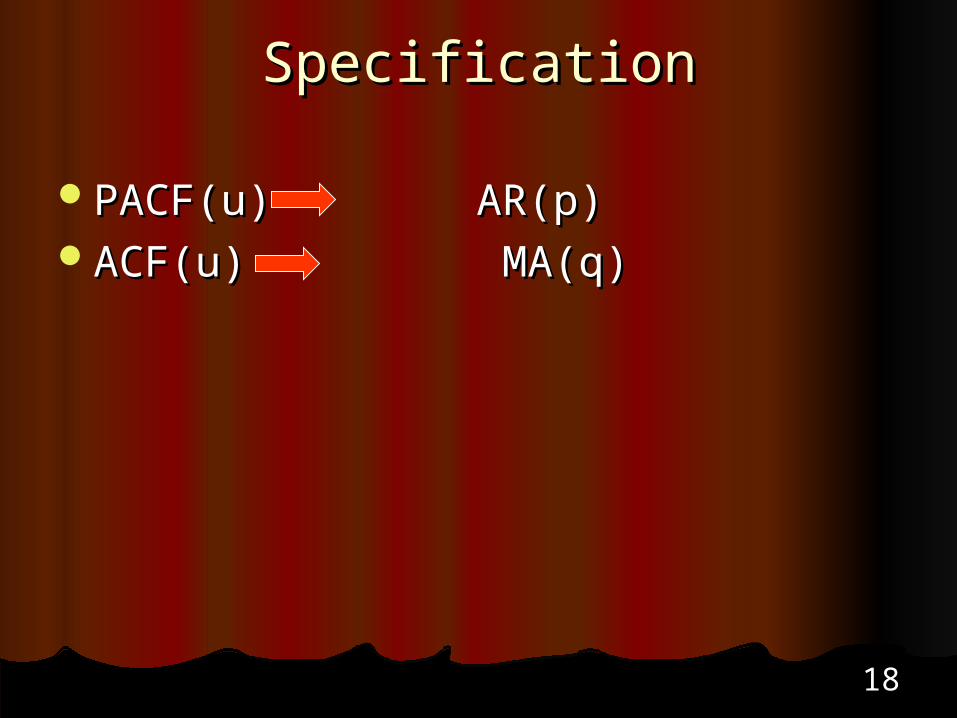
SpecificationSpecification
PACF(u) AR(p)PACF(u) AR(p)ACF(u) MA(q) ACF(u) MA(q)
1919
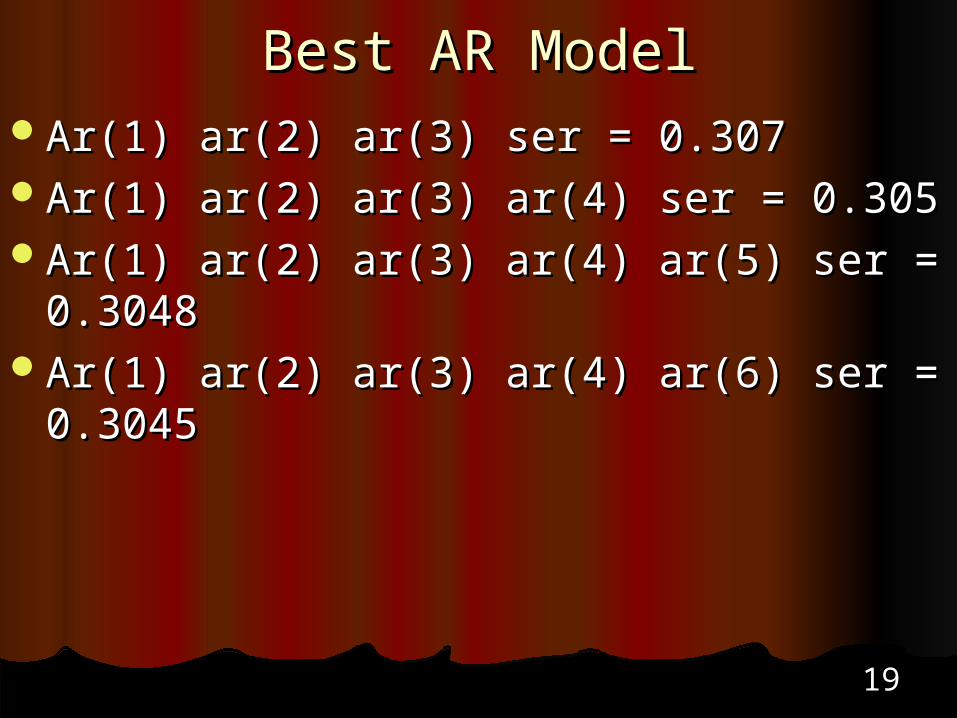
Best AR ModelBest AR ModelAr(1) ar(2) ar(3) ser = 0.307Ar(1) ar(2) ar(3) ser = 0.307Ar(1) ar(2) ar(3) ar(4) ser = 0.305Ar(1) ar(2) ar(3) ar(4) ser = 0.305Ar(1) ar(2) ar(3) ar(4) ar(5) ser = 0.3048Ar(1) ar(2) ar(3) ar(4) ar(5) ser = 0.3048Ar(1) ar(2) ar(3) ar(4) ar(6) ser = 0.3045Ar(1) ar(2) ar(3) ar(4) ar(6) ser = 0.3045

2020

2121

2222
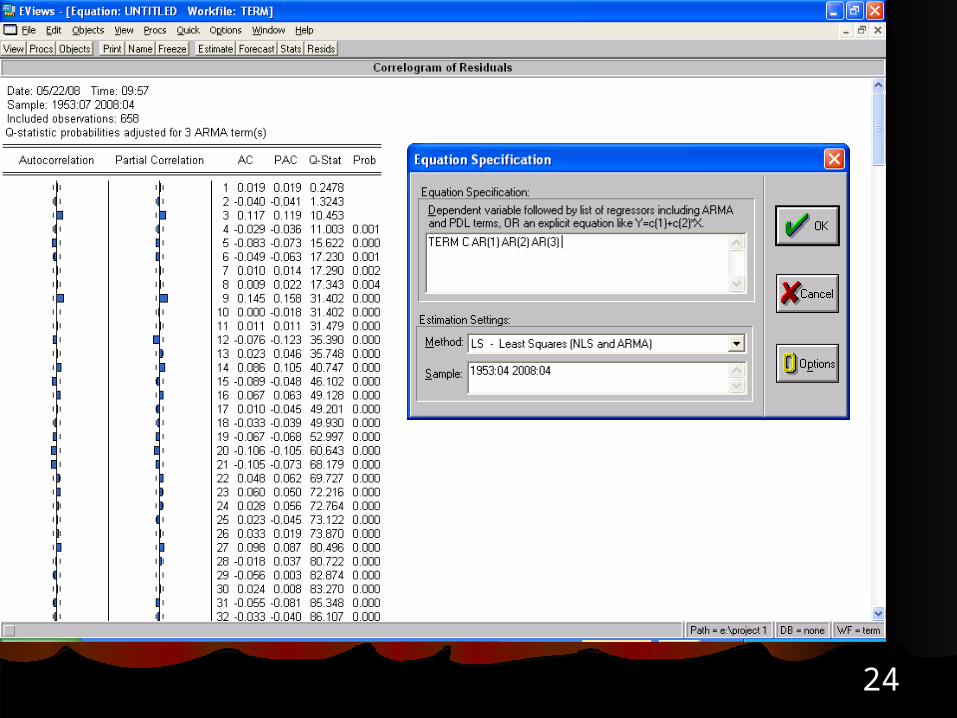
SpecificationSpecificationAr(1) ar(2) : look at residualsAr(1) ar(2) : look at residualsAr(1) ar(2) ar(3) : look at residualsAr(1) ar(2) ar(3) : look at residualsAr(1) ar(2) ar(3) ma(3) : look at Ar(1) ar(2) ar(3) ma(3) : look at
residualsresidualsAr(1) ar(2) ar(3) ma(3) ma(9) : look at Ar(1) ar(2) ar(3) ma(3) ma(9) : look at
residualsresidualsADD MA(15)ADD MA(15)ADD MA(20)ADD MA(20)ADD MA(21), ser = 0.295ADD MA(21), ser = 0.295

2323
2424

2525

2626

2727
2828
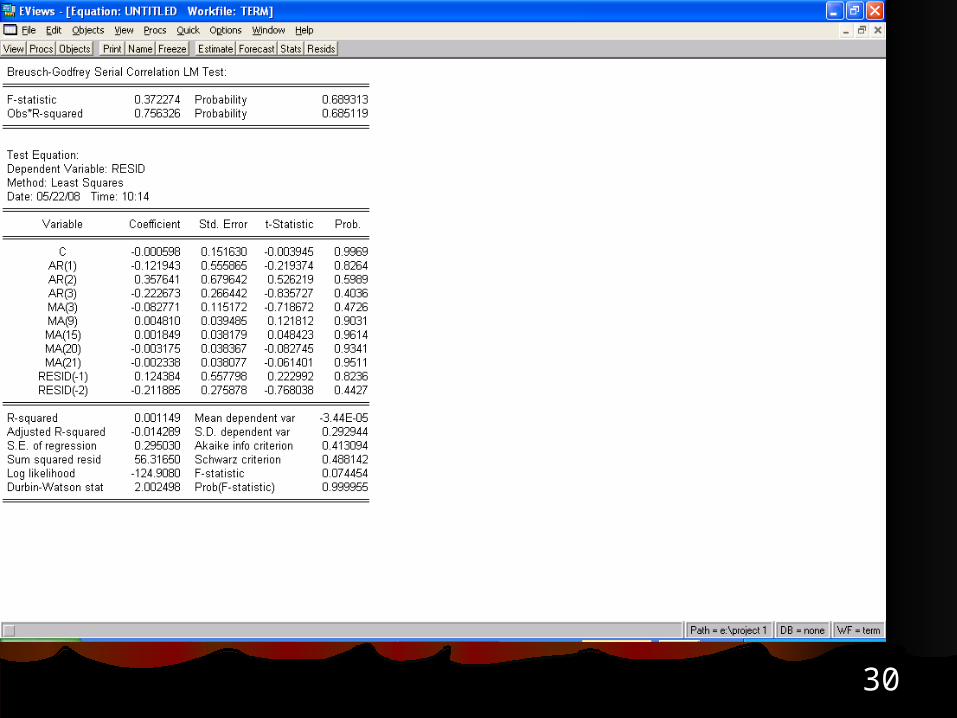
ValidationValidationCorrelogram of residualsCorrelogram of residualsActual, fitted & residual graphActual, fitted & residual graphSerial correlation testSerial correlation testHistogram of residualsHistogram of residuals

2929
3030
3131
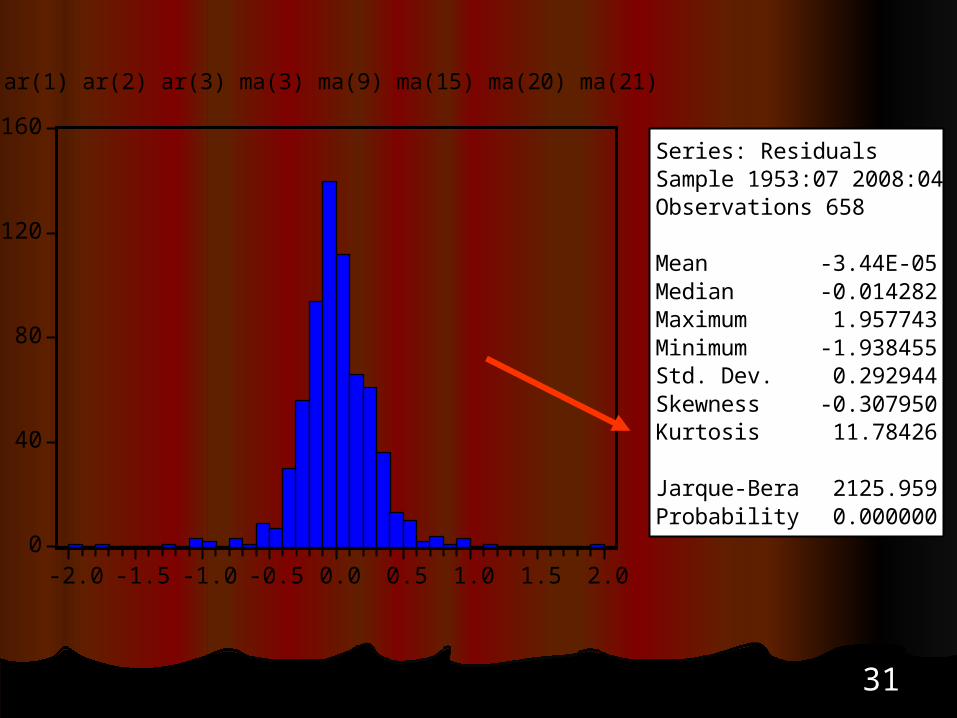
0
40
80
120
160
-2.0 -1.5 -1.0 -0.5 0.0 0.5 1.0 1.5 2.0
Series: ResidualsSample 1953:07 2008:04Observations 658
Mean -3.44E-05Median -0.014282Maximum 1.957743Minimum -1.938455Std. Dev. 0.292944Skewness -0.307950Kurtosis 11.78426
Jarque-Bera 2125.959Probability 0.000000
ar(1) ar(2) ar(3) ma(3) ma(9) ma(15) ma(20) ma(21)

3232
Within Sample ForecastingWithin Sample Forecasting
Re-estimate model from 1953:04 -Re-estimate model from 1953:04 -2007:042007:04

3333
-2
-1
0
1
2
3
07:05 07:07 07:09 07:11 08:01 08:03
TERMF ± 2 S.E.
Forecast: TERMFActual: TERMSample: 2007:05 2008:04Include observations: 12
Root Mean Squared Error 0.301040Mean Absolute Error 0.208092Mean Abs. Percent Error 60.36766Theil Inequality Coefficient 0.261678 Bias Proportion 0.148157 Variance Proportion 0.158776 Covariance Proportion 0.693066
In sample forecast: 2007:04-In sample forecast: 2007:04-2008:042008:04

3434

3535
Sample: 2005:01 – 2008:04
Quick menu: show

3636
In sample forecastIn sample forecast
-2
-1
0
1
2
3
05:01 05:07 06:01 06:07 07:01 07:07 08:01
TERMFORECAST
FORECAST+2*SEFFORECAST-2*SEF
In sample forecast
3737
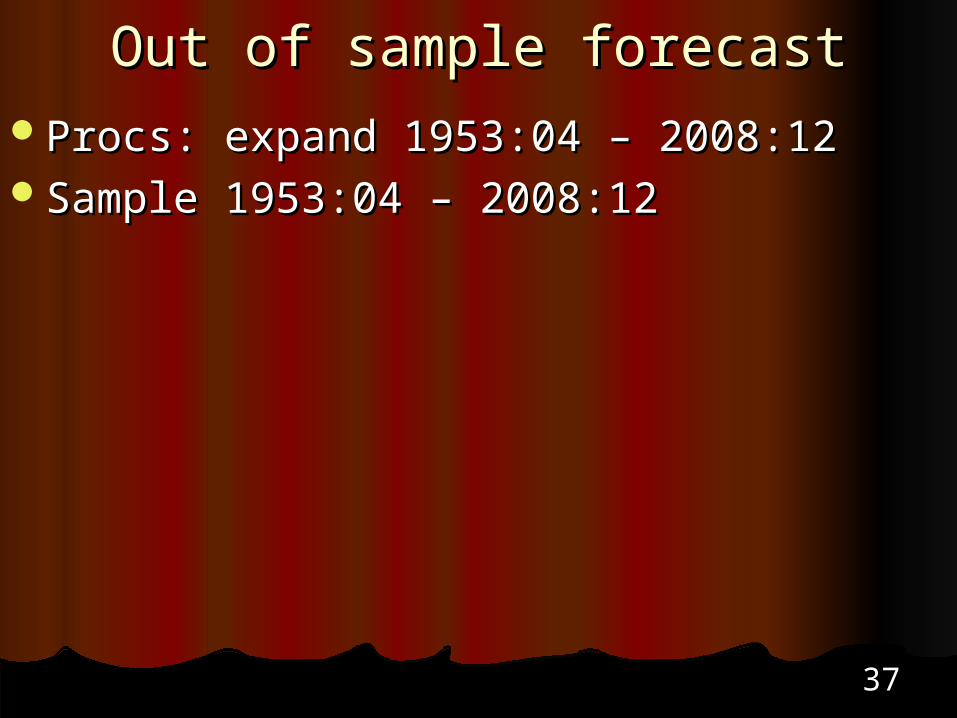
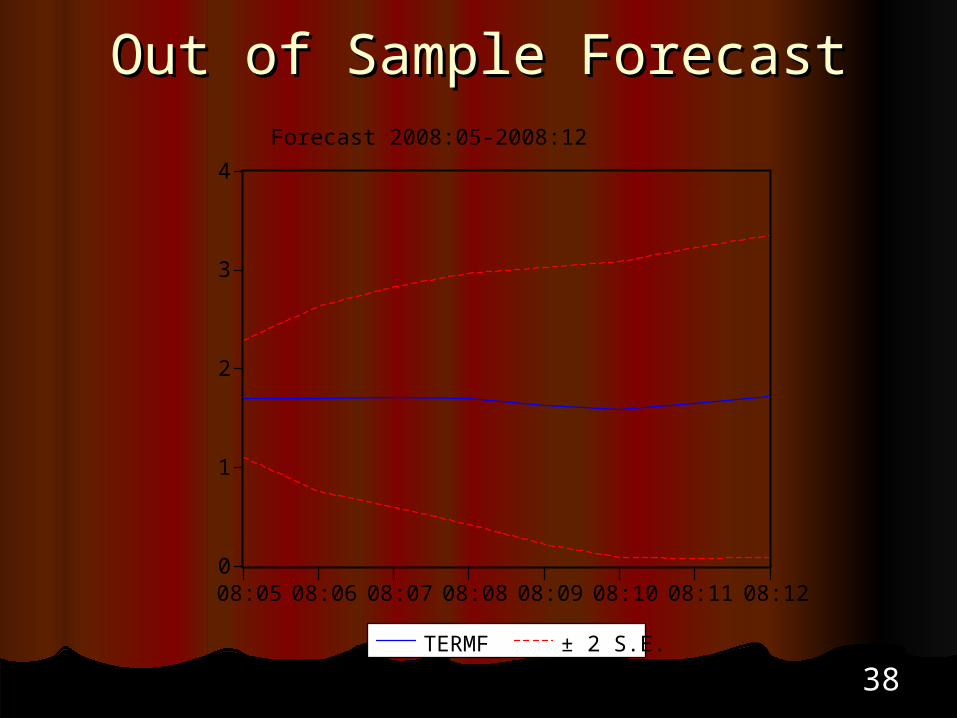
Out of sample forecastOut of sample forecastProcs: expand 1953:04 – 2008:12Procs: expand 1953:04 – 2008:12Sample 1953:04 – 2008:12Sample 1953:04 – 2008:12
3838
Out of Sample ForecastOut of Sample Forecast
0
1
2
3
4
08:05 08:06 08:07 08:08 08:09 08:10 08:11 08:12
TERMF ± 2 S.E.
Forecast 2008:05-2008:12

3939
4040
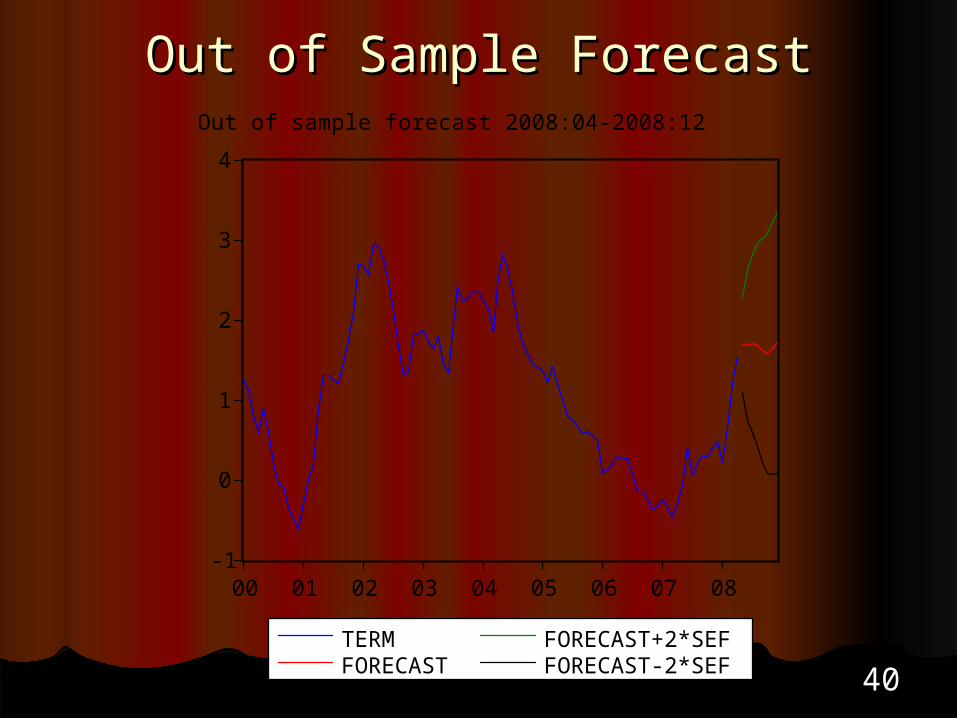
Out of Sample ForecastOut of Sample Forecast
-1
0
1
2
3
4
00 01 02 03 04 05 06 07 08
TERMFORECAST
FORECAST+2*SEFFORECAST-2*SEF
Out of sample forecast 2008:04-2008:12

4141
ARCHARCH
0
40
80
120
160
-2.0 -1.5 -1.0 -0.5 0.0 0.5 1.0 1.5 2.0
Series: ResidualsSample 1953:07 2008:04Observations 658
Mean -3.44E-05Median -0.014282Maximum 1.957743Minimum -1.938455Std. Dev. 0.292944Skewness -0.307950Kurtosis 11.78426
Jarque-Bera 2125.959Probability 0.000000

4242

4343
-4
-2
0
2
4
6
55 60 65 70 75 80 85 90 95 00 05
TERM RESQ
ARCH: Noisy Residuals when term goes negative
ARCH: when Inverted Term ARCH: when Inverted Term StructureStructure
4444
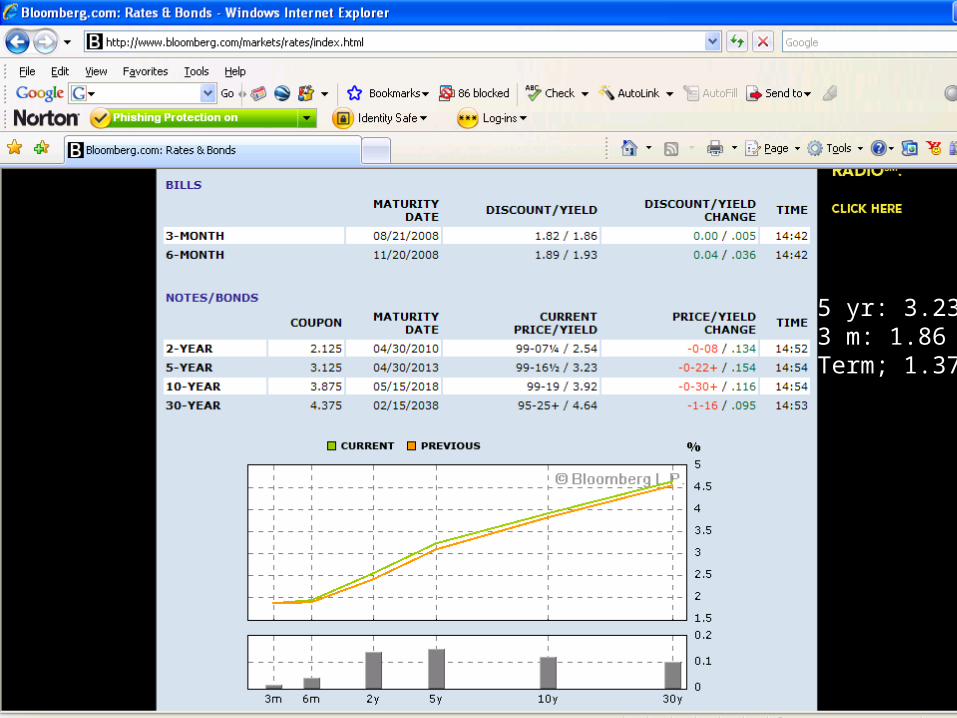
5 yr: 3.233 m: 1.86Term; 1.37

4545
Estimate ARCH/GARCHEstimate ARCH/GARCH

4646
4747
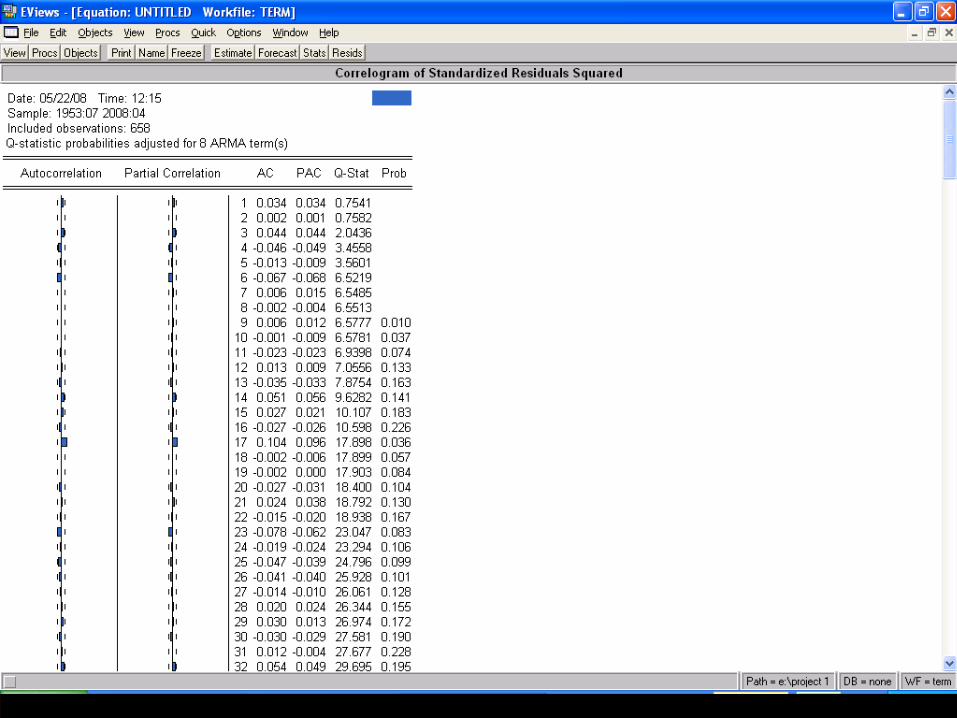
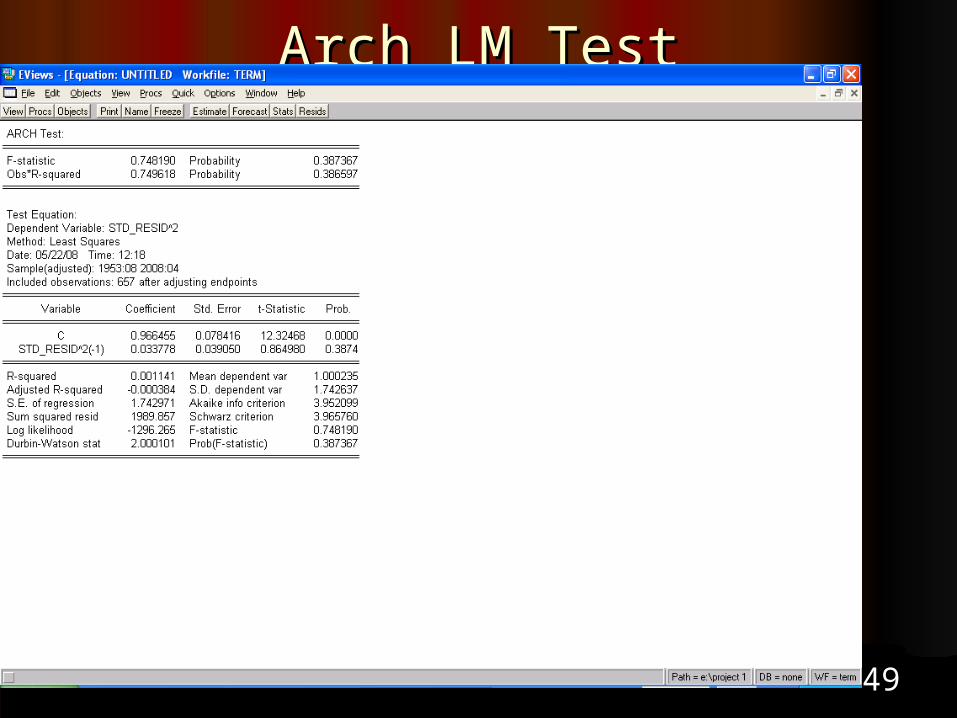
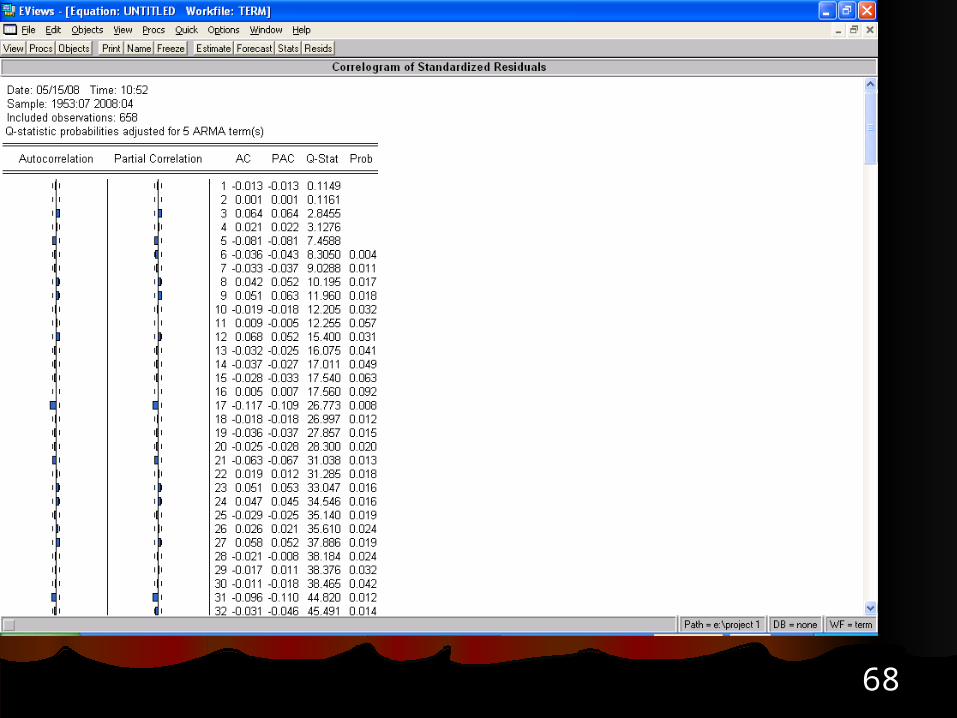
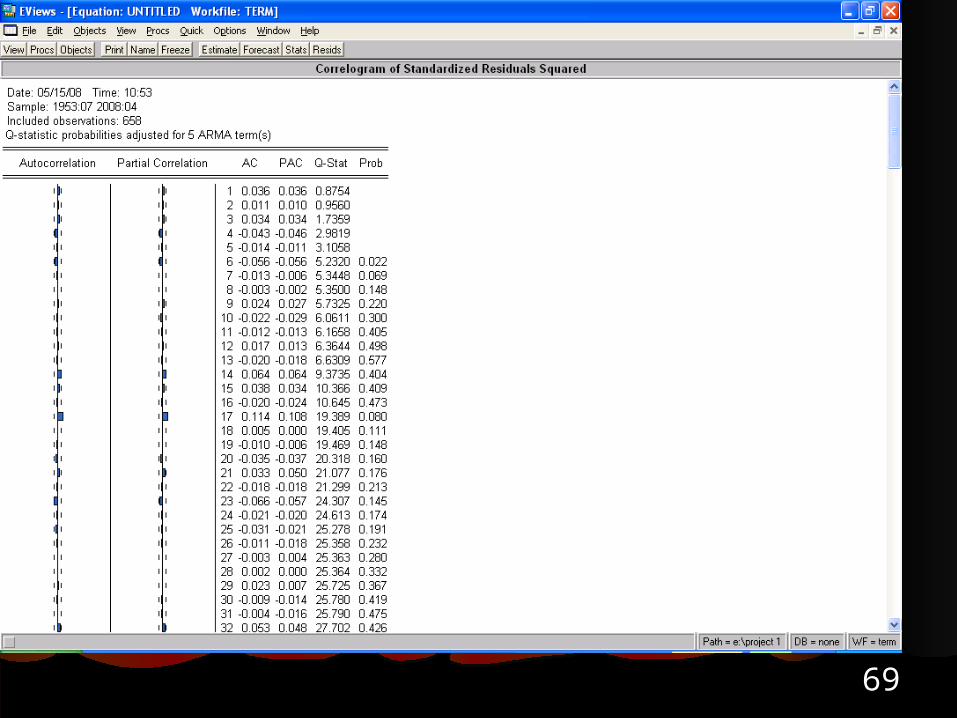
DiagnosticsDiagnosticsCorrelogram of standardized Correlogram of standardized
residuals residuals Actual, fitted, residual graphActual, fitted, residual graphcorrelogram of standardized correlogram of standardized
residuals squaredresiduals squaredLM ARCH testLM ARCH test
4848
4949
Arch LM TestArch LM Test

5050
0
20
40
60
80
-4 -3 -2 -1 0 1 2 3 4
Series: Standardized ResidualsSample 1953:07 2008:04Observations 658
Mean 0.027893Median 0.028664Maximum 3.760420Minimum -4.166763Std. Dev. 1.000265Skewness 0.016000Kurtosis 4.028786
Jarque-Bera 29.04587Probability 0.000000
Standardized Residuals from GARCH Model
Histogram of Standardized Histogram of Standardized ResidualsResiduals
5151
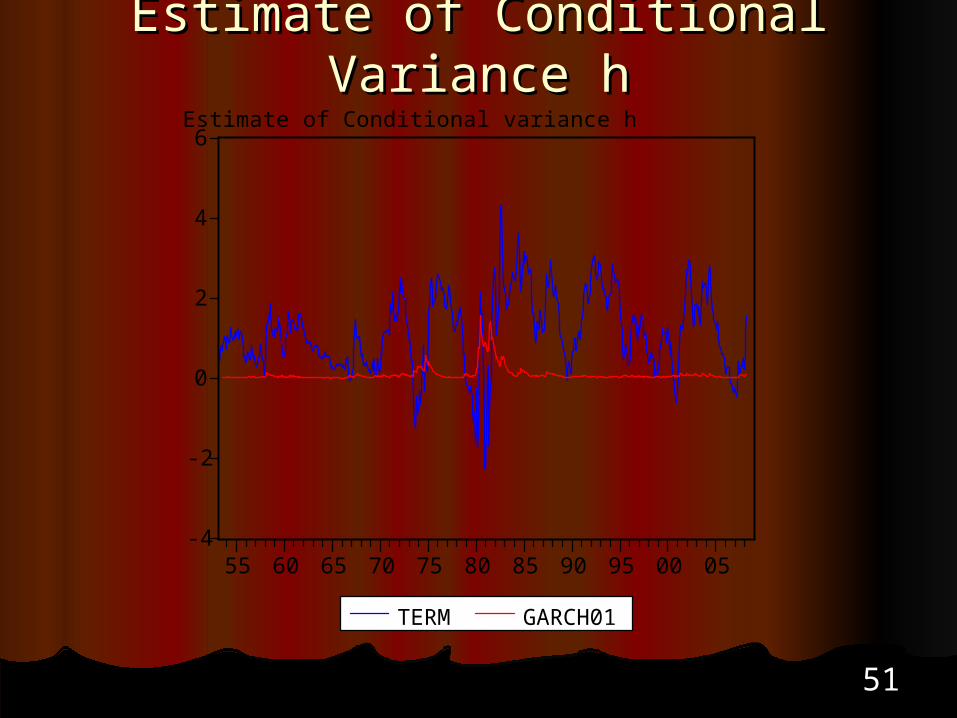
Estimate of Conditional Variance Estimate of Conditional Variance hh
-4
-2
0
2
4
6
55 60 65 70 75 80 85 90 95 00 05
TERM GARCH01
Estimate of Conditional variance h

5252
Estimate of a Simpler Model with Estimate of a Simpler Model with ARCHARCH

5353
5454
-3
-2
-1
0
1
2
3
-4
-2
0
2
4
6
55 60 65 70 75 80 85 90 95 00 05
Residual Actual Fitted
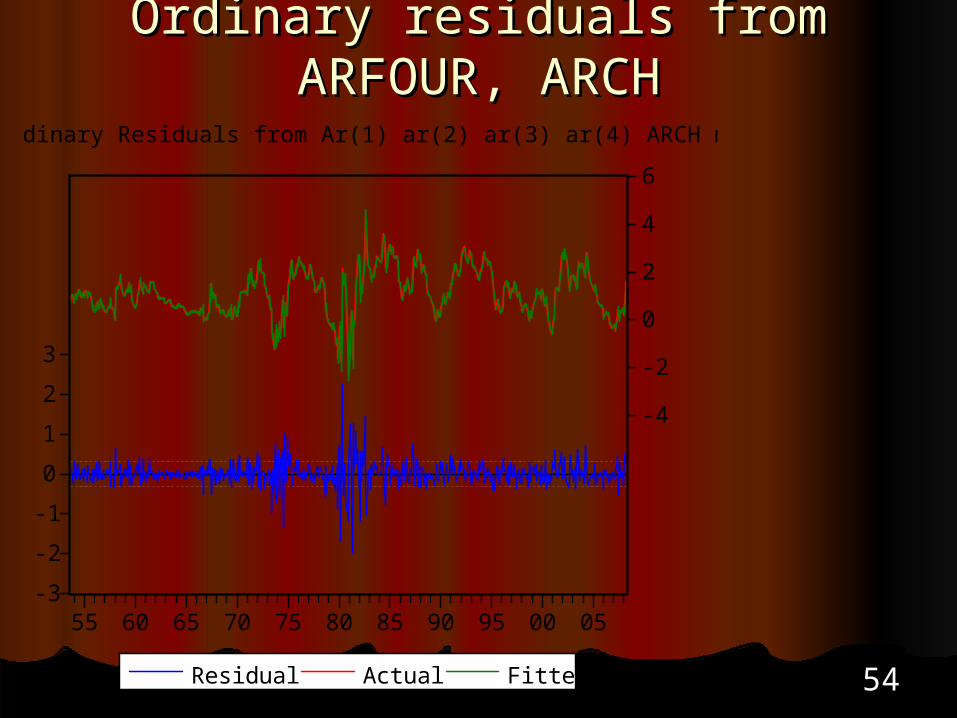
Ordinary Residuals from Ar(1) ar(2) ar(3) ar(4) ARCH model
Ordinary residuals from ARFOUR, Ordinary residuals from ARFOUR, ARCHARCH
5555
AppendixAppendix

5656
Alternative model #1Alternative model #1

5757

5858
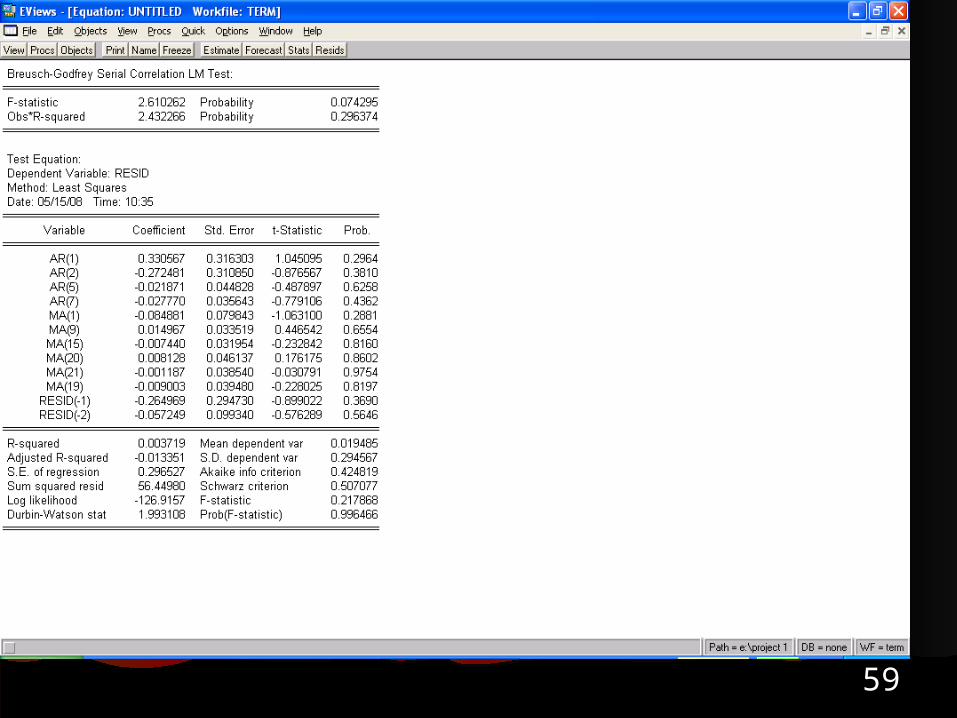
5959
6060
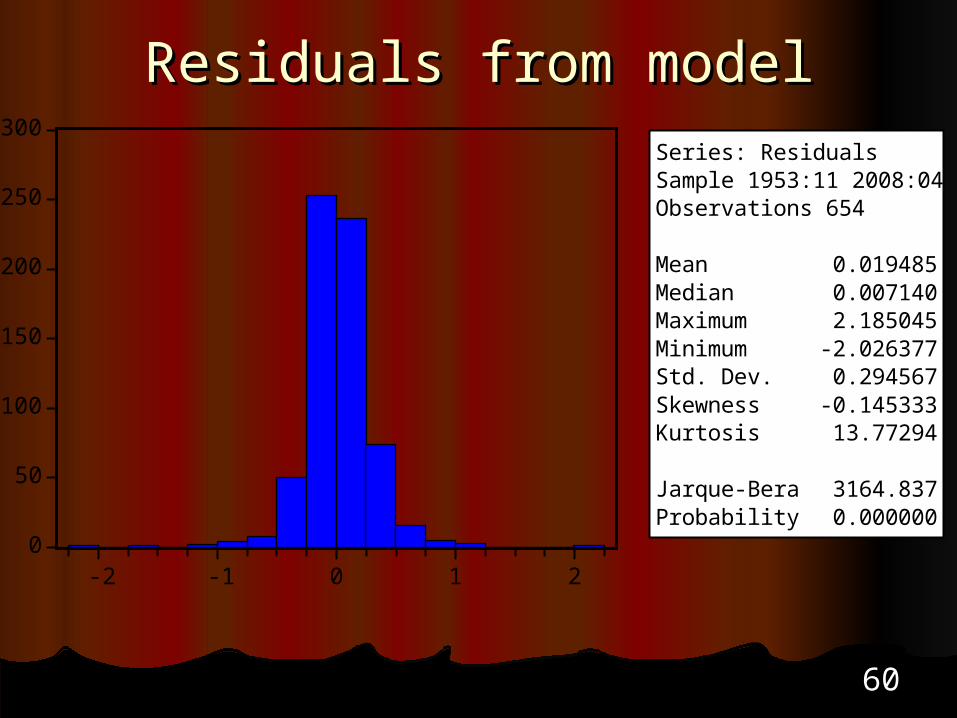
Residuals from modelResiduals from model
0
50
100
150
200
250
300
-2 -1 0 1 2
Series: ResidualsSample 1953:11 2008:04Observations 654
Mean 0.019485Median 0.007140Maximum 2.185045Minimum -2.026377Std. Dev. 0.294567Skewness -0.145333Kurtosis 13.77294
Jarque-Bera 3164.837Probability 0.000000

6161
Alternative model #2Alternative model #2
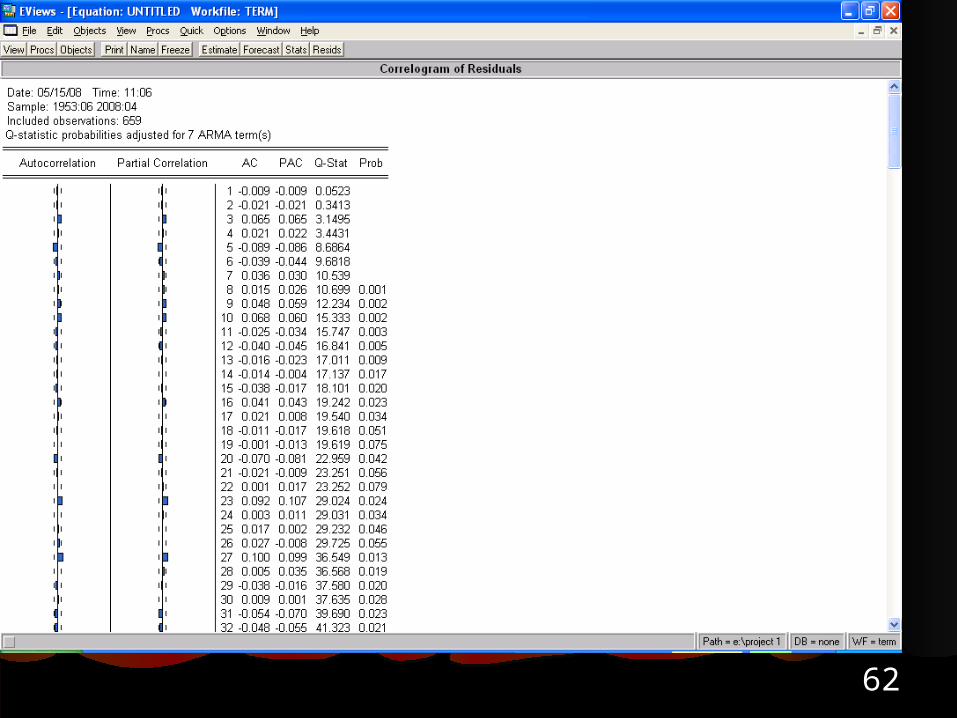
6262

6363

6464
0
40
80
120
160
-1.5 -1.0 -0.5 0.0 0.5 1.0 1.5 2.0
Series: ResidualsSample 1953:06 2008:04Observations 659
Mean -9.24E-05Median -0.010673Maximum 2.113270Minimum -1.736855Std. Dev. 0.294642Skewness -0.025338Kurtosis 11.88345
Jarque-Bera 2166.966Probability 0.000000
Residulas from (2,1,q) model

6565
Autoregressive Conditional Autoregressive Conditional HeteroskedasticityHeteroskedasticity
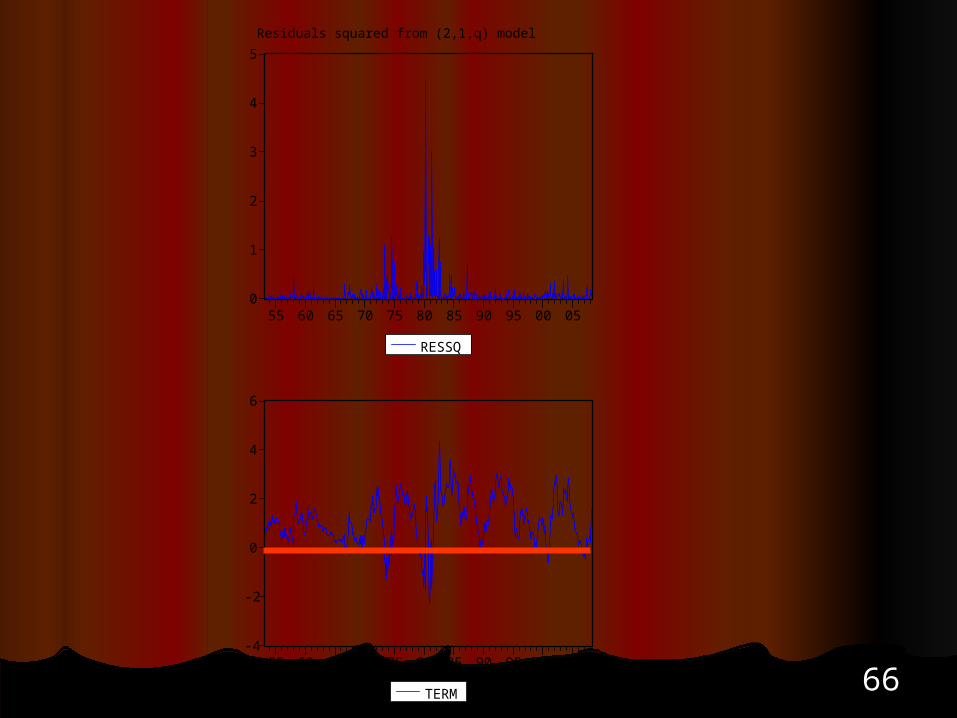
6666
0
1
2
3
4
5
55 60 65 70 75 80 85 90 95 00 05
RESSQ
-4
-2
0
2
4
6
55 60 65 70 75 80 85 90 95 00 05
TERM
Residuals squared from (2,1,q) model

6767
6868
6969

7070
0
20
40
60
80
-3.75 -2.50 -1.25 0.00 1.25 2.50 3.75
Series: Standardized ResidualsSample 1953:07 2008:04Observations 658
Mean 0.041163Median 0.028847Maximum 3.840148Minimum -4.563053Std. Dev. 0.999768Skewness -0.040181Kurtosis 4.379016
Jarque-Bera 52.31493Probability 0.000000
Residuals from Arch-Garch Model