1. summary of significant accounting policies
TRANSCRIPT
CITY OF PHILADELPHIA
AVIATION FUND
Notes to Financial Statements
1. SUMMARY OF SIGNIFICANT ACCOUNTING POLICIES
Operations
The Aviation Fund is a proprietary fund of the City of Philadelphia (the City). It was
created and authorized as part of the Fiscal 1974 Operating Budget Ordinance approved by
City Council on June 7, 1973, with an effective date of July 1, 1973. This fund was
established to facilitate administrative and financial operations necessary to maintain,
improve, repair and operate Philadelphia International Airport (PHL, or the Airport) and
Northeast Philadelphia Airport (PNE). The financial statements presented are for the
Aviation Fund only and are not intended to present fairly the financial position of the City
of Philadelphia as a whole or the results of its operations and cash flows. The
comprehensive annual financial report of the City of Philadelphia provides complete
financial information as to the City and its component units.
Basis of Accounting
The accompanying financial statements have been prepared on the accrual basis of
accounting. Under this method, revenues are recognized in the accounting period in which
they are earned and expenses are recognized at the time obligations are incurred.
Private sector standards of accounting and financial reporting issued prior to December 1,
1989, generally are followed in both the government wide and the proprietary fund
financial statements to the extent that they do not conflict or contradict guidance of the
Governmental Accounting Standards Board (GASB). Governments also have the option
of following subsequent private sector guidance for their business type activities and
enterprise funds. The City has elected not to follow subsequent private sector guidelines.
Proprietary funds distinguish operating revenues and expenses from non-operating items.
Operating revenues and expenses generally result from providing services and producing
and delivering goods in connection with a proprietary fund’s ongoing operations. The
principal operating revenue of the Aviation Fund is charges for the use of the airport.
Operating expenses for enterprise funds include the cost of sales and services,
administrative expenses, and depreciation on capital assets. All revenues and expenses not
meeting this definition are reported as non-operating revenues and expenses.
29
CITY OF PHILADELPHIA
AVIATION FUND
Notes to Financial Statements
Recently Issued GASB Statements
In November 2016, GASB issued Statement No. 83, Certain Asset Retirement Obligations.
This Statement addresses accounting and financial reporting for certain asset retirement
obligations (AROs). An ARO is a legally enforceable liability associated with the
retirement of a tangible capital asset. The requirements of this Statement are effective for
reporting periods beginning after June 15, 2018. The adoption of this statement did not
result in any significant changes to the City’s financial statements.
In January 2017, GASB issued Statement No. 84, Fiduciary Activities. The objective of
this Statement is to improve guidance regarding the identification of fiduciary activities for
accounting and financial reporting purposes and how those activities should be reported.
The requirements of this Statement are effective for reporting periods beginning after
December 15, 2018. The City has not completed the process of evaluating the impact of
adopting this Statement.
In June 2017, GASB issued Statement No. 87, Leases. The objective of this Statement is
to better meet the information needs of financial statement users by improving accounting
and financial reporting for leases by governments. This Statement increases the usefulness
of governments’ financial statements by requiring recognition of certain lease assets and
liabilities for leases that previously were classified as operating leases and recognized as
inflows of resources or outflows of resources based on the payment provisions of the
contract. It establishes a single model for lease accounting based on the foundational
principle that leases are financings of the right to use an underlying asset. Under this
Statement, a lessee is required to recognize a lease liability and an intangible right-to-use
lease asset, and a lessor is required to recognize a lease receivable and a deferred inflow of
resources, thereby enhancing the relevance and consistency of information about
governments’ leasing activities. The requirements of this Statement are effective for
reporting periods beginning after December 15, 2019. The City has not completed the
process of evaluating the impact of adopting this Statement.
30

CITY OF PHILADELPHIA
AVIATION FUND
Notes to Financial Statements
In March 2018, GASB issued Statement No. 88, Certain Disclosures Related to Debt,
Including Direct Borrowings and Direct Placements. The primary objective of this
Statement is to improve the information that is disclosed in notes to government financial
statements related to debt, including direct borrowings and direct placements. It also
clarifies which liabilities governments should include when disclosing information related
to debt. This Statement defines debt for purposes of disclosure in notes to financial
statements as a liability that arises from a contractual obligation to pay cash (or other assets
that may be used in lieu of cash) in one or more payments to settle an amount that is fixed
at the date the contractual obligation is established. This Statement requires that additional
essential information related to debt be disclosed in notes to financial statements, including
unused lines of credit; assets pledged as collateral for the debt; and terms specified in debt
agreements related to significant events of default with finance-related consequence,
significant termination events with finance-related consequences, and significant
subjective acceleration clauses. For notes to financial statements related to debt, this
Statement also requires that existing and additional information be provided for direct
borrowings and direct placements of debt separately from other debt. The requirements of
this Statement are effective for reporting periods beginning after June 15, 2018. The City’s
adoption of Statement No. 88 resulted in additional disclosures related to direct
borrowings, direct placements, and lines of credit.
In June 2018, GASB issued Statement No. 89, Accounting for Interest Cost Incurred
Before the End of a Construction Period. The objectives of this Statement are to enhance
the relevance and comparability of information about capital assets and the cost of
borrowing for a reporting period and to simplify accounting for interest costs incurred
before the end of a construction period. This Statement establishes accounting
requirements for interest cost incurred before the end of a construction period. Such
interest cost includes all interest that previously was accounted for in accordance with the
requirements of paragraph 5-22 of Statement No. 62, Codification of Accounting and
Financial Reporting Guidance Contained in Pre-November 30, 1989 FASB and AICPA
Pronouncements, which are superseded by this Statement. This Statement requires that
interest cost incurred before the end of a construction period be recognized as an expense
in the period in which the cost is incurred for financial statements prepared using the
economic resources management focus. As a result, interest cost incurred before the end
of a construction period will not be included in the historical cost of a capital asset reported
in a business-type activity or enterprise fund. This Statement also reiterates that in financial
statements prepared using the current financial resources management focus, interest costs
incurred before the end of a construction period should be recognized as an expenditure on
a basis consistent with governmental fund accounting principles. The requirements of this
Statement are effective for reporting periods beginning after December 15, 2019. The City
has not completed the process of evaluating the impact of adopting this Statement.
31
CITY OF PHILADELPHIA
AVIATION FUND
Notes to Financial Statements
In August 2018, GASB issued Statement No. 90, Majority Equity Interest – An Amendment
of GASB Statements No. 14 and No. 61. The primary objectives of this Statement are to
improve the consistency and comparability of reporting a government’s majority equity
interest in a legally separate organization and to improve the relevance of financial
statement information for certain component units. It defines a majority equity interest and
specifies that a majority equity interest in a legally separate organization should be reported
as an investment if a government’s holding of the equity interest meets the definition of an
investment. A majority equity interest that meets the definition of an investment should be
measured using the equity method, unless it is held by a special-purpose government
engaged only in fiduciary activities, a fiduciary fund, or an endowment (including
permanent and term endowments) or permanent fund. Those governments and funds
should measure the majority equity interest at fair value. For all other holdings of a
majority equity interest in a legally separate organization, a government should report the
legally separate organization as a component unit, and the government or fund that holds
the equity interest should report an asset related to the majority equity interest using the
equity method. This Statement establishes that ownership of a majority equity interest in
a legally separate organization results in the government being financially accountable for
the legally separate organization and, therefore, the government should report that
organization as a component unit. This Statement also requires that a component unit in
which a government has a 100 percent equity interest account for its assets, deferred
outflows of resources, liabilities, and deferred inflows of resources at acquisition value at
the date the government acquired a 100 percent equity interest in the component unit.
Transactions presented in flows statements of the component unit in that circumstance
should include only transactions that occurred subsequent to the acquisition. The
requirements of this Statement are effective for reporting periods beginning after December
15, 2018. The City has not completed the process of evaluating the impact of adopting this
Statement.
32

CITY OF PHILADELPHIA
AVIATION FUND
Notes to Financial Statements
In May 2019, GASB issued Statement No. 91, Condit Debt Obligations. The primary
objectives of this Statement are to provide a single method of reporting conduit debt
obligations by issuers and eliminate diversity in practice associated with (1) commitments
extended by issuers, (2) arrangements associated with conduit debt obligations, and (3)
related note disclosures. This Statement achieves those objectives by clarifying the existing
definition of a conduit debt obligation; establishing that a conduit debt obligation is not a
liability of the issuer; establishing standards for accounting and financial reporting of
additional commitments and voluntary commitments extended by issuers and
arrangements associated with conduit debt obligations; and improving required note
disclosures. This Statement also addresses arrangements—often characterized as leases—
that are associated with conduit debt obligations. In those arrangements, capital assets are
constructed or acquired with the proceeds of a conduit debt obligation and used by third-
party obligors in the course of their activities. Payments from third-party obligors are
intended to cover and coincide with debt service payments. During those arrangements,
issuers retain the titles to the capital assets. Those titles may or may not pass to the obligors
at the end of the arrangements. This Statement requires issuers to disclose general
information about their conduit debt obligations, organized by type of commitment,
including the aggregate outstanding principal amount of the issuers’ conduit debt
obligations and a description of each type of commitment. Issuers that recognize liabilities
related to supporting the debt service of conduit debt obligations also should disclose
information about the amount recognized and how the liabilities changed during the
reporting period. The requirements of this Statement are effective for reporting periods
beginning after December 15, 2020. The City has not completed the process of evaluating
the impact of adopting this Statement.
Cash and Investments
The Aviation Fund’s cash and investments are held in segregated operating and capital
accounts and by an outside fiscal agent. Sinking funds and reserves are maintained in
segregated investment accounts to comply with reserve and other requirements of the bond
covenants. No Aviation Fund accounts are comingled with other City funds.
Investments are recorded at fair value. Short-term investments are reported at cost, which
approximates fair value. Securities traded on national or international exchanges are
valued at the last reported sales price. Investments which do not have an established market
are reported at estimated fair value.
33
CITY OF PHILADELPHIA
AVIATION FUND
Notes to Financial Statements
For purposes of the Statement of Cash Flows, all cash and investments held by the City
Treasurer are considered to be cash equivalents because those funds are available on
demand.
Statutes authorize the City to invest in obligations of the Treasury, agencies, and
instruments of the United States, repurchase agreements, collateralized certificates of
deposit, bank acceptance or mortgage obligations, certain corporate bonds, and money
market funds. Management is not aware of any violations of statutory authority or
contractual provisions for investments for the years ended June 30, 2019 and 2018.
Accounts Receivable
Accounts receivable included in current assets consists of billed and unbilled rentals and
fees, which have been earned but not collected as of June 30, 2019 and 2018. Credit
balance receivables have been included in unearned revenue in the Statements of Net
Position. The allowance for doubtful accounts is management’s estimate of the amount of
accounts receivable which will be deemed to be uncollectible and is based upon specific
identification. Unpaid accounts are referred to the City’s Law Department if deemed
uncollectible. Accounts are written-off when recommended by the Law Department.
In fiscal year 2015, the Division of Aviation and the Philadelphia Airport Affairs
Committee (PAAC) entered into an agreement that would reduce the fiscal year 2015 base
rate to the airlines in exchange for a $10 million contribution from the Airport’s Operation
and Maintenance (O&M) reserve account that would be replenished by the signatory
airlines, through the rates and charges process, over a three-year period from fiscal years
2016 to 2018. The Airport included this $10 million as part of the $32.5 million Accounts
Receivable reported for the Aviation Fund in the FY 2015 Statement of Net Position. Since
the agreement states that repayment of the contribution is to take place over the next three
years, the Division of Aviation recorded a $3.3 million offset to airline revenue in fiscal
years 2016 and 2017, specifically landing fees and rents, in recognition of the recovery of
one-third of the prior year accrued revenue of $10 million from FY 2015. The remaining
$3.4 million was collected during fiscal year 2018.
Inventories
Inventories consist of materials and supplies and are carried at amounts determined on a
moving-average cost basis.
Restricted Assets
Restricted assets represent amounts that have been legally restricted by contracts or outside
parties and are not available for payment of operating fund expenditures. The following
represent restricted assets of the Aviation Fund:
34

CITY OF PHILADELPHIA
AVIATION FUND
Notes to Financial Statements
▪ Funds available for construction, including grants due from other governments for
capital purposes.
▪ Sinking funds and reserves held by the Airport’s fiscal agent are reserved for debt
service and construction, pursuant to revenue bond indentures.
▪ Passenger Facility Charges (PFCs) represent fees remitted by airlines based on
passenger ticket sales for flights boarding at Philadelphia International Airport. The
fees are reserved for funding certain Federal Aviation Administration (FAA) approved
capital projects and debt service payments. Collection of PFCs began in the fall of
1992. All unexpended PFC funds, including accumulated interest, are classified as
restricted assets.
▪ Customer Facility Charges (CFCs) represent fees collected by rental car operators from
customers renting motor vehicles at Philadelphia International Airport. CFCs are not
to exceed $8 per rental day. The proceeds are to be used for the planning, development,
financing, construction and operation of a consolidated rental car facility. Collections
of CFCs began in May 2014. All unexpended CFC funds, including accumulated
interest, are classified as restricted assets.
Capital Assets
Capital assets are defined by the GASB as including “land, improvements to land,
easements, buildings, building improvements, vehicles, machinery, equipment, works of
art and historical treasures, infrastructure, and all other tangible or intangible assets that are
used in operations that have initial useful lives extending beyond a single reporting period.”
▪ Land is always treated separately from any related capital asset associated with it (i.e.:
a building on the land, a runway on the land, etc.). The cost of the land includes its
acquisition price and the cost of preparing the land for its intended use. Included in
preparation costs are commissions, professional fees, permanent landscaping,
demolition of existing buildings, and other costs incurred in acquiring the land.
▪ Intangible capital assets lack physical substance and can be expected in many cases to
provide benefit indefinitely. An example of an intangible capital asset is software that
was developed in-house.
▪ Buildings and Building Improvements are permanent structures included in the
category of buildings. Building improvements increase the value of the building and/or
materially extends the useful life of the building. If the improvement does not meet
these conditions, those costs are expensed in the period incurred. Repairs and
maintenance are examples of items expensed because they help to retain value and do
not increase the value of the asset.
35
CITY OF PHILADELPHIA
AVIATION FUND
Notes to Financial Statements
Costs to be included in the capitalized cost of buildings include purchase price,
expenses related to making the building ready for use, environmental compliance costs,
professional fees, taxes paid at the time of purchase, and other costs required to place
the asset into operation.
Constructed buildings include, but are not limited to, project costs for interest accrued
during construction; cost of excavation, grading or filling; expenses incurred for the
plan preparation; specification; blueprints; permits and professional fees; and costs of
temporary buildings used during construction. Costs are expensed if a decision is made
to not proceed with the construction of a building.
Building improvements may include conversion of unused space into usable space,
original installation or upgrading of heating and cooling systems, wall or flooring
coverings, windows and doors, closets, restrooms, phone and closed circuit television
systems, security systems, wiring required for building equipment (that will remain in
the building), renovations of outside building surfaces (including roofs, installation or
replacement of plumbing and electrical wiring), permanently attached fixtures,
machinery, building additions, and costs associated with the above improvements.
Building repairs and maintenance that do not increase the value of the building or
extend its useful life are to be expensed. Examples of such costs may include plumbing
or electrical repairs, maintenance such as pest control and cleaning, interior and exterior
decorations, repainting and repairing of interior and exterior portions of buildings, and
any other repairs and maintenance costs that do not increase the value or extend the
useful life of the asset.
▪ Vehicles and equipment are defined as movable tangible assets used in operations. This
includes general-use, firefighting, and snow removal vehicles and related equipment,
computer equipment, furniture and fixtures, and other moveable equipment.
▪ Infrastructure assets are long-lived capital assets that are normally stationary and can
be preserved for a significantly greater number of years than most capital assets.
Infrastructure includes, but is not limited to: runways, taxiways, aprons, ramps, roads,
sidewalks, signage, drainage systems, water and sewer systems, and lighting systems.
▪ Construction-in-progress includes costs incurred to construct a capital asset before it is
substantially ready to be placed in service. At the time of being placed in service, the
asset will be reclassified into the appropriate asset category and be subject to
depreciation.
36
CITY OF PHILADELPHIA
AVIATION FUND
Notes to Financial Statements
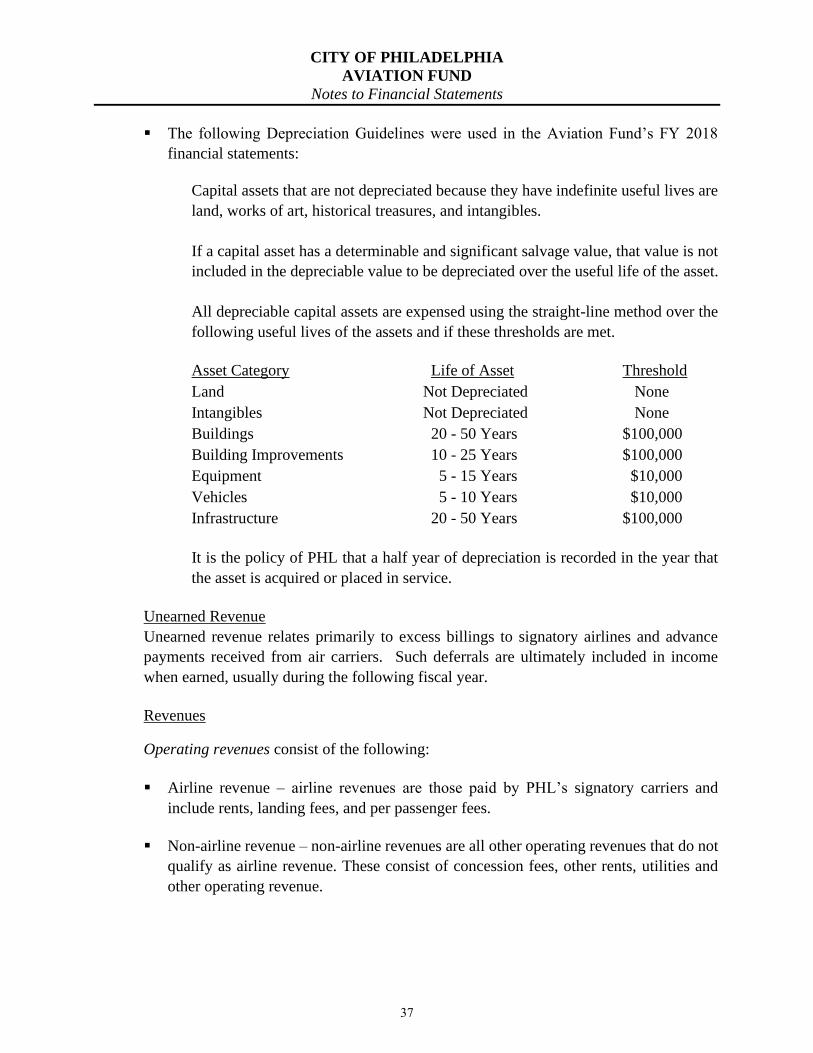
▪ The following Depreciation Guidelines were used in the Aviation Fund’s FY 2018
financial statements:
Capital assets that are not depreciated because they have indefinite useful lives are
land, works of art, historical treasures, and intangibles.
If a capital asset has a determinable and significant salvage value, that value is not
included in the depreciable value to be depreciated over the useful life of the asset.
All depreciable capital assets are expensed using the straight-line method over the
following useful lives of the assets and if these thresholds are met.
Asset Category Life of Asset Threshold
Land Not Depreciated None
Intangibles Not Depreciated None
Buildings 20 - 50 Years $100,000
Building Improvements 10 - 25 Years $100,000
Equipment 5 - 15 Years $10,000
Vehicles 5 - 10 Years $10,000
Infrastructure 20 - 50 Years $100,000
It is the policy of PHL that a half year of depreciation is recorded in the year that
the asset is acquired or placed in service.
Unearned Revenue
Unearned revenue relates primarily to excess billings to signatory airlines and advance
payments received from air carriers. Such deferrals are ultimately included in income
when earned, usually during the following fiscal year.
Revenues
Operating revenues consist of the following:
▪ Airline revenue – airline revenues are those paid by PHL’s signatory carriers and
include rents, landing fees, and per passenger fees.
▪ Non-airline revenue – non-airline revenues are all other operating revenues that do not
qualify as airline revenue. These consist of concession fees, other rents, utilities and
other operating revenue.
37

CITY OF PHILADELPHIA
AVIATION FUND
Notes to Financial Statements
Non-operating revenues consist primarily of the following:
▪ Grants from other governments for non-capital purposes.
▪ Interest income.
▪ PFCs – revenue from PFCs is reserved for the funding of certain capital expenditures
and debt service payments, as approved by the FAA.
▪ CFCs – revenue from CFCs is reserved for the funding of certain capital expenditures
and will be used to plan, design, and construct a facility to be used by vehicle rental
companies on Airport property.
Capital contributions consist of the following:
▪ Grants from other governments for capital purposes.
Operating Expenses
Operating expenses consist primarily of personnel and administrative services, purchase of
goods and services and depreciation and amortization expense.
Bonds and Related Premiums, Discounts, Issuance Costs and Loss on Refunding
Bond premiums and discounts are deferred and amortized on the straight-line method over
the life of the bonds using the effective interest method. Bonds payable are reported net of
applicable premium or discount. Bond issuance costs are expensed as incurred. The loss
on refunding of bonds is amortized on the straight-line method over the lesser of the life of
the old debt or the new debt issued.
Compensated Absences
It is the City’s policy to allow employees to accumulate earned but unused vacation
benefits. Vacation pay is accrued as earned. Sick leave balances are not accrued in the
financial statements because sick leave rights are non-vesting.
Claims and Judgments
Pending claims and judgments are recorded as expenses when the City Solicitor has
deemed that a probable loss to the City has occurred.
38

CITY OF PHILADELPHIA
AVIATION FUND
Notes to Financial Statements
Management’s Use of Estimates
The preparation of financial statements in conformity with accounting principles generally
accepted in the United States of America requires management to make estimates and
assumptions that affect the reported amounts of assets and liabilities and disclosure of
contingent assets and liabilities at the date of the financial statements and the reported
amounts of revenues and expenses during the reporting period. Actual results could differ
from those estimates.
2. DEPOSITS AND INVESTMENTS
For the fiscal years ended June 30, 2019 and 2018, cash and cash equivalents, and
investments (deposits) are included in the financial statements in current and restricted cash
and cash equivalents, and investments (deposits), in sinking funds and reserves held by
fiscal agents, and in cash held by fiscal agent.
Deposits
State statutes require banks to collateralize City deposits at amounts equal to or in excess
of the City’s balance. Such collateral is to be held by the Federal Reserve Bank or the trust
department of a commercial bank other than the pledging bank. All collateralized
securities were held in the City’s name.
Investments
The City has established a comprehensive investment policy to minimize custodial credit
risk for its investments. In so doing, the City has selected custodian banks that are members
of the Federal Reserve System to hold its investments. Delivery of the applicable
investment documents to the City’s custodian is required for all investments.
As of June 30, 2019, the fair value of the Aviation Fund’s holdings consisted of the
following:
Fair Value % of Total
Short-Term Investment Pools 382,301,956$ 38.10%
U.S. Government Securities 312,138,071 31.11%
U.S. Government Agency Securities 74,426,612 7.42%
Municipal and Other Debt Securities 8,165,509 0.81%
Commercial Paper 121,413,587 12.10%
Corporate Bonds 105,010,462 10.46%
1,003,456,197$ 100.0%
39

CITY OF PHILADELPHIA
AVIATION FUND
Notes to Financial Statements
As of June 30, 2018, the fair value of the Aviation Fund’s holdings consisted of the
following:
Fair Value % of Total
Short-Term Investment Pools 402,767,631$ 46.02%
U.S. Government Securities 199,795,514 22.83%
U.S. Government Agency Securities 95,455,918 10.91%
Commercial Paper 90,307,190 10.32%
Corporate Bonds 86,796,678 9.92%
875,122,931$ 100.0%
Interest Rate Risk: The City’s investment portfolio is managed to accomplish preservation
of principal, maintenance of liquidity, and to maximize the return on the investments. To
limit its exposure to fair value losses from rising interest rates, the City’s investment policy
limits fixed income investments to maturities of no longer than two years, except in Sinking
Fund Reserve Portfolios.
As of June 30, 2019, the maturities of holdings were as follows:
Less Than 1 Year 1 - 3 Years
Short-Term Investment Pools 382,301,956$ -$
U.S. Government Securities 242,936,074 69,201,997
U.S. Government Agency Securities 74,426,612 -
Municipal and Other Debt Securities 2,811,024 5,354,485
Commercial Paper 121,413,587 -
Corporate Bonds 56,451,071 48,559,391
880,340,324$ 123,115,873$ As of June 30, 2018, the maturities of holdings were as follows:
Less Than 1
Year 1 - 3 Years
Short-Term Investment Pools 402,767,631$ -$
U.S. Government Securities 18,439,247 181,356,267
U.S. Government Agency Securities 4,260,182 91,195,736
Commercial Paper 90,307,190 -
Corporate Bonds - 86,796,678
515,774,250$ 359,348,681$
Credit Risk: The City’s policy is to limit credit risk by limiting the type of allowable
investment, as well as the maximum percent of the portfolio for each type of investment.
40

CITY OF PHILADELPHIA
AVIATION FUND
Notes to Financial Statements
The City’s investment in U.S. Government securities (39.97%) or U.S. Government
Agency obligations (19.29%) are allowable investments up to 100% of the portfolio.
The U.S. Government Agency obligations must be rated AAA by Standard & Poor’s Corp.
(S&P) or Aaa by Moody’s Investor Services (Moody’s). All U.S. Government Securities
meet the criteria.
The City’s investment in Commercial Paper (15.70%) is limited to 25% of the portfolio
and must be rated A1 by S&P and/or M1G1 by Moody’s and the senior long-term debt of
the issuer must not be rated lower than A by S&P and/or Aa2 by Moody’s. All commercial
paper investments meet the criteria.
The City’s investment in corporate bonds (8.55%) is limited to 25% of the portfolio and
had an S&P rating of AAA to AA or Moody’s rating of Aa2 or better. All corporate
investments meet the criteria
Short-term investment pools are rated AAA by S&P and Aaa by Moody’s. The short-term
investment pools’ amortized cost-based net asset value per share/unit is the same as the
value of the pool shares. Cash accounts are swept nightly and idle cash invested in money
market funds (short-term investment pools).
The City limits its foreign currency risk by investing in certificates of deposit and banker’s
acceptances issued or endorsed by non-domestic banks that are denominated in U.S. dollars
providing that the banking institution has assets of not less than $100 million and has a
Thompson’s Bank Watch Service “Peer Group Rating” not lower than II. At the end of
the fiscal year, the City did not have any investments of that nature.
Fair Value Measurement: The City measures and records its investments using fair value
measurement guidelines established by generally accepted accounting principles. These
guidelines recognize a three-tiered fair value hierarchy, as follows:
o Level 1: Observable inputs that reflect quoted prices (unadjusted) for identical
assets or liabilities in active markets
o Level 2: Inputs other than quoted prices included in Level 1 that are observable for
the asset or liability
o Level 3: Unobservable inputs for assets or liabilities
The Airport has the following recurring fair value measurements as of June 30, 2019:
41
CITY OF PHILADELPHIA
AVIATION FUND
Notes to Financial Statements
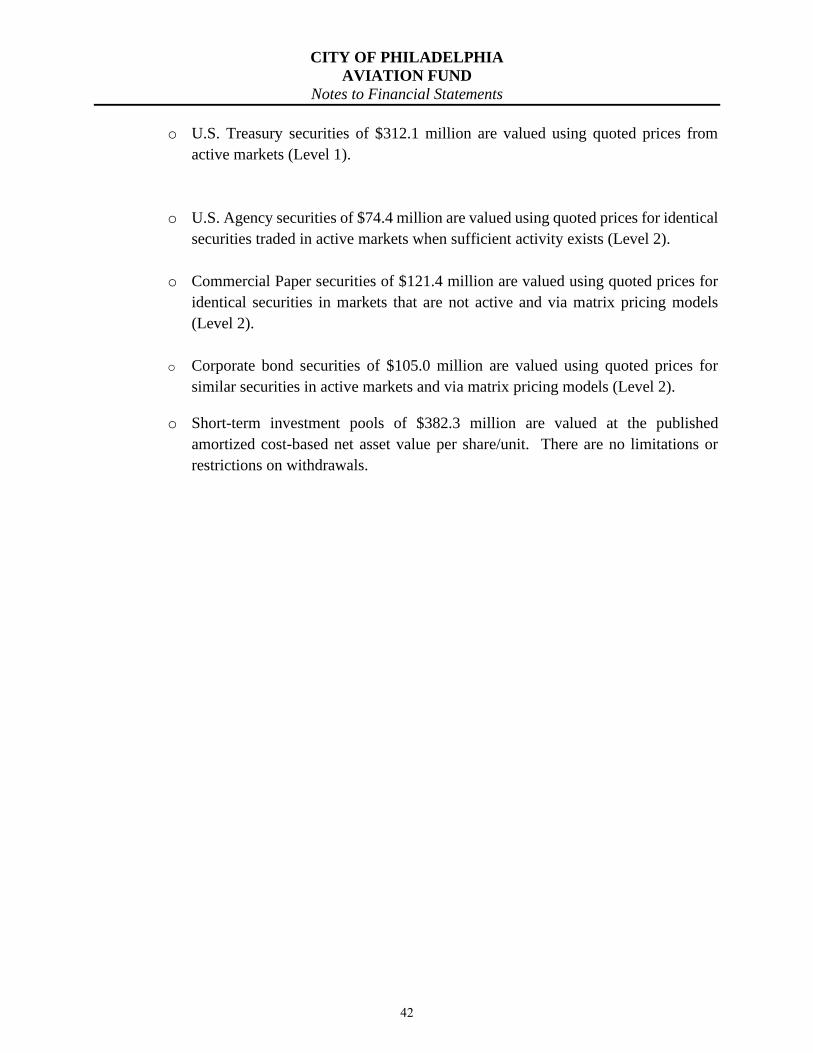
o U.S. Treasury securities of $312.1 million are valued using quoted prices from
active markets (Level 1).
o U.S. Agency securities of $74.4 million are valued using quoted prices for identical
securities traded in active markets when sufficient activity exists (Level 2).
o Commercial Paper securities of $121.4 million are valued using quoted prices for
identical securities in markets that are not active and via matrix pricing models
(Level 2).
o Corporate bond securities of $105.0 million are valued using quoted prices for
similar securities in active markets and via matrix pricing models (Level 2).
o Short-term investment pools of $382.3 million are valued at the published
amortized cost-based net asset value per share/unit. There are no limitations or
restrictions on withdrawals.
42
CITY OF PHILADELPHIA
AVIATION FUND
Notes to Financial Statements
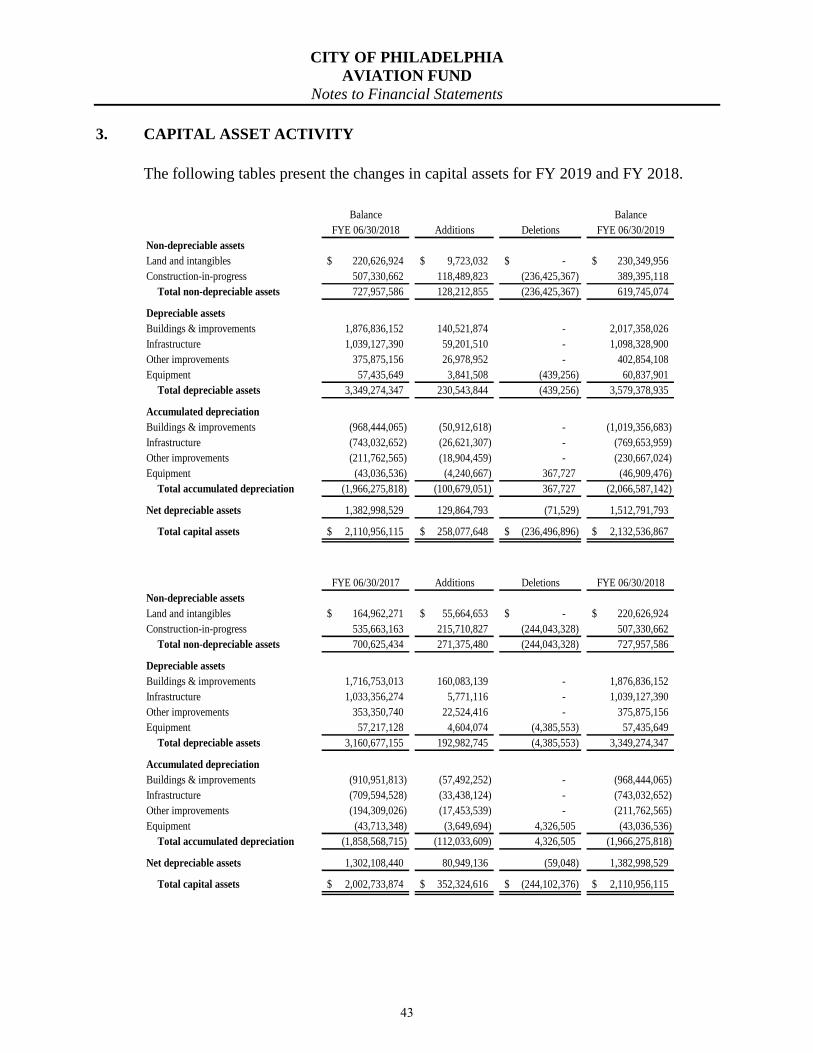
3. CAPITAL ASSET ACTIVITY
The following tables present the changes in capital assets for FY 2019 and FY 2018.
Balance Balance
FYE 06/30/2018 Additions Deletions FYE 06/30/2019
Non-depreciable assets
Land and intangibles 220,626,924$ 9,723,032$ -$ 230,349,956$
Construction-in-progress 507,330,662 118,489,823 (236,425,367) 389,395,118
Total non-depreciable assets 727,957,586 128,212,855 (236,425,367) 619,745,074
Depreciable assets
Buildings & improvements 1,876,836,152 140,521,874 - 2,017,358,026
Infrastructure 1,039,127,390 59,201,510 - 1,098,328,900
Other improvements 375,875,156 26,978,952 - 402,854,108
Equipment 57,435,649 3,841,508 (439,256) 60,837,901
Total depreciable assets 3,349,274,347 230,543,844 (439,256) 3,579,378,935
Accumulated depreciation
Buildings & improvements (968,444,065) (50,912,618) - (1,019,356,683)
Infrastructure (743,032,652) (26,621,307) - (769,653,959)
Other improvements (211,762,565) (18,904,459) - (230,667,024)
Equipment (43,036,536) (4,240,667) 367,727 (46,909,476)
Total accumulated depreciation (1,966,275,818) (100,679,051) 367,727 (2,066,587,142)
Net depreciable assets 1,382,998,529 129,864,793 (71,529) 1,512,791,793
Total capital assets 2,110,956,115$ 258,077,648$ (236,496,896)$ 2,132,536,867$
FYE 06/30/2017 Additions Deletions FYE 06/30/2018
Non-depreciable assets
Land and intangibles 164,962,271$ 55,664,653$ -$ 220,626,924$
Construction-in-progress 535,663,163 215,710,827 (244,043,328) 507,330,662
Total non-depreciable assets 700,625,434 271,375,480 (244,043,328) 727,957,586
Depreciable assets
Buildings & improvements 1,716,753,013 160,083,139 - 1,876,836,152
Infrastructure 1,033,356,274 5,771,116 - 1,039,127,390
Other improvements 353,350,740 22,524,416 - 375,875,156
Equipment 57,217,128 4,604,074 (4,385,553) 57,435,649
Total depreciable assets 3,160,677,155 192,982,745 (4,385,553) 3,349,274,347
Accumulated depreciation
Buildings & improvements (910,951,813) (57,492,252) - (968,444,065)
Infrastructure (709,594,528) (33,438,124) - (743,032,652)
Other improvements (194,309,026) (17,453,539) - (211,762,565)
Equipment (43,713,348) (3,649,694) 4,326,505 (43,036,536)
Total accumulated depreciation (1,858,568,715) (112,033,609) 4,326,505 (1,966,275,818)
Net depreciable assets 1,302,108,440 80,949,136 (59,048) 1,382,998,529
Total capital assets 2,002,733,874$ 352,324,616$ (244,102,376)$ 2,110,956,115$
43

CITY OF PHILADELPHIA
AVIATION FUND
Notes to Financial Statements
A portion of bond interest expense net of related interest income on unexpended funds is
capitalized during the construction phase of the projects funded by the bonds. Net interest
capitalized to construction-in-progress was $13,523,667 and $1,609,614 for the fiscal years
ending June 30, 2019 and 2018, respectively. For the fiscal year ending June 30, 2019, this
represents $18,982,796 of interest expense net of $5,459,129 of interest income. For the
fiscal year ending June 30, 2018, this represents $1,621,197 of interest expense net of
$11,583 of interest income.
Depreciation and amortization expense were $100,679,051 and $112,033,608 for the fiscal
years ending June 30, 2019 and 2018, respectively.
4. UNEARNED REVENUE
Unearned revenue was $38,769,077 and $26,426,875 for the fiscal years ending June 30,
2019 and 2018, respectively and includes revenues received in advance, excess billing to
the scheduled airlines, and credit balance receivables.
5. ARBITRAGE REBATE
The Aviation Fund has several series of revenue bonds subject to federal arbitrage
requirements. Federal tax legislation requires that the accumulated net excess of interest
income on the proceeds of these issues over interest expense paid on the bonds be paid to
the federal government at the end of a five-year period. The Airport’s arbitrage rebate
liability was $0 as of June 30, 2019 and 2018.
44
CITY OF PHILADELPHIA
AVIATION FUND
Notes to Financial Statements
6. DERIVATIVE INSTRUMENTS AND INTEREST RATE SWAP
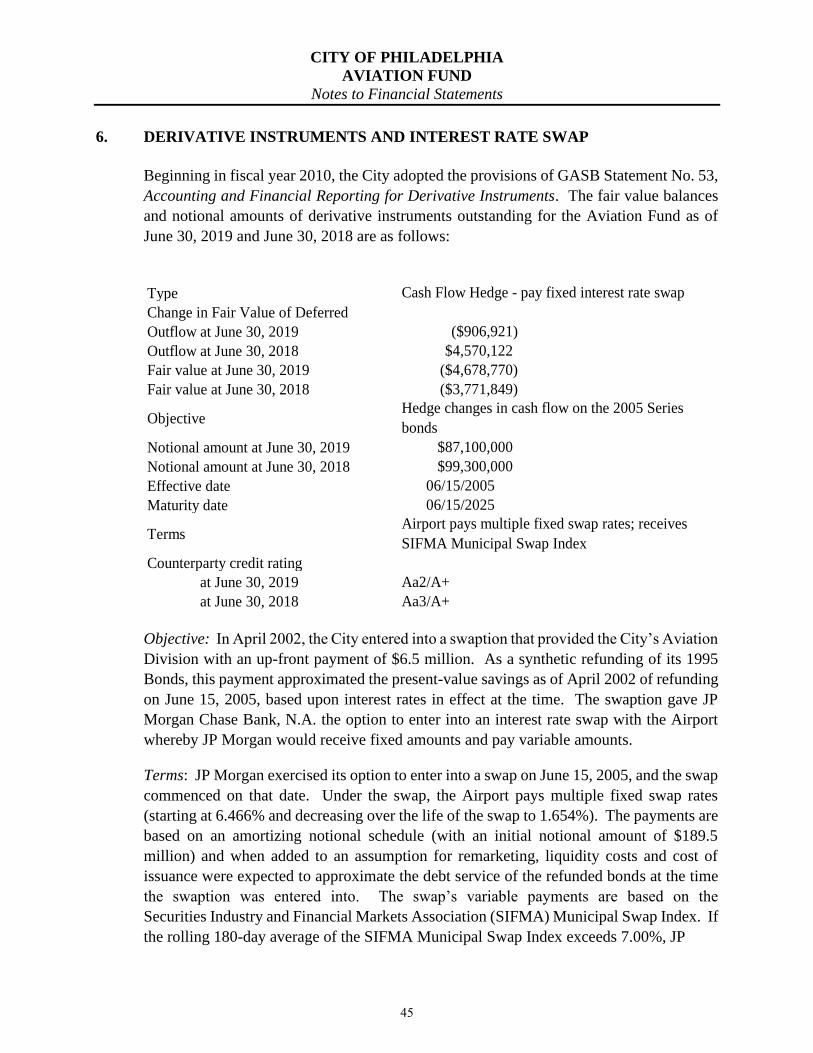
Beginning in fiscal year 2010, the City adopted the provisions of GASB Statement No. 53,
Accounting and Financial Reporting for Derivative Instruments. The fair value balances
and notional amounts of derivative instruments outstanding for the Aviation Fund as of
June 30, 2019 and June 30, 2018 are as follows:
Type
Change in Fair Value of Deferred
Outflow at June 30, 2019 ($906,921)
Outflow at June 30, 2018 $4,570,122
Fair value at June 30, 2019 ($4,678,770)
Fair value at June 30, 2018 ($3,771,849)
Objective
Notional amount at June 30, 2019 $87,100,000
Notional amount at June 30, 2018 $99,300,000
Effective date 06/15/2005
Maturity date 06/15/2025
Terms
Counterparty credit rating
at June 30, 2019 Aa2/A+
at June 30, 2018 Aa3/A+
Cash Flow Hedge - pay fixed interest rate swap
Airport pays multiple fixed swap rates; receives
SIFMA Municipal Swap Index
Hedge changes in cash flow on the 2005 Series
bonds
Objective: In April 2002, the City entered into a swaption that provided the City’s Aviation
Division with an up-front payment of $6.5 million. As a synthetic refunding of its 1995
Bonds, this payment approximated the present-value savings as of April 2002 of refunding
on June 15, 2005, based upon interest rates in effect at the time. The swaption gave JP
Morgan Chase Bank, N.A. the option to enter into an interest rate swap with the Airport
whereby JP Morgan would receive fixed amounts and pay variable amounts.
Terms: JP Morgan exercised its option to enter into a swap on June 15, 2005, and the swap
commenced on that date. Under the swap, the Airport pays multiple fixed swap rates
(starting at 6.466% and decreasing over the life of the swap to 1.654%). The payments are
based on an amortizing notional schedule (with an initial notional amount of $189.5
million) and when added to an assumption for remarketing, liquidity costs and cost of
issuance were expected to approximate the debt service of the refunded bonds at the time
the swaption was entered into. The swap’s variable payments are based on the
Securities Industry and Financial Markets Association (SIFMA) Municipal Swap Index. If
the rolling 180-day average of the SIFMA Municipal Swap Index exceeds 7.00%, JP
45
CITY OF PHILADELPHIA
AVIATION FUND
Notes to Financial Statements
Morgan Chase has the option to terminate the swap.
As of June 30, 2019, and June 30, 2018, the swap had a notional amount of $87.1 million
and $99.3 million, respectively, and the associated variable-rate bonds had a $87.1 million
and $99.3 million principal amount, respectively. The bonds’ variable-rate coupons are
not based on an index but on remarketing performance. The bonds mature on June 15,
2025. The swap will terminate on June 15, 2025 if not previously terminated by JP Morgan
Chase.
Fair Value: As of June 30, 2019, and June 30, 2018, the swap had a negative fair value of
($4.7) million and ($3.8) million, respectively. This means that if the swap terminated
today, the Airport would have to pay this amount to JP Morgan Chase. The fair value
reflects the effect of non-performance risk, which includes credit risk. The fair value of the
swap was measured using the income approach and is categorized within Level 2 of the
fair value hierarchy.
Risk: As of June 30, 2019, the Airport was not exposed to credit risk because the swap had
a negative fair value. Should interest rates change and the fair value of the swap become
positive, the Airport would be exposed to credit risk in the amount of the swap’s fair value.
In addition, the Airport is subject to basis risk should the relationship between SIFMA and
the bonds change; if SIFMA resets at a rate below the variable bond rate, the synthetic
interest rate will be greater than anticipated. The swap includes an additional termination
event based on downgrades in credit ratings. The swap may be terminated by the Airport
if JP Morgan’s ratings fall below A- or A3, or by JP Morgan Chase if the Airport’s ratings
fall below BBB or Baa2. No termination event based on the Airport’s ratings can occur as
long as National Public Finance Guarantee Corporation (Formerly MBIA) is rated at least
A- or A3.
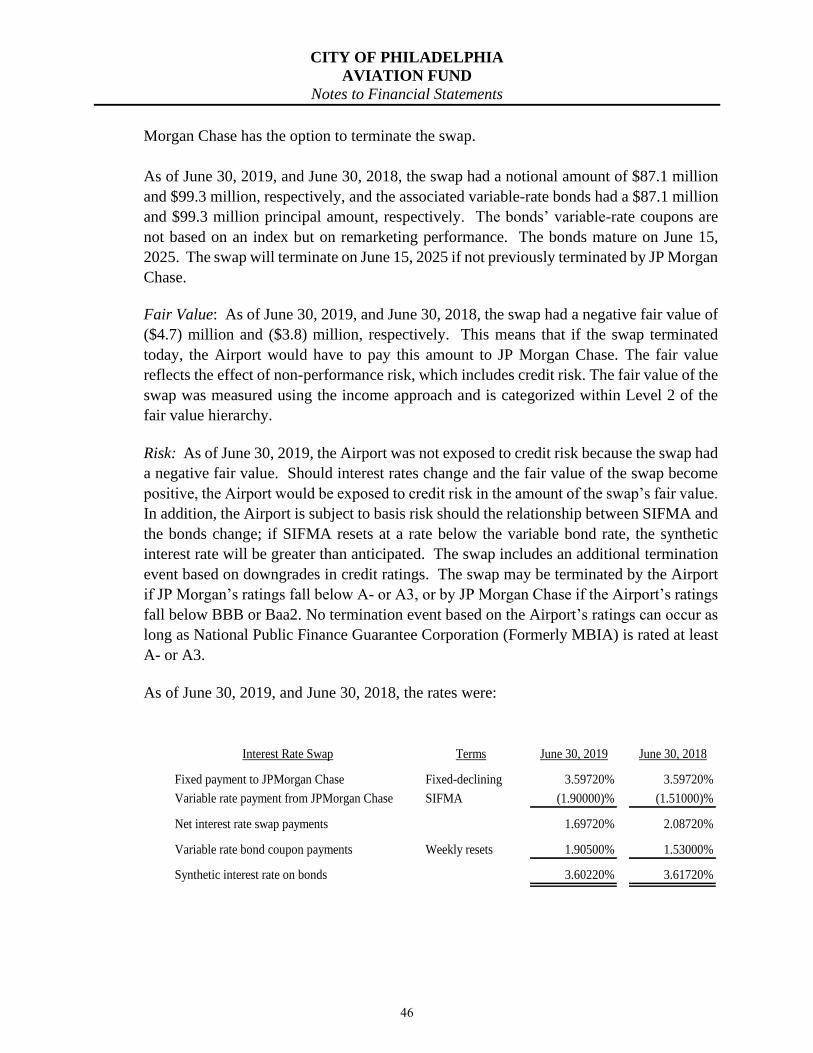
As of June 30, 2019, and June 30, 2018, the rates were:
Interest Rate Swap Terms June 30, 2019 June 30, 2018
Fixed payment to JPMorgan Chase Fixed-declining 3.59720% 3.59720%
Variable rate payment from JPMorgan Chase SIFMA (1.90000)% (1.51000)%
Net interest rate swap payments 1.69720% 2.08720%
Variable rate bond coupon payments Weekly resets 1.90500% 1.53000%
Synthetic interest rate on bonds 3.60220% 3.61720%
46
CITY OF PHILADELPHIA
AVIATION FUND
Notes to Financial Statements
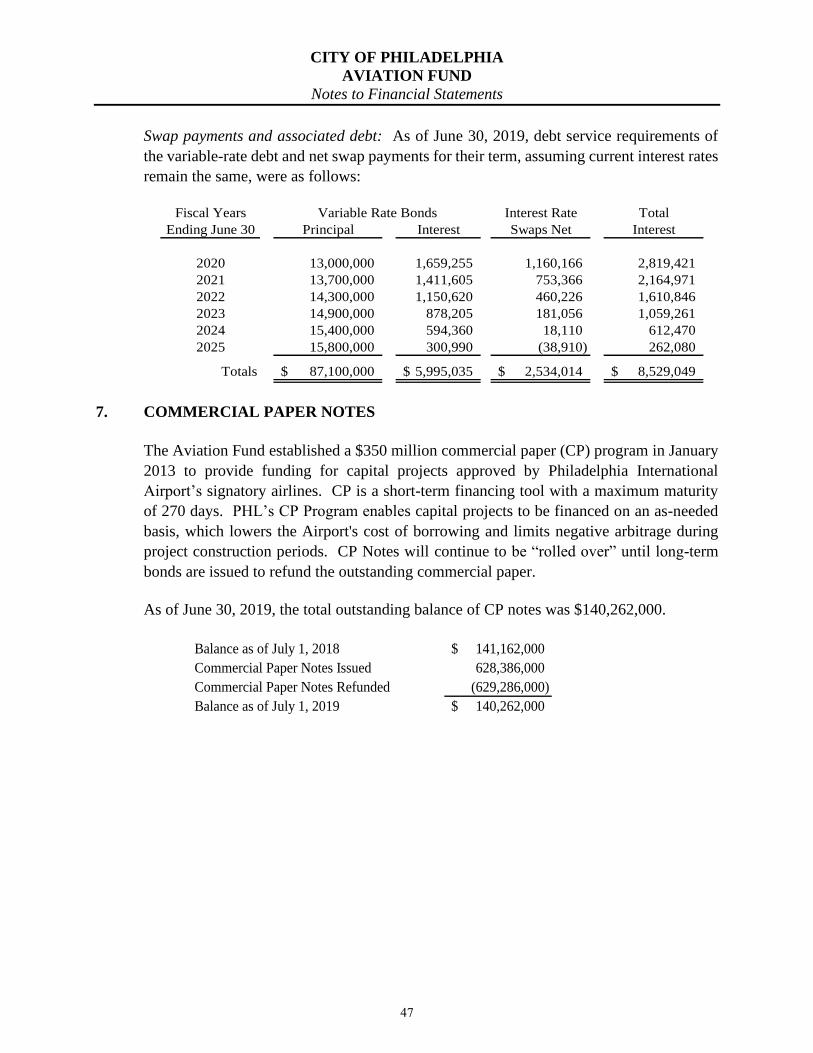
Swap payments and associated debt: As of June 30, 2019, debt service requirements of
the variable-rate debt and net swap payments for their term, assuming current interest rates
remain the same, were as follows:
Fiscal Years Interest Rate Total
Ending June 30 Principal Interest Swaps Net Interest
2020 13,000,000 1,659,255 1,160,166 2,819,421
2021 13,700,000 1,411,605 753,366 2,164,971
2022 14,300,000 1,150,620 460,226 1,610,846
2023 14,900,000 878,205 181,056 1,059,261
2024 15,400,000 594,360 18,110 612,470
2025 15,800,000 300,990 (38,910) 262,080
Totals 87,100,000$ 5,995,035$ 2,534,014$ 8,529,049$
Variable Rate Bonds
7. COMMERCIAL PAPER NOTES
The Aviation Fund established a $350 million commercial paper (CP) program in January
2013 to provide funding for capital projects approved by Philadelphia International
Airport’s signatory airlines. CP is a short-term financing tool with a maximum maturity
of 270 days. PHL’s CP Program enables capital projects to be financed on an as-needed
basis, which lowers the Airport's cost of borrowing and limits negative arbitrage during
project construction periods. CP Notes will continue to be “rolled over” until long-term
bonds are issued to refund the outstanding commercial paper.
As of June 30, 2019, the total outstanding balance of CP notes was $140,262,000.
Balance as of July 1, 2018 141,162,000$
Commercial Paper Notes Issued 628,386,000
Commercial Paper Notes Refunded (629,286,000)
Balance as of July 1, 2019 140,262,000$
47
CITY OF PHILADELPHIA
AVIATION FUND
Notes to Financial Statements
8. BONDS PAYABLE
General obligation (G.O.) bonds, payable out of Aviation Fund revenues, consist of bonds
declared by statute to be self-sustaining from airport revenues. There are no G.O. bonds
outstanding as of June 30, 2019.
In June 2005, Airport Revenue Refunding Bonds, Series 2005C in the amount of $189.5
million were issued. The proceeds of Series 2005C were used to refund $183.9 million of
the 1995A Series Airport Revenue Bonds, maturing from 2006 through 2025, and to pay
issuance and insurance costs on the bonds. The cash flow required by the new bonds was
the same as the cash flow required by the refunded bonds at the time of the sale. JPMorgan
entered into a swaption agreement with the Airport on the 1995A bonds in 2002, which
was exercised June 15, 2005. In December 2008, the outstanding balance of $178.6 million
of Airport Revenue Refunding Bonds, Series 2005C was remarketed under an irrevocable
direct pay letter of credit (“LOC”) from TD Bank (“the Bank”). The LOC replaces a bond
insurance policy from MBIA Insurance Corporation and a liquidity facility for the 2005C
bonds provided by JP Morgan Chase Bank, N.A., pursuant to a standby bond purchase
agreement, issued simultaneously with the issuance of the 2005C bonds in June 2005, and
the surety policy for the sinking fund reserve account for the 2005C bonds. The LOC
constitutes both a credit facility and liquidity facility under the Ordinance and the Variable
Rate Securities Agreement, and the TD Bank will be the credit provider and liquidity
provider under the Ordinance and the Variable Rate Securities Agreement for the 2005C
bonds. The bonds will have a weekly interest rate and maturity date in 2025.
In November 2010, Airport Revenue Bonds, Series 2010 were issued in the amount of
$624.7 million:
• Airport Revenue Bonds, Series 2010A (non-AMT) were issued as serial and term
bonds in the amount of $273.1 million. Insured serial bonds were issued in the
amount of $16.5 million with interest rates ranging from 3% to 4.5% and a maturity
in 2035 and uninsured serial bonds in the amount of $113.0 million with
a maturity of 2030. Insured term bonds were issued in the amount of $25 million
and $48 million with an interest rate of 5% and maturities in 2035 and 2040.
Uninsured term bonds were issued in the amounts of $37.8 million and $32.8
million with an interest rate of 5% and maturities in 2035 and 2040. The proceeds
of Series 2010A were used to finance certain capital improvements to the airport
system; fund the deposits into the sinking funds; finance capitalized interest; and
pay costs of issuance relating to the bonds.
48
CITY OF PHILADELPHIA
AVIATION FUND
Notes to Financial Statements
• Airport Revenue Refunding Bonds, Series 2010B (non-AMT) were issued as
uninsured serial bonds in the amount of $24.4 million with interest ranging from
2.0% to 5% and maturing in 2015. The proceeds of these bonds were used to refund
the City’s Airport Revenue Bonds, Series 1997A; fund the deposit into the sinking
fund reserve; and pay costs of issuance relating to the bonds.
• Airport Revenue Refunding Bonds, Series 2010C were issued as uninsured serial
bonds in the amount of $54.7 million with interest ranging from 2.0% to 5% and
maturing in 2018. The proceeds of these bonds were used to partially refund the
City’s Airport Revenue Bonds, Series 1998A; fund the deposit into the sinking fund
reserve; and pay costs of issuance relating to the bonds.
• Airport Revenue Refunding Bonds, Series 2010D were issued in the amount of
$272.5 million. Insured serial bonds were issued in the amount of $1.9 million with
interest ranging from 4.0% to 4.5% and maturing in 2024. Uninsured serial bonds
were issued in the amount of $270.7 million with interest ranging from 2.0% to
5.25% and maturing in 2028. The proceeds of these bonds were used to partially
refund the City’s Airport Revenue Bonds, Series 1998B; fund the deposit into the
sinking fund reserve; and pay costs of issuance relating to the bonds. Any
prepayment of the 1998B bond shall be in an amount that is sufficient and used to
pay a like amount of the PAID Airport Revenue Series 1998A also known as the
International Terminal Bonds.
In December 2011, Airport Revenue Refunding Bonds, Series 2011 were issued in the
amount of $233.8 million. The Series 2011A bonds (AMT) were issued as serial bonds in
the amount of $199.0 million with interest rates ranging from 2% to 5% and maturing in
2028. The Series 2011B bonds were issued as serial bonds in the amount of $34.8 million,
with interest rates ranging from 2% to 5% and maturing in 2031. The proceeds of these
bonds were used to: (i) refund a portion of the International Terminal Bonds; (ii) refund all
of the City’s outstanding Airport Revenue Bonds, Series 2001B; and (iii) pay the issuance
costs of the bonds. The proceeds from the 2011A bonds were used to refund
the entire principal amount of $149.3 million for the Airport Revenue Bonds, Series
2001A. In addition, the 2011B bonds were used to refund a portion of the Airport Revenue
Bond Series 1998B (outstanding aggregate principal amount of $57.1 million).
In August 2015, Airport Revenue Refunding Bonds, Series 2015A were issued in the
amount of $97.8 million. The proceeds of Series 2015A were used to refund Revenue
Bonds, Series 2005A and pay the costs of issuance of the Bonds. The refunding structure
of the 2015A bonds realized a net present value savings of approximately $9.3 million or
8.75% of the principal amount of the refunded bonds.
49

CITY OF PHILADELPHIA
AVIATION FUND
Notes to Financial Statements
In December 2017, Airport Revenue and Refunding Bonds, Series 2017 were issued in the
amount of $692.5 million. The Series 2017A bonds (Non-AMT), totaling $138.6 million,
were issued as serial bonds in the amount of $97.6 million with interest rates ranging from
3.125% to 5%, maturing in 2037, and term bonds in the amounts of $16.0 million and $25.1
million with interest rates of 5% and maturing in 2042 and 2047, respectively. The Series
2017B bonds, totaling $553.9 million, were issued as serial bonds in the amount of $334.9
million, with interest rates of 5% and maturing in 2037, and term bonds in the amounts of
$85.2 million and $133.8 million with interest rates of 5% and maturing in 2042 and 2047,
respectively. The proceeds of these bonds were used to: (i) currently refund certain
outstanding commercial paper notes, (ii) pay for a portion of the costs of the 2017 Capital
Project, (iii) currently refund all of the City’s outstanding Airport Revenue Bonds, Series
2007A, and all of the City’s outstanding Airport Revenue Refunding Bonds, Series 2007B,
and a portion of the 2017B Bonds proceeds will be used to currently refund all of the City’s
outstanding Airport Revenue Refunding Bonds, Series 2009A, (iv) provide for capitalized
interest on a portion of the 2017 Bonds, (v) fund a deposit to the Parity Sinking Fund
Reserve Account, and (vi) pay the costs of issuance of the 2017 Bonds.
The amount of debt service payable for revenue bonds to maturity is as follows:
Fiscal Years Total
Ending June 30 Principal Interest Debt Service
2020 64,285,000 68,408,025 132,693,025$
2021 68,690,000 65,180,948 133,870,948
2022 76,170,000 61,787,315 137,957,315
2023 79,885,000 58,099,880 137,984,880
2024 83,685,000 54,346,844 138,031,844
2025-2029 366,770,000 213,290,522 580,060,522
2030-2034 206,775,000 143,026,756 349,801,756
2035-2039 207,885,000 91,251,872 299,136,872
2040-2044 129,355,000 48,422,500 177,777,500
2045-2048 130,120,000 13,408,750 143,528,750
Totals 1,413,620,000$ 817,223,412$ 2,230,843,412$
The early extinguishment of debt can result in a loss on refunding, representing the
difference between the reacquisition price, plus or minus unamortized premium or
discount, and the amount of debt extinguished. The resulting loss is amortized annually
over the life of the refunded bonds and reflected in the Deferred Outflows section on the
Statements of Net Position.
50
CITY OF PHILADELPHIA
AVIATION FUND
Notes to Financial Statements
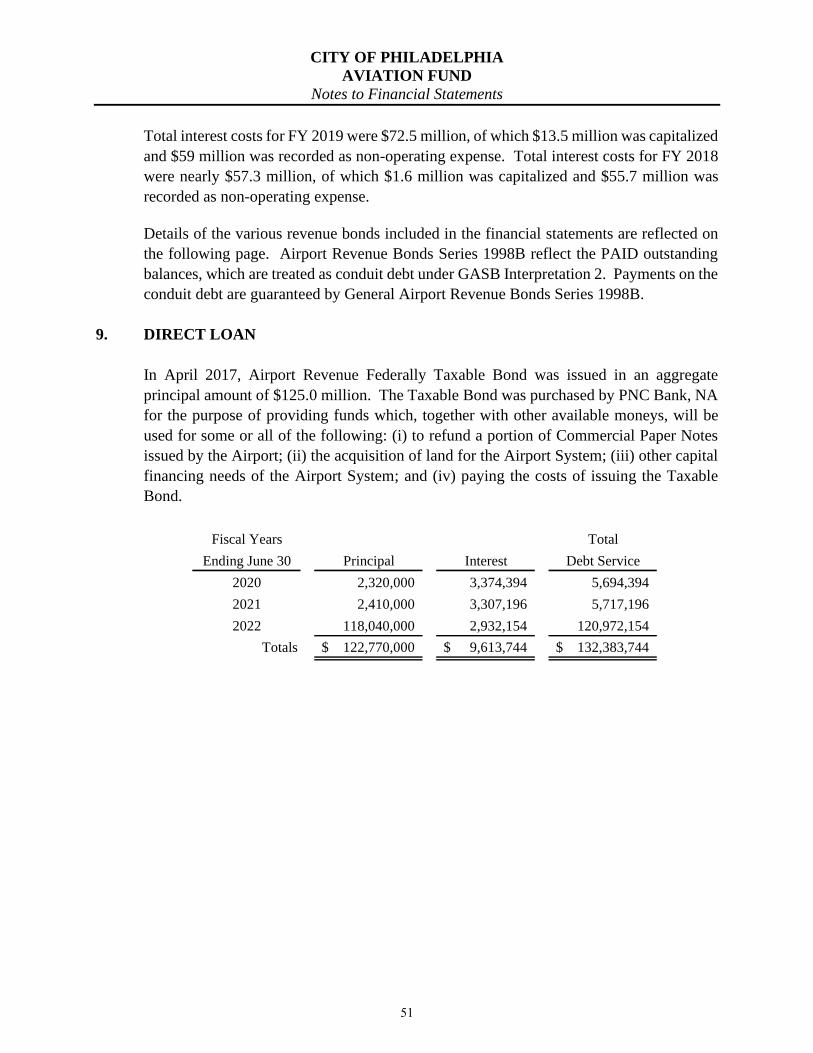
Total interest costs for FY 2019 were $72.5 million, of which $13.5 million was capitalized
and $59 million was recorded as non-operating expense. Total interest costs for FY 2018
were nearly $57.3 million, of which $1.6 million was capitalized and $55.7 million was
recorded as non-operating expense.
Details of the various revenue bonds included in the financial statements are reflected on
the following page. Airport Revenue Bonds Series 1998B reflect the PAID outstanding
balances, which are treated as conduit debt under GASB Interpretation 2. Payments on the
conduit debt are guaranteed by General Airport Revenue Bonds Series 1998B.
9. DIRECT LOAN
In April 2017, Airport Revenue Federally Taxable Bond was issued in an aggregate
principal amount of $125.0 million. The Taxable Bond was purchased by PNC Bank, NA
for the purpose of providing funds which, together with other available moneys, will be
used for some or all of the following: (i) to refund a portion of Commercial Paper Notes
issued by the Airport; (ii) the acquisition of land for the Airport System; (iii) other capital
financing needs of the Airport System; and (iv) paying the costs of issuing the Taxable
Bond.
Fiscal Years Total
Ending June 30 Principal Interest Debt Service
2020 2,320,000 3,374,394 5,694,394
2021 2,410,000 3,307,196 5,717,196
2022 118,040,000 2,932,154 120,972,154
Totals 122,770,000$ 9,613,744$ 132,383,744$
51
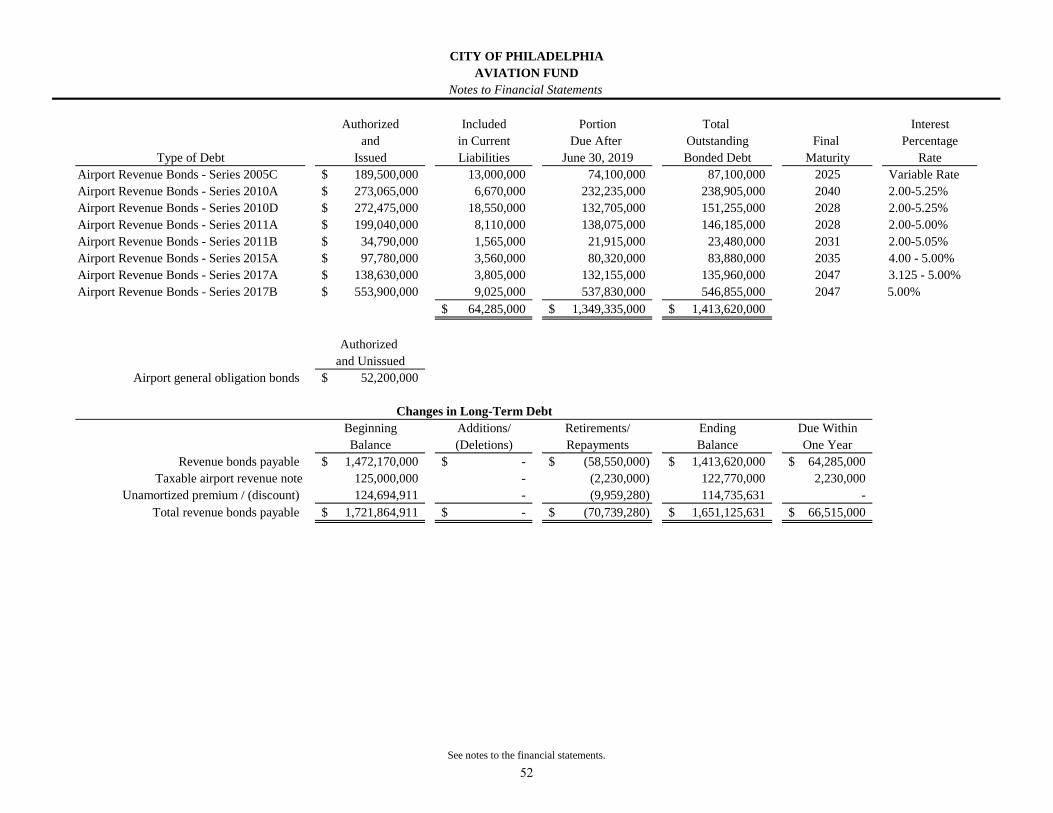
Authorized Included Portion Total Interest
and in Current Due After Outstanding Final Percentage
Type of Debt Issued Liabilities June 30, 2019 Bonded Debt Maturity Rate
Airport Revenue Bonds - Series 2005C 189,500,000$ 13,000,000 74,100,000 87,100,000 2025 Variable Rate
Airport Revenue Bonds - Series 2010A 273,065,000$ 6,670,000 232,235,000 238,905,000 2040 2.00-5.25%
Airport Revenue Bonds - Series 2010D 272,475,000$ 18,550,000 132,705,000 151,255,000 2028 2.00-5.25%
Airport Revenue Bonds - Series 2011A 199,040,000$ 8,110,000 138,075,000 146,185,000 2028 2.00-5.00%
Airport Revenue Bonds - Series 2011B 34,790,000$ 1,565,000 21,915,000 23,480,000 2031 2.00-5.05%
Airport Revenue Bonds - Series 2015A 97,780,000$ 3,560,000 80,320,000 83,880,000 2035 4.00 - 5.00%
Airport Revenue Bonds - Series 2017A 138,630,000$ 3,805,000 132,155,000 135,960,000 2047 3.125 - 5.00%
Airport Revenue Bonds - Series 2017B 553,900,000$ 9,025,000 537,830,000 546,855,000 2047 5.00%
64,285,000$ 1,349,335,000$ 1,413,620,000$
Authorized
and Unissued
Airport general obligation bonds 52,200,000$
Beginning Additions/ Retirements/ Ending Due Within
Balance (Deletions) Repayments Balance One Year
Revenue bonds payable 1,472,170,000$ -$ (58,550,000)$ 1,413,620,000$ 64,285,000$
Taxable airport revenue note 125,000,000 - (2,230,000) 122,770,000 2,230,000
Unamortized premium / (discount) 124,694,911 - (9,959,280) 114,735,631 -
Total revenue bonds payable 1,721,864,911$ -$ (70,739,280)$ 1,651,125,631$ 66,515,000$
CITY OF PHILADELPHIA
AVIATION FUND
Notes to Financial Statements
Changes in Long-Term Debt
See notes to the financial statements.
52

CITY OF PHILADELPHIA
AVIATION FUND
Notes to Financial Statements
10. FUND BALANCES
The following is a description of the restrictions for all net position categories of the
Airport:
▪ Net Investment in Capital Assets reflects the investment in fixed assets net of
accumulated depreciation and reduced by outstanding debt related to expended bond
proceeds.
▪ Restricted for Capital Projects reflects the unexpended funds from bond and CP
proceeds, CFCs and PFCs, which are reserved for construction of capital projects,
offset by outstanding debt related to unexpended bond proceeds.
▪ Restricted for Debt Service reflects the unexpended funds from bond proceeds and
PFCs, which are reserved for repayment of debt.
▪ Unrestricted reflects net position available for current and future operations.
11. DEFERRED COMPENSATION PLAN
The City offers its employees a deferred compensation plan in accordance with Internal
Revenue Code section 457. As required by the Code and Pennsylvania laws in effect at
June 30, 2014, the assets of the plan are held in trust for the exclusive benefit of the
participants and their beneficiaries. In accordance with GASB Statement No. 32,
Accounting and Financial Reporting for Internal Revenue Code Section 457 Deferred
Compensation Plans, the Airport does not include the assets or activity of the plan in its
financial statements.
12. OPERATING LEASES
The Airport as a Lessor
In June 2015, the City Council of Philadelphia approved a five-year Airport-Airline Use
and Lease Agreement (Airline Agreement) between PHL and the airlines. The Airline
Agreement began July 1, 2015 and includes options for two one-year extensions.
The Airport’s other operating leases consist primarily of leases of airport facilities for retail
or other aviation related matters. Most assets constructed by lessees revert to the City at
the end of the lease term as per the lease. Those assets are recorded at fair value, as
determined by an appraisal of the property.
53
CITY OF PHILADELPHIA
AVIATION FUND
Notes to Financial Statements
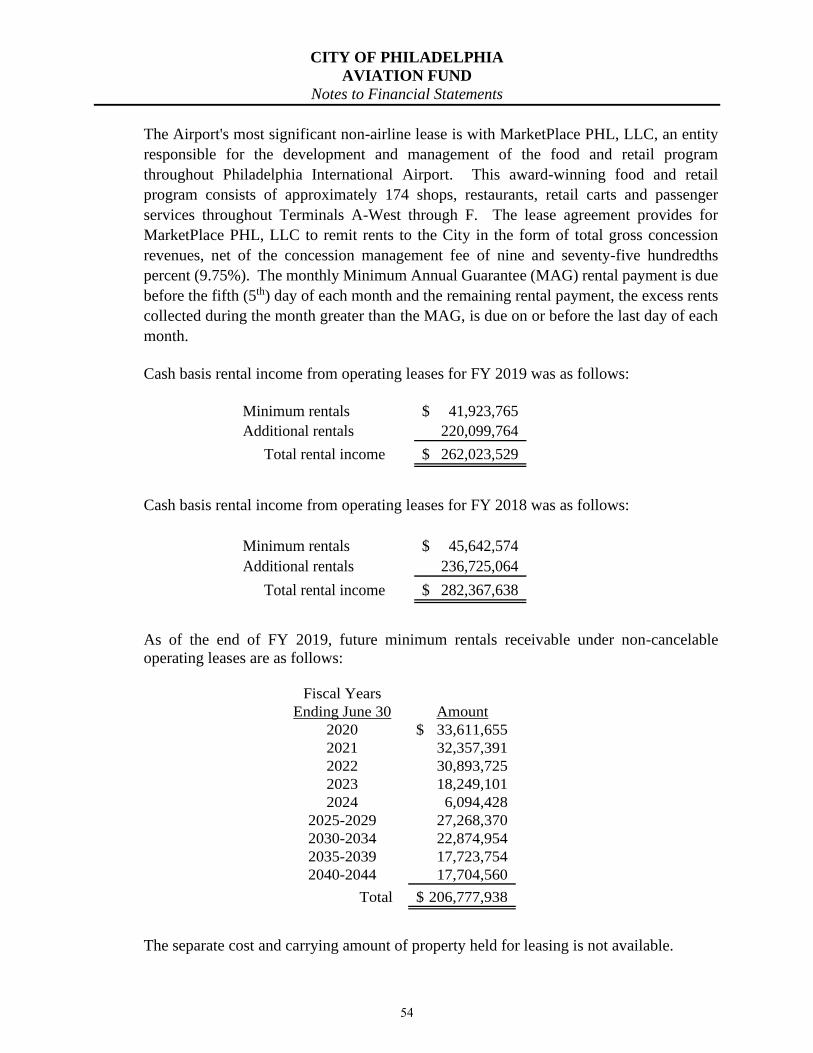
The Airport's most significant non-airline lease is with MarketPlace PHL, LLC, an entity
responsible for the development and management of the food and retail program
throughout Philadelphia International Airport. This award-winning food and retail
program consists of approximately 174 shops, restaurants, retail carts and passenger
services throughout Terminals A-West through F. The lease agreement provides for
MarketPlace PHL, LLC to remit rents to the City in the form of total gross concession
revenues, net of the concession management fee of nine and seventy-five hundredths
percent (9.75%). The monthly Minimum Annual Guarantee (MAG) rental payment is due
before the fifth (5th) day of each month and the remaining rental payment, the excess rents
collected during the month greater than the MAG, is due on or before the last day of each
month.
Cash basis rental income from operating leases for FY 2019 was as follows:
Minimum rentals 41,923,765$
Additional rentals 220,099,764
Total rental income 262,023,529$
Cash basis rental income from operating leases for FY 2018 was as follows:
Minimum rentals 45,642,574$
Additional rentals 236,725,064
Total rental income 282,367,638$
As of the end of FY 2019, future minimum rentals receivable under non-cancelable
operating leases are as follows:
Fiscal Years
Ending June 30 Amount
2020 33,611,655$
2021 32,357,391
2022 30,893,725
2023 18,249,101
2024 6,094,428
2025-2029 27,268,370
2030-2034 22,874,954
2035-2039 17,723,754
2040-2044 17,704,560
Total 206,777,938$
The separate cost and carrying amount of property held for leasing is not available.
54
CITY OF PHILADELPHIA
AVIATION FUND
Notes to Financial Statements
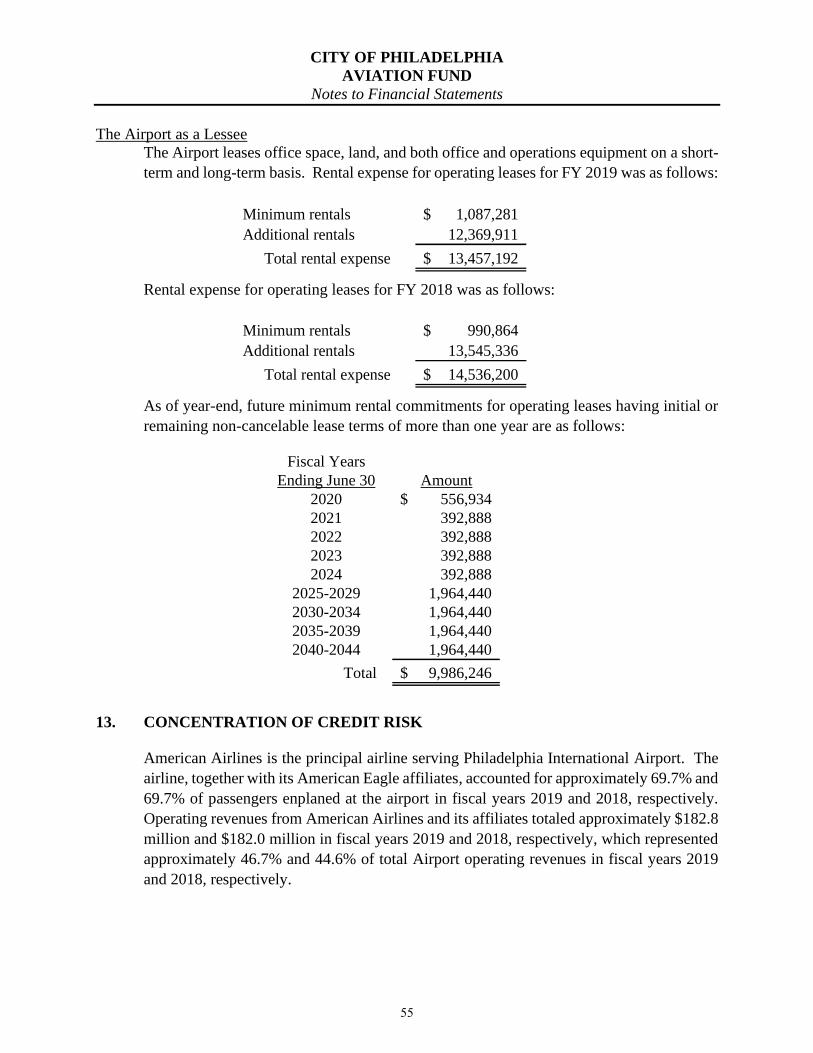
The Airport as a Lessee
The Airport leases office space, land, and both office and operations equipment on a short-
term and long-term basis. Rental expense for operating leases for FY 2019 was as follows:
Minimum rentals 1,087,281$
Additional rentals 12,369,911
Total rental expense 13,457,192$
Rental expense for operating leases for FY 2018 was as follows:
Minimum rentals 990,864$
Additional rentals 13,545,336
Total rental expense 14,536,200$
As of year-end, future minimum rental commitments for operating leases having initial or
remaining non-cancelable lease terms of more than one year are as follows:
Fiscal Years
Ending June 30 Amount
2020 556,934$
2021 392,888
2022 392,888
2023 392,888
2024 392,888
2025-2029 1,964,440
2030-2034 1,964,440
2035-2039 1,964,440
2040-2044 1,964,440
Total 9,986,246$
13. CONCENTRATION OF CREDIT RISK
American Airlines is the principal airline serving Philadelphia International Airport. The
airline, together with its American Eagle affiliates, accounted for approximately 69.7% and
69.7% of passengers enplaned at the airport in fiscal years 2019 and 2018, respectively.
Operating revenues from American Airlines and its affiliates totaled approximately $182.8
million and $182.0 million in fiscal years 2019 and 2018, respectively, which represented
approximately 46.7% and 44.6% of total Airport operating revenues in fiscal years 2019
and 2018, respectively.
55

CITY OF PHILADELPHIA
AVIATION FUND
Notes to Financial Statements
14. PENSION PLANS
The Airport contributes to the Municipal Pension Plan (City Plan) of the City of
Philadelphia. The City maintains two single-employer defined benefit plans for its
employees and several of its component units. The two plans maintained by the City are
the City Plan and the Philadelphia Gas Works (PGW) Plan. In addition to the City, the
three other quasi-governmental agencies that participate in the City Plan are the
Philadelphia Parking Authority (PPA), the Philadelphia Municipal Authority (PMA), and
the Philadelphia Housing Development Corporation (PHDC). Information for the City
Plan as a whole is available in the Comprehensive Annual Financial Report (CAFR) of the
City of Philadelphia for the year ended June 30, 2019.
Effective with fiscal year 2015, the City implemented GASB Statement No. 68,
Accounting and Financial Reporting for Pensions – an amendment of GASB Statement No.
27. This Statement revised existing standards for measuring and reporting pension
liabilities for pension plans. GASB Statement No. 68 defines a single employer as the
primary government and its component units. All three quasi-governmental agencies that
participate in the City Plan were determined to be component units of the City. Therefore,
the City Plan meets the definition of a single-employer plan.
The note disclosures and Required Supplementary Information required by GASB
Statement No. 67, Financial Reporting for Pension Plans – an amendment of GASB
Statement No. 25, are presented in the separately issued audited financial statements of the
City Plan and PGW Plan. Copies of these financial statements may be obtained by
contacting the Director of Finance of the City of Philadelphia.
Pension Fund Description
Plan Administration
The Philadelphia Board of Pensions (the Pension Board) administers the City of
Philadelphia Municipal Pension Fund (the Fund), a single-employer defined benefit
pension plan with a small but increasing defined contribution component, which provides
pensions for all officers and employees of the City of Philadelphia (the City), as well as
those of three quasi-governmental agencies (per applicable enabling legislation and
contractual agreements). The Pension Board was established by section 2-308 of the
1952 Philadelphia Home Rule Charter. Its actions in administering the Retirement System
are governed by Title 22 of the Philadelphia Code.
The Board consists of nine voting members – four elected by the active members within the
civil service, and the City’s Controller, Solicitor, Managing Director, Personnel Director,
and Director of Finance, who serves as the Chair.
56
CITY OF PHILADELPHIA
AVIATION FUND
Notes to Financial Statements
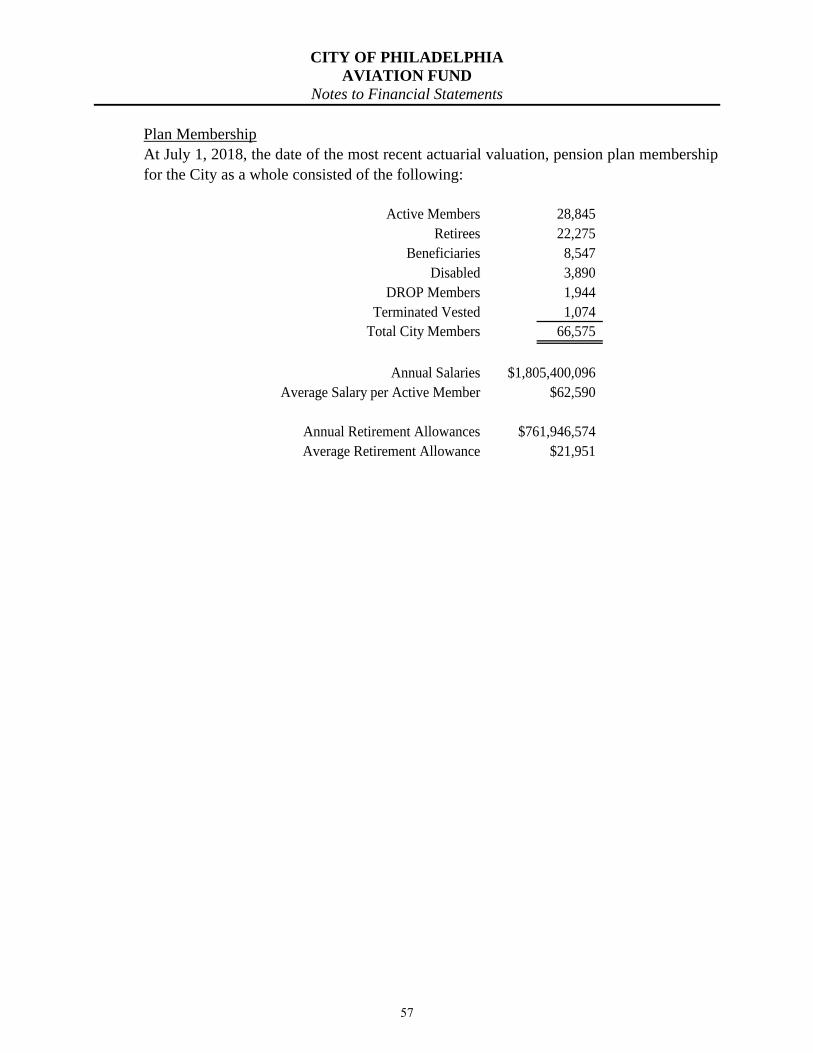
Plan Membership
At July 1, 2018, the date of the most recent actuarial valuation, pension plan membership
for the City as a whole consisted of the following:
Active Members 28,845
Retirees 22,275
Beneficiaries 8,547
Disabled 3,890
DROP Members 1,944
Terminated Vested 1,074
Total City Members 66,575
Annual Salaries
Average Salary per Active Member
Annual Retirement Allowances
Average Retirement Allowance
$1,805,400,096
$62,590
$761,946,574
$21,951
57
CITY OF PHILADELPHIA
AVIATION FUND
Notes to Financial Statements
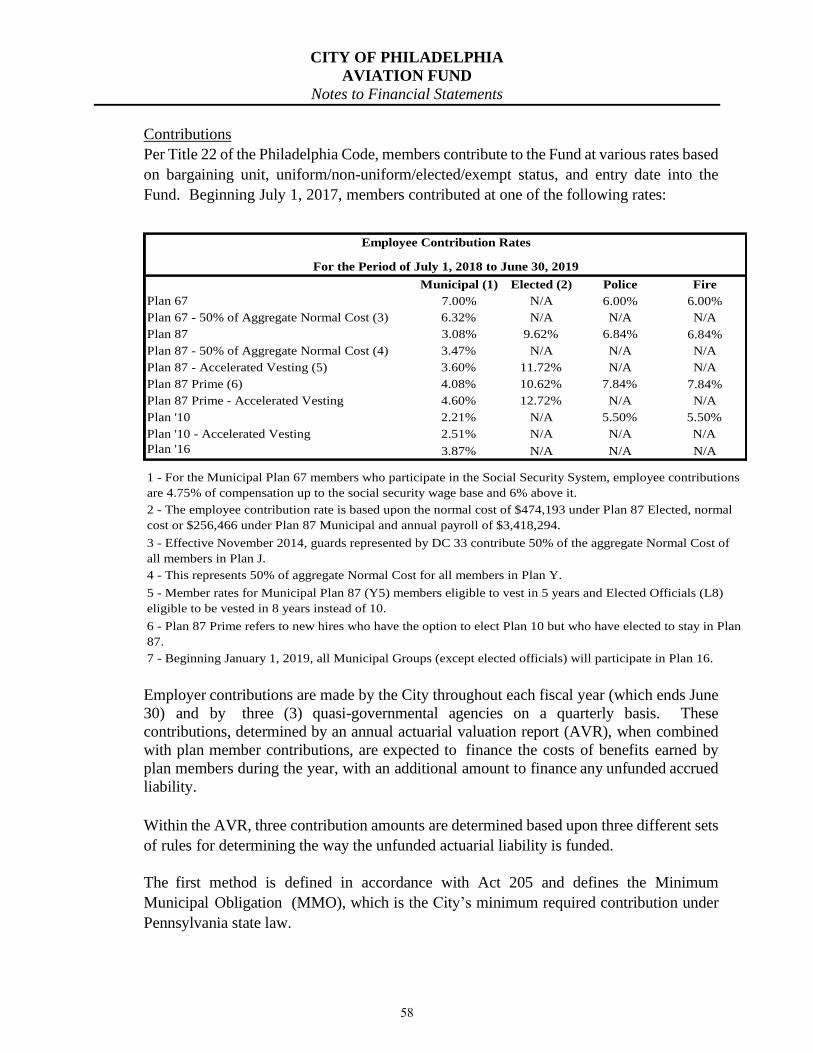
Contributions
Per Title 22 of the Philadelphia Code, members contribute to the Fund at various rates based
on bargaining unit, uniform/non-uniform/elected/exempt status, and entry date into the
Fund. Beginning July 1, 2017, members contributed at one of the following rates:
Municipal (1) Elected (2) Police Fire
Plan 67 7.00% N/A 6.00% 6.00%
Plan 67 - 50% of Aggregate Normal Cost (3) 6.32% N/A N/A N/A
Plan 87 3.08% 9.62% 6.84% 6.84%
Plan 87 - 50% of Aggregate Normal Cost (4) 3.47% N/A N/A N/A
Plan 87 - Accelerated Vesting (5) 3.60% 11.72% N/A N/A
Plan 87 Prime (6) 4.08% 10.62% 7.84% 7.84%
Plan 87 Prime - Accelerated Vesting 4.60% 12.72% N/A N/A
Plan '10 2.21% N/A 5.50% 5.50%
Plan '10 - Accelerated Vesting 2.51% N/A N/A N/A
Plan '16 3.87% N/A N/A N/A
4 - This represents 50% of aggregate Normal Cost for all members in Plan Y.
7 - Beginning January 1, 2019, all Municipal Groups (except elected officials) will participate in Plan 16.
Employee Contribution Rates
For the Period of July 1, 2018 to June 30, 2019
1 - For the Municipal Plan 67 members who participate in the Social Security System, employee contributions
are 4.75% of compensation up to the social security wage base and 6% above it.
3 - Effective November 2014, guards represented by DC 33 contribute 50% of the aggregate Normal Cost of
all members in Plan J.
5 - Member rates for Municipal Plan 87 (Y5) members eligible to vest in 5 years and Elected Officials (L8)
eligible to be vested in 8 years instead of 10.
6 - Plan 87 Prime refers to new hires who have the option to elect Plan 10 but who have elected to stay in Plan
87.
2 - The employee contribution rate is based upon the normal cost of $474,193 under Plan 87 Elected, normal
cost or $256,466 under Plan 87 Municipal and annual payroll of $3,418,294.
Employer contributions are made by the City throughout each fiscal year (which ends June
30) and by three (3) quasi-governmental agencies on a quarterly basis. These
contributions, determined by an annual actuarial valuation report (AVR), when combined
with plan member contributions, are expected to finance the costs of benefits earned by
plan members during the year, with an additional amount to finance any unfunded accrued
liability.
Within the AVR, three contribution amounts are determined based upon three different sets
of rules for determining the way the unfunded actuarial liability is funded.
The first method is defined in accordance with Act 205 and defines the Minimum
Municipal Obligation (MMO), which is the City’s minimum required contribution under
Pennsylvania state law.
58
CITY OF PHILADELPHIA
AVIATION FUND
Notes to Financial Statements
The second method is in accordance with the City’s Funding Policy, which predates the
Act 205 rules and calls for contributions that are greater than the MMO until the initial
unfunded liability determined in 1984 is fully funded.
The third method currently followed by the City, the Revenue Recognition Policy (RRP),
calls for additional revenue to be contributed each year to the fund in excess of the MMO.
There are three sources of additional revenue that will be received by the Fund: 1) a portion
of the sales tax according to the State Legislation, 2) additional tiered member contributions
based on salary level for all municipal employees, and 3) additional member contributions
from the current and future uniform members in Plan 87.
Under all funding methods, there are two components: the normal cost and the amortized
unfunded actuarial liability. The actuarial unfunded liability is the amount of the unfunded
actuarial liability that is paid each year based upon the given or defined amortization
periods. The amortization periods are the same under the MMO and RRP, but different
under the City’s Funding Policy.
City’s Funding Policy
The initial July 1, 1985 unfunded actuarial liability (UAL) is amortized over 34
years ending June 30, 2019 with payments increasing at 3.3% per year, the
assumed payroll growth. Other changes in the actuarial liability are amortized in
level-dollar payments as follows:
* Actuarial gains and losses – 20 years beginning July 1, 2009. Prior gains
and losses were amortized over 15 years.
* Assumptions changes – 15 years beginning July 1, 2010. Prior to July 1,
2010, assumption changes were amortized over 20 years.
* Plan changes for active members – 10 years.
* Plan changes for inactive members – 1 year.
* Plan changes mandated by the State – 20 years.
In fiscal year 2019, the City and other employers’ contributions of $797.8 million
was less than the actuarially determined employer contribution (ADEC) of $874.7
million. In the event that the City contributes less than the funding policy, an
experience loss will be created that will be amortized in accordance with funding
policy over a closed 20-year period.
The Schedule of Employer Contributions (based on the City’s Funding Policy) is
included as Required Supplemental Information (in the City’s CAFR) and provides
a 10-year presentation of the employer contributions.
59

CITY OF PHILADELPHIA
AVIATION FUND
Notes to Financial Statements
Minimum Municipal Obligation (MMO)
For the purposes of the MMO under Act 205 reflecting the fresh start amortization
schedule, the July 1, 2009 UAL was “fresh started” to be amortized over 30 years
ending June 30, 2039. This is a level dollar amortization of the UAL. All future
amortization periods will follow the City’s Funding Policies as outlined above.
In fiscal year 2019, the City and other employers’ contributions of $797.8 million
exceeded the Minimum Municipal Obligation of $668.3 million.
The Schedule of Employer Contributions (based on the MMO Funding Policy) is
included as Required Supplemental Information (in the City’s CAFR) and provides
a 10-year presentation of employer contributions.
Revenue Recognition Policy (RRP)
Revenue Recognition Policy is similar to the MMO except that assets used to
determine the unfunded liability do not include a portion of sales tax revenue, tiered
member contributions from the municipal employees, and additional uniform
members’ contributions. These sources of income are contributed over and above
the City’s contribution of the MMO and will be in addition to the MMO. Therefore,
under this funding method the additional revenue amounts are separately tracked
and accumulated in a notional account which is then subtracted from the assets
before calculating the contribution amounts due under the Minimum Municipal
Obligation methodology. The fund accumulates these amounts in a notional account
and deducts them from the Actuarial Asset Value return rates to preserve the new
funding methodology objective.
In fiscal year 2019, the City and other employers’ contributions of $797.8 million
exceeded the contribution under the Revenue Recognition Policy of $680.8 million.
The Schedule of Employer Contributions (based on the RRP Funding Policy) is
included as Required Supplemental Information (in the City’s CAFR) and provides
a 10-year presentation of employer contributions.
Benefits
The Fund provides retirement, disability, and death benefits according to the provisions
of Title 22 of the Philadelphia Code. These provisions prescribe retirement benefit
calculations, vesting thresholds, and minimum retirement ages that vary based on
bargaining unit, uniform/non-uniform status, and entry date into the System.
Non-uniform employees may retire at either age 55 with up to 80% of average final
compensation (AFC) or age 60 with up to 100% or 25% of AFC, depending on entry date
into the Fund. Uniform employees may retire at either age 45 with up to 100% of AFC
or age 50 with up to either 100% or 35% of AFC, depending on entry date into the Fund.
Survivorship selections may result in an actuarial reduction to the calculated benefit.
60
CITY OF PHILADELPHIA
AVIATION FUND
Notes to Financial Statements
Members may qualify for service-connected disability benefits regardless of length of
service. Service-connected disability benefits are equal to 70% of a member’s final rate of
pay, and are payable immediately without an actuarial reduction. These applications require
approval by the Board. Eligibility to apply for non-service-connected disability benefits
varies by bargaining unit and uniform/non-uniform status. Non-service-connected
disability benefits are determined in the same manner as retirement benefits, and are
payable immediately.
Service-connected death benefits are payable to:
1) surviving spouse/life partner at 60% of final rate of pay plus up to 2 children
under age 18 at 10% each of final rate of pay (maximum payout: 80%);
2) if no surviving spouse/life partner, up to 3 children under age 18 at 25% each
of final rate of pay (maximum payout 75%); or
3) if no surviving spouse/life partner or children under age 18, up to 2 surviving
parents at 15% each of final rate of pay (maximum payout 30%).
Non-service-connected deaths are payable as a lump sum payment, unless the deceased
was either vested or had reached minimum retirement age for their plan, in which case
the beneficiary(ies) may instead select a lifetime monthly benefit, payable immediately with
an actuarial reduction.
A Pension Adjustment Fund (PAF) is funded with 50% of the excess earnings that are
between 1% and 6% above the actuarial assumed earnings rate. Each year, within sixty
days of the end of the fiscal year, by majority vote of its members, the Board of
Directors of the Fund (the Board) shall consider whether sufficient funds have
accumulated in the PAF to support an enhanced benefit distribution (which may include,
but is not limited to, a lump sum bonus payment, monthly pension payment increases,
ad hoc cost-of-living adjustments, continuous cost-of-living adjustments, or some
other form of increase in benefits as determined by the Board) to retirees, their
beneficiaries, and their survivors. As of July 1, 2018, the date of the most recent actuarial
valuation, there was $1,160,247 in the PAF and the Board voted to make PAF distributions
of $822 during the fiscal year ended June 30, 2019.
61

CITY OF PHILADELPHIA
AVIATION FUND
Notes to Financial Statements
The Fund includes a Deferred Retirement Option Plan (DROP Plan). The DROP Plan
allows a participant to declare that they will retire within 4 years. During the 4-
year period, the City will make no further contributions for the participant. The
participant would continue to work and to receive their salary; however, any increases
would not be counted towards their pension benefit. During the 4-year period the
individual participates in the DROP Plan, their pension benefits will be paid into an
escrow account in the participant's name. After the 4-year period, the participant
would begin to receive their pension benefits and the amount that has been
accumulated in the escrow account in a lump sum payment. The balance in the DROP
Plan as of June 30, 2019 is $156.8 million.
Investments
The Pension Board’s Investment Policy Statement provides, in part:
The overall investment objectives and goals should be achieved by use of a diversified
portfolio, with safety of principal a primary emphasis. The portfolio policy should employ
flexibility by prudent diversification into various asset classes based upon the relative
expected risk-reward relationship of the asset classes and the expected correlation of their
returns.
The Fund seeks an annual total rate of return of not less than 7.55% over a full market
cycle. It is anticipated that this return standard should enable the Fund to meet its
actuarially assumed earnings projection (currently 7.55%) over a market cycle. The
investment return assumption was reduced by the Board from 7.60% to 7.55%. The Fund’s
investment program will pursue its aforestated total rate of return by a combination of
income and appreciation, relying upon neither exclusively in evaluating a prospective
investment for the Fund.
All investments are made only upon recommendation of the Fund’s Investment Committee
and approval by a majority of the Pension Board. In order to document and communicate
the objectives, restrictions, and guidelines for the Fund’s investment staff and investments,
a continuously updated Investment Policy Statement is maintained. The Investment Policy
Statement is updated (and reaffirmed) each year at the January Board meeting.
62

CITY OF PHILADELPHIA
AVIATION FUND
Notes to Financial Statements
The following was the Board’s approved asset allocation policy as of June 30, 2019:
Asset Class
Target
Allocation
U.S. Large-Cap Core 22.0%
ACWI ex-U.S. 15.0%
Real Estate Core 11.0%
Broad Fixed Income 10.0%
Private Equity 10.0%
Non-U.S. Small-Cap 6.0%
Infrastructure 5.0%
U.S. Small-Cap Core 5.0%
Emerging Markets 4.0%
U.S. Mid-Cap Core 3.0%
Emerging Market Debt 2.0%
Global Fixed Income 2.0%
Private Debt 2.0%
Public REITs 1.0%
Real Estate - Mezzanine 1.0%
Real Estate - Opportunistic 1.0%
Total 100.0%
Money-Weighted Rate of Return
For the fiscal year ended June 30, 2019, the annual money-weighted rate of return on
pension plan investments, net of pension plan investment expense, was 6.48%. The
money-weighted rate of return expresses investment performance, net of investment
expense, adjusted for changing amounts actually invested.
Summary of Significant Accounting Policies
Basis of Presentation
Financial statements of the Fund are prepared using the accrual basis of accounting.
Member contributions are recognized in the period in which the contributions are due.
Employer contributions are recognized when due and the employer has made a formal
commitment to provide the contributions. Benefits and refunds of contributions are
recognized when due and payable in accordance with the terms of the Fund.
Methods Used to Value Investments
The Fund’s investments are reported at fair value. Fair value is the amount that the Fund
can reasonably expect to receive for an investment in a current sale between a willing buyer
and a willing seller, that is, other than in a forced or liquidation sale. Fixed income
securities and common and preferred stocks are generally valued based on published
63
CITY OF PHILADELPHIA
AVIATION FUND
Notes to Financial Statements
market prices and quotations from national security exchanges or securities pricing
services. Securities which are not traded on a national security exchange are valued by the
respective fund manager or other third parties based on similar sales.
For private market investments which include private equity, private debt, venture capital,
hedge funds and equity real estate investments where no readily ascertainable market value
exists, management, in consultation with the general partner and investment advisors, has
determined the fair values for the individual investments based upon the partnership’s most
recent available financial information. Some of the investment values provided in the
report are estimates due to a lag in reporting for private market investments.
Futures contracts, foreign exchange contracts, and options are marked-to-market daily with
changes in market value recognized as part of net appreciation/depreciation in the fair value
of investments. Initial margin requirements for such financial instruments are provided by
investment securities pledged as collateral or by cash.
Investment expenses consist of investment manager fees and investment consultant fees
related to the traditional investments only, and not those fees related to the alternative
investments. Unsettled investment sales are reported as Accrued Interest and Other
Receivables, and unsettled investment purchases are included in Accrued Expenses and
Other Liabilities.
Dividend income is recorded on the ex-dividend date. Interest income is recorded as earned
on an accrual basis.
Income Taxes
The Fund qualifies under Section 401(a) of the Internal Revenue Code (IRC) and is exempt
from income taxation as allowed by Section 501(a) of the IRC.
Related Parties
The City’s Department of Finance provides cash receipt and cash disbursement services to
the Fund. The City Solicitor’s Office provides legal services to the Fund. Other
administrative services are also provided by the City.
Use of Estimates in Preparing Financial Statements
The preparation of financial statements in conformity with accounting principles generally
accepted in the United States requires management to make estimates and assumptions that
affect the reported amounts of assets, liabilities and changes therein, and disclosure of
contingent assets and liabilities. Actual results could differ from those estimates.
64
CITY OF PHILADELPHIA
AVIATION FUND
Notes to Financial Statements
Risks and Uncertainties
The Fund invests in various investment securities. Investment securities are exposed to
various risks such as interest rate, market, and credit risks. Due to the level of risk
associated with certain investment securities, it is at least reasonably possible that changes
in the values of investment securities will occur in the near term and that such changes
could materially affect the amounts reported in the Statement of Fiduciary Net Position.
Contributions are calculated based on certain assumptions pertaining to interest rates,
inflation rates, and employee demographics, all of which are subject to change. Due to
uncertainties inherent in the estimation and assumption process, it is at least reasonably
possible that changes in these statements and assumptions in the near term would be
material to the financial statements.
Administrative Expenses
Administrative expenses of the Fund are paid for by the Fund.
Cash Deposits, Investments and Securities Lending
Legal Provisions
The Fund is authorized to invest in “prudent investments,” including obligations of the
U.S. Treasury, agencies and instrumentalities of the United States, investment grade
corporate bonds, common stock, real estate, private market, etc. City ordinances contain
provisions which preclude the Fund from investing in organizations that conduct business
in certain countries and also impose limitations on the amounts invested in certain types of
securities.
Interest Rate Risk
Interest rate risk is the largest risk faced by an investor in the fixed income market. The
price of a fixed income security generally moves in the opposite direction of the change in
interest rates. Securities with long maturities are highly sensitive to interest rate changes.
Duration is a measure of the approximate sensitivity of a bond’s value to interest rate
changes. The higher the duration, the greater the changes in fair value when interest rates
change. The Fund measures interest rate risk using segmented time distribution, which
recognizes the fact that yield changes may change the expected cash flows due to embedded
options.
Custodial Credit Risk
Custodial credit risk for Deposits is the risk that in the event of a bank failure, the Fund’s
deposits may not be returned to them. The Fund’s cash deposits are held in two banks as
of June 30, 2019. Amounts are insured up to $250,000 per bank by the Federal Deposit
Insurance Corporation (FDIC). Deposits in excess of the FDIC limit are collateralized with
65
CITY OF PHILADELPHIA
AVIATION FUND
Notes to Financial Statements
securities held by the pledging financial institution’s trust department or agent in the Fund’s
name. The Fund classifies Money Market funds held by custodian institution, JPMorgan,
N.A., as cash equivalents. The Fund also classifies Treasury Bills as cash equivalent if the
date of maturity is three months or less from the acquisition date. Custodial credit risk for
Investments is the risk that in the event of counter‐party failure, the Fund may not be able
to recover the value of its investment or collateral securities that are in the possession of
an outside party. Investment securities are exposed to custodial credit risk if the securities
held by the counterparty or counterparty’s trust department are uninsured and are not
registered in the name of the Fund. The Fund requires that all investments be clearly
marked as to ownership, and to the extent possible, be registered in the name of the Fund.
Certain investments may be held by the managers in the Fund’s name.
Concentration of Credit Risk
Concentration of credit risk is the risk of substantial loss if investments are concentrated in
one issuer. As of June 30, 2019, the Fund has no single issuer that exceeds 5% of total
investments. Investments issued or explicitly guaranteed by the U.S. government and
investments in mutual funds, external investment pools, and other pooled investments are
excluded.
Credit Risk
Credit risk is the risk that an issuer or other counterparty to an investment will not fulfill
its obligation. The Fund is subject to credit risk on $847.9 million of directly owned fixed
income. The Fund’s directly owned rated debt investments as of Jun 30, 2019 were rated
by Standard & Poor’s, a nationally recognized statistical rating agency.
Foreign Currency Risk
The Fund’s exposure to foreign currency risk derives from its position in foreign currency-
denominated cash and investments in fixed income, equities, and derivatives. The foreign
currency investment in equity securities is 41.4% of the total investment in equities.
Derivatives
The Fund may invest in derivatives as permitted by guidelines established by the Pension
Board. Pursuant to such authority, the Fund may invest in foreign currency forward
contracts, options, futures (S&P Fund) and swaps. No derivatives were purchased with
borrowed funds.
Derivatives are generally used to provide market exposure in the equity portfolio and to
hedge against foreign currency risk and changes in interest rates, improve yield and adjust
the duration of the Fund’s fixed income portfolio. These securities are subject to changes
in value due to changes in interest rates or currency valuations. Credit risk for derivatives
results from the same considerations as other counterparty risk assumed by the Fund, which
is the risk that the counterparty might be unable to meet its obligations.
66
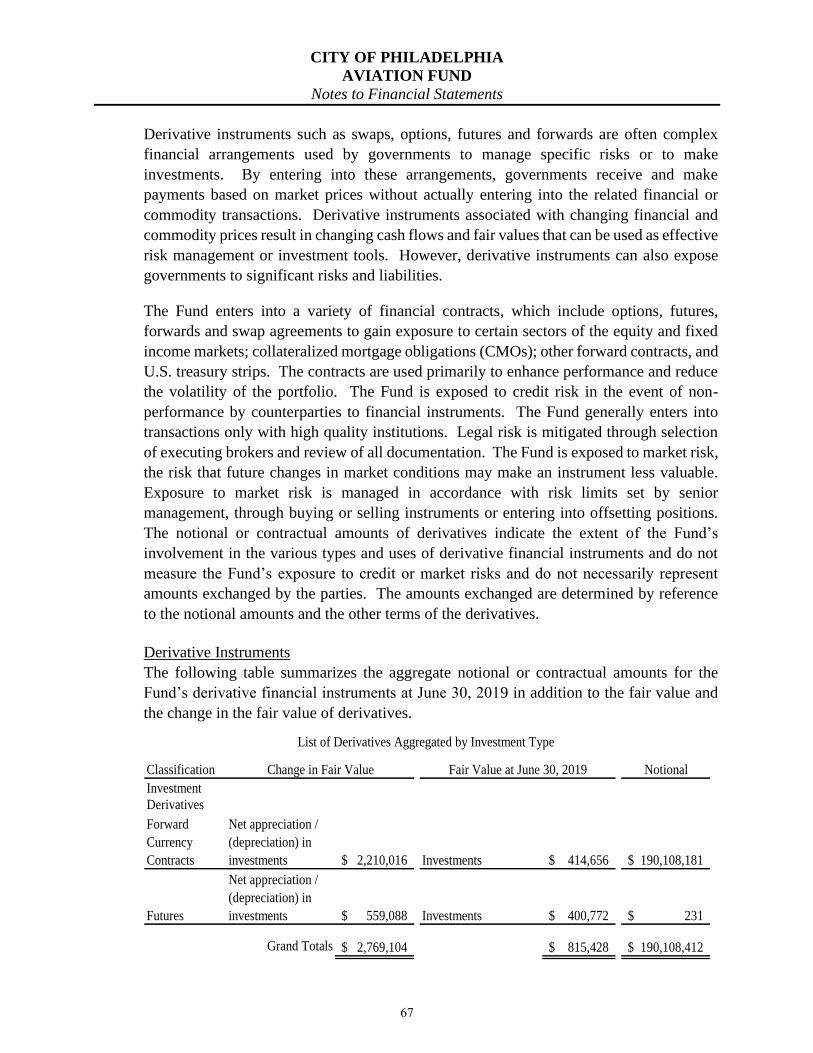
CITY OF PHILADELPHIA
AVIATION FUND
Notes to Financial Statements
Derivative instruments such as swaps, options, futures and forwards are often complex
financial arrangements used by governments to manage specific risks or to make
investments. By entering into these arrangements, governments receive and make
payments based on market prices without actually entering into the related financial or
commodity transactions. Derivative instruments associated with changing financial and
commodity prices result in changing cash flows and fair values that can be used as effective
risk management or investment tools. However, derivative instruments can also expose
governments to significant risks and liabilities.
The Fund enters into a variety of financial contracts, which include options, futures,
forwards and swap agreements to gain exposure to certain sectors of the equity and fixed
income markets; collateralized mortgage obligations (CMOs); other forward contracts, and
U.S. treasury strips. The contracts are used primarily to enhance performance and reduce
the volatility of the portfolio. The Fund is exposed to credit risk in the event of non-
performance by counterparties to financial instruments. The Fund generally enters into
transactions only with high quality institutions. Legal risk is mitigated through selection
of executing brokers and review of all documentation. The Fund is exposed to market risk,
the risk that future changes in market conditions may make an instrument less valuable.
Exposure to market risk is managed in accordance with risk limits set by senior
management, through buying or selling instruments or entering into offsetting positions.
The notional or contractual amounts of derivatives indicate the extent of the Fund’s
involvement in the various types and uses of derivative financial instruments and do not
measure the Fund’s exposure to credit or market risks and do not necessarily represent
amounts exchanged by the parties. The amounts exchanged are determined by reference
to the notional amounts and the other terms of the derivatives.
Derivative Instruments
The following table summarizes the aggregate notional or contractual amounts for the
Fund’s derivative financial instruments at June 30, 2019 in addition to the fair value and
the change in the fair value of derivatives.
Classification Notional
Investment
Derivatives
Forward
Currency
Contracts
Net appreciation /
(depreciation) in
investments 2,210,016$ Investments 414,656$ 190,108,181$
Futures
Net appreciation /
(depreciation) in
investments 559,088$ Investments 400,772$ 231$
Grand Totals 2,769,104$ 815,428$ 190,108,412$
Change in Fair Value Fair Value at June 30, 2019
List of Derivatives Aggregated by Investment Type
67

CITY OF PHILADELPHIA
AVIATION FUND
Notes to Financial Statements
A Derivatives Policy Statement identifies and allows common derivative investments and
strategies which are consistent with the Investment Policy Statement of the City of
Philadelphia Municipal Pension Fund. The guidelines identify transaction-level and
portfolio-level risk control procedures and documentation requirements. Managers are
required to measure and monitor exposure to counterparty credit risk. All counterparties
must have credit ratings available from nationally recognized rating institutions such as
Fitch, Moody’s and S&P. The details of other risks and financial instruments in which the
Fund is involved are described below.
Credit Risk
The Fund is exposed to credit risk on hedging derivative instruments that are in asset
positions. To minimize its exposure to loss related to credit risk, it is the Fund’s policy to
require counterparty collateral posting provisions in its non-exchange-traded hedging
derivative instruments. These terms require full collateralization of the fair value of
hedging derivative instruments in asset positions (net of the effect of applicable netting
arrangements) should the counterparty’s credit rating fall below AA as issued by Fitch
Ratings and Standard & Poor’s or Aa as issued by Moody’s Investors Service. Collateral
posted is to be in the form of U.S. Treasury securities held by a third-party custodian. The
City has never failed to access collateral when required.
It is the Fund’s policy to enter into netting arrangements whenever it has entered into more
than one derivative instrument transaction with counterparty. Under the terms of these
arrangements, should one party become insolvent or otherwise default on its obligations,
close-out netting provisions permit the non-defaulting party to accelerate and terminate all
outstanding transactions and net the transactions’ fair values so that a single sum will be
owed by, or owed to, the non-defaulting party.
Swap Agreements
These derivative instruments provide for periodic payments at predetermined future dates
between parties based on the change in value of underlying securities, indexes or interest
rates. Under fixed interest rate type swap arrangements, the Fund receives the fixed interest
rate on certain equity or debt securities or indexes in exchange for a fixed charge. There
were not any total receive fixed interest swaps during 2019. On its pay-variable, receive-
fixed interest rate swap, as LIBOR increases, the Fund’s net payment on the swap
increases. Alternatively, on its pay-fixed, receive-variable interest rate swap, as LIBOR or
the SIFMA swap index decreases, the Fund’s net payment on the swap increases.
Futures Contracts
These derivative instruments are types of contracts in which the buyer agrees to purchase
and the seller agrees to make delivery of a specific financial instrument at a predetermined
date and price. Gains and losses on futures contracts are settled daily based on a notional
(underlying) principal value and do not involve an actual transfer of the specific instrument.
68

CITY OF PHILADELPHIA
AVIATION FUND
Notes to Financial Statements
Futures contracts are standardized and are traded on exchanges. The exchange assumes
the risk that counterparty will not pay and generally requires margin payments to minimize
such risk. In addition, the Fund enters into short sales, sales of securities it does not
presently own, to neutralize the market risk of certain equity positions. Initial margin
requirements on futures contracts and collateral for short sales are provided by investment
securities pledged as collateral and by cash held by various brokers. Although the Fund
has the right to access individual pledged securities, it must maintain the amount pledged
by substituting other securities for those accessed. The realized loss from futures contracts
was ($313,449).
Forward Contracts
The Fund is exposed to basis risk on its forward contracts because of possible mismatch
between the price of the asset being hedged and the price at which the forward contract is
expected to settle. The realized loss from forward contracts was ($5,334,716).
Termination Risk
The Fund or its counterparties may terminate a derivative instrument if the other party fails
to perform under the terms of the contract. In addition, the Fund is exposed to termination
risk on its receive-fixed interest rate swap. The Fund is exposed to termination risk on its
rate cap because the counterparty has the option to terminate the contract if the SIFMA
swap index exceeds 12 percent. If at the time of termination, a hedging derivative
instrument is in a liability position, the City would be liable to the counterparty for a
payment equal to the liability, subject to netting arrangements.
Rollover Risk
The Fund is exposed to rollover risk on hedging derivative instruments that are hedges of
debt that mature or may be terminated prior to the maturity of the hedged debt. When these
hedging derivative instruments terminate, or in the case of a termination option, if the
counterparty exercises its option, the Fund will be re-exposed to the risks being hedged by
the hedging derivative instrument.
Fair Value Measurement
See the City’s CAFR to view the Municipal Pension Fund’s recurring fair value
measurement as of June 30, 2019.
Equity securities classified in Level 1 of the fair value hierarchy are valued using quoted
market prices. Debt securities classified in Level 2 of the fair value hierarchy are valued
using a matrix pricing technique. Equities in Level 3 are valued using discounted cash
flow techniques.
Derivative instruments classified in Level 1 of the fair value hierarchy are valued using
quoted market prices. Derivative instruments classified in Level 2 are valued using a
market approach that considers benchmark for foreign exchange rates.
69

CITY OF PHILADELPHIA
AVIATION FUND
Notes to Financial Statements
1. Credit distressed hedge funds: These Funds seek to identify and exploit event driven
opportunities both on the long and short side in the stressed and distressed corporate
debt markets. Investments are generally driven by fundamental, value-oriented
analysis and specific credit events. The Funds maintain the flexibility to invest globally
and across capital structures of stressed and distressed companies. Investments
generally target secondary U.S. credit opportunities across all tranches of a company’s
debt capital structure. The Funds may also invest opportunistically in certain equities,
long and short. The fair values of the investments in this type have been determined
using the net asset value (NAV) per share (or its equivalent) of the investments.
Investments can be redeemed with a 90 days’ notice.
2. Equity long/short hedge funds: These Fund will typically hold 0-50 long positions and
10-15 short positions in U.S. common stocks. Management has the ability to shift
investments from value to growth strategies, from small to large capitalization stocks,
and from a net long position to a net short position. The Fund mitigates market risk by
utilizing short positions. In periods of extreme volatility, the Fund may hold a
significant portion of its assets in cash. The fair values of the investments in this type
have been determined using the NAV per share of the investments. Investments can
be redeemed with a 90 days’ notice.
3. Real estate funds: This type includes funds that invest in U.S. and non-U.S.
commercial and residential real estate. The fair values of the investments in this type
have been determined using the NAV per share (or its equivalent) of the Plan’s
ownership interest in partners’ capital. These investments can never be redeemed with
the funds. Distributions from each fund will be received as the underlying investments
of the funds are liquidated. However, the individual investments that will be sold have
not yet been determined. Because it is not probable that any individual investment will
be sold, the fair value of each individual investment has been determined using the
NAV per share (or its equivalent) of the Plan’s ownership interest in partners’ capital.
Once it has been determined which investments will be sold and whether those
investments will be sold individually or in a group, the investments will be sold in an
auction process. The investee fund’s management is required to approve of the buyer
before the sale of the investments can be completed. It is expected that the underlying
assets of the funds will be liquidated over the next seven to ten years.
70

CITY OF PHILADELPHIA
AVIATION FUND
Notes to Financial Statements
4. Private equity funds: The primary goal of these Funds is to generate returns for
investors that exceed private equity industry benchmarks and are commensurate with
asset class risk through the construction of a portfolio of opportunistic, highly
performing private equity investments. Investments that these funds may undertake
include early-stage venture capital, later-stage growth financings, leveraged buyouts of
medium and large-sized companies, mezzanine investments, private investments in
public equity (PIPES) and investments in companies that are being taken private.
These investments can never be redeemed with the funds. Instead, the nature of the
investments in this type is that distributions are received through the liquidation of the
underlying assets of the fund. If these investments were held, it is expected that the
underlying assets of the fund would be liquidated over five to ten years. The fair values
of the investments in this type have been determined using recent observable
transaction information for similar investments and nonbinding bids received from
potential buyers of the investments. Once a buyer has been identified, the investee
fund’s management is required to approve of the buyer before the sale of the
investments can be completed.
5. Fixed income hedge funds: The primary goal of these Funds is to create alpha by
sourcing proprietary opportunities, avoiding capital loss, buying securities below their
intrinsic value and selling securities above their intrinsic value. Firms look for
opportunities that are currently mispriced, based on fundamentals or potentially an
event that may improve the price of the holding. Investments are generally driven by
fundamental, value-oriented analysis, and specific credit events. The fair values of the
investments in this type have been determined using NAV per share (or its equivalent)
of the investments. Investments can be redeemed with 90-120 days’ notice.
Securities Lending Program
The Fund, pursuant to a Securities Lending Authorization Agreement (SLAA), has
authorized J.P. Morgan Bank and Trust Company (J.P. Morgan) to act as the Fund’s agent
in lending the Fund’s securities to approved borrowers. J.P. Morgan, as agent, enters into
Securities Loan Agreements with borrowers.
During the fiscal year, J.P. Morgan lent, on behalf of the Fund, certain securities of the
Fund held by J.P. Morgan Chase Bank, N.A. as custodian and received cash or other
collateral including securities issued or guaranteed by the United States, U.K., and
Eurozone governments. J.P. Morgan does not have the ability to pledge or sell collateral
securities delivered, absent a borrower default. Borrowers were required to deliver
collateral for each loan equal to at least 102% or 105% of the market value of the loaned
securities.
Pursuant to the SLAA, J.P. Morgan had an obligation to indemnify the Fund in the event
of default by a borrower. There were no failures by any borrowers to return loaned
securities or pay distributions thereon during the fiscal year that resulted in a declaration
or notice of default of the borrower.
71

CITY OF PHILADELPHIA
AVIATION FUND
Notes to Financial Statements
During the fiscal year, the Fund and the borrowers maintained the right to terminate
securities lending transactions upon notice. The cash collateral received on each loan was
invested in a separately managed account based upon the investment guidelines established
by the Fund. As of June 30, 2019, the weighted average maturity was 48 days and the final
maturity was 351 days. Because the securities lending transactions were terminable at will,
their duration did not generally match the duration of the investments made with the cash
collateral received from the borrower.
On June 30, 2019, the Fund had no credit risk exposure to borrowers because all borrowers
were required to deliver collateral for the loan.
As of June 30, 2019, the fair value of securities on loan was $356.9 million. Associated
collateral totaling $381.4 million was comprised of cash which was invested in a separately
managed account based upon the investment guidelines established by the Pension Fund.
As of June 30, 2019, the invested cash collateral was $381.4 million and is valued at
amortized cost.
Investments Advisors
The Fund utilizes investment advisors to manage long-term debt, real estate, private
market, and equity portfolios. To be eligible for consideration, investments must meet
criteria set forth in governing laws and regulations.
Net Pension Liability
The components of the net pension liability as of June 30, 2019 were as follows:
Total Pension Liability 11,774,268,695$
Plan Fiduciary Net Position 5,688,383,351
Collective Net Pension Liability 6,085,885,344$
Plan Fiduciary Net Position as a Percentage of the Total Pension Liability: 48.3%
Actuarial Assumptions
The total pension liability was determined by an actuarial valuation as of June 30, 2018
and was rolled forward to June 30, 2019. The June 30, 2018 valuation used the following
actuarial assumptions, applied to all periods, including the measurement period:
Actuarial Cost Method: Entry Age Normal
Investment Rate of Return: 7.55% compounded annually, net of expenses
Salary Increases: Age-based table
72
CITY OF PHILADELPHIA
AVIATION FUND
Notes to Financial Statements
* The investment return assumption was changed from 7.60% from the prior year
valuation to 7.55% for the current year valuation.
* To recognize the expense of the benefits payable under the Pension Adjustment
Fund, the actuarial liabilities have been increased 0.54%. This estimate is based on
the statistical average expected value of benefits.
* Mortality Rates; For Municipal and Elected Officials, 127% and 119% for males
and females, respectively, of the RP-2014 Healthy Annuitant Table projected from
base year of 2006 to 2021 using mortality improvement scale MP-2017. For
Uniform, 115% of the RP-2014 Blue Collar Healthy Annuitant Table projected
from base year of 2006 to 2021 using mortality improvement scale MP-2017.
The measurement date for the net pension liability (NPL) is June 30, 2019. Measurements
are based on the fair value of assets as of June 30, 2019 and the total pension liability (TPL)
as of the valuation date, July 1, 2018, updated to June 30, 2019. The roll-forward procedure
included the addition of service cost and interest cost offset by actual benefit payments.
During the measurement year, the collective NPL decreased by approximately $83 million.
The service cost and interest cost increased the collective NPL by approximately $1.04
billion while contributions plus investment income offset by administrative expenses
decreased the collective NPL by approximately $1.19 billion.
There was a benefit change to increase the pay cap from $50,000 to $65,000 for DC 33
Municipal members participating in the Stacked Hybrid Plan 16 which increased the TPL
by approximately $0.4 million. There was an actuarial experience loss during the year of
approximately $11 million.
In addition, the Board adopted an assumption change to decrease the expected long-term
return on assets from 7.60% to 7.55% which increased the TPL by approximately $53
million.
Long-term Expected Rate of Return
The long-term expected rate of return on pension plan investments was determined using
a building-block method in which best-estimate ranges of expected future real rates of
return (expected returns, net of pension plan investment expense and inflation) are
developed for each major asset class. These ranges are combined to produce the long-term
expected rate of return by weighting the expected future real rates of return by the target
asset allocation percentage and by adding expected inflation.
Discount Rate
The discount rate used to measure the total pension liability was 7.55%. The projection of
cash flows used to determine the discount rate assumed that plan member contributions
73
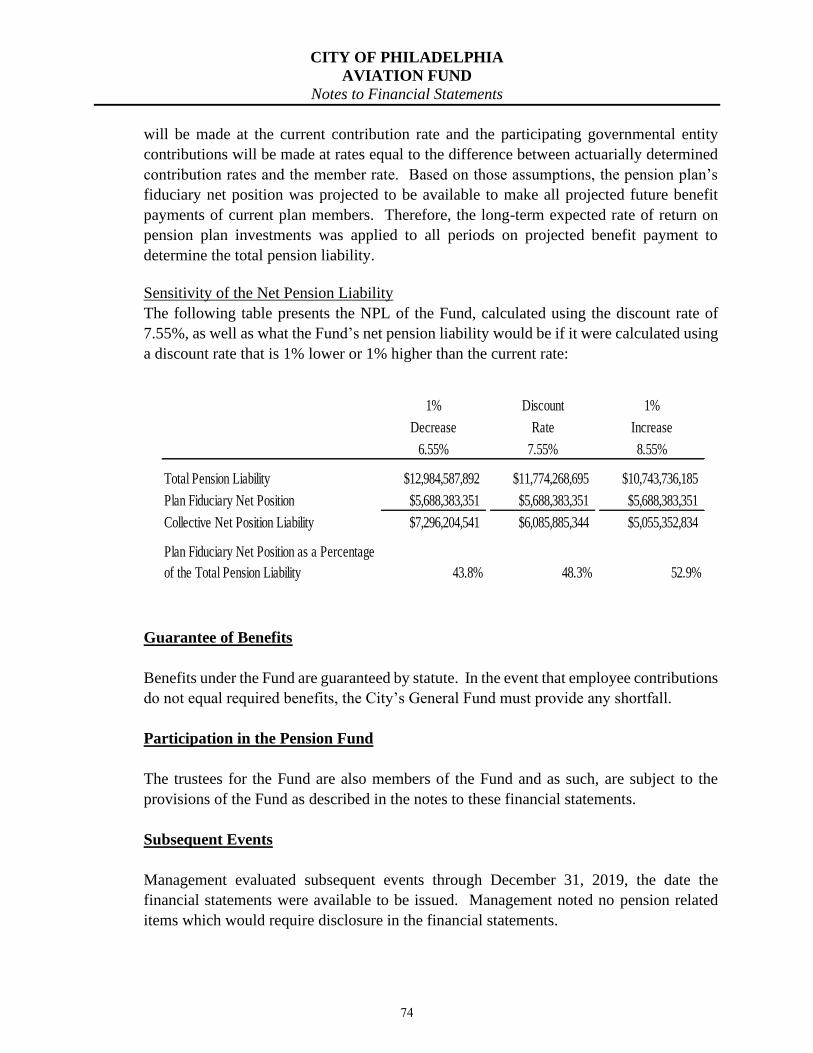
CITY OF PHILADELPHIA
AVIATION FUND
Notes to Financial Statements
will be made at the current contribution rate and the participating governmental entity
contributions will be made at rates equal to the difference between actuarially determined
contribution rates and the member rate. Based on those assumptions, the pension plan’s
fiduciary net position was projected to be available to make all projected future benefit
payments of current plan members. Therefore, the long-term expected rate of return on
pension plan investments was applied to all periods on projected benefit payment to
determine the total pension liability.
Sensitivity of the Net Pension Liability
The following table presents the NPL of the Fund, calculated using the discount rate of
7.55%, as well as what the Fund’s net pension liability would be if it were calculated using
a discount rate that is 1% lower or 1% higher than the current rate:
Guarantee of Benefits
Benefits under the Fund are guaranteed by statute. In the event that employee contributions
do not equal required benefits, the City’s General Fund must provide any shortfall.
Participation in the Pension Fund
The trustees for the Fund are also members of the Fund and as such, are subject to the
provisions of the Fund as described in the notes to these financial statements.
Subsequent Events
Management evaluated subsequent events through December 31, 2019, the date the
financial statements were available to be issued. Management noted no pension related
items which would require disclosure in the financial statements.
1% Discount 1%
Decrease Rate Increase
6.55% 7.55% 8.55%
Total Pension Liability $12,984,587,892 $11,774,268,695 $10,743,736,185
Plan Fiduciary Net Position $5,688,383,351 $5,688,383,351 $5,688,383,351
Collective Net Position Liability $7,296,204,541 $6,085,885,344 $5,055,352,834
Plan Fiduciary Net Position as a Percentage
of the Total Pension Liability 43.8% 48.3% 52.9%
74

CITY OF PHILADELPHIA
AVIATION FUND
Notes to Financial Statements
Reporting Information for Participating Employers
Changes in Collective Net Pension Liability
The following table shows the changes in TPL, the plan fiduciary net position (FNP, or fair
value of the System assets), and the NPL during the measurement period ending on June
30, 2019.
Total Pension Plan Fiduciary Net Pension
Liability Net Position Liability
Balances at June 30, 2018 11,510,667,823$ 5,341,285,527$ 6,169,382,296$
Changes for the year:
Service cost 183,755,848 - 183,755,848
Interest 857,348,582 - 857,348,582
Changes in benefits 378,455 - 378,455
Differences between expected
and actual experience 11,097,845 - 11,097,845
Changes of assumptions 53,488,769 - 53,488,769
Contributions - employer - 797,805,518 (797,805,518)
Contributions - member - 99,179,683 (99,179,683)
Net investment income - 303,735,946 (303,735,946)
Benefit payments (842,468,627) (842,468,627) -
Administrative expense - (11,154,696) 11,154,696
Net Changes 263,600,872 347,097,824 (83,496,952)
Balances at June 30, 2019 11,774,268,695$ 5,688,383,351$ 6,085,885,344$
Increase (Decrease)
Change in Collective Net Pension Liability
Employer’s Proportionate Share
GASB Statement No. 68 requires that the proportionate share for each employer be
determined based upon the “employer’s projected long-term contribution effort to the
pension … as compared to the total long-term contribution effort to all employers.” In
addition to the City, three governmental agencies currently participate in the System,
PHDC, PMA, and PPA. The method of allocation is based on the ratio of quasi-agency
contributions in proportion to total contributions by plan.
See the City’s CAFR for further details on the Plan’s financials.
75

CITY OF PHILADELPHIA
AVIATION FUND
Notes to Financial Statements
15. ACCUMULATED UNPAID SICK LEAVE
The Airport follows City policies regarding the accumulation of sick leave. City
employees may accumulate unused sick leave to predetermined balances. Non-uniformed
employees (upon retirement only) and uniformed employees (upon retirement or in case of
death while on active duty) are paid varying amounts ranging from 25% to 60% of unused
sick time, not to exceed predetermined amounts. Employees, who separate for any reason
other than indicated above, forfeit their entire sick leave. The City budgets for and charges
the cost of sick leave as it is taken.
16. OTHER POSTEMPLOYMENT BENEFITS (OPEB)
The following information is provided for the City as a whole because discrete information
is not available for the Airport. Please see the CAFR of the City of Philadelphia for
required supplemental information.
Plan Description
The City of Philadelphia self-administers a single-employer, defined benefit plan that
provides OPEB for all eligible retirees. No assets are accumulated in a trust that meets the
criteria in paragraph 4 of GASB Statement No. 75.
Benefits Provided
The City of Philadelphia subsidizes health care for five years from the time of coverage
election for eligible retirees. Certain union represented employees may defer their
coverage until a later date but the amount that the City pays for their health care is limited
to the amount that the City would have paid at the date of their retirement. The City also
provides lifetime insurance coverage for all eligible retirees. Firefighters are entitled to
$7,500 coverage and all other employees receive $6,000 in coverage. The plan does not
issue stand-alone financial statements, and the accounting for the plan is reported within
the financial statements of the City of Philadelphia.
Funding Policy
The City’s funding policy is to pay the net expected benefits for the current retirees. To
provide health care coverage, the City pays a negotiated monthly premium for retirees
covered by union contracts and is self-insured for non-union employees. For fiscal years
2019 and 2018, the City’s contributions were estimated to be $96.9 million and $96.4
million, respectively.
76
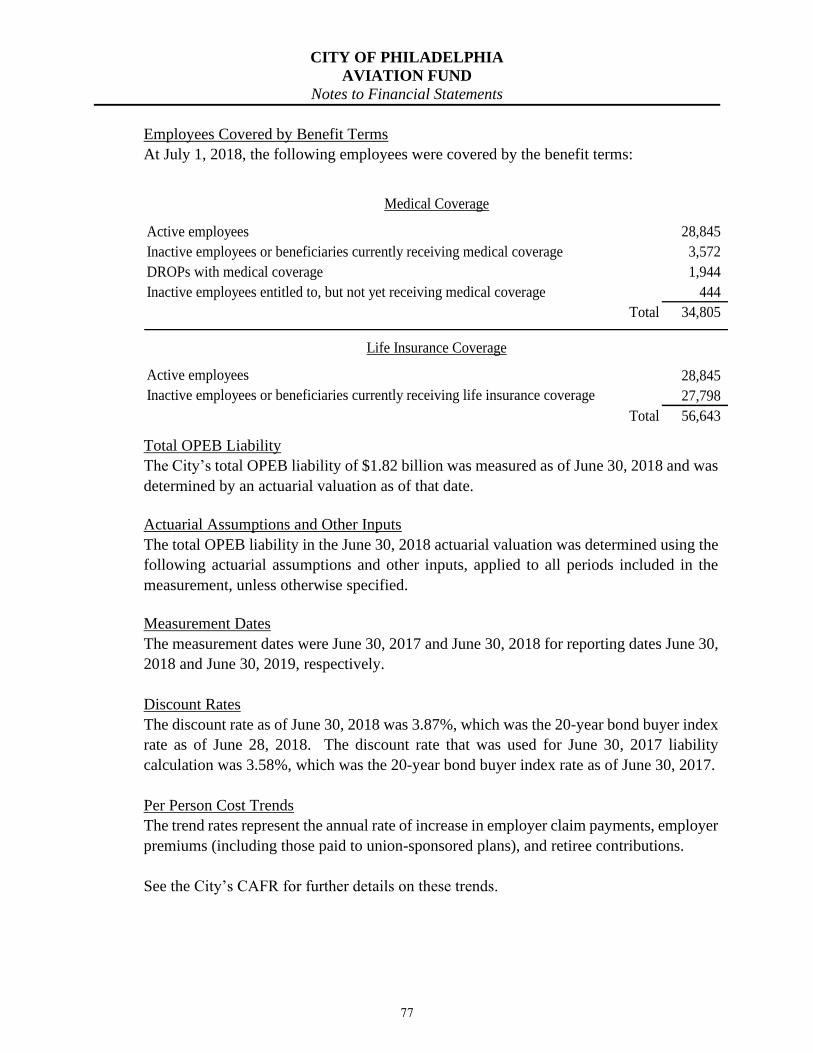
CITY OF PHILADELPHIA
AVIATION FUND
Notes to Financial Statements
Employees Covered by Benefit Terms
At July 1, 2018, the following employees were covered by the benefit terms:
Active employees 28,845
Inactive employees or beneficiaries currently receiving medical coverage 3,572
DROPs with medical coverage 1,944
Inactive employees entitled to, but not yet receiving medical coverage 444
Total 34,805
Active employees 28,845
Inactive employees or beneficiaries currently receiving life insurance coverage 27,798
Total 56,643
Medical Coverage
Life Insurance Coverage
Total OPEB Liability
The City’s total OPEB liability of $1.82 billion was measured as of June 30, 2018 and was
determined by an actuarial valuation as of that date.
Actuarial Assumptions and Other Inputs
The total OPEB liability in the June 30, 2018 actuarial valuation was determined using the
following actuarial assumptions and other inputs, applied to all periods included in the
measurement, unless otherwise specified.
Measurement Dates
The measurement dates were June 30, 2017 and June 30, 2018 for reporting dates June 30,
2018 and June 30, 2019, respectively.
Discount Rates
The discount rate as of June 30, 2018 was 3.87%, which was the 20-year bond buyer index
rate as of June 28, 2018. The discount rate that was used for June 30, 2017 liability
calculation was 3.58%, which was the 20-year bond buyer index rate as of June 30, 2017.
Per Person Cost Trends
The trend rates represent the annual rate of increase in employer claim payments, employer
premiums (including those paid to union-sponsored plans), and retiree contributions.
See the City’s CAFR for further details on these trends.
77

CITY OF PHILADELPHIA
AVIATION FUND
Notes to Financial Statements
Retirees Share of Benefit-related Costs
Participation rates for medical coverage:
* 85% of future retirees from non-represented groups are assumed to elect post-
retirement medical coverage.
* 100% of future retirees from represented groups (DC 33, 47, Fire, and Police) are
assumed to elect post-retirement medical coverage.
* 100% of DROP participants are assumed to continue in DROP for the remainder
of their DROP period (maximum four years) and then retire with a medical benefit.
Participation rates for life insurance coverage:
* 95% of current and future retired firefighters who participated in the pension plan
are assumed to be covered by City-provided life insurance.
* 87% of all other current and future retired pension plan participants are assumed
to be covered by City-provided life insurance.
Mortality Rates
It is assumed that deaths of active municipal and elected members, 110% and 115%, for
males and females, respectively, follows the RP-2014 Employee Table projected from base
year of 2006 to 2021 using mortality improvement scale MP-2017.
It is assumed that deaths of active uniformed members follow 85% of the RP-2014 Blue
Collar Employee Table projected from base year of 2006 to 2021 using mortality
improvement scale MP-2017.
For municipal and elected members, 127% and 119% for males and females, respectively,
the rate of post-retirement and post-disability mortality follow RP-2014 Healthy Annuitant
Table projected from base year 2006-2021 using mortality improvement scale MP-2017.
For uniformed members, the rate of post-retirement and post-disability mortality follow
115% of the RP-2014 Blue Collar Healthy Annuitant Table projected from base year 2006
to 2021 using mortality improvement scale MP-2017.
For municipal and elected members, the rate of post-disability mortality follows 95% of
the RP-2014 Disabled Retiree Table projected from base year 2006-2021 using mortality
improvement scale MP-2017.
For uniformed members, the rate of post-disability mortality follows 80% of the RP-2014
Disabled Retiree Table projected from base year 2006-2021 using mortality improvement
scale MP-2017.
78
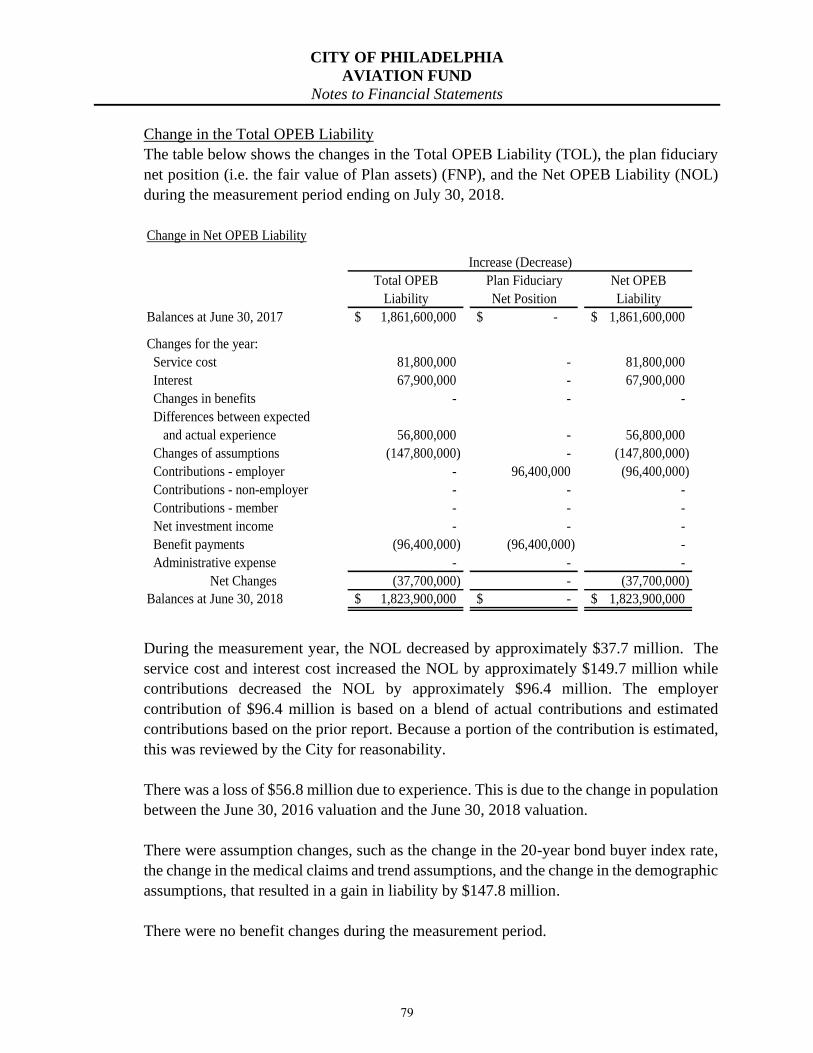
CITY OF PHILADELPHIA
AVIATION FUND
Notes to Financial Statements
Change in the Total OPEB Liability
The table below shows the changes in the Total OPEB Liability (TOL), the plan fiduciary
net position (i.e. the fair value of Plan assets) (FNP), and the Net OPEB Liability (NOL)
during the measurement period ending on July 30, 2018.
Total OPEB Plan Fiduciary Net OPEB
Liability Net Position Liability
Balances at June 30, 2017 1,861,600,000$ -$ 1,861,600,000$
Changes for the year:
Service cost 81,800,000 - 81,800,000
Interest 67,900,000 - 67,900,000
Changes in benefits - - -
Differences between expected
and actual experience 56,800,000 - 56,800,000
Changes of assumptions (147,800,000) - (147,800,000)
Contributions - employer - 96,400,000 (96,400,000)
Contributions - non-employer - - -
Contributions - member - - -
Net investment income - - -
Benefit payments (96,400,000) (96,400,000) -
Administrative expense - - -
Net Changes (37,700,000) - (37,700,000)
Balances at June 30, 2018 1,823,900,000$ -$ 1,823,900,000$
Increase (Decrease)
Change in Net OPEB Liability
During the measurement year, the NOL decreased by approximately $37.7 million. The
service cost and interest cost increased the NOL by approximately $149.7 million while
contributions decreased the NOL by approximately $96.4 million. The employer
contribution of $96.4 million is based on a blend of actual contributions and estimated
contributions based on the prior report. Because a portion of the contribution is estimated,
this was reviewed by the City for reasonability.
There was a loss of $56.8 million due to experience. This is due to the change in population
between the June 30, 2016 valuation and the June 30, 2018 valuation.
There were assumption changes, such as the change in the 20-year bond buyer index rate,
the change in the medical claims and trend assumptions, and the change in the demographic
assumptions, that resulted in a gain in liability by $147.8 million.
There were no benefit changes during the measurement period.
79

CITY OF PHILADELPHIA
AVIATION FUND
Notes to Financial Statements
Sensitivity of the Total OPEB Liability to Changes in the Discount Rate
The following represents the Total OPEB Liability (TOL) of the City, as well as what the
City’s total liability would be if it were calculated using a discount rate that is 1-percentage-
point lower (2.87%) or 1-percentage-point higher (4.87%) than the current discount rate.
Changes in the discount rate affect the measurement of the TOL. Lower discount rates
produce a higher TOL and higher discount rates produce a lower TOL. The table below
shows the sensitivity of the NOL to the discount rate.
1% Discount 1%
Decrease Rate Increase
2.87% 3.87% 4.87%
Total OPEB Liability $1,972,700,000 $1,823,900,000 $1,688,600,000
Plan Fiduciary Net Position $0 $0 $0
Net OPEB Liability $1,972,700,000 $1,823,900,000 $1,688,600,000
Plan Fiduciary Net Position as a Percentage of
the Total OPEB Liability 0.0% 0.0% 0.0%
A one percent decrease in the discount rate increases the TOL and NOL by approximately
8%. A one percent increase in the discount rate decreases the TOL and NOL by
approximately 7%.
Sensitivity of the Total OPEB Liability to Changes in the Healthcare Cost Trend Rates
The following represents the Total OPEB Liability of the City, as well as what the City’s
total liability would be if it were calculated using healthcare cost trend rates that are 1-
percentage-point lower or 1-percentage-point higher than the current discount rate.
Changes in healthcare trends affect the measurement of the TOL. Lower healthcare trends
produce a lower TOL and higher healthcare trends produce a higher TOL. The table below
shows the sensitivity of the NOL to healthcare trends.
1% Healthcare 1%
Decrease Trend Increase
Total OPEB Liability $1,659,800,000 $1,823,900,000 $2,016,100,000
Plan Fiduciary Net Position $0 $0 $0
Net OPEB Liability $1,659,800,000 $1,823,900,000 $2,016,100,000
Plan Fiduciary Net Position as a Percentage of
the Total OPEB Liability 0.0% 0.0% 0.0%
80

CITY OF PHILADELPHIA
AVIATION FUND
Notes to Financial Statements
A one percent decrease in the healthcare trends rate decreases the TOL and NOL by
approximately 9%. A one percent increase in the healthcare trends rate increases the TOL
and NOL by approximately 11%.
OPEB Expense, Deferred Outflows of Resources and Deferred Inflows of Resources
Related to OPEB
For the fiscal year ended June 30, 2019, the City recognized OPEB expense of $124.5
million. The table below shows the development of OPEB expense.
Fiscal Year Ending June 30, 2019 June 30, 2018
Measurement Year Ending June 30, 2018 June 30, 2017
Change in Net OPEB Liability (37,700,000)$ (75,000,000)$
Change in Deferred Outflows (50,500,000) -
Change in Deferred Inflows 116,300,000 90,500,000
Non-Employer Contributions - -
Employer Contributions 96,400,000 114,800,000
OPEB Expense 124,500,000$ 130,300,000$
OPEB Expense as % of Payroll 6.90% 7.47%
Operating Expenses
Service Costs 81,800,000$ 89,300,000$
Employee Contributions - -
Administrative Expenses - -
Total 81,800,000$ 89,300,000$
Financing Expenses
Interest Costs 67,900,000$ 56,100,000$
Expected Return on Assets - -
Total 67,900,000$ 56,100,000$
Changes
Benefit Changes -$ -$
Recognition of Assumption Changes (31,500,000) (15,100,000)
Recognition of Liability Gains and Losses 6,300,000 -
Recognition of Investment Gains and Losses - -
Total (25,200,000)$ (15,100,000)$
OPEB Expense 124,500,000$ 130,300,000$
Calculation of OPEB Expense
81
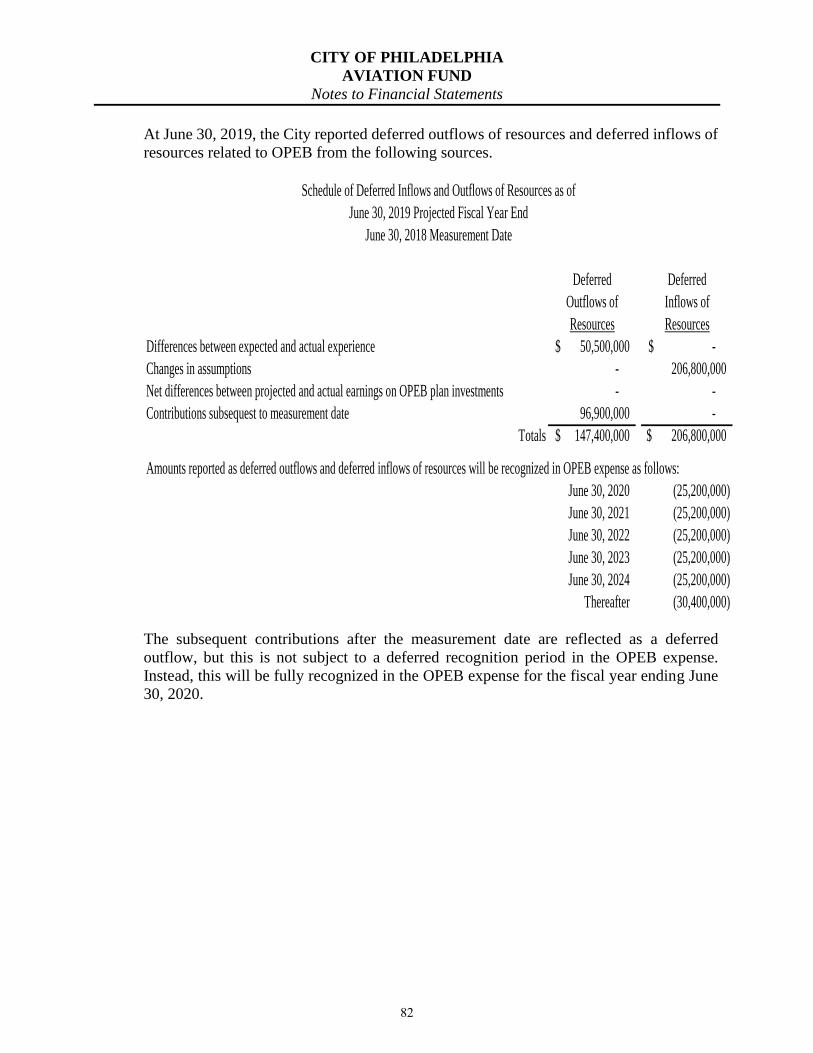
CITY OF PHILADELPHIA
AVIATION FUND
Notes to Financial Statements
At June 30, 2019, the City reported deferred outflows of resources and deferred inflows of
resources related to OPEB from the following sources.
Deferred Deferred
Outflows of Inflows of
Resources Resources
Differences between expected and actual experience 50,500,000$ -$
Changes in assumptions - 206,800,000
Net differences between projected and actual earnings on OPEB plan investments - -
Contributions subsequest to measurement date 96,900,000 -
Totals 147,400,000$ 206,800,000$
Amounts reported as deferred outflows and deferred inflows of resources will be recognized in OPEB expense as follows:
June 30, 2020 (25,200,000)
June 30, 2021 (25,200,000)
June 30, 2022 (25,200,000)
June 30, 2023 (25,200,000)
June 30, 2024 (25,200,000)
Thereafter (30,400,000)
Schedule of Deferred Inflows and Outflows of Resources as of
June 30, 2019 Projected Fiscal Year End
June 30, 2018 Measurement Date
The subsequent contributions after the measurement date are reflected as a deferred
outflow, but this is not subject to a deferred recognition period in the OPEB expense.
Instead, this will be fully recognized in the OPEB expense for the fiscal year ending June
30, 2020.
82

CITY OF PHILADELPHIA
AVIATION FUND
Notes to Financial Statements
Required Supplementary Information
The schedule below shows the changes in the NOL and related ratios required by GASB.
Measurement Year Ending 06/30/2018 06/30/2017
Total OPEB Liability
Service cost (beginning of year) 81,800,000$ 89,300,000$
Interest (includes interest on service cost) 67,900,000 56,100,000
Changes in benefit terms - -
Differences between expected and actual experience 56,800,000 -
Changes of assumptions (147,800,000) (105,600,000)
Benefit payments, incl. refunds of member contributions (96,400,000) (114,800,000)
Net change in total OPEB liability (37,700,000)$ (75,000,000)$
Total OPEB liability - beginning 1,861,600,000 1,936,600,000
Total OPEB liability - ending 1,823,900,000$ 1,861,600,000$
Plan fiduciary net position
Contributions - employer 96,400,000$ 114,800,000$
Contributions - non-employer - -
Contributions - member - -
Net investment income - -
Benefit payments, incl. refunds of member contributions (96,400,000) (114,800,000)
Administrative expense - -
Net change in fiduciary net position -$ -$
Plan fiduciary net position - beginning -$ -$
Plan fiduciary net position - ending - -
NET OPEB liability - ending 1,823,900,000$ 1,861,600,000$
Plan fiduciary net position as a percentage of total OPEB liability 0.0% 0.0%
Covered payroll 1,805,400,000$ 1,744,700,000$
Net OPEB lability as a percentage of covered payroll 101.0% 106.7%
Schedule of Changes in Net OPEB Liability and Related Ratios
The Plan is not currently being pre-funded and so there is no actuarially determined
contribution. The actuarially determined contribution is a target or recommended
contribution to the OPEB plan for the reporting period, determined in conformity with
Actuarial Standards of Practice based on the most recent measurement available when the
contributions for the reporting period was adopted. The Actuarial Required Contribution
(ARC) determined under GASB Statement No. 45 is not a recommended contribution
under Actuarial Standards of Practice, and thus is not shown. If the Plan decides to pre-
fund the liabilities, we will provide an appropriate actuarially determined contribution.
83

CITY OF PHILADELPHIA
AVIATION FUND
Notes to Financial Statements
17. RISK MANAGEMENT
The City is exposed to various risks of loss related to torts; theft of, damage to, and
destruction of assets; errors and omissions; injuries to employees; and natural disasters.
The City (except for Aviation Fund operations, the Municipal Authority, and PICA) is self-
insured for fire damage, casualty losses, public liability, workers’ compensation and
unemployment compensation. The Aviation Fund is self-insured for workers’
compensation and unemployment compensation and insured through insurance carriers for
other coverage. The City is self-insured for medical benefits provided to employees in the
Fraternal Order of Police, its city-administered health plan, the International Association
of Fire Fighters and District Council 47.
The City covers all claim settlements and judgments, except for those discussed above, out
of the resources of the fund associated with the claim. Claims expenditures and liabilities
are reported when it is probable that a loss has occurred and the amount of the loss can be
reasonably estimated. These losses include: an estimate of claims that have been incurred
but not reported; the effects of specific, incremental claims adjustment expenditures,
salvage, and subrogation; and unallocated claims adjustment expenditures.
At June 30, the amount of these liabilities was $354.2 million for the Primary Government.
This liability is the City’s best estimate based on available information. Changes in the
reported liability since June 30, 2017 resulted from the following:
Fiscal Years
Ending June 30
Beginning
Liability
Current Year
Claims and
Changes in
Estimates
Claim
Payments
Ending
Liability
2017 350.3$ 243.9$ (229.1)$ 365.1$
2018 365.1$ 199.3$ (211.4)$ 353.0$
2019 353.0$ 207.9$ (217.0)$ 343.9$
The City’s unemployment compensation and workers’ compensation coverages are
provided through its General Fund. Unemployment compensation and workers’
compensation coverages are funded by a pro-rata charge to the various funds. Payments
for fiscal years 2019 and 2018 were $3.5 million and $3.1 million for unemployment
compensation claims and $69.9 million and $63.0 million for workers’ compensation
claims, respectively.
The City’s estimated outstanding workers’ compensation liabilities are $261.4 million,
discounted at 3.5%. On an undiscounted basis, these liabilities total $344.5 million. These
liabilities include provisions for indemnity, medical and allocated loss adjustment expense
(ALAE). Excluding the ALAE, the respective liabilities for indemnity and medical
84
CITY OF PHILADELPHIA
AVIATION FUND
Notes to Financial Statements
payments relating to workers’ compensation total $239.7 million (discounted) and $318.2
million (undiscounted).
During the last five (5) fiscal years, no claim settlements have exceeded the level of
insurance coverage for operations using third party carriers. None of the City’s insured
losses have been settled with the purchase of annuity contracts.
18. COMMITMENTS
The Airport had commitments, which are open encumbrance balances, of approximately
$43.7 million and $37.3 million for operating expenses and $119.1 million and $134.5
million for capital assets and improvements for fiscal years 2019 and 2018, respectively.
The Airport expects to fund these commitments through operating revenue and through
bond proceeds, capital grants, customer facility charges, and passenger facility charges.
19. CONTINGENCIES
Claims Litigation
Henderson Condemnation Proceedings: In early September 2016, a Petition for the
Appointment of a Board of View pursuant to the Pennsylvania Eminent Domain Code, 26
Pa. C. Section 502(c), was filed in Delaware County against the City by numerous
Henderson related entities and trusts (the “Hendersons”). The Petition alleged that the City
effected a de facto taking of the Henderson properties (the “Property”), which Property is
proximate to Philadelphia International Airport and located in Tinicum Township,
Delaware County. The City desires to acquire the Property for Airport purposes and had
numerous discussions with representatives for the Sellers.
The City filed Preliminary Objections to the Petition and there was a hearing on the Petition
and the Preliminary Objections scheduled for January 2018. Prior to the hearing, the City
filed its own Declaration of Taking in September 2017 and made an offer of just
compensation. The City and the Hendersons then settled the foregoing matters. The City
obtained possession, and paid the Hendersons estimated just compensation of $54.5
million. The Hendersons’ de facto taking case was dismissed.
The Fair Market Value (“FMV”) of the Property remains disputed, and will be determined
by a Board of View, which was appointed by the Court of Common Pleas in Delaware
County on November 27, 2018. The hearing before the Board of View was held in part
during the summer of 2019. The Hendersons have rested their case in chief. The City’s
case in chief was completed at the end of October 2019 with the Henderson’s rebuttal case
to be heard thereafter. What the Board of View will determine to be the FMV is unknown.
85
CITY OF PHILADELPHIA
AVIATION FUND
Notes to Financial Statements
Both the City and the Hendersons will have the opportunity to advocate for the value that
they believe is the appropriate FMV. The City is represented by outside counsel.
20. SUBSEQUENT EVENTS
In May 2019, Host International, Inc. instituted a lawsuit against MarketPlace PHL, LLC
(“MarketPlace”), which manages all retail concession operations at Philadelphia
International Airport under an agreement with the City Division of Aviation. The lawsuit,
filed in Federal court in the Eastern District of Pennsylvania, alleges breaches of antitrust
laws in connection with MarketPlace having entered into a Beverage Services and
Sponsorship Agreement with a company doing business as Pepsi Beverages
Company. MarketPlace, after consultation with the City, filed a Motion to Dismiss the
lawsuit in July 2019. The court has not ruled on the motion. MarketPlace and the City
believe the claims in the litigation are without merit. Should the claims be successful, an
impact on MarketPlace may have an impact on the City of Philadelphia Division of
Aviation through MarketPlace’s contractual arrangements with the City.
86

REQUIRED SUPPLEMENTARY
INFORMATION

Percentage
Fiscal Year Fiscal Year Increase
2019 2018 (Decrease)
Fund balance, legal basis 179,116,574$ 143,068,950$ 25.2%
Add assets not included in legal basis:
Current assets 28,030,178 30,084,662 (6.8)%
Fixed assets, net of depreciation 2,132,536,867 2,110,956,122 1.0%
Restricted assets 795,936,510 809,467,935 (1.7)%
2,956,503,555 2,950,508,719 0.2%
Deduct liabilities not included in legal basis:
Construction accounts payable (28,622,124) (29,656,844) (3.5)%
Current liabilities (193,869,313) (180,529,956) 7.4%
Bonds payable (1,648,172,557) (1,718,231,339) (4.1)%
Other long-term liabilities (301,914,543) (301,045,956) 0.3%
(2,172,578,537) (2,229,464,095) (2.6)%
Add (deduct) fund balance accounts included in legal basis:
Reserve for encumbrance, current 42,967,023 36,319,251 18.3%
Reserve for encumbrance, prior (13,393,725) (13,083,921) 2.4%
Reserve for collectible accounts 928,278 928,278 0.0%
30,501,576 24,163,608 26.2%
Net position - GAAP basis 993,543,168$ 888,277,182$ 11.9%
Reconciliation of Fund Balance (Legally Enacted Basis) to Net Position (GAAP Basis)
CITY OF PHILADELPHIA
AVIATION FUND
87
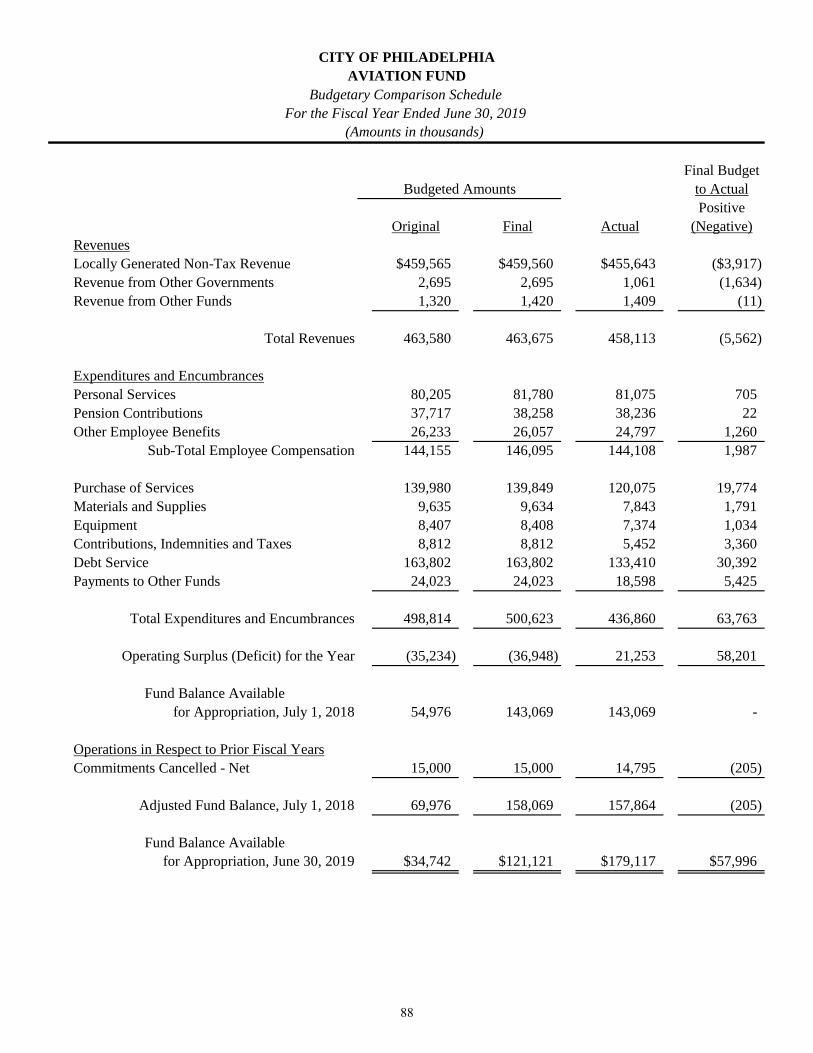
(Amounts in thousands)
Final Budget
Budgeted Amounts to Actual
Positive
Original Final Actual (Negative)
Revenues
Locally Generated Non-Tax Revenue $459,565 $459,560 $455,643 ($3,917)
Revenue from Other Governments 2,695 2,695 1,061 (1,634)
Revenue from Other Funds 1,320 1,420 1,409 (11)
Total Revenues 463,580 463,675 458,113 (5,562)
Expenditures and Encumbrances
Personal Services 80,205 81,780 81,075 705
Pension Contributions 37,717 38,258 38,236 22
Other Employee Benefits 26,233 26,057 24,797 1,260
Sub-Total Employee Compensation 144,155 146,095 144,108 1,987
Purchase of Services 139,980 139,849 120,075 19,774
Materials and Supplies 9,635 9,634 7,843 1,791
Equipment 8,407 8,408 7,374 1,034
Contributions, Indemnities and Taxes 8,812 8,812 5,452 3,360
Debt Service 163,802 163,802 133,410 30,392
Payments to Other Funds 24,023 24,023 18,598 5,425
Total Expenditures and Encumbrances 498,814 500,623 436,860 63,763
Operating Surplus (Deficit) for the Year (35,234) (36,948) 21,253 58,201
Fund Balance Available
for Appropriation, July 1, 2018 54,976 143,069 143,069 -
Operations in Respect to Prior Fiscal Years
Commitments Cancelled - Net 15,000 15,000 14,795 (205)
Adjusted Fund Balance, July 1, 2018 69,976 158,069 157,864 (205)
Fund Balance Available
for Appropriation, June 30, 2019 $34,742 $121,121 $179,117 $57,996
For the Fiscal Year Ended June 30, 2019
CITY OF PHILADELPHIA
AVIATION FUND
Budgetary Comparison Schedule
88

Disclosure Requirements
Fiscal Year Ended June 30, 2019
This report has been prepared pursuant to certain provisions of the following Continuing
Disclosure Agreements, collectively referred to as the “Disclosure Agreements”:
• Continuing Disclosure Agreements dated August 4, 2005, November 15,
2010, December 1, 2011, September 1, 2015, and December 15, 2017
between the City of Philadelphia, Pennsylvania and Digital Assurance
Certification, L.L.C.
This report contains financial information and operating data which, together with the City of
Philadelphia’s Comprehensive Annual Financial Report (“CAFR”), constitute the “Annual
Financial Information” as defined in the Disclosure Agreements.
In accordance with Section 3 of the Disclosure Agreements, the enclosed tables and financial
information are substantially similar to the type set forth in the Official Statements for the City of
Philadelphia, Pennsylvania Airport Revenue Bonds, Series, 2005C, 2010A/B/C/D, 2011A/B,
2015A, and 2017A/B.
89

Fiscal Year Fiscal Year Percentage Fiscal Year Percentage
Airlines 2017 2018 Change 2019 Change
Domestic
Scheduled Major / National
American 5,869,032 6,099,214 3.9% 6,609,437 8.4%
Other 3,746,747 3,950,170 5.4% 4,182,070 5.9%
9,615,779 10,049,384 4.5% 10,791,507 7.4%
Scheduled Regional / Commuter 3,351,342 3,321,659 (0.9)% 3,252,260 (2.1)%
Charter 463 1,900 310.4% 2,896 52.4%
Subtotal - Domestic 12,967,584 13,372,943 3.1% 14,046,663 5.0%
International
Scheduled Major / National 1,546,763 1,572,725 1.7% 1,738,566 10.5%
Scheduled Regional / Commuter 288,654 299,643 3.8% 303,195 1.2%
Charter 3,881 142 (96.3)% 0 (100.0)%
Subtotal - International 1,839,298 1,872,510 1.8% 2,041,761 9.0%
Total Enplaned Passengers 14,806,882 15,245,453 3.0% 16,088,424 5.5%
Note: (1) The City's fiscal year ends June 30th.
Table 1
City of Philadelphia Aviation Division
Recent Trends in Enplaned Passengers
Fiscal Years 2017 - 2019
Philadelphia International Airport (PHL)
90
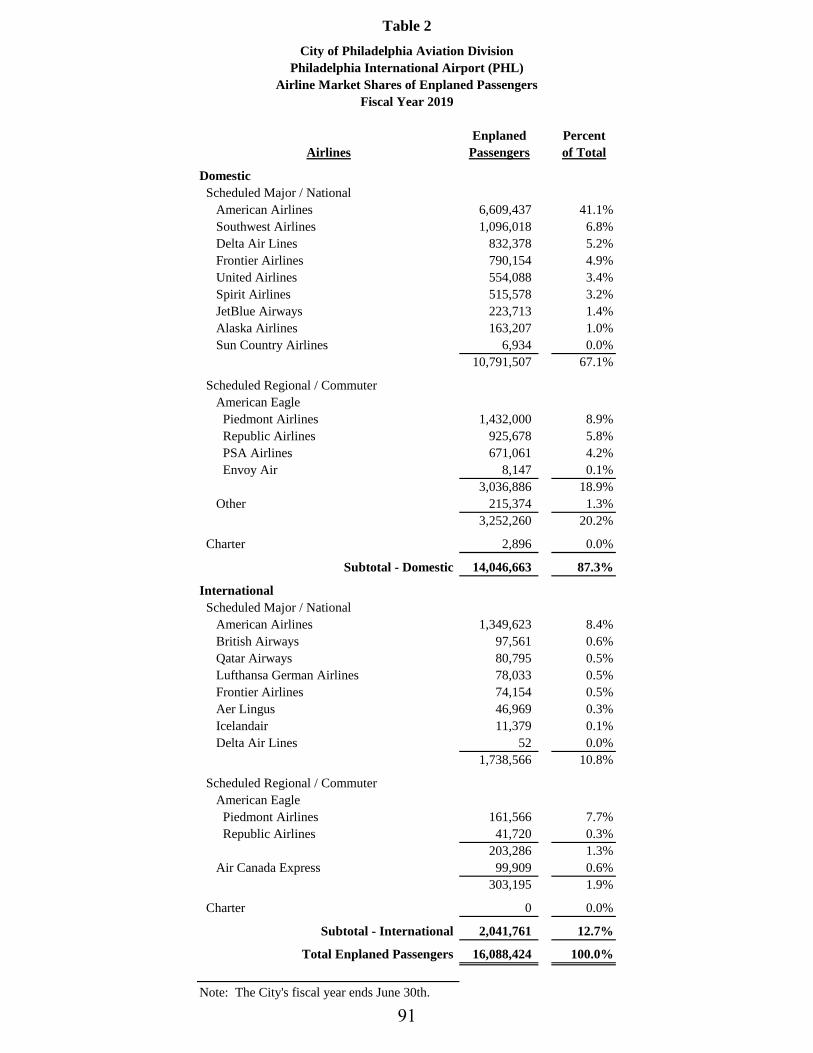
Enplaned Percent
Airlines Passengers of Total
Domestic
Scheduled Major / National
American Airlines 6,609,437 41.1%
Southwest Airlines 1,096,018 6.8%
Delta Air Lines 832,378 5.2%
Frontier Airlines 790,154 4.9%
United Airlines 554,088 3.4%
Spirit Airlines 515,578 3.2%
JetBlue Airways 223,713 1.4%
Alaska Airlines 163,207 1.0%
Sun Country Airlines 6,934 0.0%
10,791,507 67.1%
Scheduled Regional / Commuter
American Eagle
Piedmont Airlines 1,432,000 8.9%
Republic Airlines 925,678 5.8%
PSA Airlines 671,061 4.2%
Envoy Air 8,147 0.1%
3,036,886 18.9%
Other 215,374 1.3%
3,252,260 20.2%
Charter 2,896 0.0%
Subtotal - Domestic 14,046,663 87.3%
International
Scheduled Major / National
American Airlines 1,349,623 8.4%
British Airways 97,561 0.6%
Qatar Airways 80,795 0.5%
Lufthansa German Airlines 78,033 0.5%
Frontier Airlines 74,154 0.5%
Aer Lingus 46,969 0.3%
Icelandair 11,379 0.1%
Delta Air Lines 52 0.0%
1,738,566 10.8%
Scheduled Regional / Commuter
American Eagle
Piedmont Airlines 161,566 7.7%
Republic Airlines 41,720 0.3%
203,286 1.3%
Air Canada Express 99,909 0.6%
303,195 1.9%
Charter 0 0.0%
Subtotal - International 2,041,761 12.7%
Total Enplaned Passengers 16,088,424 100.0%
Note: The City's fiscal year ends June 30th.
Table 2
City of Philadelphia Aviation Division
Airline Market Shares of Enplaned Passengers
Fiscal Year 2019
Philadelphia International Airport (PHL)
91

Landed Percent
Airlines Weight of Total
Domestic
Scheduled Major / National
American Airlines 7,555,183 34.4%
Southwest Airlines 1,137,504 5.2%
Delta Air Lines 944,727 4.3%
Frontier Airlines 679,553 3.1%
United Airlines 607,765 2.8%
Spirit Airlines 503,168 2.3%
JetBlue Airways 284,454 1.3%
Alaska Airlines 176,452 0.8%
Air Canada 807 0.0%
11,889,613 54.1%
Scheduled Regional / Commuter
American Eagle
Piedmont Airlines 1,556,777 7.1%
Republic Airlines 1,192,913 5.4%
PSA Airlines 894,744 4.1%
Envoy Air 11,961 0.1%
3,656,396 16.6%
Other 266,991 1.2%
3,923,387 17.9%
Charter 11,982 0.1%
Subtotal - Domestic 15,824,982 72.1%
International
Scheduled Major / National
American Airlines 2,443,560 11.1%
British Airways 263,789 1.2%
Qatar Airways 167,058 0.8%
Lufthansa German Airlines 160,317 0.7%
Frontier Airlines 70,208 0.3%
Aer Lingus 70,140 0.3%
Icelandair 16,104 0.1%
Delta Air Lines 3,184 0.0%
United Airlines 142 0.0%
JetBlue Airways 142 0.0%
Southwest Airlines 128 0.0%
3,194,772 14.5%
Scheduled Regional / Commuter
American Eagle
Piedmont Airlines 158,973 0.7%
Republic Airlines 47,818 0.2%
206,791 0.9%
Air Canada Express 133,305 0.6%
340,096 1.5%
Charter 4,184 0.0%
Subtotal - International 3,539,052 16.1%
All-Cargo Airlines 2,599,498 11.8%
Total Landed Weight 21,963,532 100.0%
Note: The City's Fiscal Year Ends June 30.
TABLE 3
City of Philadelphia Aviation Division
Airline Market Shares of Landed Weight (in 1,000 lb. Units)
Fiscal Year 2019
Philadelphia International Airport (PHL)
92

(Fiscal Years ending June 30th - dollar amounts are listed in thousands)
Fiscal Year Fiscal Year Fiscal Year Fiscal Year Fiscal Year
2015 2016 2017 2018 2019
Amounts Available for Debt Service
1. Space rentals 109,731 108,115 113,400 123,705 116,966
2. Landing fees 64,708 73,968 80,457 90,438 83,890
3. Ramp Area rentals 1,063 1,213 572 427 212
4. International Terminal revenues 26,572 34,025 33,747 34,141 31,823
5. Subtotal, Airline Rentals, Fees and Charges 202,075 217,322 228,175 248,712 232,891
6. Nonairline Revenues 119,096 123,434 133,658 132,183 157,420
7. Interest income and Contribution for carrier incentive program 1,676 494 232 773 3,132
8. Total Project Revenues 322,847 341,250 362,065 381,668 393,443
9. Passenger Facility Charges (PFCs) Available for Debt Service 31,169 31,176 33,693 31,201 31,189
10. Portion of Fund Balance Attributable to Amounts Available for Debt Service 66,340 71,220 87,875 107,820 126,824
11. Total Amounts Available for Debt Service 420,356 443,646 483,633 520,689 551,456
Expenses
12. Net Operating Expenses 125,967 132,149 136,498 150,972 161,161
13. Required Renewal Fund Deposit 0 500 250 0 0
14. Revenue Bond Debt Service 125,248 120,595 122,596 127,790 126,007
15. Interdepartmental Charges 108,692 106,775 116,753 116,749 121,054
16. Total Expenses 359,908 360,020 376,097 395,511 408,222
17. Net Revenue 60,448$ 83,626$ 107,536$ 125,178$ 143,234$
18. Test A (Line 11- Line 12- Line 13) / (Line 14) 2.35 2.58 2.83 2.89 3.10
19. Test B (Line 11- Line 12- Line 13- Line 15) / (Line 14) 1.48 1.69 1.88 1.98 2.14
_________________________________________
Note: The information presented above reconciles to the Basic Financial Statements contained in the City's Comprehensive Annual Financial Report (CAFR), which is audited
by the Office of the City Controller.
Rate Covenant Tests of the Original General Airport Revenue Bond Ordinance
Table 4
City of Philadelphia Aviation Division
Philadelphia International Airport (PHL)
Summary of Historical Project Revenues and Expenses of the Airport System
93
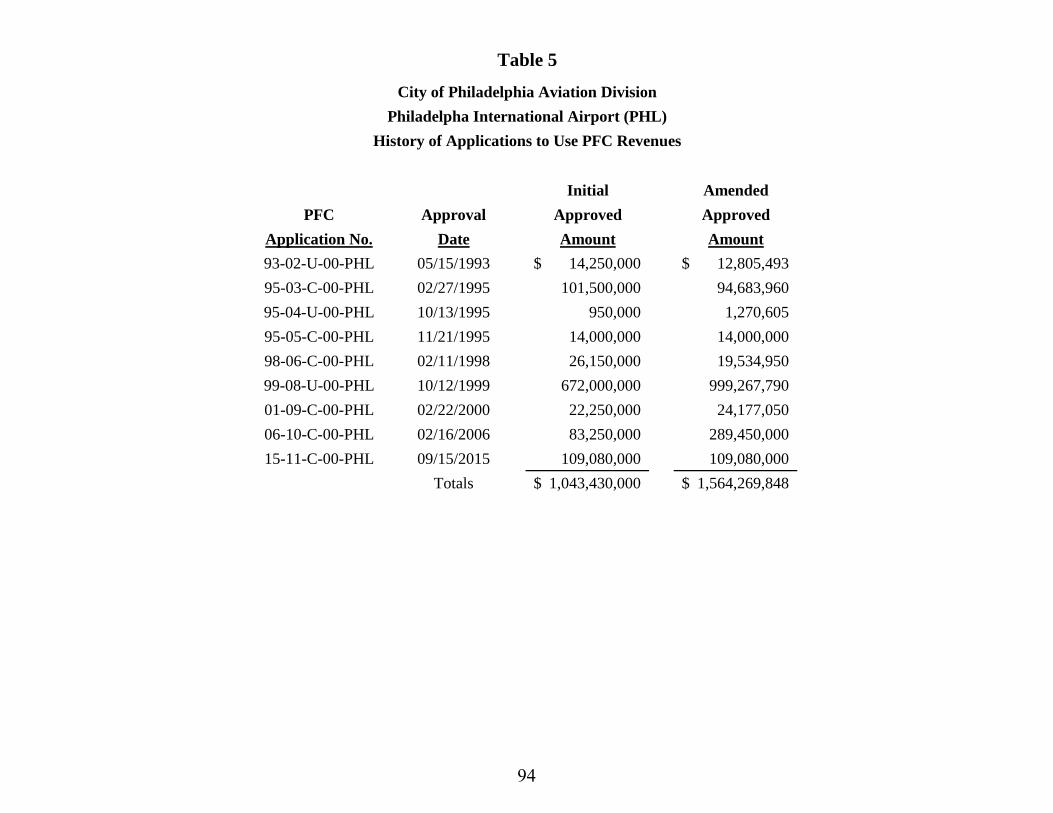
Initial Amended
PFC Approval Approved Approved
Application No. Date Amount Amount
93-02-U-00-PHL 05/15/1993 14,250,000$ 12,805,493$
95-03-C-00-PHL 02/27/1995 101,500,000 94,683,960
95-04-U-00-PHL 10/13/1995 950,000 1,270,605
95-05-C-00-PHL 11/21/1995 14,000,000 14,000,000
98-06-C-00-PHL 02/11/1998 26,150,000 19,534,950
99-08-U-00-PHL 10/12/1999 672,000,000 999,267,790
01-09-C-00-PHL 02/22/2000 22,250,000 24,177,050
06-10-C-00-PHL 02/16/2006 83,250,000 289,450,000
15-11-C-00-PHL 09/15/2015 109,080,000 109,080,000
Totals 1,043,430,000$ 1,564,269,848$
City of Philadelphia Aviation Division
Philadelpha International Airport (PHL)
History of Applications to Use PFC Revenues
Table 5
94
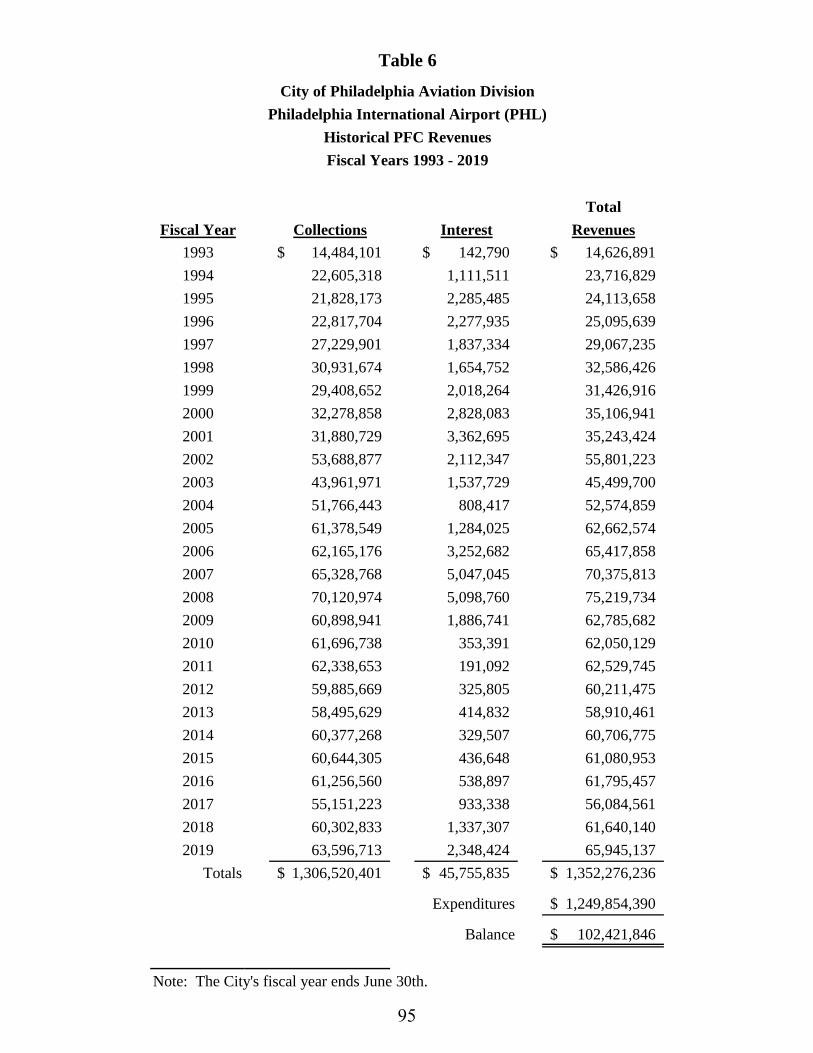
Total
Fiscal Year Collections Interest Revenues
1993 14,484,101$ 142,790$ 14,626,891$
1994 22,605,318 1,111,511 23,716,829
1995 21,828,173 2,285,485 24,113,658
1996 22,817,704 2,277,935 25,095,639
1997 27,229,901 1,837,334 29,067,235
1998 30,931,674 1,654,752 32,586,426
1999 29,408,652 2,018,264 31,426,916
2000 32,278,858 2,828,083 35,106,941
2001 31,880,729 3,362,695 35,243,424
2002 53,688,877 2,112,347 55,801,223
2003 43,961,971 1,537,729 45,499,700
2004 51,766,443 808,417 52,574,859
2005 61,378,549 1,284,025 62,662,574
2006 62,165,176 3,252,682 65,417,858
2007 65,328,768 5,047,045 70,375,813
2008 70,120,974 5,098,760 75,219,734
2009 60,898,941 1,886,741 62,785,682
2010 61,696,738 353,391 62,050,129
2011 62,338,653 191,092 62,529,745
2012 59,885,669 325,805 60,211,475
2013 58,495,629 414,832 58,910,461
2014 60,377,268 329,507 60,706,775
2015 60,644,305 436,648 61,080,953
2016 61,256,560 538,897 61,795,457
2017 55,151,223 933,338 56,084,561
2018 60,302,833 1,337,307 61,640,140
2019 63,596,713 2,348,424 65,945,137
Totals 1,306,520,401$ 45,755,835$ 1,352,276,236$
Expenditures 1,249,854,390$
Balance 102,421,846$
Note: The City's fiscal year ends June 30th.
Table 6
City of Philadelphia Aviation Division
Historical PFC Revenues
Philadelphia International Airport (PHL)
Fiscal Years 1993 - 2019
95
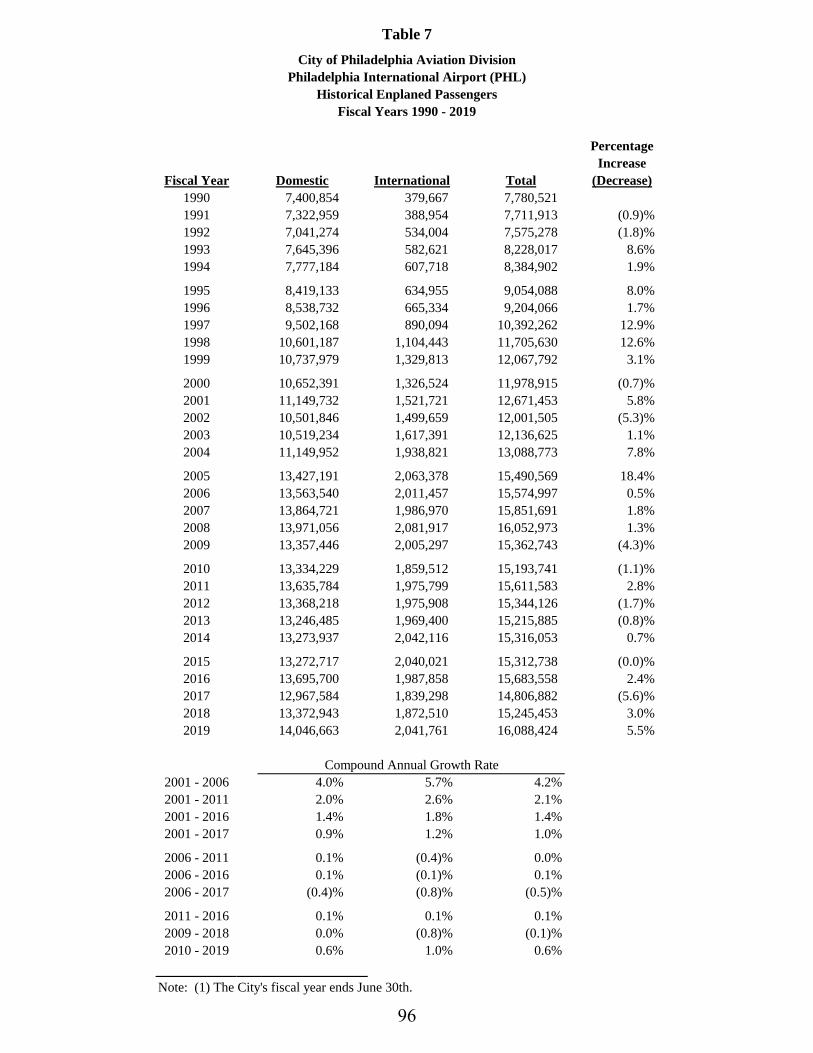
Percentage
Increase
Fiscal Year Domestic International Total (Decrease)
1990 7,400,854 379,667 7,780,521
1991 7,322,959 388,954 7,711,913 (0.9)%
1992 7,041,274 534,004 7,575,278 (1.8)%
1993 7,645,396 582,621 8,228,017 8.6%
1994 7,777,184 607,718 8,384,902 1.9%
1995 8,419,133 634,955 9,054,088 8.0%
1996 8,538,732 665,334 9,204,066 1.7%
1997 9,502,168 890,094 10,392,262 12.9%
1998 10,601,187 1,104,443 11,705,630 12.6%
1999 10,737,979 1,329,813 12,067,792 3.1%
2000 10,652,391 1,326,524 11,978,915 (0.7)%
2001 11,149,732 1,521,721 12,671,453 5.8%
2002 10,501,846 1,499,659 12,001,505 (5.3)%
2003 10,519,234 1,617,391 12,136,625 1.1%
2004 11,149,952 1,938,821 13,088,773 7.8%
2005 13,427,191 2,063,378 15,490,569 18.4%
2006 13,563,540 2,011,457 15,574,997 0.5%
2007 13,864,721 1,986,970 15,851,691 1.8%
2008 13,971,056 2,081,917 16,052,973 1.3%
2009 13,357,446 2,005,297 15,362,743 (4.3)%
2010 13,334,229 1,859,512 15,193,741 (1.1)%
2011 13,635,784 1,975,799 15,611,583 2.8%
2012 13,368,218 1,975,908 15,344,126 (1.7)%
2013 13,246,485 1,969,400 15,215,885 (0.8)%
2014 13,273,937 2,042,116 15,316,053 0.7%
2015 13,272,717 2,040,021 15,312,738 (0.0)%
2016 13,695,700 1,987,858 15,683,558 2.4%
2017 12,967,584 1,839,298 14,806,882 (5.6)%
2018 13,372,943 1,872,510 15,245,453 3.0%
2019 14,046,663 2,041,761 16,088,424 5.5%
2001 - 2006 4.0% 5.7% 4.2%
2001 - 2011 2.0% 2.6% 2.1%
2001 - 2016 1.4% 1.8% 1.4%
2001 - 2017 0.9% 1.2% 1.0%
2006 - 2011 0.1% (0.4)% 0.0%
2006 - 2016 0.1% (0.1)% 0.1%
2006 - 2017 (0.4)% (0.8)% (0.5)%
2011 - 2016 0.1% 0.1% 0.1%
2009 - 2018 0.0% (0.8)% (0.1)%
2010 - 2019 0.6% 1.0% 0.6%
Note: (1) The City's fiscal year ends June 30th.
Table 7
City of Philadelphia Aviation Division
Historical Enplaned Passengers
Compound Annual Growth Rate
Philadelphia International Airport (PHL)
Fiscal Years 1990 - 2019
96

STATISTICAL SECTION
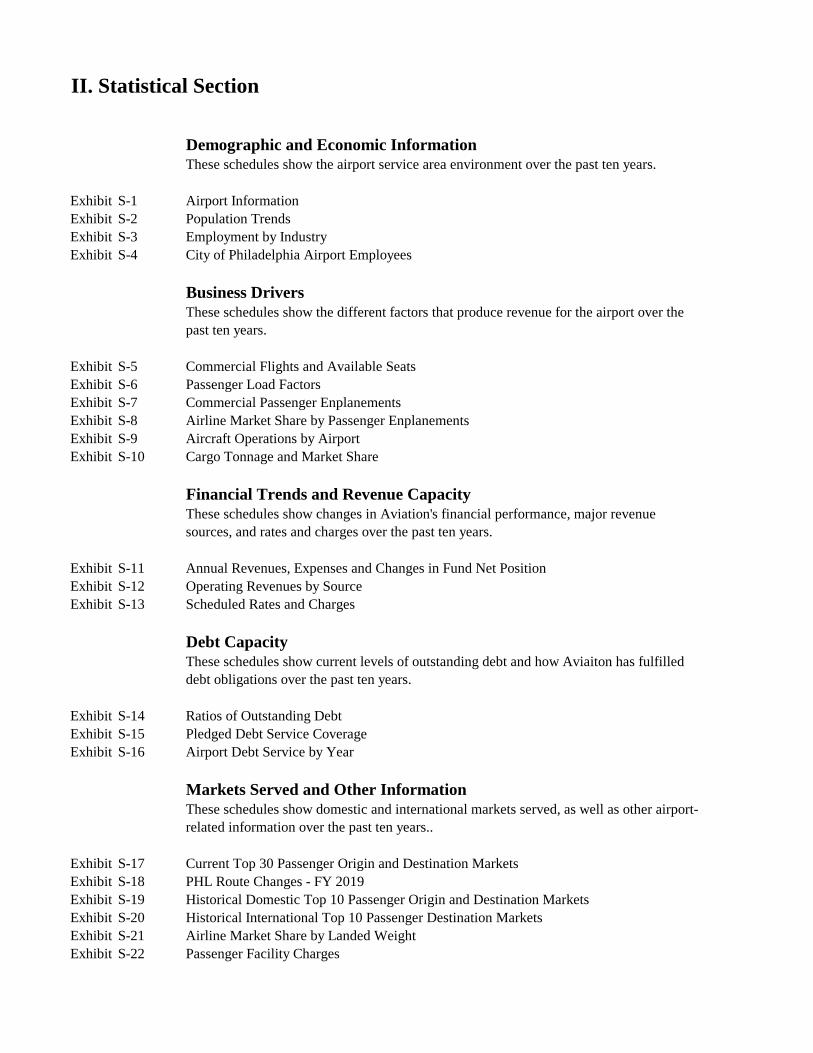
Demographic and Economic Information
These schedules show the airport service area environment over the past ten years.
Exhibit S-1 Airport Information
Exhibit S-2 Population Trends
Exhibit S-3 Employment by Industry
Exhibit S-4 City of Philadelphia Airport Employees
Business Drivers
These schedules show the different factors that produce revenue for the airport over the
past ten years.
Exhibit S-5 Commercial Flights and Available Seats
Exhibit S-6 Passenger Load Factors
Exhibit S-7 Commercial Passenger Enplanements
Exhibit S-8 Airline Market Share by Passenger Enplanements
Exhibit S-9 Aircraft Operations by Airport
Exhibit S-10 Cargo Tonnage and Market Share
Financial Trends and Revenue Capacity
These schedules show changes in Aviation's financial performance, major revenue
sources, and rates and charges over the past ten years.
Exhibit S-11 Annual Revenues, Expenses and Changes in Fund Net Position
Exhibit S-12 Operating Revenues by Source
Exhibit S-13 Scheduled Rates and Charges
Debt Capacity
These schedules show current levels of outstanding debt and how Aviaiton has fulfilled
debt obligations over the past ten years.
Exhibit S-14 Ratios of Outstanding Debt
Exhibit S-15 Pledged Debt Service Coverage
Exhibit S-16 Airport Debt Service by Year
Markets Served and Other Information
These schedules show domestic and international markets served, as well as other airport-
related information over the past ten years..
Exhibit S-17 Current Top 30 Passenger Origin and Destination Markets
Exhibit S-18 PHL Route Changes - FY 2019
Exhibit S-19 Historical Domestic Top 10 Passenger Origin and Destination Markets
Exhibit S-20 Historical International Top 10 Passenger Destination Markets
Exhibit S-21 Airline Market Share by Landed Weight
Exhibit S-22 Passenger Facility Charges
II. Statistical Section

Exhibit S-1: Philadelphia International Airport Information
Location
Acres 2,598 +/- acres
Airport Code PHL
Runways Length Width
9R-27L 12,000' 200'
9L-27R 9,500' 150'
17-35 6,501' 150'
8-26 5,000' 150'
Aircraft Capability Group VI - Airbus 380 (Limited)
Terminals Terminal A-East 433,001 square feet
Terminal A-West 818,100 square feet
Terminals B & C 951,721 square feet
Terminals D & E 808,095 square feet
Terminal F 243,437 square feet
Total Terminal Space 3,254,354 square feet
Number of Passenger Gates 126 gates
Parking Public
Garage Parking 10,984 spaces
Short-Term 839 spaces
Surface Parking 7,117 spaces
Total Public Parking 18,940 spaces
Cell Phone Waiting Area 151 spaces
Tenant Employee Parking 3,700 spaces
Cargo Number of Cargo Buildings 6 buildings
Cargo Space 449,761 square feet
International Customs/Immigration Federal Inspection Facility
Tower TRACON - Philadelphia, PA - Operating 24 Hours/Day 7 Days/Week
Intermodal Access Interstate 95 (I-95)
Regional Rail & Buses operated by the Southeastern Pennsylvania
Transportation Authority (SEPTA)
Northeast Philadelphia Airport
Data as of December 31, 2019
Source: City of Philadelphia
Located partly in the southwestern section of the City and partly in the
northeastern section of Delaware County, about 7.2 miles from center city
Philadelphia
Located on a 1,118-acre site situated within the City limits about 10 miles
by road northeast of center city Philadelphia and provides for general
aviation, air taxi and corporate, as well as occasional military use
97

Exhibit S-2: Population Trends
Metropolitan Statistical Area (MSA)
(By Calendar Year)
2018 2017 2016 2015 2014 2013 2012 2011 2010 2009
10-Year
Annual
Growth
Delaware & Maryland
Cecil County, MD 102,826 102,746 102,701 102,452 102,249 101,931 101,767 101,585 101,172 100,796 0.20%
New Castle County, DE 559,335 559,793 557,851 555,587 552,465 549,486 546,120 542,282 538,831 534,634 0.45%
Total - Delaware & Maryland 662,161 662,539 660,552 658,039 654,714 651,417 647,887 643,867 640,003 635,430 0.41%
New Jersey
Burlington County 445,384 448,596 448,342 448,844 450,318 449,858 451,256 450,486 449,200 446,108 (0.02%)
Camden County 507,078 510,719 510,741 510,809 510,913 511,798 512,827 513,180 513,506 517,879 (0.21%)
Gloucester County 291,408 292,206 291,703 291,651 291,151 290,151 289,912 289,605 288,994 289,920 0.05%
Salem County 62,607 62,792 63,158 63,730 64,360 64,840 65,446 65,883 65,982 66,342 (0.58%)
Total - New Jersey 1,306,477 1,314,313 1,313,944 1,315,034 1,316,742 1,316,647 1,319,441 1,319,154 1,317,682 1,320,249 (0.10%)
Pennsylvania
Bucks County 628,195 628,341 626,751 626,209 625,806 625,321 625,572 626,067 625,431 626,015 0.03%
Chester County 522,046 519,293 516,489 515,226 512,864 509,388 506,283 503,404 499,920 498,894 0.45%
Delaware County 564,751 564,696 563,995 563,705 562,913 561,609 560,782 559,079 558,901 558,028 0.12%
Montgomery County 828,604 826,075 820,656 817,869 815,947 812,838 808,912 805,186 800,981 782,339 0.58%
Philadelphia County 1,584,138 1,580,863 1,574,765 1,570,507 1,564,042 1,558,109 1,551,944 1,539,649 1,528,271 1,547,297 0.24%
Total - Pennsylvania 4,127,734 4,119,268 4,102,656 4,093,516 4,081,572 4,067,265 4,053,493 4,033,385 4,013,504 4,012,573 0.28%
Philadelphia MSA 6,096,372 6,096,120 6,077,152 6,066,589 6,053,028 6,035,329 6,020,821 5,996,406 5,971,189 5,968,252 0.21%
Note: Population estimates for 2010 to 2016 modified by U.S. Census Bureau, Population Division.
Population estimates as of July 1st
2019 data is not available until March, 2020
Source: U.S. Census Bureau, Population Division
98
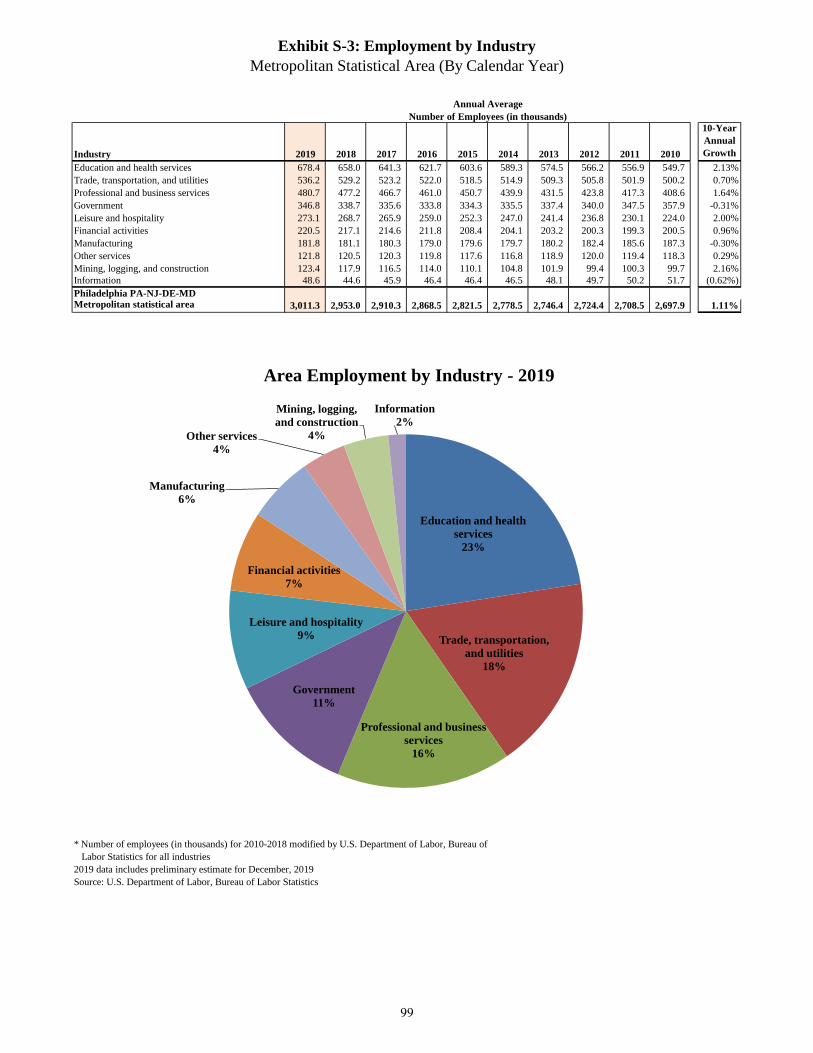
Exhibit S-3: Employment by Industry
Metropolitan Statistical Area (By Calendar Year)
Industry 2019 2018 2017 2016 2015 2014 2013 2012 2011 2010
10-Year
Annual
Growth
Education and health services 678.4 658.0 641.3 621.7 603.6 589.3 574.5 566.2 556.9 549.7 2.13%
Trade, transportation, and utilities 536.2 529.2 523.2 522.0 518.5 514.9 509.3 505.8 501.9 500.2 0.70%
Professional and business services 480.7 477.2 466.7 461.0 450.7 439.9 431.5 423.8 417.3 408.6 1.64%
Government 346.8 338.7 335.6 333.8 334.3 335.5 337.4 340.0 347.5 357.9 -0.31%
Leisure and hospitality 273.1 268.7 265.9 259.0 252.3 247.0 241.4 236.8 230.1 224.0 2.00%
Financial activities 220.5 217.1 214.6 211.8 208.4 204.1 203.2 200.3 199.3 200.5 0.96%
Manufacturing 181.8 181.1 180.3 179.0 179.6 179.7 180.2 182.4 185.6 187.3 -0.30%
Other services 121.8 120.5 120.3 119.8 117.6 116.8 118.9 120.0 119.4 118.3 0.29%
Mining, logging, and construction 123.4 117.9 116.5 114.0 110.1 104.8 101.9 99.4 100.3 99.7 2.16%
Information 48.6 44.6 45.9 46.4 46.4 46.5 48.1 49.7 50.2 51.7 (0.62%)
Philadelphia PA-NJ-DE-MD Metropolitan statistical area 3,011.3 2,953.0 2,910.3 2,868.5 2,821.5 2,778.5 2,746.4 2,724.4 2,708.5 2,697.9 1.11%
Labor Statistics for all industries
2019 data includes preliminary estimate for December, 2019
Source: U.S. Department of Labor, Bureau of Labor Statistics
Area Employment by Industry - 2019
Annual Average
Number of Employees (in thousands)
* Number of employees (in thousands) for 2010-2018 modified by U.S. Department of Labor, Bureau of
Education and health
services
23%
Trade, transportation,
and utilities
18%
Professional and business
services
16%
Government
11%
Leisure and hospitality
9%
Financial activities
7%
Manufacturing
6%
Other services
4%
Mining, logging,
and construction
4%
Information
2%
99

Exhibit S-4: City of Philadelphia Airport Employees
(By Fiscal Year)
Filled positions at the end of the fiscal year.
Division of Aviation for 2011 - 2019 includes Division of Technology
Source: City of Philadelphia, Quarterly City Manager's Report
748 731 754 754 778 761 770 768815
778
164 165 165 165
165 164 161 163
161 161
64 69 67 67
61 60 60 66
69 73 21 21
21 21 20
21 19 23
23 24 20 20
20 20 21
20 20 16
21 19
0
200
400
600
800
1,000
1,200
2010 2011 2012 2013 2014 2015 2016 2017 2018 2019
City of Philadelphia Airport Employees
Division of Aviation Police Fire Fleet Management Law
100

Exhibit S-5: Commercial Flights and Available Seats
(By Fiscal Year)
2010 2011 2012 2013 2014 2015 2016 2017 2018 2019
10-Year Annual
Growth
Domestic
Flights 193,267 193,315 189,034 187,696 180,527 175,947 169,921 155,947 152,169 155,908 (2.13%)
Seats 17,823,198 17,929,812 17,223,904 16,629,825 16,435,626 16,317,090 16,411,017 15,759,155 16,232,474 17,147,659 (0.39%)
2010 2011 2012 2013 2014 2015 2016 2017 2018 2019
10-Year Annual
Growth
International
Flights 17,600 18,089 18,990 18,332 18,312 17,923 17,650 16,252 15,911 16,720 (0.51%)
Seats 2,581,136 2,615,698 2,661,499 2,594,329 2,643,622 2,723,892 2,697,451 2,444,766 2,488,116 2,601,675 0.08%
2010 2011 2012 2013 2014 2015 2016 2017 2018 2019
10-Year Annual
Growth
Total
Flights 210,867 211,404 208,024 206,028 198,839 193,870 187,571 172,199 168,080 172,628 (1.98%)
Seats 20,404,334 20,545,510 19,885,403 19,224,154 19,079,248 19,040,982 19,108,468 18,203,921 18,720,590 19,749,334 (0.33%)
Source: Campbell-Hill Aviation Group, LLC
15,000,000
15,500,000
16,000,000
16,500,000
17,000,000
17,500,000
18,000,000
18,500,000
19,000,000
19,500,000
20,000,000
150,000
155,000
160,000
165,000
170,000
175,000
180,000
185,000
190,000
195,000
200,000
2010 2011 2012 2013 2014 2015 2016 2017 2018 2019
Av
ail
ab
le S
eats
Fli
gh
ts
Domestic Flights & Available Seats
Flights Seats
2,400,000
2,450,000
2,500,000
2,550,000
2,600,000
2,650,000
2,700,000
2,750,000
15,000
15,500
16,000
16,500
17,000
17,500
18,000
18,500
19,000
2010 2011 2012 2013 2014 2015 2016 2017 2018 2019
Avail
ab
le S
eats
Fli
gh
ts
International Flights & Available Seats
Flights Seats
18,000,000
18,500,000
19,000,000
19,500,000
20,000,000
20,500,000
21,000,000
160,000
170,000
180,000
190,000
200,000
210,000
220,000
2010 2011 2012 2013 2014 2015 2016 2017 2018 2019
Av
ail
ab
le S
eats
Fli
gh
ts
Total Flights & Available Seats
Flights Seats
101

Exhibit S-6: Passenger Load Factors
(By Fiscal Year)
2010 2011 2012 2013 2014 2015 2016 2017 2018 2019
10-Year Annual
Growth
Domestic
Passenger Load Factor 74.81% 76.05% 77.61% 79.65% 80.76% 81.34% 83.45% 82.29% 82.38% 81.92% 0.91%
2010 2011 2012 2013 2014 2015 2016 2017 2018 2019
10-Year Annual
Growth
International
Passenger Load Factor 72.04% 75.54% 74.24% 75.91% 77.25% 74.89% 73.69% 75.23% 75.26% 78.48% 0.86%
2010 2011 2012 2013 2014 2015 2016 2017 2018 2019
10-Year Annual
Growth
Total
Passenger Load Factor 74.46% 75.99% 77.16% 79.15% 80.28% 80.42% 82.08% 81.34% 81.44% 81.46% 0.90%
* Note: Domestic and International Enplanements from 2010 through 2018 were restated.
Sources: Campbell-Hill Aviation Group, LLC
City of Philadelphia
70.00%
72.00%
74.00%
76.00%
78.00%
80.00%
82.00%
84.00%
2010 2011 2012 2013 2014 2015 2016 2017 2018 2019
Domestic Passenger Load Factor
68.00%
70.00%
72.00%
74.00%
76.00%
78.00%
80.00%
2010 2011 2012 2013 2014 2015 2016 2017 2018 2019
International Passenger Load Factor
72.00%
74.00%
76.00%
78.00%
80.00%
82.00%
84.00%
2010 2011 2012 2013 2014 2015 2016 2017 2018 2019
Total Passenger Load Factor
102

Exhibit S-7: Commercial Passenger Enplanements
(By Fiscal Year)
Fiscal Year
PHL Domestic
Passenger
Enplanements
PHL Annual
Growth
U.S. Air Carrier
Domestic
Enplanements *
U.S. Annual
Growth
2019 14,046,663 5.0% 795,947,000 4.5%
2018 13,372,943 3.1% 761,971,000 4.1%
2017 12,967,584 (5.3%) 732,289,000 2.6%
2016 13,695,700 3.2% 713,652,000 5.3%
2015 13,272,717 (0.0%) 677,973,000 3.7%
2014 13,273,937 0.2% 654,061,000 1.3%
2013 13,246,485 (0.9%) 645,821,000 (0.1%)
2012 13,368,218 (2.0%) 646,199,000 1.0%
2011 13,635,784 2.3% 639,606,000 2.6%
2010 13,334,229 (1.9%) 623,200,000 (0.2%)
Fiscal Year
PHL International
Passenger
Enplanements
PHL Annual
Growth
U.S. Air Carrier
International
Enplanements *
U.S. Annual
Growth
2019 2,041,761 9.0% 114,999,000 3.1%
2018 1,872,510 1.8% 111,580,000 3.2%
2017 1,839,298 (7.5%) 108,069,000 1.6%
2016 1,987,858 (2.6%) 106,402,000 3.2%
2015 2,040,021 (0.1%) 103,114,000 1.1%
2014 2,042,116 3.7% 101,991,000 3.4%
2013 1,969,400 (0.3%) 98,593,000 1.7%
2012 1,975,908 0.0% 96,911,000 1.4%
2011 1,975,799 6.3% 95,526,000 5.5%
2010 1,859,512 4.9% 90,543,000 0.8%
Total enplanements
Fiscal Year
PHL Total
Passenger
Enplanements
PHL Annual
Growth
U.S. Air Carrier
Total
Enplanements
U.S. Annual
Growth
2019 16,088,424 5.5% 910,946,000 4.3%
2018 15,245,453 3.0% 873,551,000 3.9%
2017 14,806,882 (5.6%) 840,358,000 2.5%
2016 15,683,558 2.4% 820,054,000 5.0%
2015 15,312,738 (0.0%) 781,087,000 3.3%
2014 15,316,053 0.7% 756,052,000 1.6%
2013 15,215,885 (0.8%) 744,414,000 0.2%
2012 15,344,126 (1.7%) 743,110,000 1.1%
2011 15,611,583 2.8% 735,132,000 3.0%
2010 15,193,741 (1.1%) 713,743,000 (0.1%)
* 2017 U.S. Air Carrier Domestic and International Enplanements modified by Bureau of
Transportation Statistics
Note: Domestic and International Enplanements from 2010 through 2018 were restated.
PHL Passenger Enplanements and Annual Growth from City of Philadelphia
U.S. Air Carrier Enplanements and Annual Growth from Bureau of Transportation Statistics
Domestic enplanements
International enplanements
103

Exhibit S-7: Commercial Passenger Enplanements
(Continued, By Fiscal Year)
* Note: Domestic and International Enplanements from 2010 through 2018 were restated.
Source: City of Philadelphia
Source: Bureau of Transportation Statistics
(8.0%)
(6.0%)
(4.0%)
(2.0%)
0.0%
2.0%
4.0%
6.0%
8.0%
10.0%
0
1,500,000
3,000,000
4,500,000
6,000,000
7,500,000
9,000,000
10,500,000
12,000,000
13,500,000
15,000,000
2010 2011 2012 2013 2014 2015 2016 2017 2018 2019
An
nu
al
Gro
wth
En
pla
nem
ents
Domestic Enplanements by Fiscal Year
Domestic Enplanements PHL Growth Industry Growth
(10.0%)
(8.0%)
(6.0%)
(4.0%)
(2.0%)
0.0%
2.0%
4.0%
6.0%
8.0%
10.0%
0
500,000
1,000,000
1,500,000
2,000,000
2,500,000
2010 2011 2012 2013 2014 2015 2016 2017 2018 2019
An
nu
al
Gro
wth
En
pla
nem
ents
International Enplanements by Fiscal Year
International Enplanements PHL Growth Industry Growth
(8.0%)
(6.0%)
(4.0%)
(2.0%)
0.0%
2.0%
4.0%
6.0%
8.0%
10.0%
0
1,500,000
3,000,000
4,500,000
6,000,000
7,500,000
9,000,000
10,500,000
12,000,000
13,500,000
15,000,000
16,500,000
2010 2011 2012 2013 2014 2015 2016 2017 2018 2019
An
nu
al
Gro
wth
En
pla
nem
ents
Total Enplanements by Fiscal Year
Total Enplanements PHL Growth Industry Growth
104
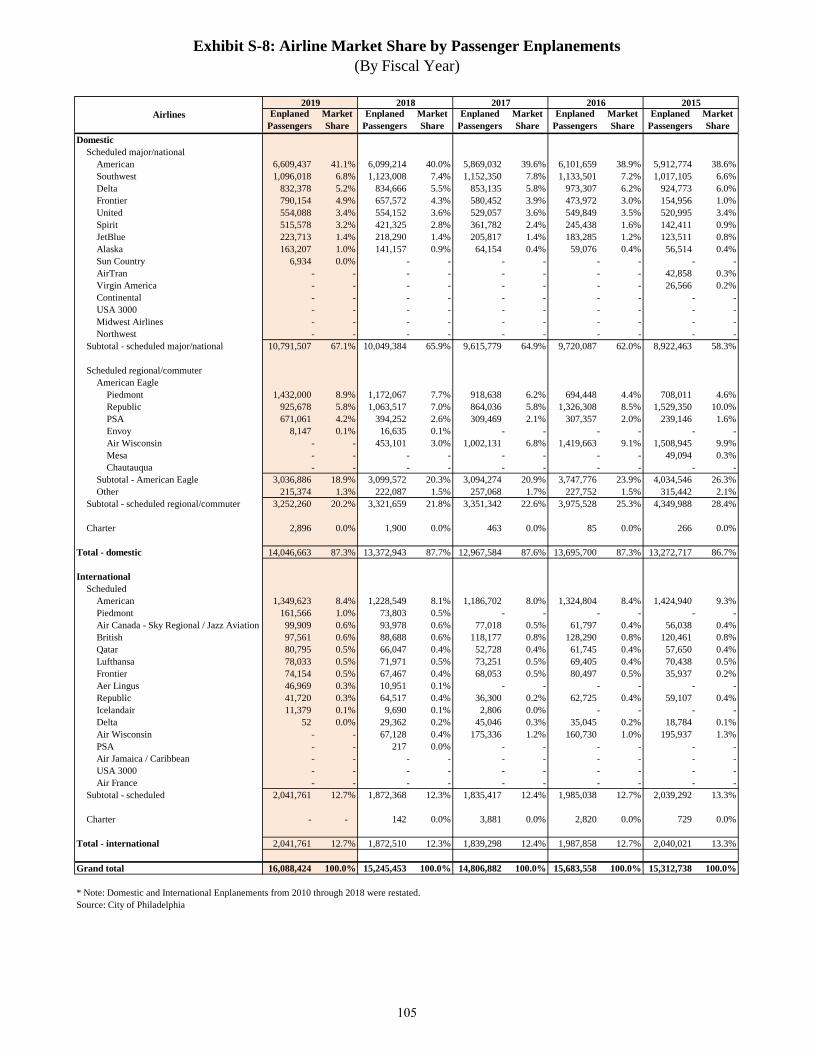
Exhibit S-8: Airline Market Share by Passenger Enplanements
(By Fiscal Year)
Enplaned
Passengers
Market
Share
Enplaned
Passengers
Market
Share
Enplaned
Passengers
Market
Share
Enplaned
Passengers
Market
Share
Enplaned
Passengers
Market
Share
Domestic
Scheduled major/national
American 6,609,437 41.1% 6,099,214 40.0% 5,869,032 39.6% 6,101,659 38.9% 5,912,774 38.6%
Southwest 1,096,018 6.8% 1,123,008 7.4% 1,152,350 7.8% 1,133,501 7.2% 1,017,105 6.6%
Delta 832,378 5.2% 834,666 5.5% 853,135 5.8% 973,307 6.2% 924,773 6.0%
Frontier 790,154 4.9% 657,572 4.3% 580,452 3.9% 473,972 3.0% 154,956 1.0%
United 554,088 3.4% 554,152 3.6% 529,057 3.6% 549,849 3.5% 520,995 3.4%
Spirit 515,578 3.2% 421,325 2.8% 361,782 2.4% 245,438 1.6% 142,411 0.9%
JetBlue 223,713 1.4% 218,290 1.4% 205,817 1.4% 183,285 1.2% 123,511 0.8%
Alaska 163,207 1.0% 141,157 0.9% 64,154 0.4% 59,076 0.4% 56,514 0.4%
Sun Country 6,934 0.0% - - - - - - - -
AirTran - - - - - - - - 42,858 0.3%
Virgin America - - - - - - - - 26,566 0.2%
Continental - - - - - - - - - -
USA 3000 - - - - - - - - - -
Midwest Airlines - - - - - - - - - -
Northwest - - - - - - - - - -
Subtotal - scheduled major/national 10,791,507 67.1% 10,049,384 65.9% 9,615,779 64.9% 9,720,087 62.0% 8,922,463 58.3%
Scheduled regional/commuter
American Eagle
Piedmont 1,432,000 8.9% 1,172,067 7.7% 918,638 6.2% 694,448 4.4% 708,011 4.6%
Republic 925,678 5.8% 1,063,517 7.0% 864,036 5.8% 1,326,308 8.5% 1,529,350 10.0%
PSA 671,061 4.2% 394,252 2.6% 309,469 2.1% 307,357 2.0% 239,146 1.6%
Envoy 8,147 0.1% 16,635 0.1% - - - - - -
Air Wisconsin - - 453,101 3.0% 1,002,131 6.8% 1,419,663 9.1% 1,508,945 9.9%
Mesa - - - - - - - - 49,094 0.3%
Chautauqua - - - - - - - - - -
Subtotal - American Eagle 3,036,886 18.9% 3,099,572 20.3% 3,094,274 20.9% 3,747,776 23.9% 4,034,546 26.3%
Other 215,374 1.3% 222,087 1.5% 257,068 1.7% 227,752 1.5% 315,442 2.1%
Subtotal - scheduled regional/commuter 3,252,260 20.2% 3,321,659 21.8% 3,351,342 22.6% 3,975,528 25.3% 4,349,988 28.4%
Charter 2,896 0.0% 1,900 0.0% 463 0.0% 85 0.0% 266 0.0%
Total - domestic 14,046,663 87.3% 13,372,943 87.7% 12,967,584 87.6% 13,695,700 87.3% 13,272,717 86.7%
International
Scheduled
American 1,349,623 8.4% 1,228,549 8.1% 1,186,702 8.0% 1,324,804 8.4% 1,424,940 9.3%
Piedmont 161,566 1.0% 73,803 0.5% - - - - - -
Air Canada - Sky Regional / Jazz Aviation 99,909 0.6% 93,978 0.6% 77,018 0.5% 61,797 0.4% 56,038 0.4%
British 97,561 0.6% 88,688 0.6% 118,177 0.8% 128,290 0.8% 120,461 0.8%
Qatar 80,795 0.5% 66,047 0.4% 52,728 0.4% 61,745 0.4% 57,650 0.4%
Lufthansa 78,033 0.5% 71,971 0.5% 73,251 0.5% 69,405 0.4% 70,438 0.5%
Frontier 74,154 0.5% 67,467 0.4% 68,053 0.5% 80,497 0.5% 35,937 0.2%
Aer Lingus 46,969 0.3% 10,951 0.1% - - - - - -
Republic 41,720 0.3% 64,517 0.4% 36,300 0.2% 62,725 0.4% 59,107 0.4%
Icelandair 11,379 0.1% 9,690 0.1% 2,806 0.0% - - - -
Delta 52 0.0% 29,362 0.2% 45,046 0.3% 35,045 0.2% 18,784 0.1%
Air Wisconsin - - 67,128 0.4% 175,336 1.2% 160,730 1.0% 195,937 1.3%
PSA - - 217 0.0% - - - - - -
Air Jamaica / Caribbean - - - - - - - - - -
USA 3000 - - - - - - - - - -
Air France - - - - - - - - - -
Subtotal - scheduled 2,041,761 12.7% 1,872,368 12.3% 1,835,417 12.4% 1,985,038 12.7% 2,039,292 13.3%
Charter - - 142 0.0% 3,881 0.0% 2,820 0.0% 729 0.0%
Total - international 2,041,761 12.7% 1,872,510 12.3% 1,839,298 12.4% 1,987,858 12.7% 2,040,021 13.3%
Grand total 16,088,424 100.0% 15,245,453 100.0% 14,806,882 100.0% 15,683,558 100.0% 15,312,738 100.0%
* Note: Domestic and International Enplanements from 2010 through 2018 were restated.
Source: City of Philadelphia
Airlines
2015201620172019 2018
105
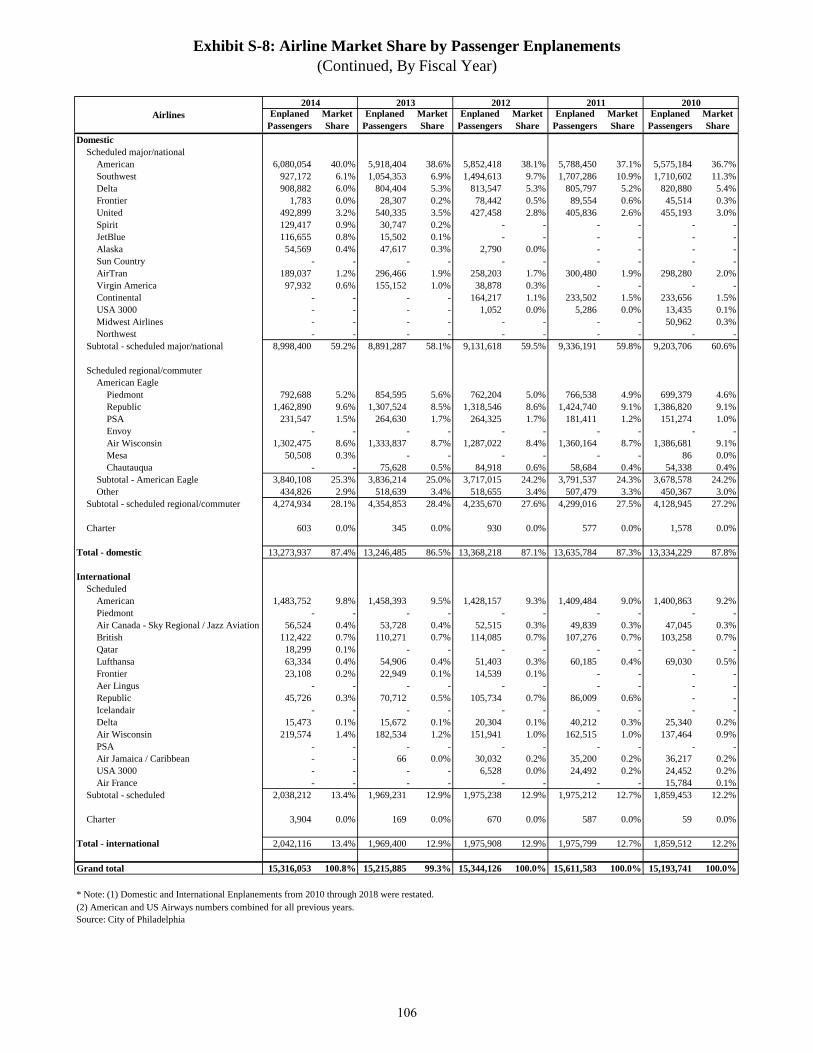
Exhibit S-8: Airline Market Share by Passenger Enplanements
(Continued, By Fiscal Year)
Enplaned
Passengers
Market
Share
Enplaned
Passengers
Market
Share
Enplaned
Passengers
Market
Share
Enplaned
Passengers
Market
Share
Enplaned
Passengers
Market
Share
Domestic
Scheduled major/national
American 6,080,054 40.0% 5,918,404 38.6% 5,852,418 38.1% 5,788,450 37.1% 5,575,184 36.7%
Southwest 927,172 6.1% 1,054,353 6.9% 1,494,613 9.7% 1,707,286 10.9% 1,710,602 11.3%
Delta 908,882 6.0% 804,404 5.3% 813,547 5.3% 805,797 5.2% 820,880 5.4%
Frontier 1,783 0.0% 28,307 0.2% 78,442 0.5% 89,554 0.6% 45,514 0.3%
United 492,899 3.2% 540,335 3.5% 427,458 2.8% 405,836 2.6% 455,193 3.0%
Spirit 129,417 0.9% 30,747 0.2% - - - - - -
JetBlue 116,655 0.8% 15,502 0.1% - - - - - -
Alaska 54,569 0.4% 47,617 0.3% 2,790 0.0% - - - -
Sun Country - - - - - - - - - -
AirTran 189,037 1.2% 296,466 1.9% 258,203 1.7% 300,480 1.9% 298,280 2.0%
Virgin America 97,932 0.6% 155,152 1.0% 38,878 0.3% - - - -
Continental - - - - 164,217 1.1% 233,502 1.5% 233,656 1.5%
USA 3000 - - - - 1,052 0.0% 5,286 0.0% 13,435 0.1%
Midwest Airlines - - - - - - - - 50,962 0.3%
Northwest - - - - - - - - - -
Subtotal - scheduled major/national 8,998,400 59.2% 8,891,287 58.1% 9,131,618 59.5% 9,336,191 59.8% 9,203,706 60.6%
Scheduled regional/commuter
American Eagle
Piedmont 792,688 5.2% 854,595 5.6% 762,204 5.0% 766,538 4.9% 699,379 4.6%
Republic 1,462,890 9.6% 1,307,524 8.5% 1,318,546 8.6% 1,424,740 9.1% 1,386,820 9.1%
PSA 231,547 1.5% 264,630 1.7% 264,325 1.7% 181,411 1.2% 151,274 1.0%
Envoy - - - - - - - - - -
Air Wisconsin 1,302,475 8.6% 1,333,837 8.7% 1,287,022 8.4% 1,360,164 8.7% 1,386,681 9.1%
Mesa 50,508 0.3% - - - - - - 86 0.0%
Chautauqua - - 75,628 0.5% 84,918 0.6% 58,684 0.4% 54,338 0.4%
Subtotal - American Eagle 3,840,108 25.3% 3,836,214 25.0% 3,717,015 24.2% 3,791,537 24.3% 3,678,578 24.2%
Other 434,826 2.9% 518,639 3.4% 518,655 3.4% 507,479 3.3% 450,367 3.0%
Subtotal - scheduled regional/commuter 4,274,934 28.1% 4,354,853 28.4% 4,235,670 27.6% 4,299,016 27.5% 4,128,945 27.2%
Charter 603 0.0% 345 0.0% 930 0.0% 577 0.0% 1,578 0.0%
Total - domestic 13,273,937 87.4% 13,246,485 86.5% 13,368,218 87.1% 13,635,784 87.3% 13,334,229 87.8%
International
Scheduled
American 1,483,752 9.8% 1,458,393 9.5% 1,428,157 9.3% 1,409,484 9.0% 1,400,863 9.2%
Piedmont - - - - - - - - - -
Air Canada - Sky Regional / Jazz Aviation 56,524 0.4% 53,728 0.4% 52,515 0.3% 49,839 0.3% 47,045 0.3%
British 112,422 0.7% 110,271 0.7% 114,085 0.7% 107,276 0.7% 103,258 0.7%
Qatar 18,299 0.1% - - - - - - - -
Lufthansa 63,334 0.4% 54,906 0.4% 51,403 0.3% 60,185 0.4% 69,030 0.5%
Frontier 23,108 0.2% 22,949 0.1% 14,539 0.1% - - - -
Aer Lingus - - - - - - - - - -
Republic 45,726 0.3% 70,712 0.5% 105,734 0.7% 86,009 0.6% - -
Icelandair - - - - - - - - - -
Delta 15,473 0.1% 15,672 0.1% 20,304 0.1% 40,212 0.3% 25,340 0.2%
Air Wisconsin 219,574 1.4% 182,534 1.2% 151,941 1.0% 162,515 1.0% 137,464 0.9%
PSA - - - - - - - - - -
Air Jamaica / Caribbean - - 66 0.0% 30,032 0.2% 35,200 0.2% 36,217 0.2%
USA 3000 - - - - 6,528 0.0% 24,492 0.2% 24,452 0.2%
Air France - - - - - - - - 15,784 0.1%
Subtotal - scheduled 2,038,212 13.4% 1,969,231 12.9% 1,975,238 12.9% 1,975,212 12.7% 1,859,453 12.2%
Charter 3,904 0.0% 169 0.0% 670 0.0% 587 0.0% 59 0.0%
Total - international 2,042,116 13.4% 1,969,400 12.9% 1,975,908 12.9% 1,975,799 12.7% 1,859,512 12.2%
Grand total 15,316,053 100.8% 15,215,885 99.3% 15,344,126 100.0% 15,611,583 100.0% 15,193,741 100.0%
* Note: (1) Domestic and International Enplanements from 2010 through 2018 were restated.
(2) American and US Airways numbers combined for all previous years.
Source: City of Philadelphia
Airlines
2010201120122014 2013
106
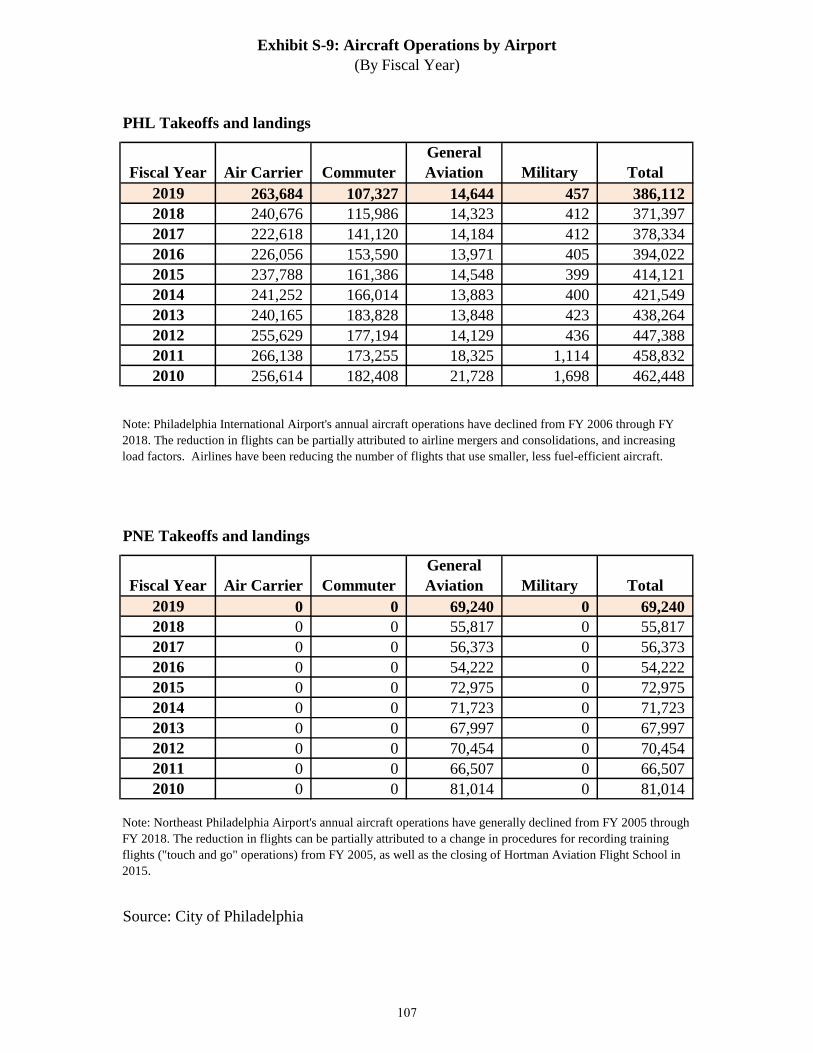
Exhibit S-9: Aircraft Operations by Airport
(By Fiscal Year)
Fiscal Year Air Carrier Commuter
General
Aviation Military Total
2019 263,684 107,327 14,644 457 386,112
2018 240,676 115,986 14,323 412 371,397
2017 222,618 141,120 14,184 412 378,334
2016 226,056 153,590 13,971 405 394,022
2015 237,788 161,386 14,548 399 414,121
2014 241,252 166,014 13,883 400 421,549
2013 240,165 183,828 13,848 423 438,264
2012 255,629 177,194 14,129 436 447,388
2011 266,138 173,255 18,325 1,114 458,832
2010 256,614 182,408 21,728 1,698 462,448
Fiscal Year Air Carrier Commuter
General
Aviation Military Total
2019 0 0 69,240 0 69,240
2018 0 0 55,817 0 55,817
2017 0 0 56,373 0 56,373
2016 0 0 54,222 0 54,222
2015 0 0 72,975 0 72,975
2014 0 0 71,723 0 71,723
2013 0 0 67,997 0 67,997
2012 0 0 70,454 0 70,454
2011 0 0 66,507 0 66,507
2010 0 0 81,014 0 81,014
Source: City of Philadelphia
PHL Takeoffs and landings
PNE Takeoffs and landings
Note: Northeast Philadelphia Airport's annual aircraft operations have generally declined from FY 2005 through
FY 2018. The reduction in flights can be partially attributed to a change in procedures for recording training
flights ("touch and go" operations) from FY 2005, as well as the closing of Hortman Aviation Flight School in
2015.
Note: Philadelphia International Airport's annual aircraft operations have declined from FY 2006 through FY
2018. The reduction in flights can be partially attributed to airline mergers and consolidations, and increasing
load factors. Airlines have been reducing the number of flights that use smaller, less fuel-efficient aircraft.
107

Exhibit S-10: Cargo Tonnage
(By Fiscal Year)
Source: City of Philadelphia
(30.0%)
(20.0%)
(10.0%)
0.0%
10.0%
20.0%
30.0%
40.0%
50.0%
0.0
50,000.0
100,000.0
150,000.0
200,000.0
250,000.0
300,000.0
350,000.0
400,000.0
450,000.0
2010 2011 2012 2013 2014 2015 2016 2017 2018 2019
Ton
s
Domestic Cargo
Mail Freight Total Cargo Mail % Change Freight % Change Total Cargo % Change
(80.0%)
(60.0%)
(40.0%)
(20.0%)
0.0%
20.0%
40.0%
60.0%
80.0%
0.0
20,000.0
40,000.0
60,000.0
80,000.0
100,000.0
120,000.0
140,000.0
160,000.0
180,000.0
2010 2011 2012 2013 2014 2015 2016 2017 2018 2019
Ton
s
International Cargo
Mail Freight Total Cargo Mail % Change Freight % Change Total Cargo % Change
(20.0%)
(10.0%)
0.0%
10.0%
20.0%
30.0%
40.0%
0.0
100,000.0
200,000.0
300,000.0
400,000.0
500,000.0
600,000.0
700,000.0
2010 2011 2012 2013 2014 2015 2016 2017 2018 2019
Ton
s
Total Cargo
Mail Freight Total Cargo Mail % Change Freight % Change Total Cargo % Change
108

Exhibit S-10: Cargo Tonnage by Carrier
(Continued, By Fiscal Year)
2010 2011 2012 2013 2014 2015 2016 2017 2018 2019
10-Year Annual
Growth
Carrier
UPS 259,340 258,382 249,200 225,839 228,810 237,529 251,080 258,615 299,905 360,955 3.36%
FedEx 94,909 94,547 91,748 93,041 91,628 89,925 94,341 95,518 93,789 100,064 0.53%
Other 106,791 120,691 102,934 97,791 104,768 101,421 92,337 94,535 116,736 115,252 0.77%
Total 461,040 473,620 443,882 416,671 425,206 428,875 437,758 448,668 510,430 576,271 2.26%
Source: City of Philadelphia
* Other Airlines include commercial airlines and itinerant passenger & cargo airlines.
0
50,000
100,000
150,000
200,000
250,000
300,000
350,000
400,000
2010 2011 2012 2013 2014 2015 2016 2017 2018 2019
To
ns
Cargo Tonnage by Carrier
UPS FedEx Other
109

Exhibit S-11: Annual Revenues, Expenses And Changes In Fund Net Position
(By Fiscal Year)
Restated *
2019 2018 2017 2016 2015 2014 2013 2012 2011 2010
Operating revenues
Charges for goods and services (1) 120,832,729$ 128,320,912$ 104,531,921$ 110,787,260$ 100,619,746$ 110,782,462$ 88,823,551$ 78,331,485$ 81,161,226$ 74,669,812$
Rentals and concessions (2) 264,946,027 245,881,682 232,887,674 224,999,976 216,190,420 200,192,045 197,912,708 179,202,590 170,667,208 161,375,950
Miscellaneous operating revenues 5,292,986 5,367,810 4,200,936 5,009,010 5,554,490 4,439,768 4,630,590 5,631,463 6,226,427 3,917,583
Total operating revenues 391,071,742 379,570,404 341,620,531 340,796,246 322,364,656 315,414,275 291,366,849 263,165,538 258,054,861 239,963,345
Operating expenses
Personal services 81,052,522 79,223,366 73,776,022 69,283,424 70,424,997 65,636,270 63,190,699 60,503,430 59,258,555 59,674,324
Purchase of services 113,187,323 111,100,076 118,283,429 108,418,709 101,642,118 94,403,544 88,684,536 81,733,892 78,491,464 74,975,124
Materials and supplies 8,202,311 9,805,303 5,156,099 6,944,528 8,669,852 8,927,068 6,557,009 6,728,927 4,458,556 6,234,831
Employee benefits 64,803,539 60,602,579 61,939,679 57,854,677 52,106,797 65,665,321 46,467,020 50,585,661 44,845,414 43,729,908
Indemnities and taxes 5,773,036 1,966,973 5,196,986 1,695,946 1,839,638 1,108,774 1,945,850 1,899,313 2,219,123 1,448,984
Depreciation and amortization 100,679,051 112,033,607 101,109,005 101,909,394 98,125,419 99,707,937 97,873,389 100,592,947 100,894,334 89,011,531
Total operating expenses 373,697,782 374,731,904 365,461,220 346,106,678 332,808,821 335,448,914 304,718,503 302,044,170 290,167,446 275,074,702
Operating income (loss) 17,373,960 4,838,500 (23,840,689) (5,310,432) (10,444,165) (20,034,639) (13,351,654) (38,878,632) (32,112,585) (35,111,357)
Non-operating revenues (expenses)
Federal, state and local grants 1,463,277 1,672,222 2,488,459 1,621,300 1,885,786 2,483,722 1,661,600 2,377,228 4,215,312 3,009,284
Interest income 23,582,264 9,836,271 3,786,077 2,658,109 363,206 1,076,392 632,234 5,654,556 2,235,393 1,694,129
Debt service, interest (57,032,860) (68,195,690) (54,271,038) (54,003,323) (41,428,793) (40,966,678) (40,179,599) (40,069,791) (45,847,778) (53,211,021)
Other revenue (expenses) 2,476,639 3,000,000 - - - - (13,994,139) (407,921) (5,247) (1,787,752)
Loss on disposal of property, net 51,887 (59,048) (122,785) (67,463) (69,113) (75,920) (13,394) - - -
Customer facility charges 31,080,128 30,440,208 30,875,320 31,934,786 29,933,177 4,857,600 - - - -
Passenger facility charges 64,031,965 61,067,558 59,384,648 60,920,335 61,180,724 60,653,369 58,188,449 59,741,500 62,042,429 61,277,506
Total non-operating revenues (expenses) 65,653,300 37,761,521 42,140,681 43,063,744 51,864,987 28,028,485 6,295,151 27,295,572 22,640,109 10,982,146
Gain (Loss) before capital contributions 83,027,260 42,600,021 18,299,992 37,753,312 41,420,822 7,993,846 (7,056,503) (11,583,060) (9,472,476) (24,129,211)
Capital contributions
Federal, state and local grants 22,238,626 19,583,401 9,566,140 24,203,573 35,549,920 20,046,410 39,691,462 29,242,258 39,639,059 29,298,943
Total capital contributions 22,238,626 19,583,401 9,566,140 24,203,573 35,549,920 20,046,410 39,691,462 29,242,258 39,639,059 29,298,943
Increase (decrease) in net position 105,265,886$ 62,183,422$ 27,866,132$ 61,956,885$ 76,970,742$ 28,040,256$ 32,634,959$ 17,659,198$ 30,166,583$ 5,169,732$
Net position beginning of period 888,277,282 894,083,996 866,217,864 804,260,979 894,969,059 866,928,803 #REF! #REF! #REF! #REF!
Adjustment - (67,990,136) - - (167,678,822) - - (18,639,280) - 2,126,644
Net position end of period 993,543,168$ 888,277,282$ 894,083,996$ 866,217,864$ 804,260,979$ 894,969,059$ #REF! #REF! #REF! #REF!
* Related to the adoption of GASB 65
Source: City of Philadelphia, Financial Statements
(1) Charges for goods and services are comprised of airline revenues, specifically landing fees and international arrival fees, and non-airline revenues, specifically utilities and other fees.
(2) Rental and concessions are comprised of airline revenues, specifically rents, and non-airline revenues, specifically concessions, and other rents.
110

Exhibit S-12: Operating Revenues by Source
(By Fiscal Year)
2019 2018 2017 2016 2015 2014 2013 2012 2011 2010
10-Year Annual
Growth
Airline revenue
Rents 112,437,578$ 122,195,881$ 111,099,652$ 107,504,766$ 115,637,922$ 98,895,068$ 102,444,565$ 84,597,375$ 73,285,708$ 75,349,769$ 4.08%
Landing fees 81,040,660 88,769,632 67,710,165 71,796,365 68,868,068 80,068,379 63,876,786 57,390,056 62,137,487 49,194,575 5.12%
Passenger fees 37,249,170 36,228,901 32,017,978 33,927,721 26,573,596 24,873,375 20,041,927 16,202,394 17,565,552 19,496,578 6.69%
Total airline revenue 230,727,408 247,194,414 210,827,795 213,228,852 211,079,586 203,836,822 186,363,278 158,189,825 152,988,747 144,040,922 4.82%
Non-airline revenue
Parking 37,151,976 33,620,940 33,892,719 29,968,056 29,090,299 25,000,777 24,147,808 25,035,368 28,008,554 23,732,623 4.58%
Food/beverage/retail 38,725,616 33,082,150 31,458,225 35,971,023 23,802,476 27,241,432 23,651,437 25,902,344 22,817,909 20,340,857 6.65%
Other rents 34,128,018 19,456,269 20,309,076 19,279,017 17,990,122 17,972,046 18,475,294 17,437,758 15,083,071 17,567,940 6.87%
Rental car 19,821,992 19,088,359 19,057,032 18,925,037 17,972,921 19,129,901 19,353,044 18,374,270 17,977,440 17,200,502 1.43%
Ground transportation 9,905,712 7,759,709 5,589,833 2,539,609 2,069,814 1,777,269 1,627,271 1,512,007 1,489,869 1,520,697 20.61%
Advertising 4,031,350 4,165,545 4,113,665 3,948,970 2,814,100 2,700,000 2,700,000 2,325,320 2,568,692 2,630,091 4.36%
Utilities 2,542,899 2,862,116 2,872,521 3,207,446 3,548,830 4,300,906 3,733,830 3,889,574 4,070,184 3,936,503 (4.28%)
Hotel 2,174,191 2,131,110 2,095,984 2,036,604 1,972,306 1,881,380 1,707,073 1,800,406 1,732,421 1,683,722 2.59%
Other 11,862,580 10,209,792 11,403,680 11,691,632 12,024,202 11,573,742 9,607,814 8,698,666 11,317,974 7,309,488 4.96%
Total non-airline revenue 160,344,334 132,375,990 130,792,736 127,567,394 111,285,070 111,577,453 105,003,571 104,975,713 105,066,114 95,922,423 5.27%
Total operating revenues 391,071,742$ 379,570,404$ 341,620,531$ 340,796,246$ 322,364,656$ 315,414,275$ 291,366,849$ 263,165,538$ 258,054,861$ 239,963,345$ 5.01%
Source: City of Philadelphia
2019 Revenues by Source
Rents
29%
Landing fees
21%
Passenger fees
9%
Parking
9%
Food/beverage/retail
10%
Other rents
9%
Rental car
5%
Ground transportation
2%
Advertising
1% Utilities
1%
Hotel
1% Other
3%
111

Exhibit S-12: Operating Revenues by Source
(Continued, By Fiscal Year)
Source: City of Philadelphia
$10.M
$30.M
$50.M
$70.M
$90.M
$110.M
$130.M
2010 2011 2012 2013 2014 2015 2016 2017 2018 2019
Airline Revenue by Type
Rents
Landing fees
Passenger fees
$90.M
$110.M
$130.M
$150.M
$170.M
$190.M
$210.M
$230.M
$250.M
2010 2011 2012 2013 2014 2015 2016 2017 2018 2019
Airline & Non-Airline Revenue
Total airline revenue
Total non-airline revenue
$1.M
$6.M
$11.M
$16.M
$21.M
$26.M
$31.M
$36.M
2010 2011 2012 2013 2014 2015 2016 2017 2018 2019
Non-Airline Revenue by Type
Parking
Food/beverage/retail
Other rents
Rental car
Ground transportation
Advertising
Utilities
Hotel
Other
112

Exhibit S-12: Revenues by Source
(Continued, by Fiscal Year)
Source: City of Philadelphia
$6.31
$6.73 $6.84 $6.90
$7.29 $7.27
$8.13
$8.83 $8.68
$9.97
$-
$1.00
$2.00
$3.00
$4.00
$5.00
$6.00
$7.00
$8.00
$9.00
$10.00
2010 2011 2012 2013 2014 2015 2016 2017 2018 2019
Non-Airline Revenue per Enplaned Passenger
$1.34
$1.46
$1.69
$1.55
$1.78
$1.55
$2.29
$2.12 $2.17
$2.41
$-
$0.50
$1.00
$1.50
$2.00
$2.50
$3.00
2010 2011 2012 2013 2014 2015 2016 2017 2018 2019
Food/Beverage/Retail Revenue per Enplaned Passenger
$1.13 $1.15
$1.20
$1.28 $1.26
$1.18 $1.21
$1.28 $1.25 $1.23
$-
$0.20
$0.40
$0.60
$0.80
$1.00
$1.20
$1.40
2010 2011 2012 2013 2014 2015 2016 2017 2018 2019
Rental Car Revenue per Deplaned Passenger
113
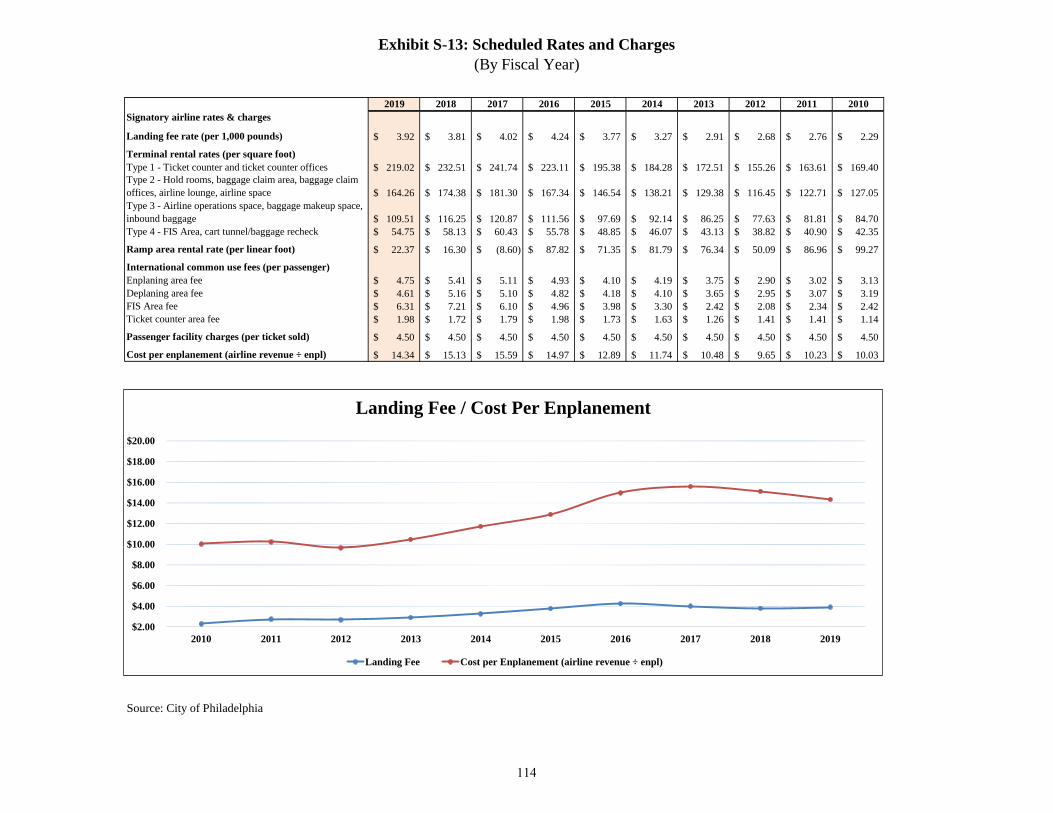
Exhibit S-13: Scheduled Rates and Charges
(By Fiscal Year)
2019 2018 2017 2016 2015 2014 2013 2012 2011 2010
Signatory airline rates & charges
Landing fee rate (per 1,000 pounds) 3.92$ 3.81$ 4.02$ 4.24$ 3.77$ 3.27$ 2.91$ 2.68$ 2.76$ 2.29$
Terminal rental rates (per square foot)
Type 1 - Ticket counter and ticket counter offices 219.02$ 232.51$ 241.74$ 223.11$ 195.38$ 184.28$ 172.51$ 155.26$ 163.61$ 169.40$
Type 2 - Hold rooms, baggage claim area, baggage claim
offices, airline lounge, airline space 164.26$ 174.38$ 181.30$ 167.34$ 146.54$ 138.21$ 129.38$ 116.45$ 122.71$ 127.05$
Type 3 - Airline operations space, baggage makeup space,
inbound baggage 109.51$ 116.25$ 120.87$ 111.56$ 97.69$ 92.14$ 86.25$ 77.63$ 81.81$ 84.70$
Type 4 - FIS Area, cart tunnel/baggage recheck 54.75$ 58.13$ 60.43$ 55.78$ 48.85$ 46.07$ 43.13$ 38.82$ 40.90$ 42.35$
Ramp area rental rate (per linear foot) 22.37$ 16.30$ (8.60)$ 87.82$ 71.35$ 81.79$ 76.34$ 50.09$ 86.96$ 99.27$
International common use fees (per passenger)
Enplaning area fee 4.75$ 5.41$ 5.11$ 4.93$ 4.10$ 4.19$ 3.75$ 2.90$ 3.02$ 3.13$
Deplaning area fee 4.61$ 5.16$ 5.10$ 4.82$ 4.18$ 4.10$ 3.65$ 2.95$ 3.07$ 3.19$
FIS Area fee 6.31$ 7.21$ 6.10$ 4.96$ 3.98$ 3.30$ 2.42$ 2.08$ 2.34$ 2.42$
Ticket counter area fee 1.98$ 1.72$ 1.79$ 1.98$ 1.73$ 1.63$ 1.26$ 1.41$ 1.41$ 1.14$
Passenger facility charges (per ticket sold) 4.50$ 4.50$ 4.50$ 4.50$ 4.50$ 4.50$ 4.50$ 4.50$ 4.50$ 4.50$
Cost per enplanement (airline revenue ÷ enpl) 14.34$ 15.13$ 15.59$ 14.97$ 12.89$ 11.74$ 10.48$ 9.65$ 10.23$ 10.03$
Source: City of Philadelphia
$2.00
$4.00
$6.00
$8.00
$10.00
$12.00
$14.00
$16.00
$18.00
$20.00
2010 2011 2012 2013 2014 2015 2016 2017 2018 2019
Landing Fee / Cost Per Enplanement
Landing Fee Cost per Enplanement (airline revenue ÷ enpl)
114
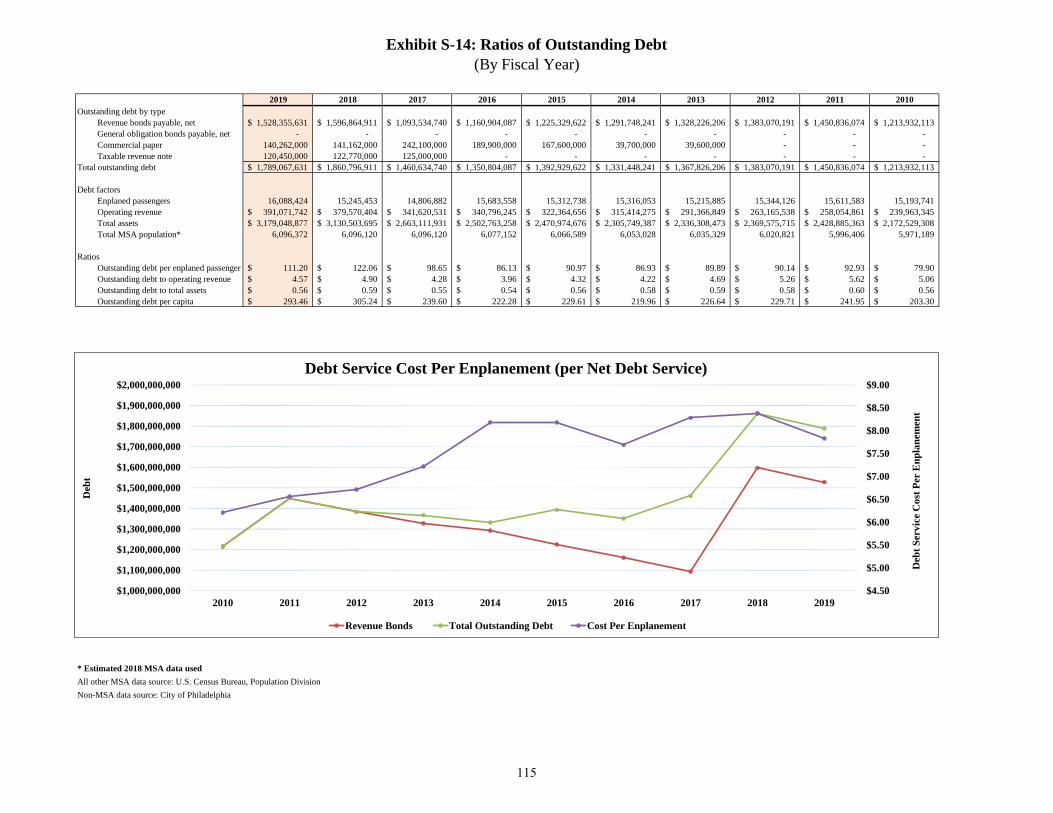
Exhibit S-14: Ratios of Outstanding Debt
(By Fiscal Year)
2019 2018 2017 2016 2015 2014 2013 2012 2011 2010
Outstanding debt by type
Revenue bonds payable, net 1,528,355,631$ 1,596,864,911$ 1,093,534,740$ 1,160,904,087$ 1,225,329,622$ 1,291,748,241$ 1,328,226,206$ 1,383,070,191$ 1,450,836,074$ 1,213,932,113$
General obligation bonds payable, net - - - - - - - - - -
Commercial paper 140,262,000 141,162,000 242,100,000 189,900,000 167,600,000 39,700,000 39,600,000 - - -
Taxable revenue note 120,450,000 122,770,000 125,000,000 - - - - - - -
Total outstanding debt 1,789,067,631$ 1,860,796,911$ 1,460,634,740$ 1,350,804,087$ 1,392,929,622$ 1,331,448,241$ 1,367,826,206$ 1,383,070,191$ 1,450,836,074$ 1,213,932,113$
Debt factors
Enplaned passengers 16,088,424 15,245,453 14,806,882 15,683,558 15,312,738 15,316,053 15,215,885 15,344,126 15,611,583 15,193,741
Operating revenue 391,071,742$ 379,570,404$ 341,620,531$ 340,796,245$ 322,364,656$ 315,414,275$ 291,366,849$ 263,165,538$ 258,054,861$ 239,963,345$
Total assets 3,179,048,877$ 3,130,503,695$ 2,663,111,931$ 2,502,763,258$ 2,470,974,676$ 2,305,749,387$ 2,336,308,473$ 2,369,575,715$ 2,428,885,363$ 2,172,529,308$
Total MSA population* 6,096,372 6,096,120 6,096,120 6,077,152 6,066,589 6,053,028 6,035,329 6,020,821 5,996,406 5,971,189
Ratios
Outstanding debt per enplaned passenger 111.20$ 122.06$ 98.65$ 86.13$ 90.97$ 86.93$ 89.89$ 90.14$ 92.93$ 79.90$
Outstanding debt to operating revenue 4.57$ 4.90$ 4.28$ 3.96$ 4.32$ 4.22$ 4.69$ 5.26$ 5.62$ 5.06$
Outstanding debt to total assets 0.56$ 0.59$ 0.55$ 0.54$ 0.56$ 0.58$ 0.59$ 0.58$ 0.60$ 0.56$
Outstanding debt per capita 293.46$ 305.24$ 239.60$ 222.28$ 229.61$ 219.96$ 226.64$ 229.71$ 241.95$ 203.30$
Non-MSA data source: City of Philadelphia
* Estimated 2018 MSA data used
All other MSA data source: U.S. Census Bureau, Population Division
$4.50
$5.00
$5.50
$6.00
$6.50
$7.00
$7.50
$8.00
$8.50
$9.00
$1,000,000,000
$1,100,000,000
$1,200,000,000
$1,300,000,000
$1,400,000,000
$1,500,000,000
$1,600,000,000
$1,700,000,000
$1,800,000,000
$1,900,000,000
$2,000,000,000
2010 2011 2012 2013 2014 2015 2016 2017 2018 2019
Deb
t S
erv
ice
Co
st P
er E
np
lan
emen
t
Deb
t
Debt Service Cost Per Enplanement (per Net Debt Service)
Revenue Bonds Total Outstanding Debt Cost Per Enplanement
115
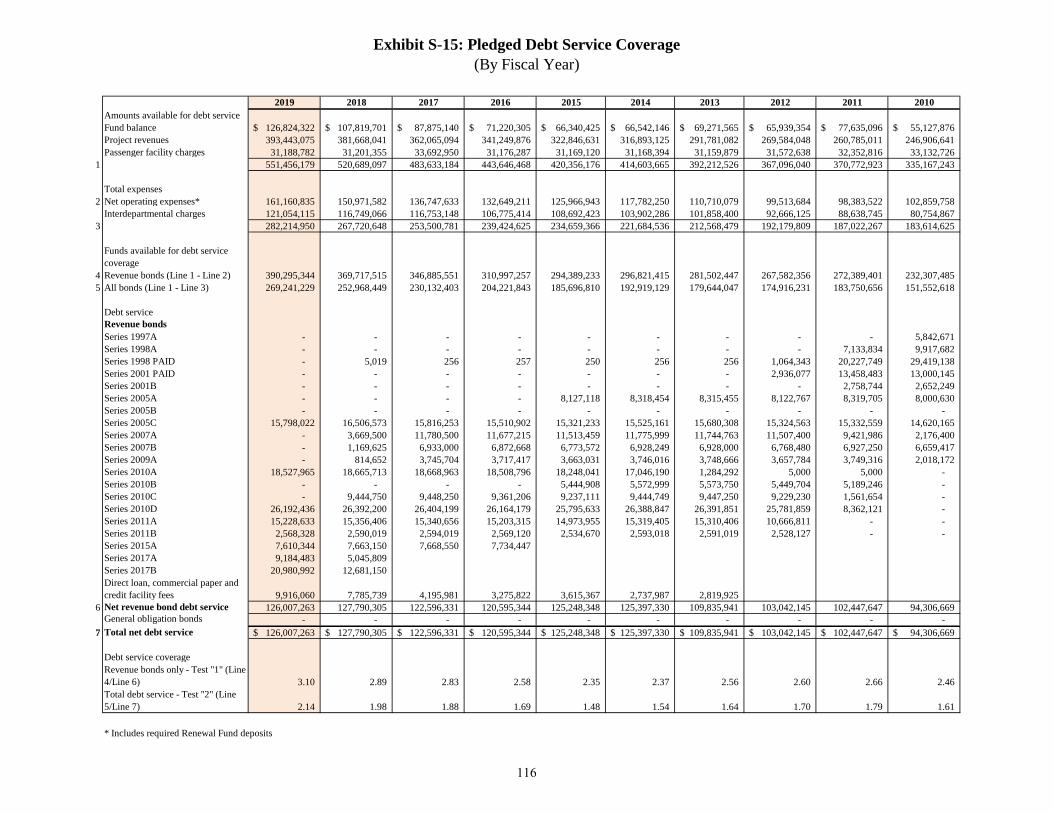
Exhibit S-15: Pledged Debt Service Coverage
(By Fiscal Year)
2019 2018 2017 2016 2015 2014 2013 2012 2011 2010
Amounts available for debt service
Fund balance 126,824,322$ 107,819,701$ 87,875,140$ 71,220,305$ 66,340,425$ 66,542,146$ 69,271,565$ 65,939,354$ 77,635,096$ 55,127,876$
Project revenues 393,443,075 381,668,041 362,065,094 341,249,876 322,846,631 316,893,125 291,781,082 269,584,048 260,785,011 246,906,641
Passenger facility charges 31,188,782 31,201,355 33,692,950 31,176,287 31,169,120 31,168,394 31,159,879 31,572,638 32,352,816 33,132,726
1 551,456,179 520,689,097 483,633,184 443,646,468 420,356,176 414,603,665 392,212,526 367,096,040 370,772,923 335,167,243
Total expenses
2 Net operating expenses* 161,160,835 150,971,582 136,747,633 132,649,211 125,966,943 117,782,250 110,710,079 99,513,684 98,383,522 102,859,758
Interdepartmental charges 121,054,115 116,749,066 116,753,148 106,775,414 108,692,423 103,902,286 101,858,400 92,666,125 88,638,745 80,754,867
3 282,214,950 267,720,648 253,500,781 239,424,625 234,659,366 221,684,536 212,568,479 192,179,809 187,022,267 183,614,625
Funds available for debt service
coverage
4 Revenue bonds (Line 1 - Line 2) 390,295,344 369,717,515 346,885,551 310,997,257 294,389,233 296,821,415 281,502,447 267,582,356 272,389,401 232,307,485
5 All bonds (Line 1 - Line 3) 269,241,229 252,968,449 230,132,403 204,221,843 185,696,810 192,919,129 179,644,047 174,916,231 183,750,656 151,552,618
Debt service
Revenue bonds
Series 1997A - - - - - - - - - 5,842,671
Series 1998A - - - - - - - - 7,133,834 9,917,682
Series 1998 PAID - 5,019 256 257 250 256 256 1,064,343 20,227,749 29,419,138
Series 2001 PAID - - - - - - - 2,936,077 13,458,483 13,000,145
Series 2001B - - - - - - - - 2,758,744 2,652,249
Series 2005A - - - - 8,127,118 8,318,454 8,315,455 8,122,767 8,319,705 8,000,630
Series 2005B - - - - - - - - - -
Series 2005C 15,798,022 16,506,573 15,816,253 15,510,902 15,321,233 15,525,161 15,680,308 15,324,563 15,332,559 14,620,165
Series 2007A - 3,669,500 11,780,500 11,677,215 11,513,459 11,775,999 11,744,763 11,507,400 9,421,986 2,176,400
Series 2007B - 1,169,625 6,933,000 6,872,668 6,773,572 6,928,249 6,928,000 6,768,480 6,927,250 6,659,417
Series 2009A - 814,652 3,745,704 3,717,417 3,663,031 3,746,016 3,748,666 3,657,784 3,749,316 2,018,172
Series 2010A 18,527,965 18,665,713 18,668,963 18,508,796 18,248,041 17,046,190 1,284,292 5,000 5,000 -
Series 2010B - - - - 5,444,908 5,572,999 5,573,750 5,449,704 5,189,246 -
Series 2010C - 9,444,750 9,448,250 9,361,206 9,237,111 9,444,749 9,447,250 9,229,230 1,561,654 -
Series 2010D 26,192,436 26,392,200 26,404,199 26,164,179 25,795,633 26,388,847 26,391,851 25,781,859 8,362,121 -
Series 2011A 15,228,633 15,356,406 15,340,656 15,203,315 14,973,955 15,319,405 15,310,406 10,666,811 - -
Series 2011B 2,568,328 2,590,019 2,594,019 2,569,120 2,534,670 2,593,018 2,591,019 2,528,127 - -
Series 2015A 7,610,344 7,663,150 7,668,550 7,734,447
Series 2017A 9,184,483 5,045,809
Series 2017B 20,980,992 12,681,150
Direct loan, commercial paper and
credit facility fees 9,916,060 7,785,739 4,195,981 3,275,822 3,615,367 2,737,987 2,819,925
6 Net revenue bond debt service 126,007,263 127,790,305 122,596,331 120,595,344 125,248,348 125,397,330 109,835,941 103,042,145 102,447,647 94,306,669
General obligation bonds - - - - - - - - - -
7 Total net debt service 126,007,263$ 127,790,305$ 122,596,331$ 120,595,344$ 125,248,348$ 125,397,330$ 109,835,941$ 103,042,145$ 102,447,647$ 94,306,669$
Debt service coverage
Revenue bonds only - Test "1" (Line
4/Line 6) 3.10 2.89 2.83 2.58 2.35 2.37 2.56 2.60 2.66 2.46
Total debt service - Test "2" (Line
5/Line 7) 2.14 1.98 1.88 1.69 1.48 1.54 1.64 1.70 1.79 1.61
* Includes required Renewal Fund deposits
116
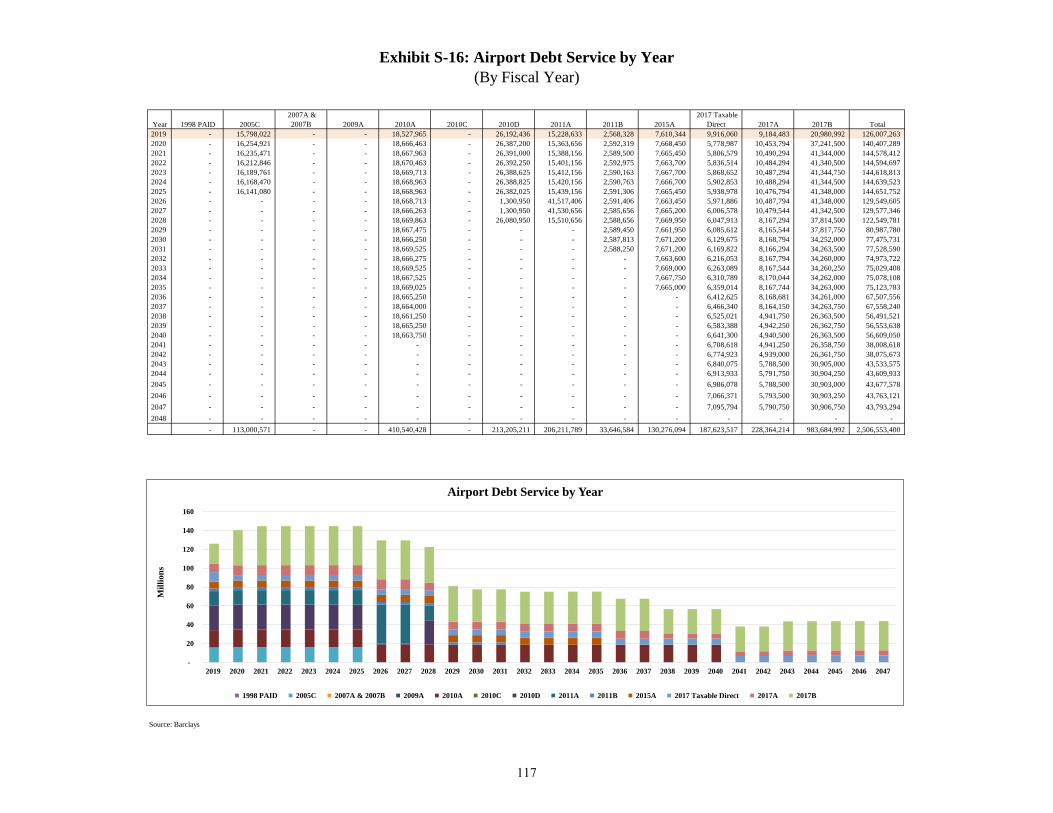
Exhibit S-16: Airport Debt Service by Year
(By Fiscal Year)
Year 1998 PAID 2005C
2007A &
2007B 2009A 2010A 2010C 2010D 2011A 2011B 2015A
2017 Taxable
Direct 2017A 2017B Total
2019 - 15,798,022 - - 18,527,965 - 26,192,436 15,228,633 2,568,328 7,610,344 9,916,060 9,184,483 20,980,992 126,007,263
2020 - 16,254,921 - - 18,666,463 - 26,387,200 15,363,656 2,592,319 7,668,450 5,778,987 10,453,794 37,241,500 140,407,289
2021 - 16,235,471 - - 18,667,963 - 26,391,000 15,388,156 2,589,500 7,665,450 5,806,579 10,490,294 41,344,000 144,578,412
2022 - 16,212,846 - - 18,670,463 - 26,392,250 15,401,156 2,592,975 7,663,700 5,836,514 10,484,294 41,340,500 144,594,697
2023 - 16,189,761 - - 18,669,713 - 26,388,625 15,412,156 2,590,163 7,667,700 5,868,652 10,487,294 41,344,750 144,618,813
2024 - 16,168,470 - - 18,668,963 - 26,388,825 15,420,156 2,590,763 7,666,700 5,902,853 10,488,294 41,344,500 144,639,523
2025 - 16,141,080 - - 18,668,963 - 26,382,025 15,439,156 2,591,306 7,665,450 5,938,978 10,476,794 41,348,000 144,651,752
2026 - - - - 18,668,713 - 1,300,950 41,517,406 2,591,406 7,663,450 5,971,886 10,487,794 41,348,000 129,549,605
2027 - - - - 18,666,263 - 1,300,950 41,530,656 2,585,656 7,665,200 6,006,578 10,479,544 41,342,500 129,577,346
2028 - - - - 18,669,863 - 26,080,950 15,510,656 2,588,656 7,669,950 6,047,913 8,167,294 37,814,500 122,549,781
2029 - - - - 18,667,475 - - - 2,589,450 7,661,950 6,085,612 8,165,544 37,817,750 80,987,780
2030 - - - - 18,666,250 - - - 2,587,813 7,671,200 6,129,675 8,168,794 34,252,000 77,475,731
2031 - - - - 18,669,525 - - - 2,588,250 7,671,200 6,169,822 8,166,294 34,263,500 77,528,590
2032 - - - - 18,666,275 - - - - 7,663,600 6,216,053 8,167,794 34,260,000 74,973,722
2033 - - - - 18,669,525 - - - - 7,669,000 6,263,089 8,167,544 34,260,250 75,029,408
2034 - - - - 18,667,525 - - - - 7,667,750 6,310,789 8,170,044 34,262,000 75,078,108
2035 - - - - 18,669,025 - - - - 7,665,000 6,359,014 8,167,744 34,263,000 75,123,783
2036 - - - - 18,665,250 - - - - - 6,412,625 8,168,681 34,261,000 67,507,556
2037 - - - - 18,664,000 - - - - - 6,466,340 8,164,150 34,263,750 67,558,240
2038 - - - - 18,661,250 - - - - - 6,525,021 4,941,750 26,363,500 56,491,521
2039 - - - - 18,665,250 - - - - - 6,583,388 4,942,250 26,362,750 56,553,638
2040 - - - - 18,663,750 - - - - - 6,641,300 4,940,500 26,363,500 56,609,050
2041 - - - - - - - - - - 6,708,618 4,941,250 26,358,750 38,008,618
2042 - - - - - - - - - - 6,774,923 4,939,000 26,361,750 38,075,673
2043 - - - - - - - - - - 6,840,075 5,788,500 30,905,000 43,533,575
2044 - - - - - - - - - - 6,913,933 5,791,750 30,904,250 43,609,933
2045 - - - - - - - - - - 6,986,078 5,788,500 30,903,000 43,677,578
2046 - - - - - - - - - - 7,066,371 5,793,500 30,903,250 43,763,121
2047 - - - - - - - - - - 7,095,794 5,790,750 30,906,750 43,793,294
2048 - - - - - - - - - - - - - -
- 113,000,571 - - 410,540,428 - 213,205,211 206,211,789 33,646,584 130,276,094 187,623,517 228,364,214 983,684,992 2,506,553,400
Source: Barclays
-
20
40
60
80
100
120
140
160
2019 2020 2021 2022 2023 2024 2025 2026 2027 2028 2029 2030 2031 2032 2033 2034 2035 2036 2037 2038 2039 2040 2041 2042 2043 2044 2045 2046 2047
Mil
lio
ns
Airport Debt Service by Year
1998 PAID 2005C 2007A & 2007B 2009A 2010A 2010C 2010D 2011A 2011B 2015A 2017 Taxable Direct 2017A 2017B
117
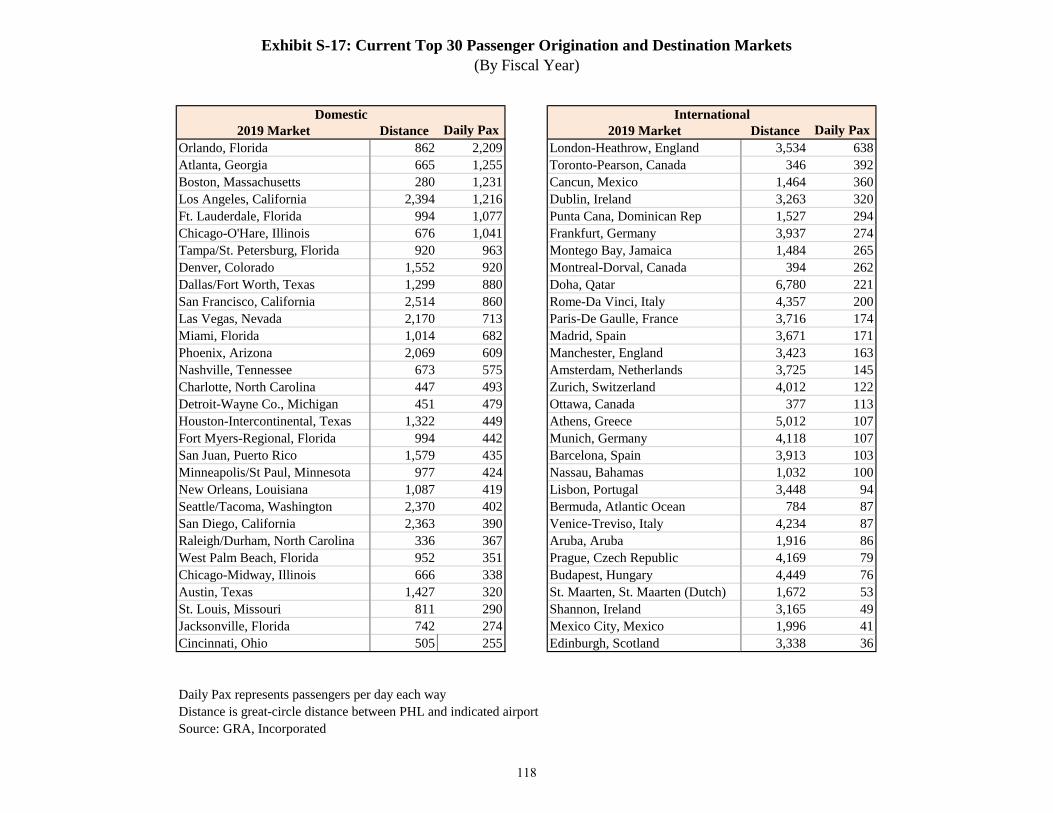
Exhibit S-17: Current Top 30 Passenger Origination and Destination Markets
(By Fiscal Year)
2019 Market Distance Daily Pax 2019 Market Distance Daily Pax
Orlando, Florida 862 2,209 London-Heathrow, England 3,534 638
Atlanta, Georgia 665 1,255 Toronto-Pearson, Canada 346 392
Boston, Massachusetts 280 1,231 Cancun, Mexico 1,464 360
Los Angeles, California 2,394 1,216 Dublin, Ireland 3,263 320
Ft. Lauderdale, Florida 994 1,077 Punta Cana, Dominican Rep 1,527 294
Chicago-O'Hare, Illinois 676 1,041 Frankfurt, Germany 3,937 274
Tampa/St. Petersburg, Florida 920 963 Montego Bay, Jamaica 1,484 265
Denver, Colorado 1,552 920 Montreal-Dorval, Canada 394 262
Dallas/Fort Worth, Texas 1,299 880 Doha, Qatar 6,780 221
San Francisco, California 2,514 860 Rome-Da Vinci, Italy 4,357 200
Las Vegas, Nevada 2,170 713 Paris-De Gaulle, France 3,716 174
Miami, Florida 1,014 682 Madrid, Spain 3,671 171
Phoenix, Arizona 2,069 609 Manchester, England 3,423 163
Nashville, Tennessee 673 575 Amsterdam, Netherlands 3,725 145
Charlotte, North Carolina 447 493 Zurich, Switzerland 4,012 122
Detroit-Wayne Co., Michigan 451 479 Ottawa, Canada 377 113
Houston-Intercontinental, Texas 1,322 449 Athens, Greece 5,012 107
Fort Myers-Regional, Florida 994 442 Munich, Germany 4,118 107
San Juan, Puerto Rico 1,579 435 Barcelona, Spain 3,913 103
Minneapolis/St Paul, Minnesota 977 424 Nassau, Bahamas 1,032 100
New Orleans, Louisiana 1,087 419 Lisbon, Portugal 3,448 94
Seattle/Tacoma, Washington 2,370 402 Bermuda, Atlantic Ocean 784 87
San Diego, California 2,363 390 Venice-Treviso, Italy 4,234 87
Raleigh/Durham, North Carolina 336 367 Aruba, Aruba 1,916 86
West Palm Beach, Florida 952 351 Prague, Czech Republic 4,169 79
Chicago-Midway, Illinois 666 338 Budapest, Hungary 4,449 76
Austin, Texas 1,427 320 St. Maarten, St. Maarten (Dutch) 1,672 53
St. Louis, Missouri 811 290 Shannon, Ireland 3,165 49
Jacksonville, Florida 742 274 Mexico City, Mexico 1,996 41
Cincinnati, Ohio 505 255 Edinburgh, Scotland 3,338 36
Daily Pax represents passengers per day each way
Distance is great-circle distance between PHL and indicated airport
Source: GRA, Incorporated
Domestic International
118
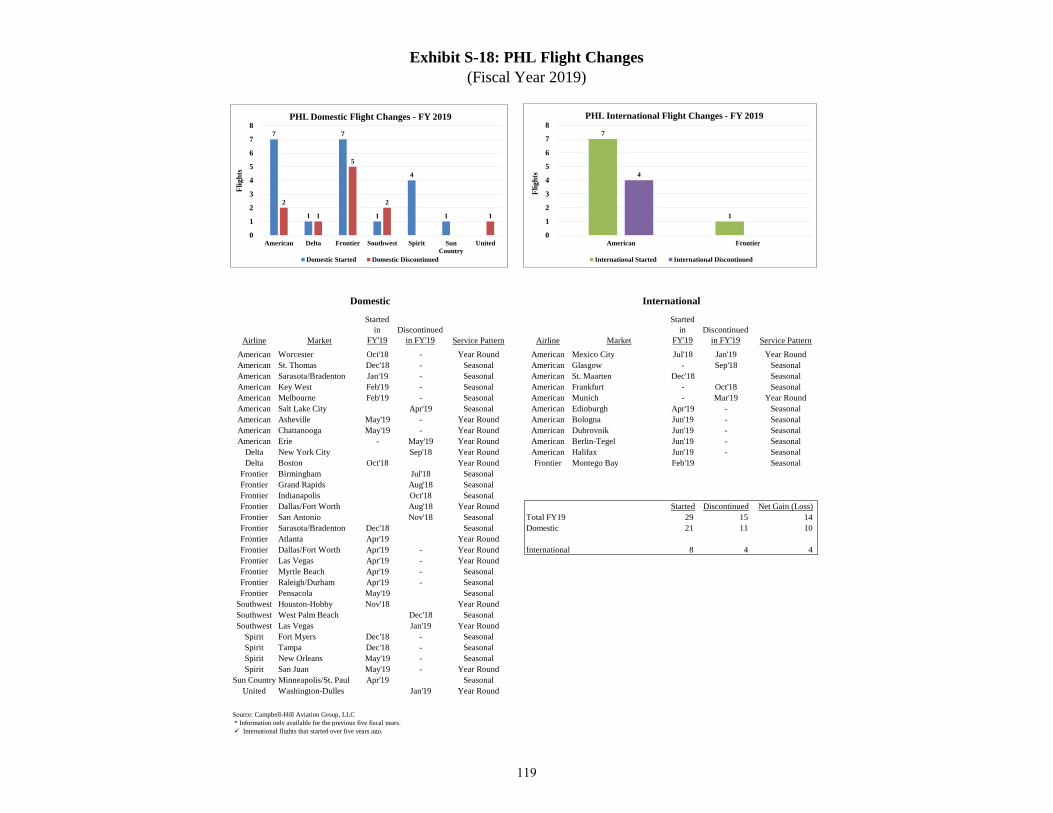
Exhibit S-18: PHL Flight Changes
(Fiscal Year 2019)
Airline Market
Started
in
FY'19
Discontinued
in FY'19 Service Pattern Airline Market
Started
in
FY'19
Discontinued
in FY'19 Service Pattern
American Worcester Oct'18 - Year Round American Mexico City Jul'18 Jan'19 Year Round
American St. Thomas Dec'18 - Seasonal American Glasgow - Sep'18 Seasonal
American Sarasota/Bradenton Jan'19 - Seasonal American St. Maarten Dec'18 Seasonal
American Key West Feb'19 - Seasonal American Frankfurt - Oct'18 Seasonal
American Melbourne Feb'19 - Seasonal American Munich - Mar'19 Year Round
American Salt Lake City Apr'19 Seasonal American Edinburgh Apr'19 - Seasonal
American Asheville May'19 - Year Round American Bologna Jun'19 - Seasonal
American Chattanooga May'19 - Year Round American Dubrovnik Jun'19 - Seasonal
American Erie - May'19 Year Round American Berlin-Tegel Jun'19 - Seasonal
Delta New York City Sep'18 Year Round American Halifax Jun'19 - Seasonal
Delta Boston Oct'18 Year Round Frontier Montego Bay Feb'19 Seasonal
Frontier Birmingham Jul'18 Seasonal
Frontier Grand Rapids Aug'18 Seasonal
Frontier Indianapolis Oct'18 Seasonal
Frontier Dallas/Fort Worth Aug'18 Year Round Started Discontinued Net Gain (Loss)
Frontier San Antonio Nov'18 Seasonal Total FY19 29 15 14
Frontier Sarasota/Bradenton Dec'18 Seasonal Domestic 21 11 10
Frontier Atlanta Apr'19 Year Round
Frontier Dallas/Fort Worth Apr'19 - Year Round International 8 4 4
Frontier Las Vegas Apr'19 - Year Round
Frontier Myrtle Beach Apr'19 - Seasonal
Frontier Raleigh/Durham Apr'19 - Seasonal
Frontier Pensacola May'19 Seasonal
Southwest Houston-Hobby Nov'18 Year Round
Southwest West Palm Beach Dec'18 Seasonal
Southwest Las Vegas Jan'19 Year Round
Spirit Fort Myers Dec'18 - Seasonal
Spirit Tampa Dec'18 - Seasonal
Spirit New Orleans May'19 - Seasonal
Spirit San Juan May'19 - Year Round
Sun Country Minneapolis/St. Paul Apr'19 Seasonal
United Washington-Dulles Jan'19 Year Round
Source: Campbell-Hill Aviation Group, LLC
* Information only available for the previous five fiscal years.
✓ International flights that started over five years ago.
Domestic International
7
1
7
1
4
1
2
1
5
2
1
0
1
2
3
4
5
6
7
8
American Delta Frontier Southwest Spirit Sun
Country
UnitedF
lig
hts
PHL Domestic Flight Changes - FY 2019
Domestic Started Domestic Discontinued
7
1
4
0
1
2
3
4
5
6
7
8
American Frontier
Fli
gh
ts
PHL International Flight Changes - FY 2019
International Started International Discontinued
119
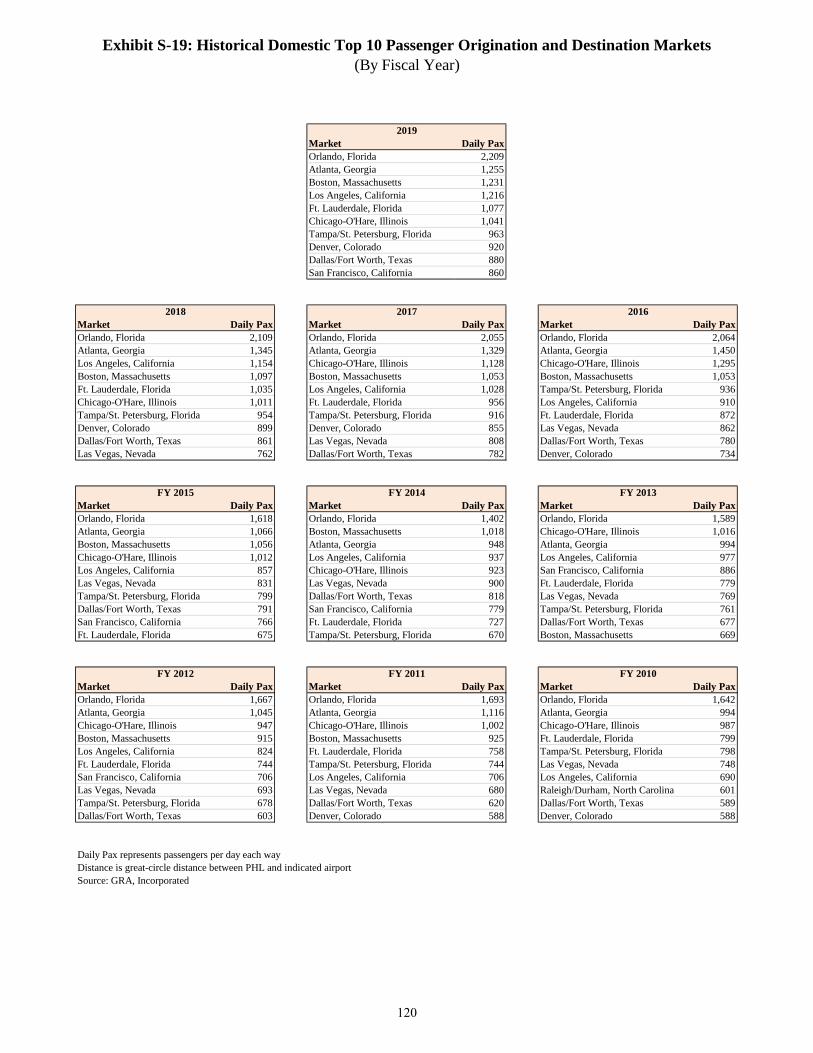
Exhibit S-19: Historical Domestic Top 10 Passenger Origination and Destination Markets
(By Fiscal Year)
Market Daily Pax
Orlando, Florida 2,209
Atlanta, Georgia 1,255
Boston, Massachusetts 1,231
Los Angeles, California 1,216
Ft. Lauderdale, Florida 1,077
Chicago-O'Hare, Illinois 1,041
Tampa/St. Petersburg, Florida 963
Denver, Colorado 920
Dallas/Fort Worth, Texas 880
San Francisco, California 860
Market Daily Pax Market Daily Pax Market Daily Pax
Orlando, Florida 2,109 Orlando, Florida 2,055 Orlando, Florida 2,064
Atlanta, Georgia 1,345 Atlanta, Georgia 1,329 Atlanta, Georgia 1,450
Los Angeles, California 1,154 Chicago-O'Hare, Illinois 1,128 Chicago-O'Hare, Illinois 1,295
Boston, Massachusetts 1,097 Boston, Massachusetts 1,053 Boston, Massachusetts 1,053
Ft. Lauderdale, Florida 1,035 Los Angeles, California 1,028 Tampa/St. Petersburg, Florida 936
Chicago-O'Hare, Illinois 1,011 Ft. Lauderdale, Florida 956 Los Angeles, California 910
Tampa/St. Petersburg, Florida 954 Tampa/St. Petersburg, Florida 916 Ft. Lauderdale, Florida 872
Denver, Colorado 899 Denver, Colorado 855 Las Vegas, Nevada 862
Dallas/Fort Worth, Texas 861 Las Vegas, Nevada 808 Dallas/Fort Worth, Texas 780
Las Vegas, Nevada 762 Dallas/Fort Worth, Texas 782 Denver, Colorado 734
Market Daily Pax Market Daily Pax Market Daily Pax
Orlando, Florida 1,618 Orlando, Florida 1,402 Orlando, Florida 1,589
Atlanta, Georgia 1,066 Boston, Massachusetts 1,018 Chicago-O'Hare, Illinois 1,016
Boston, Massachusetts 1,056 Atlanta, Georgia 948 Atlanta, Georgia 994
Chicago-O'Hare, Illinois 1,012 Los Angeles, California 937 Los Angeles, California 977
Los Angeles, California 857 Chicago-O'Hare, Illinois 923 San Francisco, California 886
Las Vegas, Nevada 831 Las Vegas, Nevada 900 Ft. Lauderdale, Florida 779
Tampa/St. Petersburg, Florida 799 Dallas/Fort Worth, Texas 818 Las Vegas, Nevada 769
Dallas/Fort Worth, Texas 791 San Francisco, California 779 Tampa/St. Petersburg, Florida 761
San Francisco, California 766 Ft. Lauderdale, Florida 727 Dallas/Fort Worth, Texas 677
Ft. Lauderdale, Florida 675 Tampa/St. Petersburg, Florida 670 Boston, Massachusetts 669
Market Daily Pax Market Daily Pax Market Daily Pax
Orlando, Florida 1,667 Orlando, Florida 1,693 Orlando, Florida 1,642
Atlanta, Georgia 1,045 Atlanta, Georgia 1,116 Atlanta, Georgia 994
Chicago-O'Hare, Illinois 947 Chicago-O'Hare, Illinois 1,002 Chicago-O'Hare, Illinois 987
Boston, Massachusetts 915 Boston, Massachusetts 925 Ft. Lauderdale, Florida 799
Los Angeles, California 824 Ft. Lauderdale, Florida 758 Tampa/St. Petersburg, Florida 798
Ft. Lauderdale, Florida 744 Tampa/St. Petersburg, Florida 744 Las Vegas, Nevada 748
San Francisco, California 706 Los Angeles, California 706 Los Angeles, California 690
Las Vegas, Nevada 693 Las Vegas, Nevada 680 Raleigh/Durham, North Carolina 601
Tampa/St. Petersburg, Florida 678 Dallas/Fort Worth, Texas 620 Dallas/Fort Worth, Texas 589
Dallas/Fort Worth, Texas 603 Denver, Colorado 588 Denver, Colorado 588
Daily Pax represents passengers per day each way
Distance is great-circle distance between PHL and indicated airport
Source: GRA, Incorporated
FY 2012
2019
2018 2017 2016
FY 2011 FY 2010
FY 2015 FY 2014 FY 2013
120
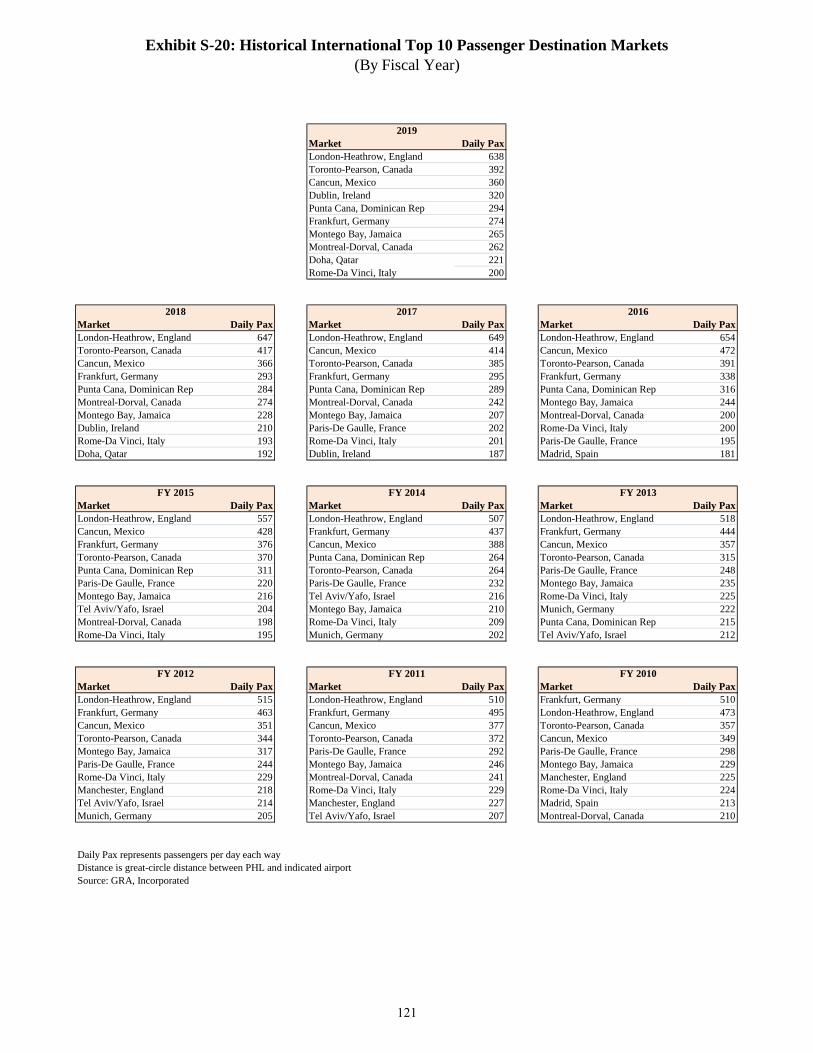
Exhibit S-20: Historical International Top 10 Passenger Destination Markets
(By Fiscal Year)
Market Daily Pax
London-Heathrow, England 638
Toronto-Pearson, Canada 392
Cancun, Mexico 360
Dublin, Ireland 320
Punta Cana, Dominican Rep 294
Frankfurt, Germany 274
Montego Bay, Jamaica 265
Montreal-Dorval, Canada 262
Doha, Qatar 221
Rome-Da Vinci, Italy 200
Market Daily Pax Market Daily Pax Market Daily Pax
London-Heathrow, England 647 London-Heathrow, England 649 London-Heathrow, England 654
Toronto-Pearson, Canada 417 Cancun, Mexico 414 Cancun, Mexico 472
Cancun, Mexico 366 Toronto-Pearson, Canada 385 Toronto-Pearson, Canada 391
Frankfurt, Germany 293 Frankfurt, Germany 295 Frankfurt, Germany 338
Punta Cana, Dominican Rep 284 Punta Cana, Dominican Rep 289 Punta Cana, Dominican Rep 316
Montreal-Dorval, Canada 274 Montreal-Dorval, Canada 242 Montego Bay, Jamaica 244
Montego Bay, Jamaica 228 Montego Bay, Jamaica 207 Montreal-Dorval, Canada 200
Dublin, Ireland 210 Paris-De Gaulle, France 202 Rome-Da Vinci, Italy 200
Rome-Da Vinci, Italy 193 Rome-Da Vinci, Italy 201 Paris-De Gaulle, France 195
Doha, Qatar 192 Dublin, Ireland 187 Madrid, Spain 181
Market Daily Pax Market Daily Pax Market Daily Pax
London-Heathrow, England 557 London-Heathrow, England 507 London-Heathrow, England 518
Cancun, Mexico 428 Frankfurt, Germany 437 Frankfurt, Germany 444
Frankfurt, Germany 376 Cancun, Mexico 388 Cancun, Mexico 357
Toronto-Pearson, Canada 370 Punta Cana, Dominican Rep 264 Toronto-Pearson, Canada 315
Punta Cana, Dominican Rep 311 Toronto-Pearson, Canada 264 Paris-De Gaulle, France 248
Paris-De Gaulle, France 220 Paris-De Gaulle, France 232 Montego Bay, Jamaica 235
Montego Bay, Jamaica 216 Tel Aviv/Yafo, Israel 216 Rome-Da Vinci, Italy 225
Tel Aviv/Yafo, Israel 204 Montego Bay, Jamaica 210 Munich, Germany 222
Montreal-Dorval, Canada 198 Rome-Da Vinci, Italy 209 Punta Cana, Dominican Rep 215
Rome-Da Vinci, Italy 195 Munich, Germany 202 Tel Aviv/Yafo, Israel 212
Market Daily Pax Market Daily Pax Market Daily Pax
London-Heathrow, England 515 London-Heathrow, England 510 Frankfurt, Germany 510
Frankfurt, Germany 463 Frankfurt, Germany 495 London-Heathrow, England 473
Cancun, Mexico 351 Cancun, Mexico 377 Toronto-Pearson, Canada 357
Toronto-Pearson, Canada 344 Toronto-Pearson, Canada 372 Cancun, Mexico 349
Montego Bay, Jamaica 317 Paris-De Gaulle, France 292 Paris-De Gaulle, France 298
Paris-De Gaulle, France 244 Montego Bay, Jamaica 246 Montego Bay, Jamaica 229
Rome-Da Vinci, Italy 229 Montreal-Dorval, Canada 241 Manchester, England 225
Manchester, England 218 Rome-Da Vinci, Italy 229 Rome-Da Vinci, Italy 224
Tel Aviv/Yafo, Israel 214 Manchester, England 227 Madrid, Spain 213
Munich, Germany 205 Tel Aviv/Yafo, Israel 207 Montreal-Dorval, Canada 210
Daily Pax represents passengers per day each way
Distance is great-circle distance between PHL and indicated airport
Source: GRA, Incorporated
FY 2015 FY 2014 FY 2013
FY 2012 FY 2011 FY 2010
2019
2018 2017 2016
121

Exhibit S-21: Airline Market Share by Landed Weight
(By Fiscal Year, Expressed in 1,000 lb. Units)
Landed
Weight
Market
Share
Landed
Weight
Market
Share
Landed
Weight
Market
Share
Landed
Weight
Market
Share
Landed
Weight
Market
Share
Domestic
Scheduled major/national
American 7,555,183 34.4% 6,596,290 30.0% 6,519,145 33.0% 6,622,369 31.8% 6,645,942 32.0%
Southwest 1,137,504 5.2% 1,136,154 5.2% 1,147,550 5.8% 1,122,080 5.4% 1,073,920 5.2%
Delta 944,727 4.3% 965,077 4.4% 986,238 5.0% 1,054,651 5.1% 1,074,449 5.2%
Frontier 679,553 3.1% 610,208 2.8% 540,837 2.7% 463,422 2.2% 164,022 0.8%
United 607,765 2.8% 608,859 2.8% 581,513 2.9% 593,949 2.9% 585,951 2.8%
Spirit 503,168 2.3% 434,762 2.0% 394,267 2.0% 265,760 1.3% 143,495 0.7%
JetBlue 284,454 1.3% 269,609 1.2% 249,728 1.3% 219,834 1.1% 158,080 0.8%
Alaska 176,452 0.8% 153,673 0.7% 61,952 0.3% 55,912 0.3% 55,475 0.3%
Air Canada 807 0.0% 574 0.0% 647 0.0% 660 0.0% 440 0.0%
AirTran - - - - - - - - 42,864 0.2%
Virgin America - - - - - - - - 35,545 0.2%
Continental - - - - - - - - - -
USA 3000 - - - - - - - - - -
Midwest Airlines - - - - - - - - - -
Northwest - - - - - - - - - -
Subtotal - scheduled major/national 11,889,613 54.1% 10,775,207 49.1% 10,481,877 53.0% 10,398,636 49.9% 9,980,183 48.0%
Scheduled regional/commuter
American Eagle
Republic 1,192,913 5.4% 1,311,277 6.0% 1,054,737 5.3% 1,573,718 7.6% 1,758,726 8.5%
Piedmont 1,556,777 7.1% 1,288,107 5.9% 1,073,784 5.4% 856,093 4.1% 844,519 4.1%
PSA 894,744 4.1% 513,352 2.3% 411,243 2.1% 393,415 1.9% 292,049 1.4%
Envoy 11,961 0.1% 19,929 0.1% - - 448 0.0% - -
Air Wisconsin - - 530,395 2.4% 1,170,582 5.9% 1,641,945 7.9% 1,730,258 8.3%
Mesa - - - - - - - - 60,863 0.3%
Chautauqua - - - - - - - - - -
Subtotal - American Eagle 3,656,396 16.6% 3,663,060 16.7% 3,710,345 18.8% 4,465,619 21.4% 4,686,414 22.6%
Other 266,991 1.2% 263,343 1.2% 299,419 1.5% 262,640 1.3% 382,585 1.8%
Subtotal - scheduled regional/commuter 3,923,387 17.9% 3,926,403 17.9% 4,009,764 20.3% 4,728,259 22.7% 5,068,999 24.4%
Charter 11,982 0.1% 4,054 0.0% 1,706 0.0% 679 0.0% 1,641 0.0%
Total - domestic 15,824,982 72.1% 14,705,664 67.0% 14,493,348 73.4% 15,127,575 72.7% 15,050,823 72.5%
International
Scheduled
American 2,443,560 11.1% 2,332,684 10.6% 2,136,282 10.8% 2,575,401 12.4% 2,710,497 13.0%
British 263,789 1.2% 237,237 1.1% 292,559 1.5% 293,400 1.4% 284,499 1.4%
Qatar 167,058 0.8% 165,072 0.8% 163,004 0.8% 174,408 0.8% 183,868 0.9%
Lufthansa 160,317 0.7% 142,492 0.6% 144,230 0.7% 155,154 0.7% 165,814 0.8%
Piedmont 158,973 0.7% 71,848 0.3% - - - - - -
Air Canada - Sky Regional / Jazz Aviation 133,305 0.6% 132,880 0.6% 123,047 0.6% 106,378 0.5% 99,695 0.5%
Frontier 70,208 0.3% 62,575 0.3% 60,003 0.3% 76,825 0.4% 35,976 0.2%
Aer Lingus 70,140 0.3% 15,750 0.1% - - - - - -
Republic 47,818 0.2% 72,324 0.3% 41,748 0.2% 79,176 0.4% 74,146 0.4%
Icelandair 16,104 0.1% 14,224 0.1% 3,780 0.0% 142 0.0% 142 0.0%
Delta 3,184 0.0% 62,562 0.3% 84,262 0.4% 81,552 0.4% 34,650 0.2%
JetBlue 142 0.0% 142 0.0% 172 0.0% 142 0.0% 142 0.0%
United 142 0.0% - - - - - - - -
Southwest 128 0.0% 256 0.0% - - - - 128 0.0%
Air Wisconsin - - 68,761 0.3% 187,389 0.9% 192,136 0.9% 220,289 1.1%
PSA - - 268 0.0% - - - - - -
Air Jamaica / Caribbean - - - - - - - - - -
Continental - - - - - - - - - -
USA 3000 - - - - - - - - - -
Air France - - - - - - - - - -
Subtotal - scheduled 3,534,868 16.1% 3,379,075 15.4% 3,236,477 16.4% 3,734,713 17.9% 3,809,846 18.3%
Charter 4,184 0.0% 1,290 0.0% 6,400 0.0% 3,273 0.0% 2,532 0.0%
Total - international 3,539,052 16.1% 3,380,365 15.4% 3,242,877 16.4% 3,737,986 18.0% 3,812,379 18.4%
All-cargo airlines 2,599,498 11.8% 2,199,913 10.0% 2,022,419 10.2% 1,955,784 9.4% 1,909,573 9.2%
Grand total 21,963,532 100.0% 20,285,942 92.4% 19,758,643 100.0% 20,821,345 100.0% 20,772,775 100.0%
Note: American and US Airways numbers combined for all previous years.
Source: City of Philadelphia
Airlines
2015201620172019 2018
122

Exhibit S-21: Airline Market Share by Landed Weight
(Continued, By Fiscal Year, Expressed in 1,000 lb. Units)
Landed
Weight
Market
Share
Landed
Weight
Market
Share
Landed
Weight
Market
Share
Landed
Weight
Market
Share
Landed
Weight
Market
Share
Domestic
Scheduled major/national
American 6,729,332 31.1% 6,494,844 31.4% 6,519,126 30.5% 6,592,315 30.0% 6,362,588 29.4%
Southwest 1,010,276 4.7% 1,189,716 5.7% 1,883,282 8.8% 2,335,648 10.6% 2,277,154 10.5%
Delta 1,024,831 4.7% 955,459 4.6% 972,645 4.6% 978,725 4.5% 974,740 4.5%
Frontier 4,693 0.0% 28,290 0.1% 79,842 0.4% 101,704 0.5% 49,220 0.2%
United 555,244 2.6% 661,536 3.2% 536,659 2.5% 518,260 2.4% 606,595 2.8%
Spirit 132,519 0.6% 31,841 0.2% - - - - - -
JetBlue 158,398 0.7% 18,624 0.1% - - - - - -
Alaska 55,410 0.3% 52,460 0.3% 2,880 0.0% - - - -
Air Canada 660 0.0% 1,100 0.0% 880 0.0% 1,173 0.0% - -
AirTran 204,488 0.9% 340,320 1.6% 301,816 1.4% 331,168 1.5% 356,872 1.6%
Virgin America 134,812 0.6% 213,741 1.0% 55,269 0.3% - - - -
Continental - - - - 179,638 0.8% 242,627 1.1% 239,403 1.1%
USA 3000 - - - - - - 23,036 0.1% 28,866 0.1%
Midwest Airlines - - - - - - - - 57,713 0.3%
Northwest - - - - - - - - - -
Subtotal - scheduled major/national 10,010,661 46.2% 9,987,931 48.3% 10,532,037 49.3% 11,124,656 50.7% 10,953,151 50.6%
Scheduled regional/commuter
American Eagle
Republic 1,729,624 8.0% 1,575,475 7.6% 1,629,517 7.6% 1,732,415 7.9% 1,715,114 7.9%
Piedmont 984,862 4.5% 1,108,958 5.4% 1,035,539 4.8% 1,038,016 4.7% 978,762 4.5%
PSA 274,903 1.3% 321,950 1.6% 332,498 1.6% 243,104 1.1% 217,536 1.0%
Envoy - - - - - - - - - -
Air Wisconsin 1,486,845 6.9% 1,559,460 7.5% 1,576,239 7.4% 1,573,231 7.2% 1,750,797 8.1%
Mesa 64,607 0.3% - - - - 74 0.0% 147 0.0%
Chautauqua - - 86,587 0.4% 96,884 0.5% 70,759 0.3% 61,781 0.3%
Subtotal - American Eagle 4,540,840 21.0% 4,652,430 22.5% 4,670,677 21.9% 4,657,599 21.2% 4,724,137 21.8%
Other 501,896 2.3% 626,130 3.0% 620,913 2.9% 605,377 2.8% 538,679 2.5%
Subtotal - scheduled regional/commuter 5,042,736 23.3% 5,278,560 25.5% 5,291,590 24.8% 5,262,976 24.0% 5,262,816 24.3%
Charter 4,257 0.0% 1,192 0.0% 9,055 0.0% 2,878 0.0% 3,543 0.0%
Total - domestic 15,057,655 69.5% 15,267,683 73.8% 15,832,682 74.1% 16,390,510 74.6% 16,219,510 74.9%
International
Scheduled
American 2,809,292 13.0% 2,644,675 12.8% 2,634,850 12.3% 2,584,725 11.8% 2,574,713 11.9%
British 275,550 1.3% 268,709 1.3% 277,447 1.3% 270,121 1.2% 254,332 1.2%
Qatar 44,280 0.2% - - - - - - - -
Lufthansa 137,300 0.6% 112,147 0.5% 112,152 0.5% 135,775 0.6% 142,696 0.7%
Piedmont - - - - - - - - - -
Air Canada - Sky Regional / Jazz Aviation 99,656 0.5% 99,814 0.5% 94,620 0.4% 95,210 0.4% 77,999 0.4%
Frontier 25,738 0.1% 25,738 0.1% 18,770 0.1% - - - -
Aer Lingus - - - - - - - - - -
Republic 58,631 0.3% 103,697 0.5% 158,701 0.7% 115,635 0.5% - -
Icelandair - - - - - - - - - -
Delta 22,694 0.1% 24,104 0.1% 29,898 0.1% 62,752 0.3% 38,052 -
JetBlue - - - - - - - - - -
United - - - - - - - - - -
Southwest - - - - - - - - - -
Air Wisconsin 255,351 1.2% 240,546 1.2% 228,326 1.1% 208,069 0.9% 177,801 0.8%
PSA - - - - - - - - - -
Air Jamaica / Caribbean - - - - 47,424 0.2% 50,394 0.2% 44,165 0.2%
Continental - - - - 1,028 0.0% - - - -
USA 3000 - - - - - - 26,307 0.1% 28,440 0.1%
Air France - - - - - - - - 35,770 0.2%
Subtotal - scheduled 3,728,492 17.2% 3,519,430 17.0% 3,603,216 16.9% 3,548,988 16.2% 3,373,968 15.4%
Charter 6,377 0.0% 1,483 0.0% 10,696 0.1% 9,394 0.0% 1,685 0.0%
Total - International 3,734,869 17.2% 3,520,913 17.0% 3,613,912 16.9% 3,558,382 16.2% 3,375,653 15.4%
All-Cargo Airlines 1,899,162 8.8% 1,849,771 8.9% 1,911,577 9.0% 2,010,961 9.2% 2,059,609 9.5%
Grand Total 20,691,686 95.6% 20,638,367 99.7% 21,358,171 100.0% 21,959,853 100.0% 21,654,772 100.0%
Note: American and US Airways numbers combined for all previous years.
Source: City of Philadelphia
Airlines
2010201120122014 2013
123
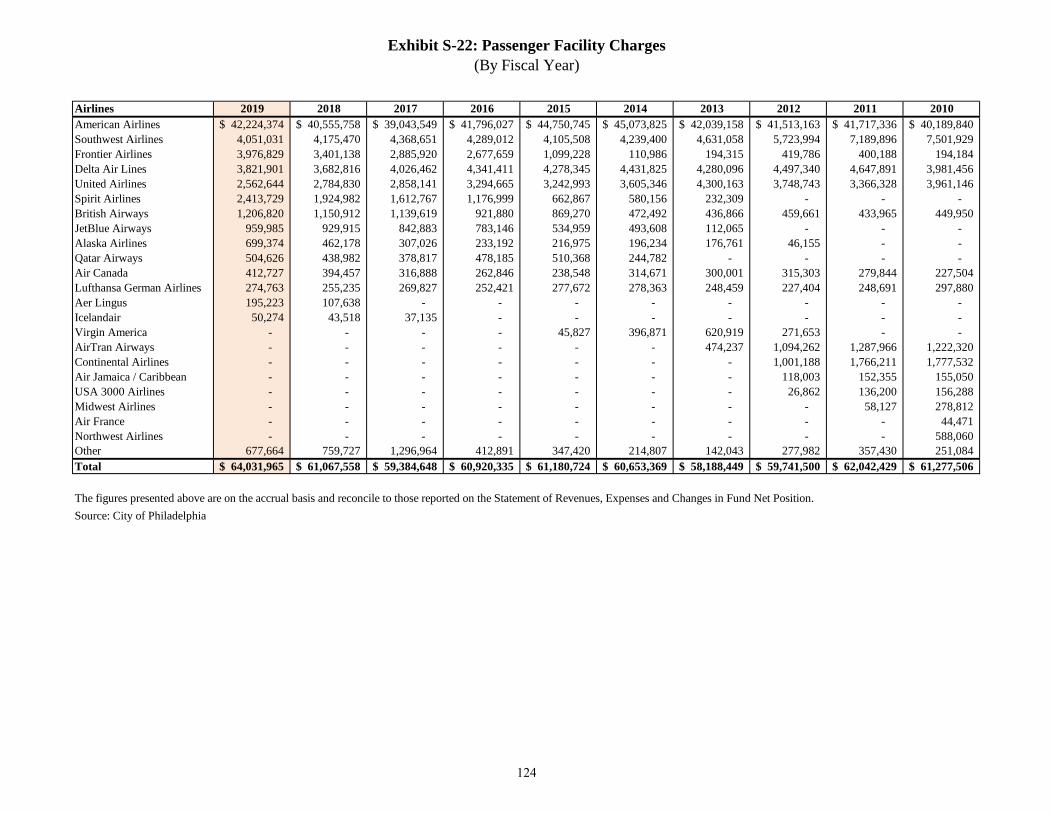
Exhibit S-22: Passenger Facility Charges
(By Fiscal Year)
Airlines 2019 2018 2017 2016 2015 2014 2013 2012 2011 2010
American Airlines 42,224,374$ 40,555,758$ 39,043,549$ 41,796,027$ 44,750,745$ 45,073,825$ 42,039,158$ 41,513,163$ 41,717,336$ 40,189,840$
Southwest Airlines 4,051,031 4,175,470 4,368,651 4,289,012 4,105,508 4,239,400 4,631,058 5,723,994 7,189,896 7,501,929
Frontier Airlines 3,976,829 3,401,138 2,885,920 2,677,659 1,099,228 110,986 194,315 419,786 400,188 194,184
Delta Air Lines 3,821,901 3,682,816 4,026,462 4,341,411 4,278,345 4,431,825 4,280,096 4,497,340 4,647,891 3,981,456
United Airlines 2,562,644 2,784,830 2,858,141 3,294,665 3,242,993 3,605,346 4,300,163 3,748,743 3,366,328 3,961,146
Spirit Airlines 2,413,729 1,924,982 1,612,767 1,176,999 662,867 580,156 232,309 - - -
British Airways 1,206,820 1,150,912 1,139,619 921,880 869,270 472,492 436,866 459,661 433,965 449,950
JetBlue Airways 959,985 929,915 842,883 783,146 534,959 493,608 112,065 - - -
Alaska Airlines 699,374 462,178 307,026 233,192 216,975 196,234 176,761 46,155 - -
Qatar Airways 504,626 438,982 378,817 478,185 510,368 244,782 - - - -
Air Canada 412,727 394,457 316,888 262,846 238,548 314,671 300,001 315,303 279,844 227,504
Lufthansa German Airlines 274,763 255,235 269,827 252,421 277,672 278,363 248,459 227,404 248,691 297,880
Aer Lingus 195,223 107,638 - - - - - - - -
Icelandair 50,274 43,518 37,135 - - - - - - -
Virgin America - - - - 45,827 396,871 620,919 271,653 - -
AirTran Airways - - - - - - 474,237 1,094,262 1,287,966 1,222,320
Continental Airlines - - - - - - - 1,001,188 1,766,211 1,777,532
Air Jamaica / Caribbean - - - - - - - 118,003 152,355 155,050
USA 3000 Airlines - - - - - - - 26,862 136,200 156,288
Midwest Airlines - - - - - - - - 58,127 278,812
Air France - - - - - - - - - 44,471
Northwest Airlines - - - - - - - - - 588,060
Other 677,664 759,727 1,296,964 412,891 347,420 214,807 142,043 277,982 357,430 251,084
Total 64,031,965$ 61,067,558$ 59,384,648$ 60,920,335$ 61,180,724$ 60,653,369$ 58,188,449$ 59,741,500$ 62,042,429$ 61,277,506$
The figures presented above are on the accrual basis and reconcile to those reported on the Statement of Revenues, Expenses and Changes in Fund Net Position.
Source: City of Philadelphia
124