1 quantitative assessment of the accuracy of spatial estimation of impervious cover anna chabaeva...
Post on 21-Dec-2015
215 views
TRANSCRIPT

1
Quantitative Assessment of Quantitative Assessment of the Accuracy of Spatial the Accuracy of Spatial
Estimation of Impervious Estimation of Impervious CoverCover
Anna ChabaevaDaniel CivcoJames HurdJason Parent
Department of Natural Resources Management & Engineering
The University of ConnecticutU-4087, Room 308, 1376 Storrs Road
Storrs, CT 06269-4087

2
ObjectivesObjectives
Compare predicted amount of imperviousness to highly accurate and precise planimetric data
Calculate percent imperviousness for52 towns in Connecticut and New York
on Tract Level
with
Subpixel Classification Impervious Surface Analysis Tool (ISAT)
Population Density and Land Use-based Regression Model
National Land Cover Data 2001
using
3
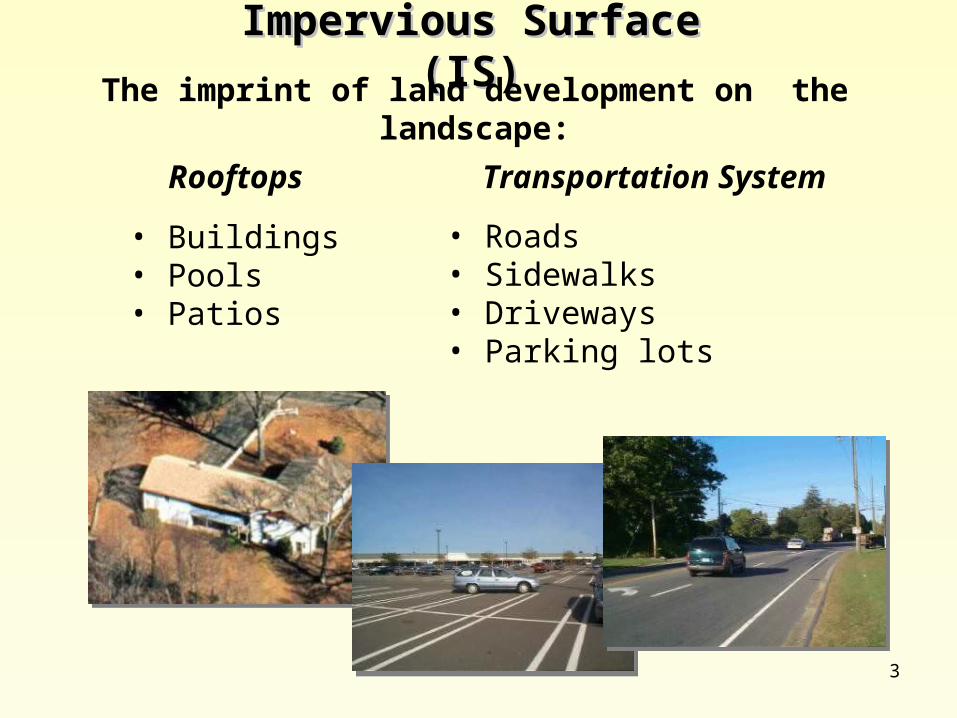
Impervious Surface Impervious Surface (IS)(IS)
The imprint of land development on the landscape:
Rooftops
• Buildings• Pools• Patios
Transportation System
• Roads• Sidewalks• Driveways• Parking lots

4
Why Is Impervious Surface Why Is Impervious Surface Important?Important?
Population density increases
Urbanization
Waterborne waste increases Water demand rises
Drainage system modified
Water resource problem Urban climate
changes
Flow velocity increases
Receiving water quality deteriorates
Pollution controlproblems
Base flow reduces
Peak runoff Rate increases
Flood controlproblems
Lag time and time base reduces
Groundwater recharge reduces
Runoff volume increases
Stormwater quality deteriorates
Impervious area increases
Building density increases

5
Influence of Impervious Surfaces Influence of Impervious Surfaces on Water Qualityon Water Quality
100
90
80
70
60
50
40
30
20
10
0
DEGRADED
PROTECTED
IMPACTED
WA
TE
RS
HE
D IM
PE
RV
IOU
SN
ES
S (
%)

6
Impervious Surface Measurement Impervious Surface Measurement MethodsMethods
Interpretive Approach• Digitizing• Point sampling (Cover Tool method)
Spectral Approach• Sub-pixel Classification• Artificial Neural Networks• Classification and Regression Tree (CART)• Normalized Difference Vegetation Index (NDVI)• Vegetation-Impervious surface-Soil (VIS) model
Modeling Approach• Population Density-based• Impervious Surface Analysis Tool (ISAT)• Regression Model

7
Impervious Surface Measurement Impervious Surface Measurement MethodsMethods
Interpretive Approach• Digitizing• Point sampling (Cover Tool method)
Spectral Approach• Sub-pixel Classification• Artificial Neural Networks• Classification and Regression Tree (CART)• Normalized Difference Vegetation Index (NDVI)• Vegetation-Impervious surface-Soil (VIS) model
Modeling Approach• Population Density-based• Impervious Surface Analysis Tool (ISAT)• Regression Model

8
Study AreaStudy Area
NY
CT

9
Data Data RequirementsRequirements
All datasets are in State Plane feet, NAD83 coordinates
• Census tracts 2000 data• Planimetric data • National Land Cover Data (NLCD) 2001• Landsat ETM+ data

10
Census Tract 2000 Census Tract 2000 DataData
Original (green) and edited (red) tract data
82 tracts
Obtained from:Cartographic Boundaries section of the U.S. Census Bureau
Census tractsTown of Groton, CT

11
Planimetric DataPlanimetric Data
Planimetric dataTown of Groton, CT
Obtained from:Town municipalities
Updated using 2004 CT DOQQs

12
National Land Cover Data (NLCD) National Land Cover Data (NLCD) 20012001
100 x 100 feet

13
NLCD Impervious CoverNLCD Impervious Cover
http://www.mrlc.gov/pdfs/July_PERS.pdfLandsat ETM Imagery
0%
100%
NLCD Imperviousness

14
Impervious Surface Analysis Tool Impervious Surface Analysis Tool (ISAT)(ISAT)
Land Use Land Use Land Cover Land Cover
GridGrid
Set of Set of CoefficientsCoefficients
Polygon Polygon ShapefileShapefile
http://www.csc.noaa.gov/crs/cwq/isat.html

15
Regression Regression ModelModel
ii AbPopDenbb %IS 21
where - b1 is the constant term
- b2 is the coefficient for population density
- bi are those for percentage of land cover category area within the tract- PopDen is the Population density- %Ai are the percent of the land cover category area
within the tract
Calibration Data221 NY tracts
Validation Data82 CT tracts
16
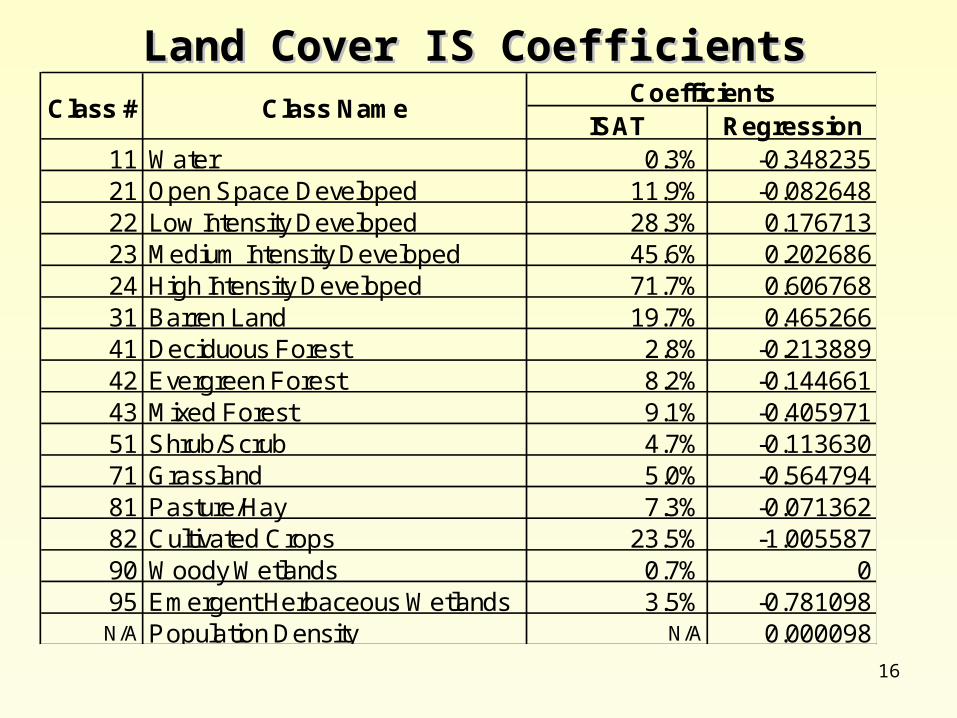
Land Cover IS Coefficients Land Cover IS Coefficients
ISAT Regression11 Water 0.3% -0.34823521 Open Space Developed 11.9% -0.08264822 Low Intensity Developed 28.3% 0.17671323 Medium Intensity Developed 45.6% 0.20268624 High Intensity Developed 71.7% 0.60676831 Barren Land 19.7% 0.46526641 Deciduous Forest 2.8% -0.21388942 Evergreen Forest 8.2% -0.14466143 Mixed Forest 9.1% -0.40597151 Shrub/Scrub 4.7% -0.11363071 Grassland 5.0% -0.56479481 Pasture/Hay 7.3% -0.07136282 Cultivated Crops 23.5% -1.00558790 Woody Wetlands 0.7% 095 Emergent Herbaceous Wetlands 3.5% -0.781098N/A Population Density N/A 0.000098
CoefficientsClass NameClass #

17
Sub-pixel Classification Tract IS Sub-pixel Classification Tract IS EstimationEstimation
Actual Imperviousness NLCD Imperviousness
82 tractsR2 = 0.95 RMSE = 5.65
Town of Groton, CT
0
20
40
60
80
100
0 20 40 60 80 100
Actual % IS
NL
CD
Su
b-p
ixel
%IS

18
0
20
40
60
80
100
0 20 40 60 80 100
Actual % IS
NL
CD
ISA
T %
IS
ISAT Tract IS EstimationISAT Tract IS EstimationActual Imperviousness ISAT Imperviousness
82 tractsR2 = 0.93 RMSE = 5.48
Town of Groton, CT

19
0
20
40
60
80
100
0 20 40 60 80 100
Actual % IS
NL
CD
Reg
ress
ion
%IS
Regression Tract IS EstimationRegression Tract IS EstimationActual Imperviousness Regression Imperviousness
82 tractsR2 = 0.93 RMSE = 4.56
Town of Groton, CT

20
ETISETISLand Use Land Use
Land Cover Land Cover GridGrid
Polygon Polygon ShapefileShapefile
Population Population DensityDensity
Set of Set of CoefficientsCoefficients
Custom Set Custom Set of of
CoefficientsCoefficients
Land Cover Land Cover ChangeChange

21
ETIS Predicted Percent ETIS Predicted Percent Imperviousness for ConnecticutImperviousness for Connecticut
Census Tracts
22
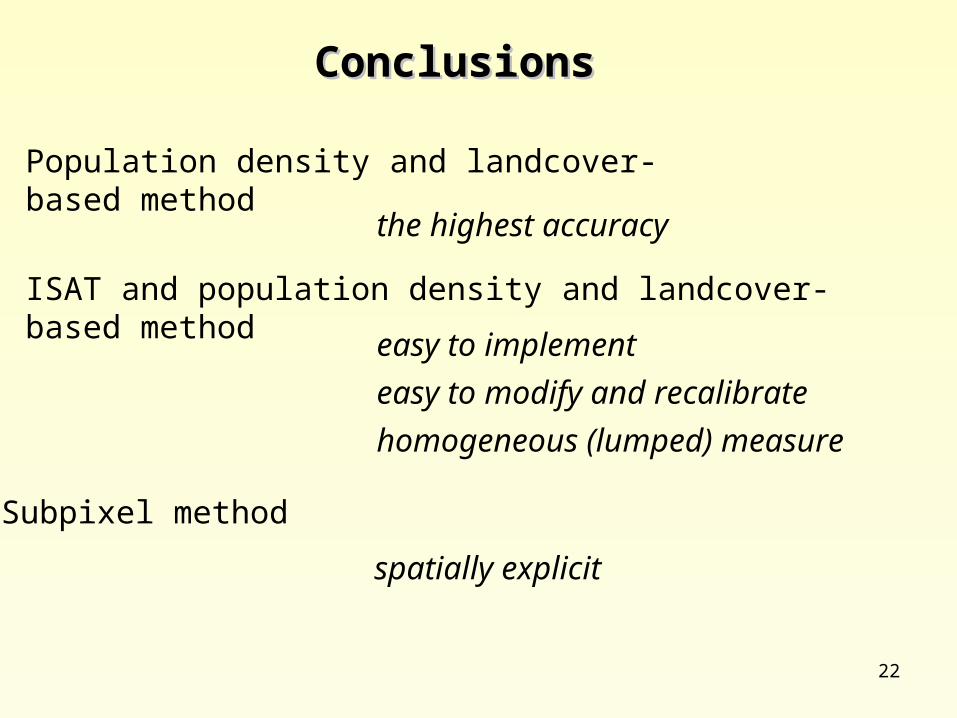
ConclusionConclusionss
Population density and landcover-based method
the highest accuracy
ISAT and population density and landcover-based method
homogeneous (lumped) measure
Subpixel method
spatially explicit
easy to implement
easy to modify and recalibrate

23
Anna [email protected]
Daniel CivcoJames Hurd
Jason Parent
Department of Natural Resources Management & Engineering
The University of ConnecticutU-4087, Room 308, 1376 Storrs Road
Storrs, CT 06269-4087
Quantitative Assessment of Quantitative Assessment of the Accuracy of Spatial the Accuracy of Spatial
Estimation of Impervious Estimation of Impervious CoverCover