1. overview of results of operations, etc....1 1. overview of results of operations, etc. (1)...
TRANSCRIPT

1
1. Overview of Results of Operations, etc.
(1) Overview of Results of Operations for the Fiscal Year under Review
During the fiscal year ended March 31, 2017, the global economy continued to face unstable conditions.
The U.S. economy remains relatively robust, but there is a mixture of expectations and uncertainties towards
the new President, Trump’s economic policies. In addition, the sense of caution remains strong regarding the
Federal Reserve Board’s plan to raise interest rates in stages, with higher uncertainty over the outlook for the
future. Moreover, anxiety of an economic slowdown in emerging countries including China has intensified. In
particular, excessive production and overcapacity of equipment in the Chinese material industry as well as cash
outflow from China have brought further instability to the global economy. As Britain’s Brexit negotiations will
soon enter the full-fledged phase, there are concerns over the emergence of political protectionism in other
European countries. Also, in the U.S., the impact of the protectionism policies led by the new administration is
causing concerns. Furthermore, there is great apprehension over military tensions between superpowers
regarding North Korea and Syria.
Meanwhile, the Japanese economy is supported by the government-led monetary and fiscal policies, as
well as the postponement of the increase in the consumption tax rate. Results in the manufacturing industry are
showing signs of recovery owing to the depreciation of the Japanese yen after the U.S. presidential election,
although foreign exchange rates are fluctuating due to uncertainty over the future. In Japan, which has been
unable to break away from a deflationary economy, harsh business conditions have become obvious in the
domestic distribution and retail industries. Furthermore, the business environment for financial institutions is
increasingly severe due to side effects of the negative interest rate policy.
Regarding capital investment during the fiscal year ended March 31, 2017, although corporations have
been keeping a relatively positive attitude in capital spending, such spending lacks vigor on the whole.
Furthermore, while investments in the research and development of new technologies such as AI and IoT have
been active, the priority of capital investment in other fields has started to lower. Capital investment has been
observed to be prioritized depending on the field. Although a growth strategy to stimulate investment in the
private sector, which is referred to as the third arrow of the three-point economic policy, is important to set the
Japanese economy on track for an autonomous and sustainable recovery, the course of such a plan is still
unclear, and the recovery of the real economy has not been achieved.
Information security-related demand is vigorous, driven by enhancement of the defense against cyber-
attacks for the public and private sectors and investment in the development of a security infrastructure
centered on local governments after continuous massive leakage of personal information caused by malware
attacks. Furthermore, the prolonged economic slowdown triggered by the bankruptcy of Lehman Brothers that
has added pressure on companies to reduce costs, and the recognition of risk in corporate ownership of
equipment caused by the Great East Japan Earthquake have accelerated a widespread shift in IT system
investments from “ownership of equipment” to “usage of services.” As companies continue to take IT assets off
the balance sheet, the usage of cloud services is expanding in their place.
The fiscal year under review was the second year of our Medium-term Management Plan “TMX 3.0”
announced on May 22, 2015, with the aim of “establishing the Company’s foundation and defining the future
strategic direction for the next 30 years (establishment of the growth gene).” “TMX 3.0” advocates a
breakaway from the labor-intensive contract business, which is typical of the IT industry, and therefore
continues with our key principle of transforming ourselves into a “Next-Generation IT Service Creator” and a
“Next-Generation IT Service Provider” through which the Company itself creates and provides IT services.

2
The core business strategies of “TMX 3.0”
Strategic and accelerated promotion of cloud-related businesses
Profit contribution by the cloud business (Realize profitability of the healthcare cloud business)
Turn our cloud service into a platform (Diversification)
Establish the cloud business in overseas (Asian) markets (First by realizing success of the joint venture
in China)
Quality improvement for cloud operation (Exponential improvement of operational skills)
Strategic application of various virtualization technologies (“Cloud first”)
Analysis of Big data gathered by the cloud (Secondary use of the data)
Pursuit of security and safety
Enhancement of defenses against cyber-attacks and provision of one-stop services
Realize a value chain of system design, construction, maintenance, operation and monitoring services,
and automatization
Realize functional safety of embedded software for IoT (Internet of Things)
Contribute to safety and security within Internet-based society
(Accumulation of knowledge as a professional group in the Technology for Information Security and
Software Quality Assurance fields)
Our Group implemented the following initiatives in accordance with the business strategies of “TMX 3.0.”
1) We carried out initiatives to preempt changes in demand for IT by proactively launching new businesses.
◇ Information Infrastructure Business
First quarter ended June 30, 2016
Launched “Tanium Endpoint Platform,” a cybersecurity platform for Endpoint of U.S.-based Tanium
Inc.
Okinawa Cross Head Co., Ltd. launched the upgraded service of the “nas2cloud” service
Launched “Proofpoint,” a next-generation mail security solution of U.S.-based Proofpoint Inc.
Launched the network operation and monitoring service “∴TRINITY for BIG-IP Managed Service”
Launched the token-less two-factor authentication solution “PINsafe” of British-based Swivel
Secure Ltd.
Third quarter ended December 31, 2016
Okinawa Cross Head Co., Ltd. launched the next-generation IoT service center in collaboration with
Hewlett-Packard Japan, Ltd. utilizing international information platform established by Okinawa
Prefecture
Launched “VxRail,” a new Hyper-converged solution for system virtualization of U.S.-based Dell
EMC
Launched an automatic data exchange tool for Secure Data Sanitization “Votiro Auto Agent for
FileZen”
Fourth quarter ended March 31, 2017
Launched “o365 traffic controller,” a product developed in-house that facilitates usage of Microsoft
Office 365
Launched “CylancePROTECT,” a next-generation AI-driven anti-virus product of U.S.-based
Cylance Inc.
CROSS HEAD launched the cloud service which conducts the operation management of the next-
generation data security software “Digital Guardian,” the system building service for “VM-Series,”
the next-generation firewall virtualization product of U.S.-based Palo Alto Networks, Inc. and low-
cost vulnerability assessment service.
3
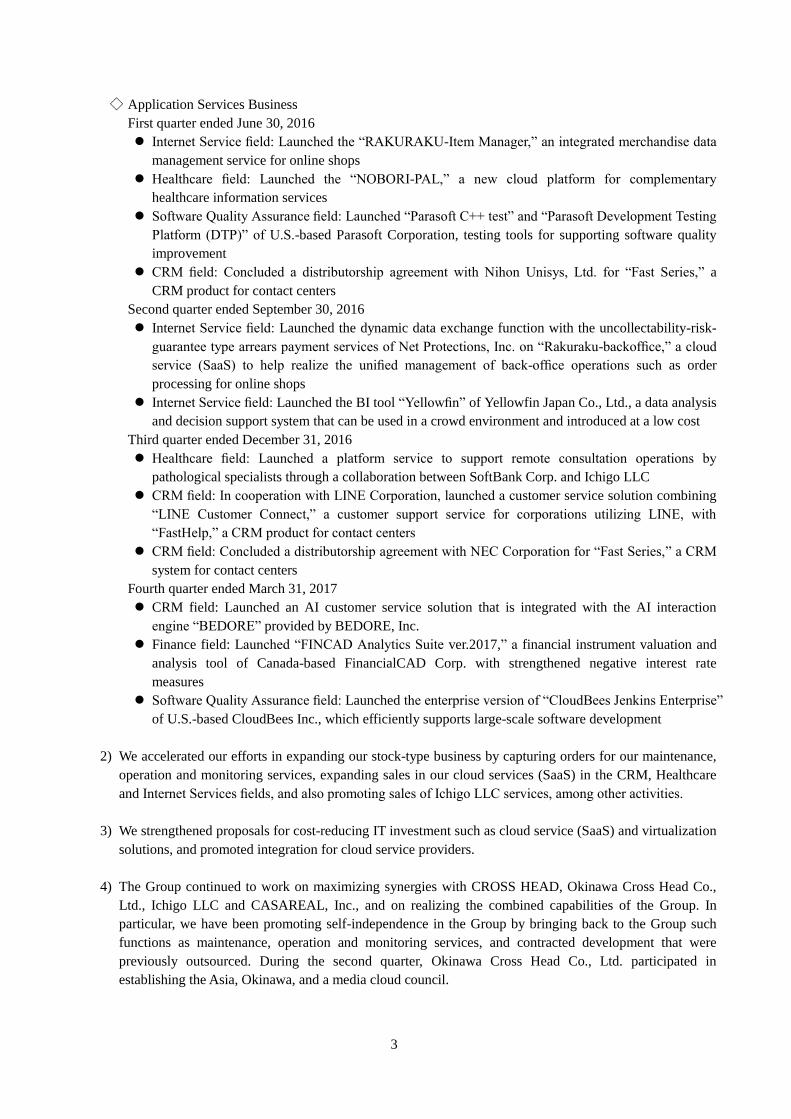
◇ Application Services Business
First quarter ended June 30, 2016
Internet Service field: Launched the “RAKURAKU-Item Manager,” an integrated merchandise data
management service for online shops
Healthcare field: Launched the “NOBORI-PAL,” a new cloud platform for complementary
healthcare information services
Software Quality Assurance field: Launched “Parasoft C++ test” and “Parasoft Development Testing
Platform (DTP)” of U.S.-based Parasoft Corporation, testing tools for supporting software quality
improvement
CRM field: Concluded a distributorship agreement with Nihon Unisys, Ltd. for “Fast Series,” a
CRM product for contact centers
Second quarter ended September 30, 2016
Internet Service field: Launched the dynamic data exchange function with the uncollectability-risk-
guarantee type arrears payment services of Net Protections, Inc. on “Rakuraku-backoffice,” a cloud
service (SaaS) to help realize the unified management of back-office operations such as order
processing for online shops
Internet Service field: Launched the BI tool “Yellowfin” of Yellowfin Japan Co., Ltd., a data analysis
and decision support system that can be used in a crowd environment and introduced at a low cost
Third quarter ended December 31, 2016
Healthcare field: Launched a platform service to support remote consultation operations by
pathological specialists through a collaboration between SoftBank Corp. and Ichigo LLC
CRM field: In cooperation with LINE Corporation, launched a customer service solution combining
“LINE Customer Connect,” a customer support service for corporations utilizing LINE, with
“FastHelp,” a CRM product for contact centers
CRM field: Concluded a distributorship agreement with NEC Corporation for “Fast Series,” a CRM
system for contact centers
Fourth quarter ended March 31, 2017
CRM field: Launched an AI customer service solution that is integrated with the AI interaction
engine “BEDORE” provided by BEDORE, Inc.
Finance field: Launched “FINCAD Analytics Suite ver.2017,” a financial instrument valuation and
analysis tool of Canada-based FinancialCAD Corp. with strengthened negative interest rate
measures
Software Quality Assurance field: Launched the enterprise version of “CloudBees Jenkins Enterprise”
of U.S.-based CloudBees Inc., which efficiently supports large-scale software development
2) We accelerated our efforts in expanding our stock-type business by capturing orders for our maintenance,
operation and monitoring services, expanding sales in our cloud services (SaaS) in the CRM, Healthcare
and Internet Services fields, and also promoting sales of Ichigo LLC services, among other activities.
3) We strengthened proposals for cost-reducing IT investment such as cloud service (SaaS) and virtualization
solutions, and promoted integration for cloud service providers.
4) The Group continued to work on maximizing synergies with CROSS HEAD, Okinawa Cross Head Co.,
Ltd., Ichigo LLC and CASAREAL, Inc., and on realizing the combined capabilities of the Group. In
particular, we have been promoting self-independence in the Group by bringing back to the Group such
functions as maintenance, operation and monitoring services, and contracted development that were
previously outsourced. During the second quarter, Okinawa Cross Head Co., Ltd. participated in
establishing the Asia, Okinawa, and a media cloud council.

4
5) The Group worked on initiatives such as contracted development of applications for smartphones and
other new types of mobile platforms, and training services for open-source programming techniques. In
the fourth quarter ended March 31, 2017, CASAREAL, Inc. concluded an Authorized Training Partner
agreement with Pivotal Software, Inc. (Japan office), a provider of Java-based application development
framework, and an Apple Authorized Training Provider agreement with U.S.-based LearnQuest, Inc., the
only Apple Authorized Training Provider certified by Apple Inc.
6) The Group promoted measures to drive business expansion in fields such as cloud services in overseas
markets, primarily Asian emerging countries that are continuing to grow. In the second quarter, in the
CRM field, transcosmos (Thailand) Co., Ltd adopted a one-stop solution that combines a multichannel-
compliant contact center solution for small and medium-sized enterprises provided by Avaya Japan Ltd.
with “Fast Series,” a CRM product for contact centers. In the third quarter, in the healthcare field, the
Group invested in DocsApp (Registered company name: PHASORZ TECHNOLOGIES PRIVATE
LIMITED), an India-based online medical diagnosis service venture that expands B2C businesses in the
healthcare area by utilizing smartphones.
7) In the second quarter, we renewed our Web site (http://www.techmatrix.co.jp/) as part of our efforts for the
reinforcement of corporate branding.
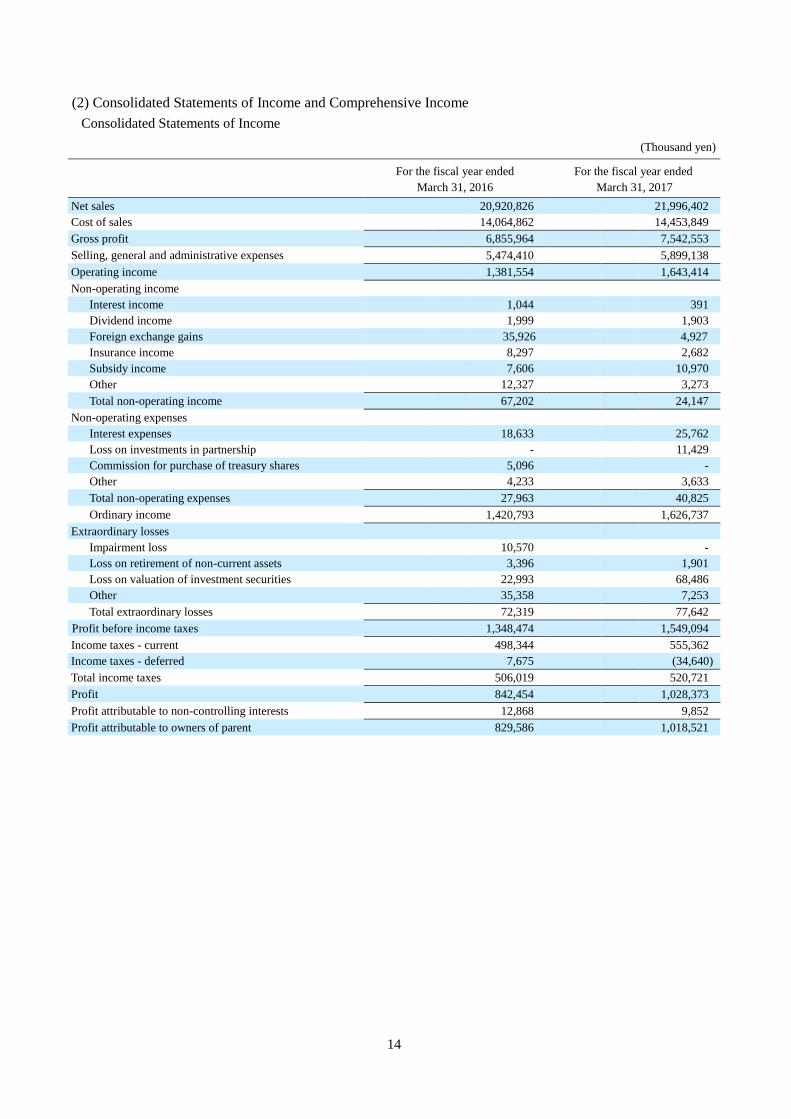
As a result of the above, the consolidated net sales during year ended March 31, 2017 increased ¥1,075
million (5.1%) year on year to a record high of ¥21,996 million. Gross profit amounted to ¥7,542 million, up
¥686 million (10.0%) year on year. Selling, general and administrative expenses were ¥5,899 million, up ¥424
million (7.8%) year on year due to an increase in personnel expense and other factors. Accordingly, operating
income increased ¥261 million (19.0%) year on year to a record high of ¥1,643 million, and ordinary income
increased ¥205 million (14.5%) year on year to ¥1,626 million.
Furthermore, a ¥68 million loss on valuation of investment securities was recorded under extraordinary
losses in the fourth quarter under review.
Consequently, income before income taxes was ¥1,549 million, up ¥200 million (14.9%) year on year, and
profit attributable to owners of the parent was ¥1,018 million, up ¥188 million (22.8%) year on year.
5
Results by operating segment were as follows:
(1) Information Infrastructure Business
Although the sales of load balancers have somewhat peaked, we worked on promoting the sales of
solutions integrated with Office 365 provided by Microsoft Corporation. Sales of the mainstay next-generation
firewalls were favorable for the public and private sectors, due in part to the growing threat from cyber-attacks
such as Advance Persistent Threat (APT). While demand for large-scale projects that we have developed in
collaboration with major system integrators has calmed down, demand for medium-scale projects has continued
to be generated. In addition, sales of personal authentication systems performed well in line with the spread of
telework at governments, other public agencies and private companies. Demand for security is strong from
governments, other public agencies, local governments and the private sector. Sales of intrusion prevention
appliances, forensic products, Security Information and Event Management (SIEM) products, antivirus licenses,
and security-related operation and monitoring services increased. As solution sales of scale-out network-
attached storage (NAS) to the broadcast industry were a success, we could expect further sales in the industry.
Regarding the cybersecurity platform for Endpoint, the next-generation mail security product, and the
automatic data exchange tool for Secure Data Sanitization launched in the fourth quarter, orders are increasing
steadily.
Furthermore, the launch of other state-of-the-art security-related products for strengthening defense
against unknown cyber-attacks, such as Sandbox (security) products and End Point security products
(cybersecurity platforms, next-generation anti-virus products using AI), has gradually begun.
While CROSS HEAD received continuous orders in the maintenance, operation and monitoring services,
it struggled to secure technical experts, resulting in opportunity loss in terms of sales in some areas. On the
other hand, sales of security-related products and receiving orders for solution projects such as integration of
groupware performed successfully, which recorded higher-than-planned operating income.
At Okinawa Cross Head Co., Ltd., sales of security-related products and original value-added services
were strong. Meanwhile, cloud-related businesses in Okinawa were stagnant, reflecting the political turmoil in
the prefecture, but recovered partially in the fourth quarter under review.
As a result, net sales of the business amounted to a record high of ¥14,751 million, up ¥899 million (6.5%)
year on year, and operating income amounted to ¥1,368 million, up ¥237 million (21.0%) year on year.
(2) Application Services Business
In the Internet Service field, although orders from existing customers for the contract development
business decreased partially, the decrease was offset by new customer acquisition in new fields such as BI.
However, due to the concentration of investments in new cloud services, we struggled slightly to maintain the
profit margin. At CASAREAL, Inc., owing to continuing contract development for existing customers and new
customer acquisition, net sales rose. In training services, orders for technical trainings, etc., for new graduates
as well as for trainings held periodically remained successful, reflecting the effectiveness of developing new
training programs and scouting for partners, etc.
In the Software Quality Assurance field, the necessity for improvement of the quality of embedded
software and functional safety was disseminated. Until the second quarter, due to the appreciated yen,
investment appetite had declined mainly in the manufacturing industry, which resulted in the sales of testing
tools reaching a plateau. However, backed by the improving capital investment appetite in the manufacturing
industry, resulting from the weak yen trend after the U.S. presidential election, in the fourth quarter under
review, orders for large-scale projects were successfully obtained, and the profit margin was higher than
planned.
In the Healthcare field, inquiries for “NOBORI,” a cloud service for healthcare information, has remained
strong. As revenue for this service is recognized in proportion to the corresponding service period, net sales
have tended to increase gradually with an increase in the number of contracted facilities. Although the timing of
orders was delayed in the first quarter, orders caught up subsequently and the service returned to a profit trend

6
on a monthly basis from the third quarter, eventually achieving profitability for the fiscal year under review.
Furthermore, the target of a cumulative total of 600 contracted facilities was exceeded, with 650 facilities
contracted. At Ichigo LLC, the number of contracted facilities, teleradiology orders, and pay-as-you-go
payments has steadily expanded as a result of the progress of initiatives in gaining customers from health
checkup facilities and business expansion in the pathology sector, in addition to the conventional service
provision for hospitals due to rising demand for teleradiology.
In the CRM field, orders increased steadily thanks to the sales of next-generation products, the business
collaboration with a major system integrator and the expanding demand for cloud services. Along with the
improved name recognition and the expansion of business performance, we have steadily received several
major orders, but there were also some unprofitable projects.
As a result, net sales of the business amounted to a record high of ¥7,245 million, up ¥176 million (2.5%)
year on year, and operating income amounted to ¥274 million, up ¥24 million (9.9%) year on year.

7
(2) Overview of Consolidated Financial Position for the Fiscal Year under Review
(Overview of Consolidated Financial Position for the Fiscal Year under Review)
Current assets increased ¥1,251 million (10.4%) from March 31, 2016 to ¥13,343 million as of March 31,
2017. The principal factor in this change was an increase of ¥759 million in cash and deposits. Non-current
assets stood at ¥3,937 million, an increase of ¥310 million (8.5%) from March 31, 2016. The principal factor in
this change was an increase of ¥97 million in leased assets. As a result, total assets amounted to ¥17,280
million, an increase of ¥1,561 million (9.9%) from March 31, 2016.
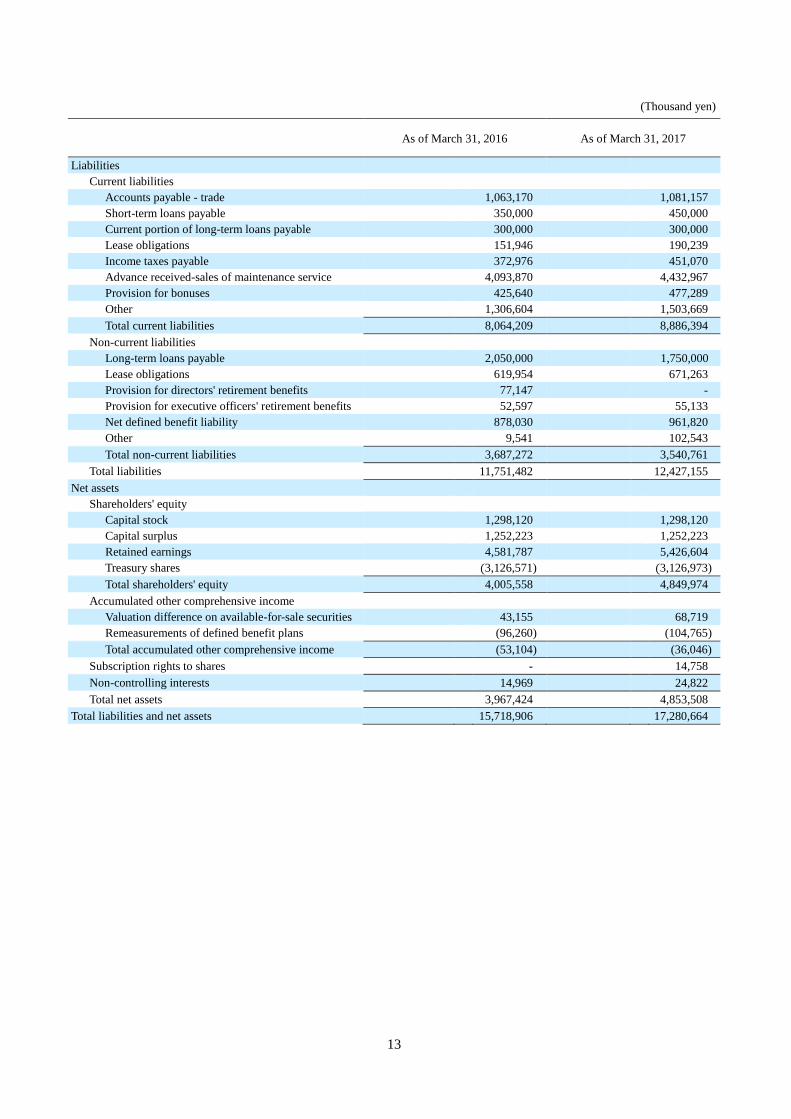
Current liabilities stood at ¥8,886 million, an increase of ¥822 million (10.2%) from March 31, 2016. The
principal factor in this change was an increase of ¥339 million in advance received-sales of maintenance
service. Non-current liabilities decreased ¥146 million (4.0%) from March 31, 2016 to ¥3,540 million. The
principal factor in this change was a ¥300 million decrease in long-term loans payable. As a result, total
liabilities amounted to ¥12,427 million, an increase of ¥675 million (5.7%) from March 31, 2016.
Net assets were ¥4,853 million, up ¥886 million (22.3%) from March 31, 2016. As a result, the equity
ratio was 27.9%.
(Basic Principle of Profit Distribution and Dividends for Current and Next Period)
As part of its efforts to increase shareholder value, the Company positions the return of profits to
shareholders as an important management task. The basic principle of profit distribution is to make decisions by
comprehensively determining the balance between returns to shareholders and maintaining sufficient internal
reserves. The basic principle of the dividend policy is to have a consolidated payout ratio of at least 20% of the fiscal
year’s earnings. For the fiscal year ended March 31, 2017, it was resolved at the Board of Directors meeting
held on May 9, 2016 that the Company will pay an annual dividend of ¥25 per share, slightly higher than the
forecast figure. Based on a resolution at the Board of Directors meeting held on February 3, 2017, this dividend
amount was adjusted to ¥12.5 per share in line with the 2-for-1 stock split implemented on March 1, 2017.
However, in view of profit levels for the fiscal year ended March 31, 2017, it was resolved at the Board of
Directors meeting held on April 26, 2017 that the dividend amount will be further raised to ¥15 per share.
For the year ending March 31, 2018, the Company plans to pay an annual dividend of ¥18 per share.

8
(3) Overview of Cash Flows for the Fiscal Year under Review
Cash and cash equivalents (hereinafter referred to as “cash”) at the end of the fiscal year under review
amounted to ¥5,458 million, an increase of ¥759 million (16.2%) from March 31, 2016. Cash flows in each
area of activity for the fiscal year under review are as follows.
(Cash Flows from Operating Activities)
Net cash provided by operating activities for the fiscal year under review was ¥1,629 million, an increase
of ¥262 million (19.2%) from March 31, 2016. This was primarily due to a decrease in the advance payment-
cost of maintenance service.
(Cash Flows from Investing Activities)
Net cash used in investing activities for the fiscal year under review was ¥454 million, an increase of ¥365
million (409.5%) from March 31, 2016. This was primarily due to a decrease in the collection of other lease
deposits.
(Cash Flows from Financing Activities)
Net cash used in financing activities for the fiscal year under review was ¥414 million, a decrease of ¥455
million (52.4%) from March 31, 2016. This was primarily due to decreases in purchase of treasury shares and
proceeds from long-term loans payable.
(Reference) Trends in Cash Flow Indicators
Fiscal year ended March 31, 2015
Fiscal year ended March 31, 2016
Fiscal year ended March 31, 2017
Equity ratio (%) 45.3 25.1 27.9
Equity ratio based on fair value (%) 57.4 105.3 132.9
Ratio of interest-bearing liabilities to
cash flows (%) 47.8 254.1 206.3
Interest coverage ratio (times) 156.3 76.4 62.5
Equity ratio: Equity / Total assets
Equity ratio based on fair value: Total market value of shares / Total assets
Ratio of interest-bearing liabilities to cash flows: Interest-bearing liabilities / Cash flows
Interest coverage ratio: Cash flows / Interest payments
(Note 1) Calculations were based on financial data on a consolidated basis.
(Note 2) The total market value of shares is calculated based on the number of outstanding shares without the treasury shares.
(Note 3) Cash flows refer to cash flows from operating activities.
(Note 4) Interest-bearing liabilities include all liabilities recorded on the consolidated balance sheet for which interest is paid.

9
(4) Future Outlook
(Outlook for the Next Fiscal Year)
Regarding the Japanese economy, the continuation of bold monetary policies (introduction of negative
interest rates) and flexible fiscal policies (Abenomics) aimed at reviving the economy was expected to lead to
results such as the stabilization of the yen, high share prices, low crude oil prices, a rise in commodity prices,
and the recovery of exports. However, due to uncertainty over the future and geopolitical risks in the global
economy, as well as stronger military tensions, both the stock market and foreign exchange market are in a state
of flux. As a result, earnings of corporations are becoming increasingly bipolarized, and the outlook for the next
fiscal year is not considered optimistic at present.
Under such circumstances, the steady implementation of the core business strategies of the Medium-term
Management Plan “TMX 3.0” formulated on May 22, 2015 is the most important guideline for the Group to
sustain its growth. As the shift in IT system investments of corporations from “ownership of equipment” (on-
premise model) to “usage of services” (cloud model) accelerates, the Group will carry out the “strategic and
accelerated promotion of cloud-related businesses.” Also, the era where various devices around us are
controlled electronically via embedded software has arrived. As such devices are interlinked through the
Internet (IoT = Internet of Things), security threats including leakage of information caused by cyber-attacks
are a concern not only of national institutions and corporations, but also at the individual level. Through our
second strategy “pursuit of security and safety,” the Group will contribute to the creation of a safer and more
secure society. In addition to sales of existing products, integration, system contracts, and development and
sales of package software, by strengthening our stock-type businesses such as maintenance, operation and
monitoring services and cloud services (SaaS) as well as creating new businesses, the Group will expand its
business scale and strengthen its business infrastructure, striving to build a business structure that can grow
stably while responding to changes in the environment and is highly sustainable.
In the Information Infrastructure Business, in response to the cloud era, the Company aims to expand next-
generation network and security-related products and services that can prevent cyber-attacks. With the spread
of cloud services and social media, coupled with a larger number of smartphone users, the amount of
communication traffic over the Internet is increasing rapidly, and amid the rise of threats related to information
security, we expect the positive attitude of data center operators, cloud service operators and general
corporations towards capital investments in information infrastructure to continue. By pre-empting trends of
cutting-edge network and security-related technologies, actively searching for new potential products, and
combining them with each of the Company’s in-house service businesses, the Company will advance its
differentiation from its competitors. We will accelerate business cooperation with consolidated subsidiaries in
this segment, and work on improving the ability to comprehensively provide services covering the entire life
cycle of an information infrastructure.
Accordingly, net sales of the above segment are expected to amount to ¥16.5 billion.
With regards to the Application Services Business, in the CRM field, the Healthcare field, and the Internet
Service field, we will promote the acceleration of cloud services (SaaS).
In the Healthcare field, in 2010, it became possible for healthcare information and data, previously only
allowed within the premises of healthcare facilities, to be stored in external data centers managed by private
operators. After the guidelines were released by the relevant authorities, the Company preceded other
companies in launching its cloud service for healthcare information, “NOBORI” in 2012. Hospitals that
adopted the service praised the monthly subscription business model which did not require a high initial
investment cost, and the ease of system management, which was entrusted to an external party. As a result, the
adoption of “NOBORI” advanced steadily among a wide range of customers, from large-scale hospitals to
small-scale healthcare institutions. Going forward, in addition to the management of healthcare images data, the
Company and its partners plan to expand and enhance “NOBORI” into a new cloud service, namely
“NOBORI-PAL,” a cloud platform for healthcare information services. Greater usage of personal

10
identifications (healthcare ID and other IDs) in the healthcare field is expected to drive this new service
forward.
As cloud services implement pay-as-you-go and other forms of monthly subscriptions, the recognition of
sales and profit are attributed to periods and protracted over the long-term (deferred processing), causing a
decrease in net sales and having a negative effect on revenue in the short term. However, as net sales tend to
increase gradually with an increase in the number of contracted facilities, sales were in the black in the fiscal
year under review. Going forward, the services are also expected to contribute to raising profit. In the Software
Quality Assurance field, through the spread of M2M and IoT where various devices are interlinked through the
Internet, improving the quality of embedded software has become an extremely important issue in society. It is
becoming increasingly necessary to meet international standards for functional safety in various fields such as
healthcare equipment, automobiles, railways and electronic devices. Besides accurately capturing demand for
quality enhancement and functional safety of embedded software, we will respond to the software quality
improvement needs of the corporate internal information system field, as it becomes more complex and larger
in scale. Consolidated subsidiaries in this segment will strive to achieve synergy with the Company’s business,
and are expected to stably contribute to revenue going forward.
Accordingly, net sales of the above segment are expected to amount to ¥7.5 billion.
As a result, net sales of ¥24.0 billion (9.1% increase year on year), operating income of ¥2.0 billion
(21.7% increase year on year), and profit attributable to owners of parent of ¥1.4 billion (37.5% increase year
on year) are expected for the next fiscal year.

11
(Status of Progress in the Medium-term Management Plan)
In line with celebrating its milestone 30th anniversary in August 2014, the Company announced the
Medium-term Management Plan “TMX 3.0” with the aim of “establishing the Company’s foundation and
defining the future strategic direction for the next 30 years (establishment of the growth gene)” on May 22,
2015. “TMX 3.0” advocates a breakaway from the labor-intensive contract business, which is typical of the IT
industry, and therefore continues with our key principle of transforming ourselves into a “Next-Generation IT
Service Creator” and a “Next-Generation IT Service Provider” through which the Company itself creates and
provides IT services.
The numerical targets of the Medium-term Management Plan are as follows:
(millions of yen)
Consolidated
Fiscal Year Indicators
Information
Infrastructure Business
Application Services
Business Total
Targets for fiscal year
ended March 31,
2016
Net sales 13,800 6,600 20,400
Operating income 1,120 180 1,300
Targets for fiscal year
ended March 31,
2017
Net sales 15,400 7,300 22,700
Operating income 1,320 380 1,700
Targets for fiscal year
ending March 31,
2018
Net sales 17,000 8,100 25,100
Operating income 1,600 750 2,350
For the fiscal year ended March 31, 2016, net sales were ¥20,920 million and operating income was
¥1,381 million, both successfully exceeding the numerical targets set in “TMX 3.0” for the said fiscal year.
For the fiscal year ended March 31, 2017, net sales were ¥21,996 million and operating income was
¥1,643 million, 98.6% and 99.6% respectively of the figures in the forecast for the full fiscal year announced
on May 9, 2016, reflecting the high accuracy of the forecast. (In relation to numerical targets set in “TMX 3.0”
for the said fiscal year, there was an achievement rate of 96.9% for net sales and 96.7% for operating income.)

12
2. Consolidated Financial Statements (1) Consolidated Balance Sheets
(Thousand yen)
As of March 31, 2016 As of March 31, 2017
Assets
Current assets
Cash and deposits 4,698,887 5,458,743
Notes and accounts receivable - trade 3,491,652 3,991,295
Inventories 269,508 320,630
Advance payment-cost of maintenance service 2,657,514 2,807,471
Deferred tax assets 255,223 271,347
Other 719,828 494,418
Allowance for doubtful accounts (790) (337)
Total current assets 12,091,824 13,343,568
Non-current assets
Property, plant and equipment
Buildings 109,069 173,658
Accumulated depreciation (34,654) (46,928)
Buildings, net 74,414 126,730
Tools, furniture and fixtures 1,293,185 1,366,174
Accumulated depreciation (1,029,921) (1,075,438)
Tools, furniture and fixtures, net 263,264 290,736
Leased assets 862,254 1,104,193
Accumulated depreciation (171,455) (315,988)
Leased assets, net 690,799 788,204
Total property, plant and equipment 1,028,478 1,205,671
Intangible assets
Goodwill 229,904 126,015
Software 626,242 716,521
Other 277,825 369,341
Total intangible assets 1,133,971 1,211,878
Investments and other assets
Investment securities 437,364 455,934
Deferred tax assets 272,255 279,224
Other 766,860 796,236
Allowance for doubtful accounts (11,848) (11,848)
Total investments and other assets 1,464,632 1,519,546
Total non-current assets 3,627,082 3,937,095
Total assets 15,718,906 17,280,664
13
(Thousand yen)
As of March 31, 2016 As of March 31, 2017
Liabilities
Current liabilities
Accounts payable - trade 1,063,170 1,081,157
Short-term loans payable 350,000 450,000
Current portion of long-term loans payable 300,000 300,000
Lease obligations 151,946 190,239
Income taxes payable 372,976 451,070
Advance received-sales of maintenance service 4,093,870 4,432,967
Provision for bonuses 425,640 477,289
Other 1,306,604 1,503,669
Total current liabilities 8,064,209 8,886,394
Non-current liabilities
Long-term loans payable 2,050,000 1,750,000
Lease obligations 619,954 671,263
Provision for directors' retirement benefits 77,147 -
Provision for executive officers' retirement benefits 52,597 55,133
Net defined benefit liability 878,030 961,820
Other 9,541 102,543
Total non-current liabilities 3,687,272 3,540,761
Total liabilities 11,751,482 12,427,155
Net assets
Shareholders' equity
Capital stock 1,298,120 1,298,120
Capital surplus 1,252,223 1,252,223
Retained earnings 4,581,787 5,426,604
Treasury shares (3,126,571) (3,126,973)
Total shareholders' equity 4,005,558 4,849,974
Accumulated other comprehensive income
Valuation difference on available-for-sale securities 43,155 68,719
Remeasurements of defined benefit plans (96,260) (104,765)
Total accumulated other comprehensive income (53,104) (36,046)
Subscription rights to shares - 14,758
Non-controlling interests 14,969 24,822
Total net assets 3,967,424 4,853,508
Total liabilities and net assets 15,718,906 17,280,664
14
(2) Consolidated Statements of Income and Comprehensive Income
Consolidated Statements of Income
(Thousand yen)
For the fiscal year ended
March 31, 2016
For the fiscal year ended
March 31, 2017
Net sales 20,920,826 21,996,402
Cost of sales 14,064,862 14,453,849
Gross profit 6,855,964 7,542,553
Selling, general and administrative expenses 5,474,410 5,899,138
Operating income 1,381,554 1,643,414
Non-operating income
Interest income 1,044 391
Dividend income 1,999 1,903
Foreign exchange gains 35,926 4,927
Insurance income 8,297 2,682
Subsidy income 7,606 10,970
Other 12,327 3,273
Total non-operating income 67,202 24,147
Non-operating expenses
Interest expenses 18,633 25,762
Loss on investments in partnership - 11,429
Commission for purchase of treasury shares 5,096 -
Other 4,233 3,633
Total non-operating expenses 27,963 40,825
Ordinary income 1,420,793 1,626,737
Extraordinary losses
Impairment loss 10,570 -
Loss on retirement of non-current assets 3,396 1,901
Loss on valuation of investment securities 22,993 68,486
Other 35,358 7,253
Total extraordinary losses 72,319 77,642
Profit before income taxes 1,348,474 1,549,094
Income taxes - current 498,344 555,362
Income taxes - deferred 7,675 (34,640)
Total income taxes 506,019 520,721
Profit 842,454 1,028,373
Profit attributable to non-controlling interests 12,868 9,852
Profit attributable to owners of parent 829,586 1,018,521

15
Consolidated Statements of Comprehensive Income
(Thousand yen)
For the fiscal year ended
March 31, 2016
For the fiscal year ended
March 31, 2017
Profit 842,454 1,028,373
Other comprehensive income
Valuation difference on available-for-sale securities (65,792) 25,563
Remeasurements of defined benefit plans, net of tax (13,730) (8,505)
Total other comprehensive income (79,522) 17,058
Comprehensive income 762,931 1,045,431
Comprehensive income attributable to:
Comprehensive income attributable to owners of parent 750,063 1,035,579
Comprehensive income attributable to non-controlling
interests 12,868 9,852