1 one-month stress period considerations presentation to eshmc 8 january 2008 b. contor
TRANSCRIPT
1
One-month Stress PeriodConsiderations
Presentation to ESHMC8 January 2008
B. Contor

Courtesy Rick Raymondi

Outline
• MODFLOW & PEST considerations
• Recharge tool considerations
• Data considerations

MODFLOW & PEST considerations
1. Meaning of “Stress Period”
0
0.5
1
1.5
2
2.5
3
3.5
4
4.5
0 1 2 3 4 5 6
Stress
ModelOutput
Observations
Interpolated Match

MODFLOW & PEST considerations
2. Meaning of “Time Step”
0
0.5
1
1.5
2
2.5
3
3.5
4
4.5
0 1 2 3 4 5 6
Stress
ModelOutput
Observations
Interpolated Match

MODFLOW & PEST considerations
3. Observations occur when they occur
0
0.5
1
1.5
2
2.5
3
3.5
4
4.5
0 1 2 3 4 5 6
Stress
ModelOutput
Observations
Interpolated Match

MODFLOW & PEST considerations
4.Model output is interpolated to times of observations
0
0.5
1
1.5
2
2.5
3
3.5
4
4.5
0 1 2 3 4 5 6
Stress
ModelOutput
Observations
Interpolated Match
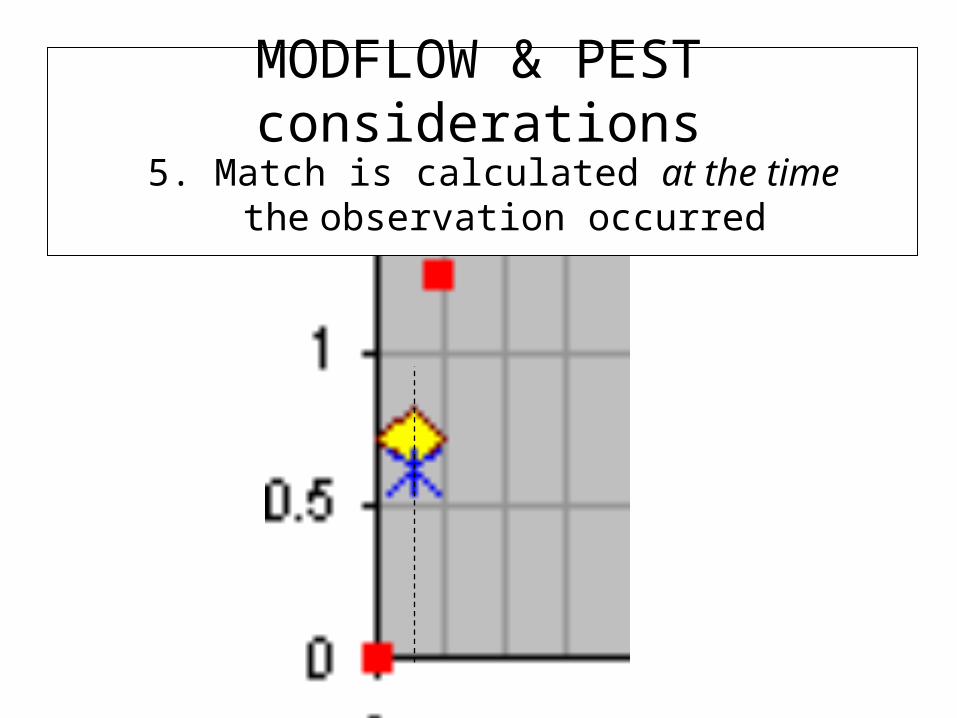
MODFLOW & PEST considerations
5. Match is calculated at the time the observation occurred

Something to think about:
MODFLOW
AquiferParameters
PE
ST
ESPAM 1.XProcess
MODFLOW
AquiferParameters
FORTRANRech. Tool
RechargeParameters
ESPAM 2.0Process?

Something to think about:
MODFLOW
~ 200 AquiferParameters
ESPAM 1.XProcess
runtime w/
44 stressperiods:a few seconds
PE
ST
Total PEST
runtime about 12 hrs.

Something to think about:
runtime w/324 stressperiods: ???
Total PESTruntime ????
MODFLOW
??? AquiferParameters
FORTRANRech. Tool
??? RechargeParameters
ESPAM 2.0Process?
runtime w/324 stressperiods: ???
runtime w/44 stressperiods: a few minutes

Overview of Recharge Tool

Review of Recharge Tool
• GIS tool – ArcGIS 8.x or 9.x– GW Modeling Toolbar (ArcGIS extension)– ESPAM.exe
• FORTRAN tool – Readinp.exe

Review of Recharge Tool
• GIS tool – ArcGIS 8.x or 9.x– GW Modeling Toolbar – ESPAM.exe
• FORTRAN tool – Readinp.exe
Data handling
Calculations

Input Data
GIS Points
GIS Lines
GIS Polygons
GIS Rasters
Tables
GIS Tool
Model Grid
Output Tables in Specific
Format
Start Creating Output Tables
(Stolen from May Training slides)

Output files Created by GIS Tool• .mdl - simulation and
scenario information
• .cel - model grid information
• .pch - perched reaches
• .trb - tributary underflow
• .cnl - canal seepage data
• .sol - soils
• .pre - precipitation
• .div - diversions and returns
• .fpt - fixed point sources and withdrawals
• .off - offsite ground water pumping
• .ent - irrigation entities
• .iar - irrigated agriculture
• .eti - irrigated lands evapotranspiration
• .red - irrigation discount table
• .nir - recharge on non-irrigated lands
• .spt - scenario sources and withdrawals
(Stolen from May Training slides)

GIS tool explicitly represents every stress period:
• .pch - perched reaches
• .trb - tributary underflow
• .cnl - canal seepage data
• .pre - precipitation
• .div - diversions and returns
• .fpt - fixed point sources and withdrawals
• .off - offsite ground water pumping
• .iar - irrigated agriculture
• .eti - irrigated lands evapotranspiration
• .red - irrigation discount table
• .nir - recharge on non-irrigated lands
• .spt - scenario sources and withdrawals

GIS tool uses single representation for entire simulation:
• .mdl - simulation and scenario information
• .cel - model grid information
• .ent - irrigation entities
• .sol - soils data

• .pch - perched reaches • .pre - precipitation• .div - diversions and
returns*• .fpt - fixed point sources
and withdrawals
• .off - offsite ground water pumping
• .eti - irrigated lands evapotranspiration
• .spt - scenario sources and withdrawals
Native data frequencyis one month or better
* interpolation will be required for a few small entities

Data frequency longer than one month but this matches physical
reality
• .mdl - simulation and scenario information
• .cel - model grid information
• .sol - soils
• .iar - irrigated agriculture
• .red - irrigation discount table
• .cnl - canal seepage data*
• .ent - entity data
* maybe

Data frequency is longer than one month, adjustment may be needed
• .trb - tributary underflow • .nir - recharge and non-irrigated lands

END
Courtesy Rick Allen