1 newly certified teachers: experiences of and opinions about teacher induction in illinois brenda...
TRANSCRIPT

1
Newly Certified Teachers:Experiences of and Opinions About
Teacher Induction in Illinois
Brenda K. KlostermannIllinois Education Research Council
Southern Illinois University Edwardsville
American Evaluation Association, November 2004
Website: ierc.siue.edu

2
Background
• First year is “sink or swim” experience.• Nationally, approximately 25% of new
teachers leave within first three years (2000 Quality Counts).
• Between 32% and 40% of Illinois’ public school teachers leave within 5 years (Presley 2002).
• Research indicates induction activities can help reduce the attrition of new teachers.

3
Methods
• Telephone interviews in Nov-Dec 2001
• Two random samples– Starters: initially certified in SY1999/2000 and working as
a regular teacher in IPS in 2000/01(n=353)
– Stayers: certified in SY1994/95 and working as a regular teacher in IPS in 1999/2000 and 2000/01 (n=381)
• Survey questions – Baccalaureate and Beyond Longitudinal Study– Survey of California Teachers– additional questions specifically for this study

4
Induction Activities
• Workshops aimed at new teachers• Access at school/district expense to topical
workshops• Mentoring from an experienced teacher• Release time to observe other teachers• Observation by an experienced teacher• Access to technologies to assess and try out in
classroom applications• Reduced duties (e.g., no committee work)• Support sessions with school administrators

5
Number of Induction Activities Received
13
58
15 15
21
15
2
12 1316 17
129
11
18
8
0
10
20
30
0 1 2 3 4 5 6 7 8
# of activities
% o
f re
sp
on
de
nts
Starters Stayers
6
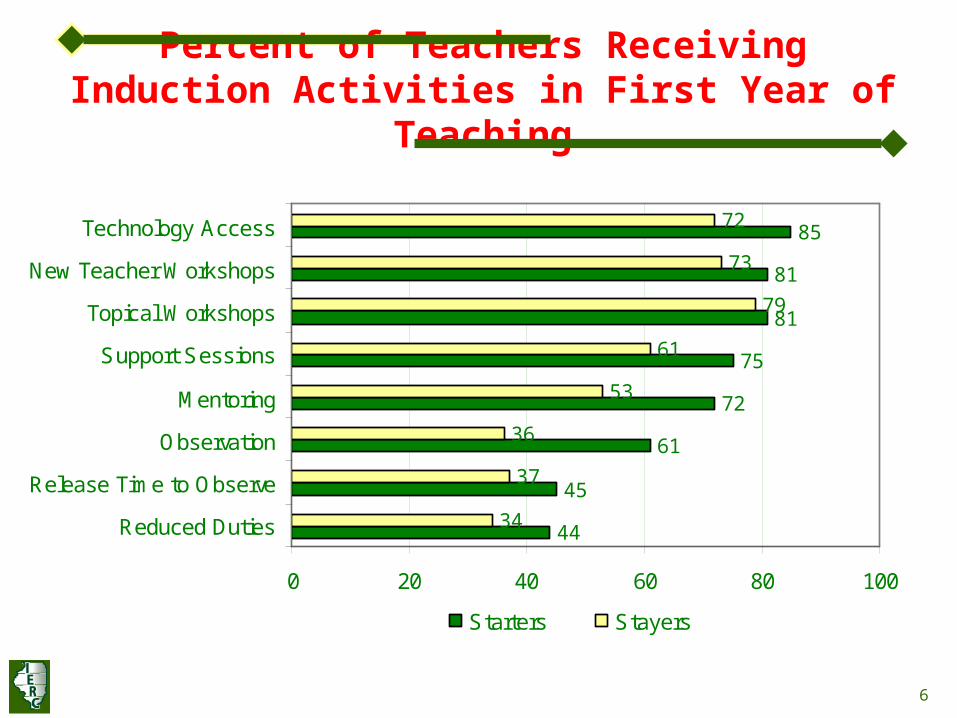
Percent of Teachers Receiving Induction Activities in First Year of Teaching
44
45
61
72
75
81
81
85
34
37
36
53
61
79
73
72
0 20 40 60 80 100
Reduced Duties
Release Time to Observe
Observation
Mentoring
Support Sessions
Topical Workshops
New Teacher Workshops
Technology Access
Starters Stayers

7
Percent of Teachers Rating Induction Activities as “Very Helpful”
36
38
38
41
44
53
55
56
31
35
42
31
36
44
52
54
0 20 40 60 80 100
New Teacher Workshops
Observation
Release Time to Observe
Support Sessions
Reduced Duties
Topical Workshops
Mentoring
Technology Access
Starters Stayers

8
Is participation in induction activities related to staying in teaching for new IL teachers?
• “Intention to teach in 2006” is proxy for “staying in teaching”
• Three measures of participation– Type of activity – Number of activities– Perceived helpfulness of activities

9
Starters’ Participation in Induction Activities by Their Intentions to Teach in IPS in 2006
p=.05
% Intending to Teach in
Fall 2006
Induction Activity ParticipatedDid Not
Participate
Reduced Duties 87% 70%
Release Time to Observe 84% 72%
Topical Workshops 81% 63%
Access to Technologies 80% 60%
Observation by Exp. Teacher 80% 73%
Support Sessions 78% 77%
New Teacher Workshops 77% 78%
Mentoring 76% 82%

10
Number of Induction Activities Received By Starters, by Intention to Teach in IPS in 2006
% Intending to Teach in
Fall 2006
# of Induction
Activities ReceivedYes
No and
Not Sure
1 activity 67% 33%
2 activities 67% 33%
3 activities 70% 30%
4 activities 72% 28%
5 activities 64% 36%
6 activities 84% 16%
7 activities 85% 15%
8 activities 87% 13%
p=.05
11
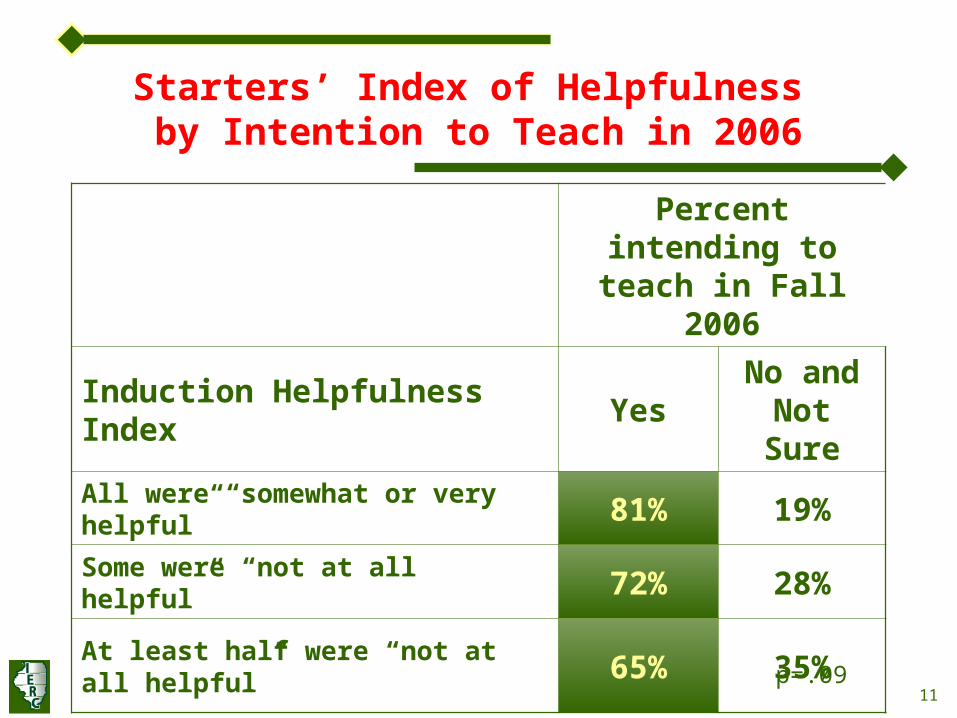
Starters’ Index of Helpfulness by Intention to Teach in 2006
Percent intending to teach in Fall 2006
Induction Helpfulness Index YesNo and
Not Sure
All were “somewhat or very helpful” 81% 19%
Some were “not at all helpful” 72% 28%
At least half were “not at all helpful” 65% 35%
p=.09
12
Role of Teacher Satisfaction in Intentions to Continue Teaching
• Teachers satisfied with their position are more likely to intend to teach in 2006
• Teachers who found induction activities helpful were more satisfied with their jobs.
• Satisfaction was higher for teachers who received more induction activities
• Caution in ascribing causality due to nature of the study.

13
Factors Related to Starters’ Intentions to be Teaching in 2006
Number of Induction Activities Received
Satisfaction with Teaching Position
Intention to Teach in 2006
Perceived Helpfulness of Induction Activities
+
+
+
+
++
+Participation in:
Support SessionsTopical WorkshopsRelease TimeAccess to TechnologyReduced Activities
14
Recommended Strategies for Retaining Teachers
• Provide specific induction activities.
• Provide as many different activities as possible.
• Comprehensive induction programs likely reflect professional learning environments that are supportive of their teachers. In turn, increased teacher retention will improve schools as learning environments for students.

15
The Illinois Teacher StudyLooked at career plans and experiences of random
samples of • Teachers newly certified in 1999-2000 - the
starters and non/delayed starters; and• Teachers leaving Illinois Public schools after
1999-2000 with 1 to 5 years’ teaching experience - the leavers
• Respondents were representative of respective populations – except Chicago region (under-represented by about 10 percentage points)

16
The Starters
• 95% intended to be teaching in Illinois public schools after their first year of teaching (Fall 2002)
• 77% intended to be teaching in Illinois public schools in Fall 2006– 13% were undecided

17
Starters’ Participation in Induction Activities by Their Intentions to Teach in IPS in 2006
Percent intending to teach in Fall 2006
Induction Activity Participated
Did Not Participate
Reduced duties 87% 70%
Release time to observe other teachers
84% 72%
Topical workshops 81% 63%
Access to computers and other technologies
80% 60%
p=.05