1. modeling framework for water resources … shamir, [email protected] ... modeling report no 15...
TRANSCRIPT

Kickoff Workshop 18 October 2012
NOAA Climate and Societal Interactions Sectoral Applications Research Program
Water Resource Management
WRRC - HRC
1. Modeling framework for water resources management
under uncertain conditions
Eylon Shamir, [email protected]
Hydrologic Research Center
12555 High Bluff Drive suite 255
San Diego, CA 92130
Tel: (858) 461 4560
www.hrc-web.org

Hydrologic Research Center, San Diego
The Hydrologic Research Center is a public benefit
nonprofit organization.
HRC’s goal is to help bridge the gap between scientific
research and applications for the solution of important
societal problems that involve water.
Definition Uncertainty
Uncertainty: The lack of certainty, A state of having limited knowledge
where it is impossible to exactly describe the existing state, a future
outcome, or more than one possible outcome.
http://www.cartoonsbyjosh.com/uncertainty.html
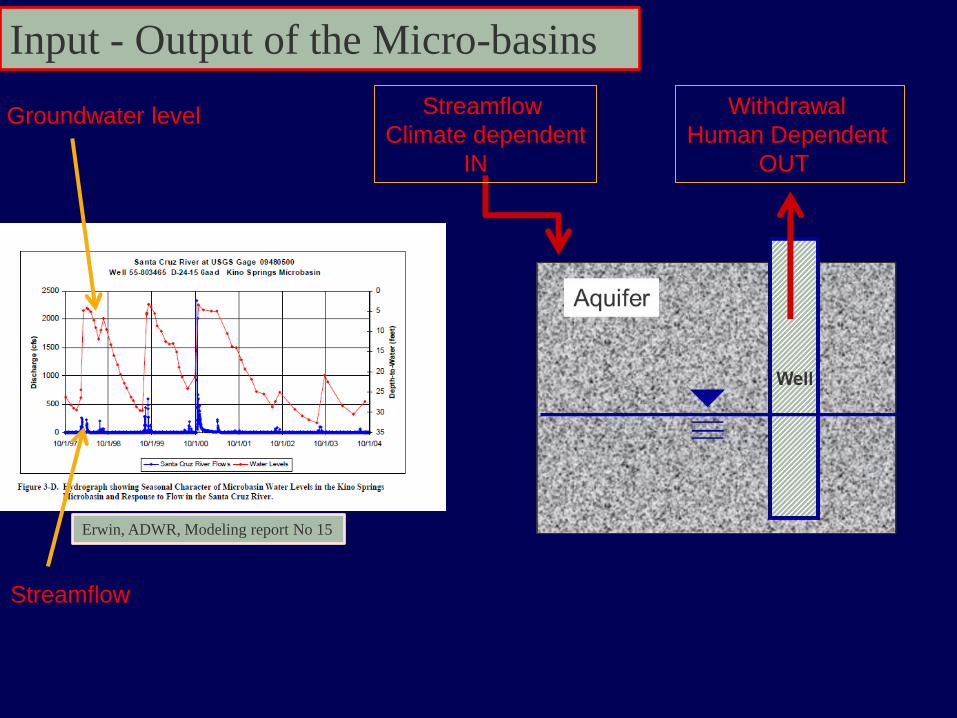
Withdrawal
Human Dependent
OUT
Streamflow
Climate dependent
IN
Erwin, ADWR, Modeling report No 15
Input - Output of the Micro-basins
Groundwater level
Streamflow

Seasonal Precipitation & Streamflow
complications for future planning
1950 1960 1970 1980 1990 2000 20100
50
100
150
200
250
300
350
400
Years
Ra
infa
ll (m
m/s
ea
so
n)
Nogales Gauge
Winter
Summer
1950 1960 1970 1980 1990 2000 20100
2
4
6
8
10
12x 10
4
Years
Str
ea
mflo
w (
10
00
m3/s
ea
so
n)
Nogales Gauge
Winter
Summer

Summer-Winter Streamflow Hydrographs
0 20 40 60 80 100 120 140 1600
1
2
3
4
WINTER 1996
Days 1 November- 31 March
Str
ea
mflo
w (
cfs
)0 10 20 30 40 50 60 70 80 90 100
0
50
100
150
200
SUMMER 1996
Days 1 June- 31 September
Str
ea
mflo
w (
cfs
)

Trends in summer (July-Aug) flow
Rain
Flow
Rain
Flow

Pool and Coes 1999 similar trend in Charleston gauge San Pedro
Thomas, B. E. (2007), JAWRA, 43, 1550-1569.
1910 1920 1930 1940 1950 1960 1970 1980 1990 20000
5
10
15
Years
Cou
nt
of
Eve
nts
Nogales
Laveen
Tucson
Lochiel
1910 1920 1930 1940 1950 1960 1970 1980 1990 20000
0.2
0.4
0.6
0.8
1
YearsN
orm
alize
d t
ota
l sum
me
r flo
w
Num
ber
of E
vents
Norm
aliz
ed T
ota
l
Sum
mer
Flo
w
Trends in summer (July-Aug) flow
Winter
Summer
Objectives of NOAA (SARP) Project
1. Develop water resources decision support modeling
framework that addresses future climate
uncertainties
2. Increase stakeholders capacity to adapt water
planning and management to future climate
uncertainties
3. Establish transferability of the modeling approach
and capacity building approach

HRC 2005 study
[Sponsored by AZDWR /SCAMA]
Develop a method that produces likely future
streamflow scenarios at the Nogales USGS Gauge
site.
Develop a modeling system that represents the physical
basin processes.
Generate an ensemble of likely future streamflow scenarios
Evaluate the future streamflow scenarios ensemble

A Proposed Modeling Framework
Threshold
Water withdrawal
Historical/ Future Scenarios
Well
Groundwater level
Chance to drop
bellow the t-hold
Aquifer
Risk Analysis
Model (machine) that represents the uncertainty in climate.
Generates Ensemble of Likely Streamflow scenarios
Threshold

Study Area
&
Modeling Scheme Q1
I1 Q2 = Q1-I1Santa Cruz River
ET1
P1
Buena Vista(2740 ac/ft)
Kino Springs(4020 ac/ft)
Highway 82(5910 ac/ft)
Guevavi7950 (ac/ft)
Q1
I1 Q2 = Q1-I1Santa Cruz River
ET1ET1
P1
Buena Vista(2740 ac/ft)
Kino Springs(4020 ac/ft)
Highway 82(5910 ac/ft)
Guevavi7950 (ac/ft)
Simulation of Precipitation Vs. Streamflow
Precipitation (Pros)
Better linked to climatic forcing and global circulation
Less affected by geomorphological changes and human
activity in regional scale.
Independent of the basin antecedent condition
Precipitation (Cons)
Point measurement rather than areal measurement that
contributes to the flow.
Requires a model (additional uncertainty) to transform into
streamflow

0 50 100 150 200 250
0.1
0.2
Inch
es
Winter 1969 (Hours)
0 50 100 150 200 250
0.5
1
1.5
Inch
es
Summer 1969 (Hours)
Winter Hourly Precipitation (Dec 68- Feb 69)
Summer Hourly Precipitation (Jul 69- Aug 69)
Hourly precipitation model components


0 20 40 60 800
100
200
300
400
500
600
700SUMMER
0 20 40 60 800
100
200
300
400
500
600
700
800WINTER
Likely Rainfall Scenarios
Performance of 100 likely Realizations
mm
/Season
Years
Nogales Rain Gauge 1949-2010

Modeling Scheme
Basin: Hourly rainfall Generator
of likely scenarios
Border Crossing: Daily
streamflow model
Micro basins: Groundwater
Storage changes
Long term assessment for various
management schemes
Raingauge data Paleo reconstruction of
Tree Ring
Future climate scenarios
from output of
dynamically downscaled
climate models
Mesoscale model
Gauge Streamflow data
Groundwater data AZDWR
Groundwater Model

Example of Possible Results
Various water consumption
scenarios
Q1
I1 Q2 = Q1-I1Santa Cruz River
ET1
P1
Buena Vista(2740 ac/ft)
Kino Springs(4020 ac/ft)
Highway 82(5910 ac/ft)
Guevavi7950 (ac/ft)
Q1
I1 Q2 = Q1-I1Santa Cruz River
ET1ET1
P1
Buena Vista(2740 ac/ft)
Kino Springs(4020 ac/ft)
Highway 82(5910 ac/ft)
Guevavi7950 (ac/ft)
Uncertainty Bounds
Median
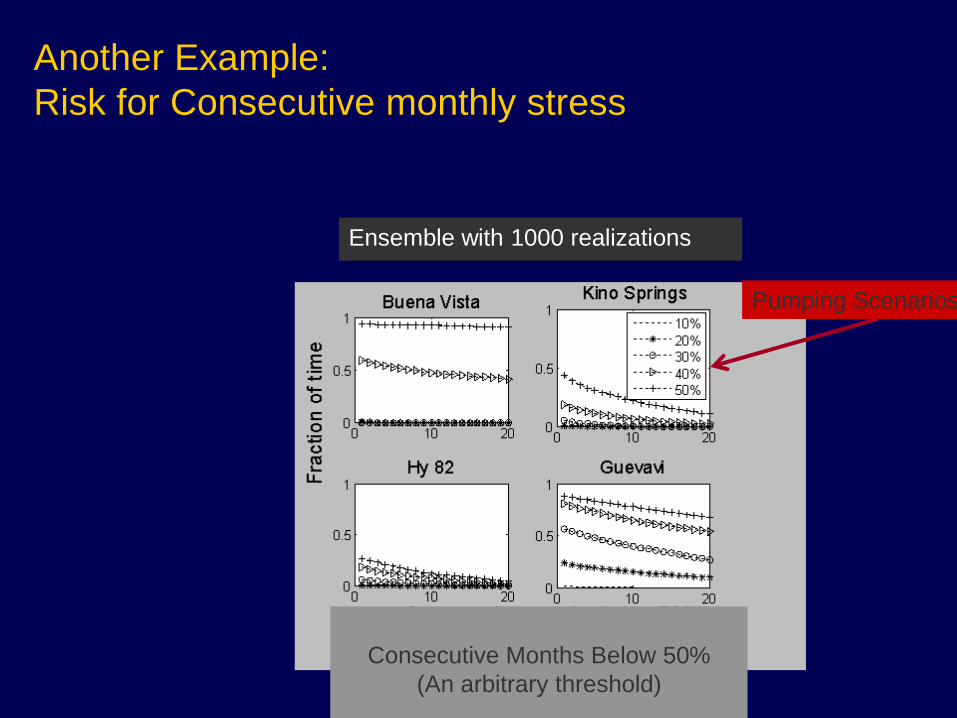
Ensemble with 1000 realizations
Another Example:
Risk for Consecutive monthly stress
Consecutive Months Below 50%
(An arbitrary threshold)
Pumping Scenarios

Nelson, K. WATER RESOURCE RISK ANALYSIS MODELING IN THE SANTA CRUZ
AMA, Arizona Department of Water Resources Arizona Hydrological Society 2009
Groundwater Level under different Pumpage Scenarios

Shamir, E., J. Wang, and KP. Georgakakos. 2007. Probabilistic streamflow
generation model for data sparse arid watersheds, Journal of American Water
Resources Association 43(5) 1142-1154.
Shamir, E., NE. Graham, DM. Meko, and KP. Georgakakos. 2007. Hydrologic
model for water resources planning in Santa-Cruz River, Southern Arizona, Journal
of American Water Resources Association 43(5) 1155-1170.
Shamir E., NE. Graham, J Wang, DM Meko, and KP Georgakakos. Stochastic
streamflow scenarios for the Santa-Cruz River at the Nogales gauge, Prepared for
the Arizona Department of Water Resources, Santa Cruz, AMA, Hydrologic
Research Center Technical Report No. 4, December 2005.
http://www.hrc-lab.org/projects/dsp_projectSubPage.php?subpage=santacruz
References


Kickoff Workshop 18 October 2012
Eylon Shamir, [email protected]
Hydrologic Research Center
12555 High Bluff Drive suite 255
San Diego, CA 92130
Tel: (858) 461 4560
www.hrc-web.org
NOAA Climate and Societal Interactions Sectoral Applications Research Program
Water Resource Management
WRRC - HRC
2. Incorporating climate change information into the
water resources management model

Objectives of NOAA (SARP) Project
1. Develop water resources decision support modeling
framework that address future climate uncertainties
2. Increase stakeholders capacity to adapt water
planning and management to future climate
uncertainties
3. Establish transferability of the modeling approach
and capacity building approach

Winter / Summer
Wet Medium Dry
Inter-arrival time of clusters
Duration of clusters
Chance for hour rainfall
Hourly rainfall magnitude
Fall / S
prin
g
Paleo Tree Ring Reconstruction
Annual/Seasonal Data
Climate model Scenario
Annual/seasonal to sub daily

Precipitation estimates from tree-rings
Winter
Current record
Meko 2005
Pre
cipit
atio
n
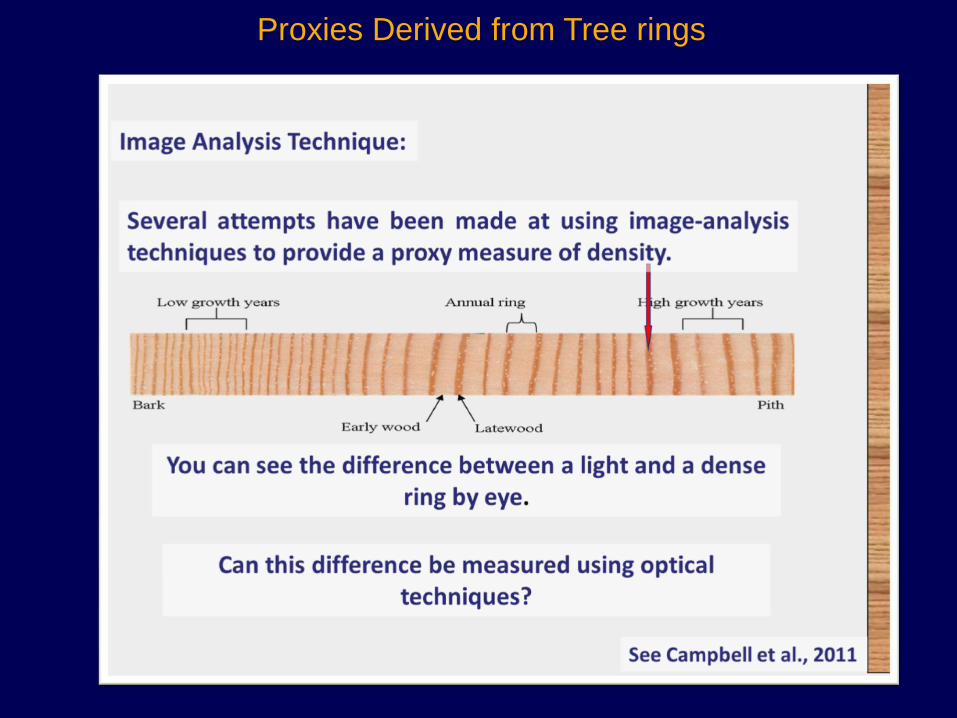
Proxies Derived from Tree rings

Ensemble of 100 realizations using the tree ring
reconstruction of precipitation
1950 1960 1970 1980 1990 2000 20100
2
4
6
8
10
12x 10
4
Years
Str
ea
mflo
w (
10
00
m3/s
ea
so
n)
Nogales Gauge
Winter
Summer

Future Climate
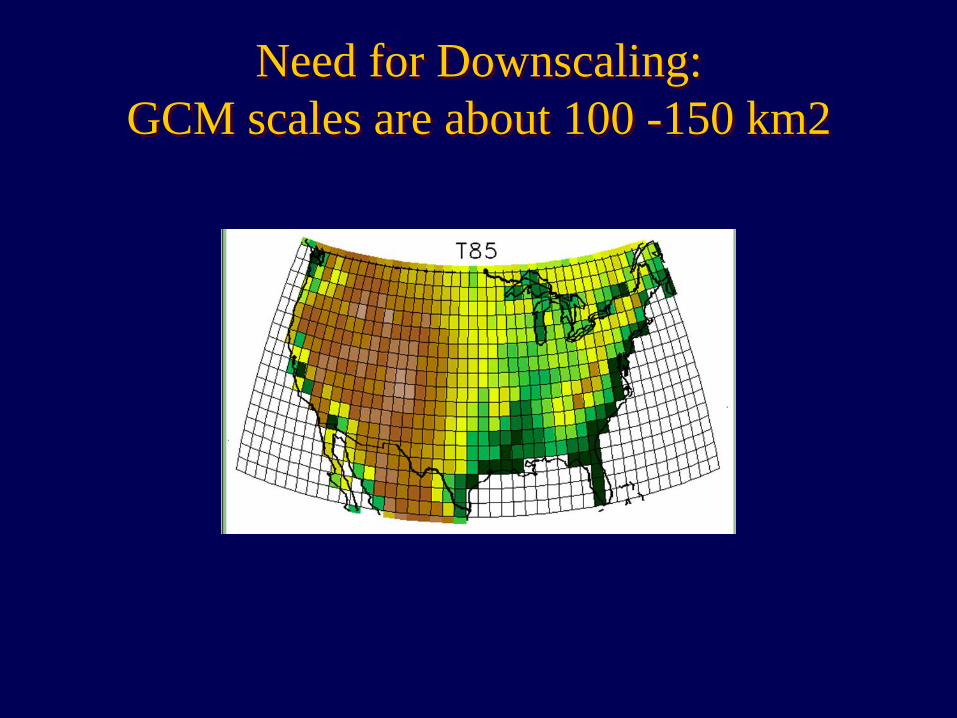
Need for Downscaling:
GCM scales are about 100 -150 km2

Sources of Downscaled Climate Precipitation Datasets Available
for this Project
Dynamically downscaled two climate models to 35 km2, 6-hour, 1950-2100, A1B
emission scenario (Middle of the road):
1. Hadley center (HADCM3)
2. Max Plunk (MPLAECHEM)
Data from NARRCAP: Multiple models at 50km2 at 3hour resolution 1970-2000
and 2040-2070
Regional reanalysis 1950-2010 will be also available at 35km2, 6-hours

Winter / Summer
Wet Medium Dry
Inter-arrival time of clusters
Duration of clusters
Chance for hour rainfall
Hourly rainfall magnitude
Fall / S
prin
g
Paleo Tree Ring Reconstruction
Annual/Seasonal Data
Climate model Scenario
Annual/seasonal to sub daily

Synthetic Rainfall Model Modification based on Climate
Model Projections
1. Compare downscaled model with observation record for the
historical period
2. Compare Future and Historic climate model simulations • Storm arrival frequency
• Duration of storms
• Magnitude of rainfall events
• Frequency of Wet/Medium/Dry for Winter/Summer
3. Modify the Synthetic model to represent the difference between
Past and Future

Synthetic rainfall model modification based on downscaled Climate Model
Projections
Downscaled
Climate Model
Historical
Period
Local Observed Records
Downscaled
Climate Model
Future Period
Synthetic Rainfall
Generation Model
for Historical
Likely Scenarios
Synthetic Rainfall
Generation Model
for Future Likely
Scenarios
Comparison
between
distributions
- Storm arrivals
- Duration of storms
- Magnitude of rainfall events
- Frequency of Wet/medium and Dry for
Winter/Summer
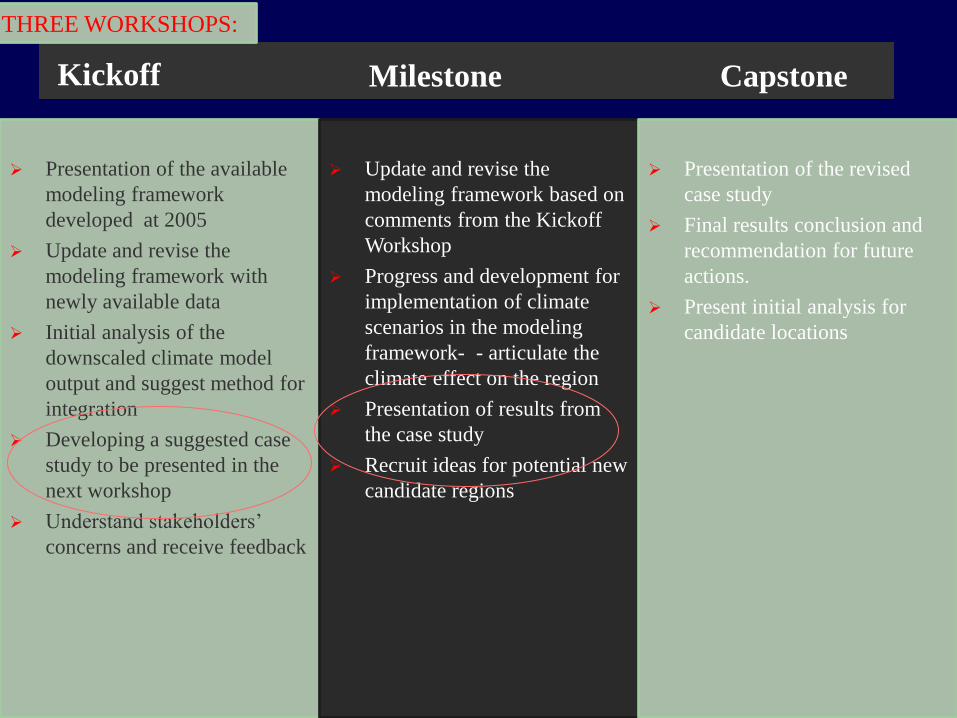
Kickoff
Presentation of the available
modeling framework
developed at 2005
Update and revise the
modeling framework with
newly available data
Initial analysis of the
downscaled climate model
output and suggest method for
integration
Developing a suggested case
study to be presented in the
next workshop
Understand stakeholders’
concerns and receive feedback
Milestone
Update and revise the
modeling framework based on
comments from the Kickoff
Workshop
Progress and development for
implementation of climate
scenarios in the modeling
framework- - articulate the
climate effect on the region
Presentation of results from
the case study
Recruit ideas for potential new
candidate regions
Presentation of the revised
case study
Final results conclusion and
recommendation for future
actions.
Present initial analysis for
candidate locations
Capstone
THREE WORKSHOPS:

Considerations for a Case Study
Future water demand projections (dependence on
climate variability?)
What are appropriate performance metrics?
GW level Thresholds (a range)?
period of stress?
Can we use this tool to inform the AWS regulation
process?

“The storm start when the drop start dropping when the drop stop dropping then the storm starts stopping” Dr. Suess


Steps to generate future likely streamflow scenarios
Rain prediction over the basin
Streamflow in the Santa Cruz
Groundwater replenishment Water demand of new developments
Economic and Social consequence for taking or not taking action

Winter / Summer
Wet Medium Dry
Inter-arrival time of clusters
Duration of clusters
Chance for hour rainfall
Hourly rainfall magnitude
Fall / S
prin
g
Paleo Tree Ring Reconstruction
Seasonal Data
Climate model Scenario
Seasonal to sub daily