1 introduction - lume.ufrgs.br
TRANSCRIPT
THE ASTROPHYSICAL JOURNAL SUPPLEMENT SERIES, 127 :39È58, 2000 March2000. The American Astronomical Society. All rights reserved. Printed in U.S.A.(
A SURVEY OF THE INTERSTELLAR MEDIUM IN EARLY-TYPE GALAXIES. III. STELLAR AND GASKINEMATICS1NICOLA CAON
Instituto de de Canarias Via Lactea s/n, La Laguna E-38200, Tenerife, Spain ;Astrof•� sica ncaon=ll.iac.es
DUCCIO MACCHETTO
Space Telescope Science Institute 3700 San Martin Drive, Baltimore, MD 21218 ; macchetto=stsci.edu
AND
MIRIANI PASTORIZA
Instituto de Fisica, UFRGS Av Bento Goncalves 9500, CP 15015 91500, Porto Alegre RS, Brazil ; mgp=if.ufrgs.brReceived 1999 June 28 ; accepted 1999 October 18
ABSTRACTWe present gaseous and stellar kinematics for 14 gas-rich early-type galaxies. Half of the sample
exhibit irregular gaseous velocity proÐles ; gas/star counter-rotation is visible in Ðve galaxies. We alsoÐnd Ðve counter-rotating stellar cores, while Ðve more galaxies display inner components kinematicallydecoupled from the main stellar body. We interpret our results as an indication that the ionized gas is ofexternal origin, is generally not in equilibrium, and may have been acquired recently. The merging oraccretion events that brought the gas into the galaxy have also a†ected the stellar kinematics.Subject headings : galaxies : elliptical and lenticular, cD È galaxies : ISM È
galaxies : kinematics and dynamics
1. INTRODUCTION
Several studies (Phillips et al. 1986 ; Kim 1989 ; Shields1991 ; Buson et al. 1993 ; Goudfrooij et al. 1994) have shownthat more than 50% of elliptical and lenticular galaxiescontain a substantial amount of ionized gas. As part of theESO Key-Program 1-004-43K: ““ Toward a physical under-standing of early-type galaxies,ÏÏ Macchetto et al. (1996,hereafter Paper I) have mapped the ionized gas in a sampleof 73 ellipticals and S0s through narrowband images cen-tered at the Ha and [N II] emission lines.
Gas emission was detected in about 3/4 of the samplegalaxies, with ionized gas masses ranging from 103 to 105
The line-emitting gas shows a wide range of morphol-M_
.ogies and sizes, from small, compact disklike distributionsto extended (up to 10 kpc) and complex Ðlamentary struc-tures. The properties of the ionized gas were found toexhibit interesting correlations with the global properties ofthe host galaxies (see also Goudfrooij 1996).
There is a clear correlation between Ha ] [N II] andX-ray luminosities, though some X-ray sources show noionized-gas emission. This correlation is in line with themodel proposed by Sparks & Collier-Cameron (1988) andSparks, Macchetto, & Golombek (1989), in which thermalelectron conduction causes energy to Ñow from the hotcoronal component into the cold gas, exciting it into emis-sion (while cooling the hot gas). The data presented inPaper I show indeed an excellent agreement between theobserved Ha ] [N II] Ñuxes and those predicted from theX-ray Ñuxes using this model.
While the relation between Ha ] [N II] luminosities andtotal B-band magnitudes is very loose, the correlation withthe B-band luminosity integrated within the regionoccupied by the ionized gas is much tighter and clearer.
1 Based on observations collected at the European Southern Observa-tory.
This suggests the role of hot, post-AGB stars as anadditional/alternative ionization mechanism. The ratiobetween the photon Ñux produced by hot, old stars, as pre-dicted by the model by Binette et al. (1994), and the photonsactually used or needed to ionize the gas, as computed forcase B recombination (Osterbrock 1974), is of order unity.
Other possible sources of excitation and ionization arephotoionization by hot young stars (Kim 1989 ; Shields1991), radiation originating in an active nucleus (Fosbury etal. 1982), and shocks (Heckman et al. 1989).
Which ionization mechanisms are dominant, andwhether and how their relative importance changes fromone object to another, is still an open issue.
The origin of the ionized gas, too, is a controversialsubject. Two of the main scenarios so far proposed are asfollows.
Cooling Ñows.ÈThe ionized gas is the product of coolingÑows in which the material lost by stars, heated to hightemperatures (D1 keV) by Supernovae explosions, coolsand condenses into Ðlaments (see Fabian 1994 for a review).However, this scenario cannot account for the remarkablecoexistence of gas and dust in the same spatial locations (seeFerrari et al. 1999) and cannot predict the correct energybudget of the gas emission.
External origin.ÈThe gas is accreted from other galaxiesduring mergers or close encounter events ; the ionizingmechanisms above mentioned can fully account for theenergy balance. This scenario can explain the coexistence ofgas and dust and is supported by the frequent detection ofkinematical decoupling between stellar and gaseous kine-matics in gas-rich early-type galaxies.
Several studies have shown indeed that in quite a fewelliptical and lenticular galaxies the angular momenta ofstars and gas are misaligned, or even antiparallel. Bertola etal. (1995) studied a sample of eight lenticular galaxies andfound that the gas can present central velocity gradientssteeper, equal to, or even shallower than the stellar velocity
39
40 CAON ET AL. Vol. 127
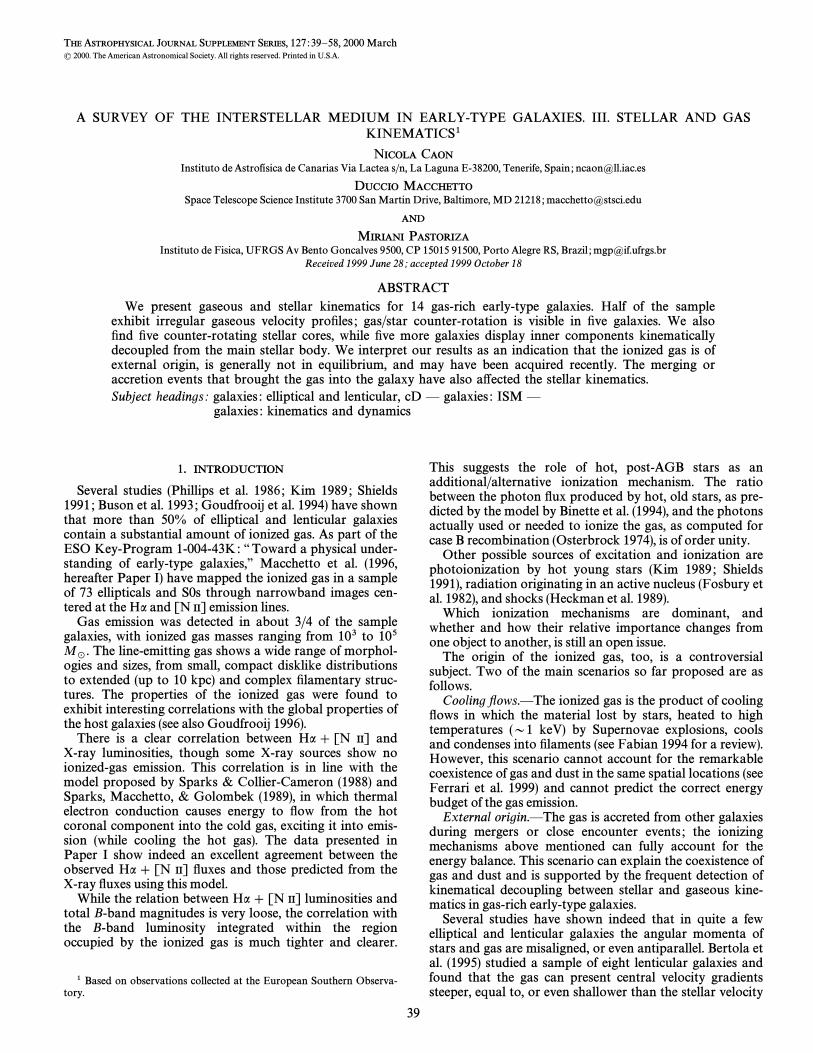
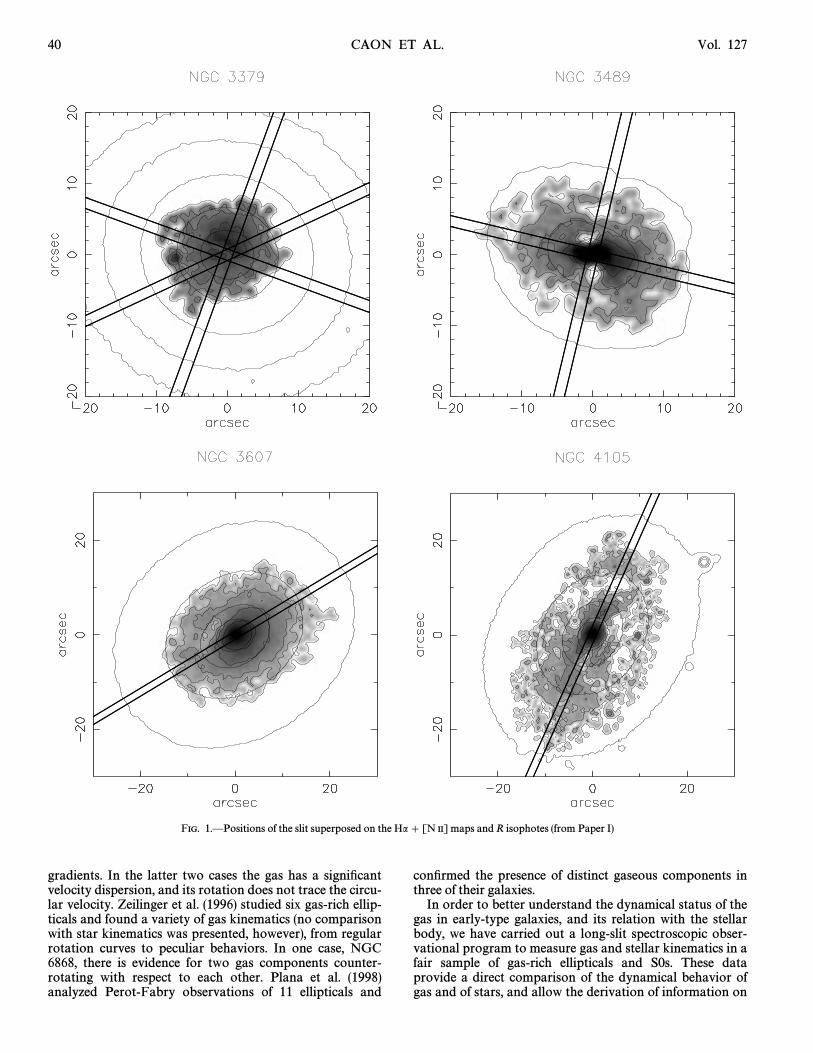
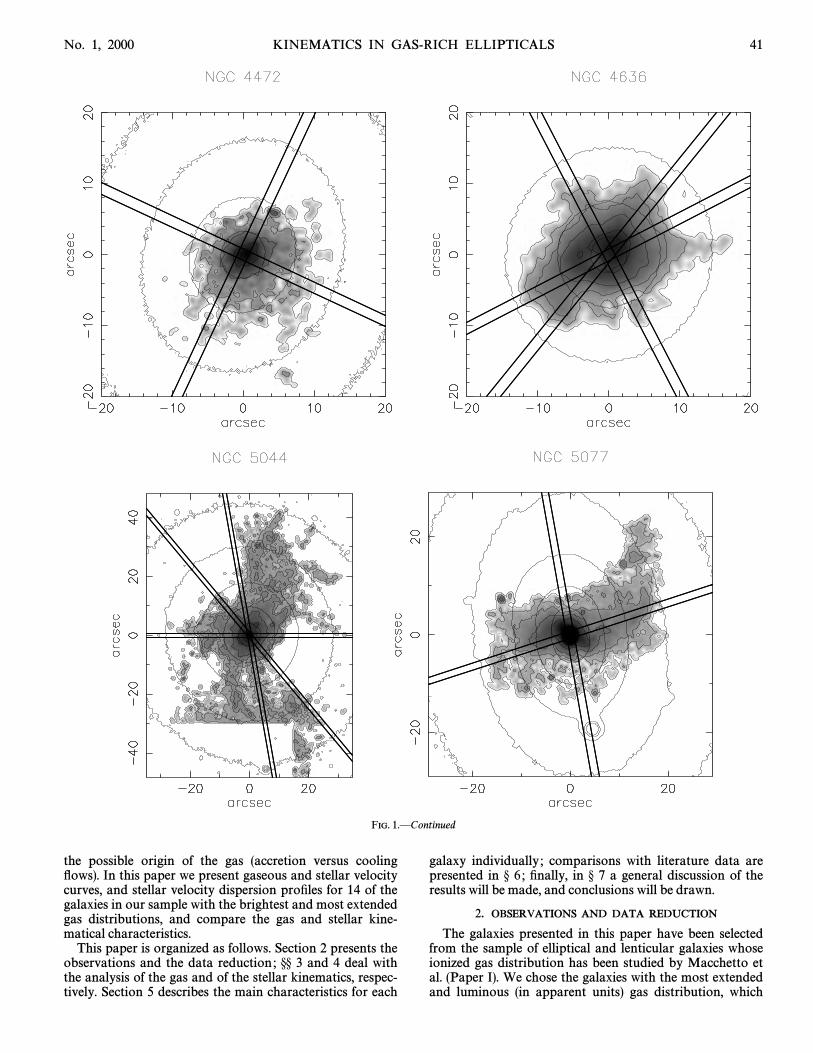
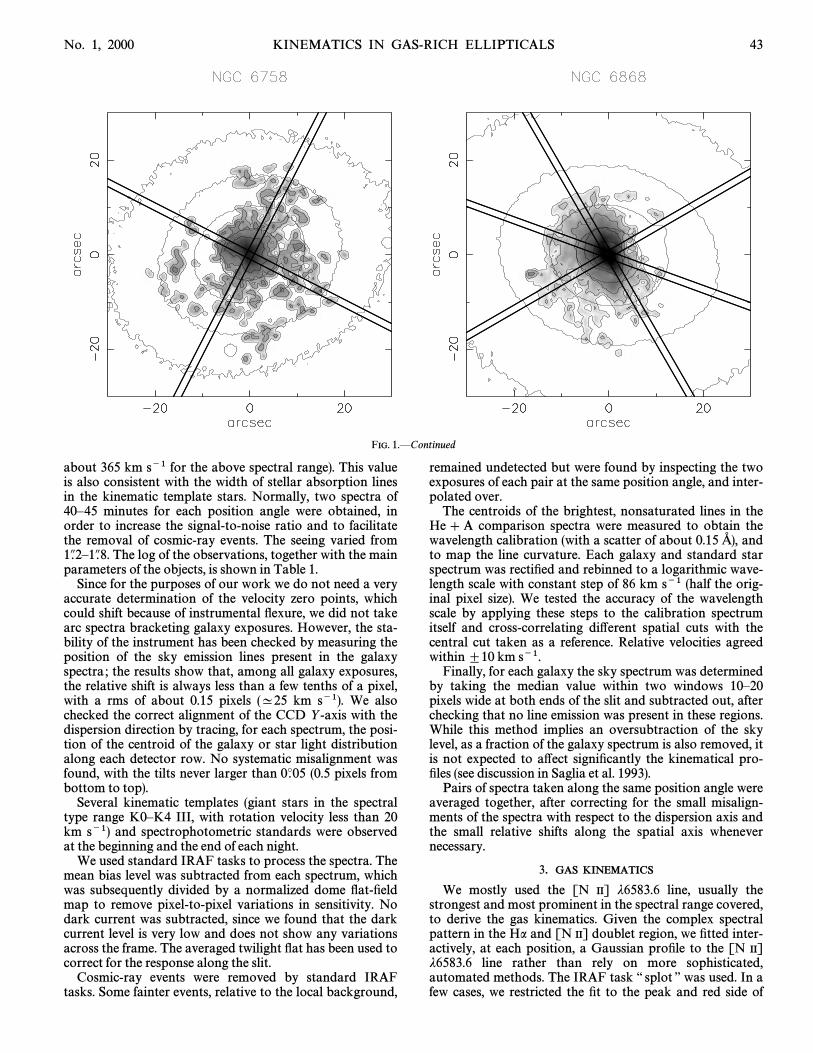
FIG. 1.ÈPositions of the slit superposed on the Ha ] [N II] maps and R isophotes (from Paper I)
gradients. In the latter two cases the gas has a signiÐcantvelocity dispersion, and its rotation does not trace the circu-lar velocity. Zeilinger et al. (1996) studied six gas-rich ellip-ticals and found a variety of gas kinematics (no comparisonwith star kinematics was presented, however), from regularrotation curves to peculiar behaviors. In one case, NGC6868, there is evidence for two gas components counter-rotating with respect to each other. Plana et al. (1998)analyzed Perot-Fabry observations of 11 ellipticals and
conÐrmed the presence of distinct gaseous components inthree of their galaxies.
In order to better understand the dynamical status of thegas in early-type galaxies, and its relation with the stellarbody, we have carried out a long-slit spectroscopic obser-vational program to measure gas and stellar kinematics in afair sample of gas-rich ellipticals and S0s. These dataprovide a direct comparison of the dynamical behavior ofgas and of stars, and allow the derivation of information on
No. 1, 2000 KINEMATICS IN GAS-RICH ELLIPTICALS 41
FIG. 1.ÈContinued
the possible origin of the gas (accretion versus coolingÑows). In this paper we present gaseous and stellar velocitycurves, and stellar velocity dispersion proÐles for 14 of thegalaxies in our sample with the brightest and most extendedgas distributions, and compare the gas and stellar kine-matical characteristics.
This paper is organized as follows. Section 2 presents theobservations and the data reduction ; °° 3 and 4 deal withthe analysis of the gas and of the stellar kinematics, respec-tively. Section 5 describes the main characteristics for each
galaxy individually ; comparisons with literature data arepresented in ° 6 ; Ðnally, in ° 7 a general discussion of theresults will be made, and conclusions will be drawn.
2. OBSERVATIONS AND DATA REDUCTION
The galaxies presented in this paper have been selectedfrom the sample of elliptical and lenticular galaxies whoseionized gas distribution has been studied by Macchetto etal. (Paper I). We chose the galaxies with the most extendedand luminous (in apparent units) gas distribution, which
42 CAON ET AL. Vol. 127
FIG. 1.ÈContinued
were visible at the time of the observations (excluding somealready well-studied objects such as NGC 4486 and NGC5102). For each galaxy, long-slit spectra were obtained at upto three position angles (P.A.), oriented along the main axesof the gas and/or stellar distributions. (In a few cases, wecould only observe a single P.A. due to bad weather).
The positions of the slit, superposed on a Ha ] [N II]image and R-band isophotes map, are shown in the panelsof Figure 1.
The observations were conducted at the ESO 3.6 m tele-scope on La Silla, Chile, equipped with EFOSC1. In order
to maximize the coverage of the relevant stellar absorptionand gaseous emission lines, without compromising the spec-tral resolution, we used the O150 grism in the range 5140È6900 with a dispersion of 3.4 pixel~1 with CCD 26A� A�(Tektronix 512 ] 512 pixels). The spatial scale is 0A.61pixel~1 ; the slit length was while its width was Ðxed [email protected],
approximately the average seeing. The actual spectral1A.5,resolution has been determined using both the He] Arlines in the arc spectra, and unblended sky lines present inthe exposures ; the agreement among the measurements isexcellent, giving 2.15 pixels FWHM (corresponding to
No. 1, 2000 KINEMATICS IN GAS-RICH ELLIPTICALS 43
FIG. 1.ÈContinued
about 365 km s~1 for the above spectral range). This valueis also consistent with the width of stellar absorption linesin the kinematic template stars. Normally, two spectra of40È45 minutes for each position angle were obtained, inorder to increase the signal-to-noise ratio and to facilitatethe removal of cosmic-ray events. The seeing varied from
The log of the observations, together with the main1A.2È1A.8.parameters of the objects, is shown in Table 1.
Since for the purposes of our work we do not need a veryaccurate determination of the velocity zero points, whichcould shift because of instrumental Ñexure, we did not takearc spectra bracketing galaxy exposures. However, the sta-bility of the instrument has been checked by measuring theposition of the sky emission lines present in the galaxyspectra ; the results show that, among all galaxy exposures,the relative shift is always less than a few tenths of a pixel,with a rms of about 0.15 pixels (^25 km s~1). We alsochecked the correct alignment of the CCD Y -axis with thedispersion direction by tracing, for each spectrum, the posi-tion of the centroid of the galaxy or star light distributionalong each detector row. No systematic misalignment wasfound, with the tilts never larger than (0.5 pixels from0¡.05bottom to top).
Several kinematic templates (giant stars in the spectraltype range K0ÈK4 III, with rotation velocity less than 20km s~1) and spectrophotometric standards were observedat the beginning and the end of each night.
We used standard IRAF tasks to process the spectra. Themean bias level was subtracted from each spectrum, whichwas subsequently divided by a normalized dome Ñat-Ðeldmap to remove pixel-to-pixel variations in sensitivity. Nodark current was subtracted, since we found that the darkcurrent level is very low and does not show any variationsacross the frame. The averaged twilight Ñat has been used tocorrect for the response along the slit.
Cosmic-ray events were removed by standard IRAFtasks. Some fainter events, relative to the local background,
remained undetected but were found by inspecting the twoexposures of each pair at the same position angle, and inter-polated over.
The centroids of the brightest, nonsaturated lines in theHe] A comparison spectra were measured to obtain thewavelength calibration (with a scatter of about 0.15 andÓ),to map the line curvature. Each galaxy and standard starspectrum was rectiÐed and rebinned to a logarithmic wave-length scale with constant step of 86 km s~1 (half the orig-inal pixel size). We tested the accuracy of the wavelengthscale by applying these steps to the calibration spectrumitself and cross-correlating di†erent spatial cuts with thecentral cut taken as a reference. Relative velocities agreedwithin ^10 km s~1.
Finally, for each galaxy the sky spectrum was determinedby taking the median value within two windows 10È20pixels wide at both ends of the slit and subtracted out, afterchecking that no line emission was present in these regions.While this method implies an oversubtraction of the skylevel, as a fraction of the galaxy spectrum is also removed, itis not expected to a†ect signiÐcantly the kinematical pro-Ðles (see discussion in Saglia et al. 1993).
Pairs of spectra taken along the same position angle wereaveraged together, after correcting for the small misalign-ments of the spectra with respect to the dispersion axis andthe small relative shifts along the spatial axis whenevernecessary.
3. GAS KINEMATICS
We mostly used the [N II] j6583.6 line, usually thestrongest and most prominent in the spectral range covered,to derive the gas kinematics. Given the complex spectralpattern in the Ha and [N II] doublet region, we Ðtted inter-actively, at each position, a Gaussian proÐle to the [N II]j6583.6 line rather than rely on more sophisticated,automated methods. The IRAF task ““ splot ÏÏ was used. In afew cases, we restricted the Ðt to the peak and red side of
44 CAON ET AL. Vol. 127
[N II] j6583.6, to minimize the inÑuence of the adjacent Hastellar absorption line, which can distort the shape of theblue wing.
We also measured, whenever the signal was good enough,Ha, [N II] j6548.1 and the [S II] doublet (which is generallyblended and was Ðtted as a sum of two Gaussians withequal FWHM). In general, these lines were found less usefulfor determining the gas kinematics : the Ha gaseous emis-sion is usually buried in the stellar absorption line, and onlyin a few objects it is clearly visible ; [N II] j6548.1 is faintand overlaps the blue wing of the Ha absorption line ; the[S II] lines are weaker than [N II] j6583.6, and only in a fewobjects we could obtain good determinations of their posi-tion. Whenever two or more lines could be reliably mea-sured at a given location, we computed the weightedaverage of the corresponding radial velocities.
In the outer regions, several rows were averaged together,with binning size increasing outward, to increase the signal-to-noise ratio.
The Gaussian Ðt algorithm in ““ splot ÏÏ also provides anestimate of the uncertainties in the derived quantities bymeans of Monte Carlo simulation. A number of simulationsof the spectrum are created by adding random Gaussiannoise, based on a statistical model of the data ; for eachsimulation, a Ðt is performed keeping Ðxed the backgroundlevel. The width of the distribution of the derived param-eters then gives an estimate of the associated uncertainties.
Further sources of error are the determination of the back-ground level, and possible distortions and asymmetries ofthe line proÐle.
A more realistic estimate of the uncertainties can beobtained from measurements made with di†erent back-ground levels, or from the scatter among di†erent spectrallines. These uncertainties depend on the local continuumand line strength and can be as large as 50È100 km s~1 ;they are included in our error bars.
Because of the resolution of our spectra (comparable toor larger than the typical gas dispersion velocity), andbecause line widths are very sensitive to the exact back-ground level adopted (much more so than the centroid ofthe line is), we could not produce gas velocity dispersionproÐles for the spectra. However, in a few spectra, where theline widths are signiÐcantly higher than the instrumentalwidth and show good agreement among di†erent lines, wecan give at least an estimate of the gaseous central velocitydispersion.
4. STELLAR KINEMATICS
A cross-correlation algorithm, working in pixel space, hasbeen used to derive the stellar kinematics. We followed themethod described by Dalle Ore et al. (1991), to which werefer the reader for more details. BrieÑy, for each galaxy andtemplate spectrum, a polynomial was Ðtted to the contin-uum and subtracted out. We have experimented with di†er-
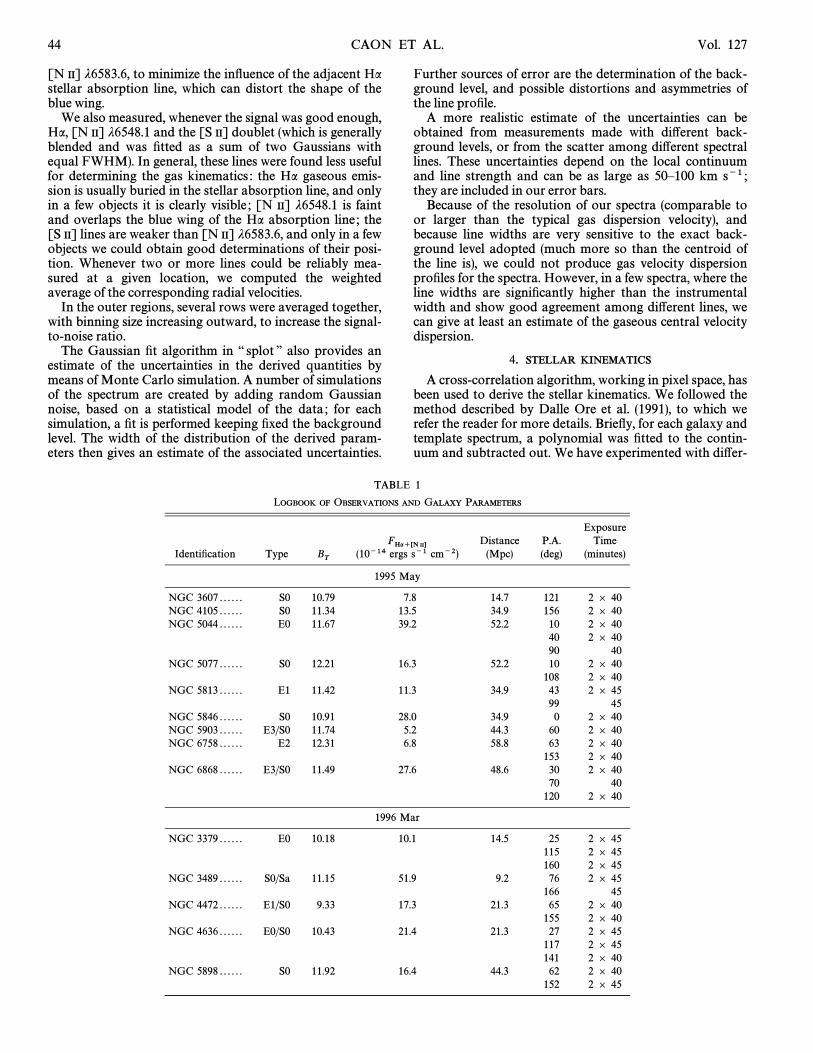
TABLE 1
LOGBOOK OF OBSERVATIONS AND GALAXY PARAMETERS
ExposureFHa`*N II+ Distance P.A. Time
IdentiÐcation Type BT
(10~14 ergs s~1 cm~2) (Mpc) (deg) (minutes)
1995 May
NGC 3607 . . . . . . S0 10.79 7.8 14.7 121 2 ] 40NGC 4105 . . . . . . S0 11.34 13.5 34.9 156 2 ] 40NGC 5044 . . . . . . E0 11.67 39.2 52.2 10 2 ] 40
40 2 ] 4090 40
NGC 5077 . . . . . . S0 12.21 16.3 52.2 10 2 ] 40108 2 ] 40
NGC 5813 . . . . . . E1 11.42 11.3 34.9 43 2 ] 4599 45
NGC 5846 . . . . . . S0 10.91 28.0 34.9 0 2 ] 40NGC 5903 . . . . . . E3/S0 11.74 5.2 44.3 60 2 ] 40NGC 6758 . . . . . . E2 12.31 6.8 58.8 63 2 ] 40
153 2 ] 40NGC 6868 . . . . . . E3/S0 11.49 27.6 48.6 30 2 ] 40
70 40120 2 ] 40
1996 Mar
NGC 3379 . . . . . . E0 10.18 10.1 14.5 25 2 ] 45115 2 ] 45160 2 ] 45
NGC 3489 . . . . . . S0/Sa 11.15 51.9 9.2 76 2 ] 45166 45
NGC 4472 . . . . . . E1/S0 9.33 17.3 21.3 65 2 ] 40155 2 ] 40
NGC 4636 . . . . . . E0/S0 10.43 21.4 21.3 27 2 ] 45117 2 ] 45141 2 ] 40
NGC 5898 . . . . . . S0 11.92 16.4 44.3 62 2 ] 40152 2 ] 45
No. 1, 2000 KINEMATICS IN GAS-RICH ELLIPTICALS 45
ent polynomial degrees and found that degrees around 20provided the best Ðt : lower degrees were unable to followadequately the continuum shape, while higher degreesmight present unwanted oscillations.
The resulting spectrum was cross-correlated with thespectrum of the kinematic template star. The central part ofthe cross-correlation function consists of two components :a broad baseline, due to residuals in the continuum subtrac-tion and blended features in the spectrum, on which anarrow and well deÐned peak is superposed. Because of themore accurate Ðt to the continuum performed here, therelative amplitude of the baseline with respect to the centralpeak is much smaller than in Dalle Ore et al. (1991 ; see theirFig. 4), being only about 10%È15% of the total signal. WeÐtted the wings of the baseline using a second-degree poly-nomial and subtracted it from the cross-correlation func-tion.
The central peak was then Ðtted with a Gaussian, whosecenter gives the radial velocity of the galaxy with respect tothe template star ; its width (i.e., the FWHM), after subtrac-ting in quadrature the width of the autocorrelation function(the template spectrum cross-correlated with itself ), pro-vides the width of the broadening function, i.e., the velocitydispersion.
Only the region of the spectrum blueward of j ^ 6500 Óhas been used, in order to prevent contamination of thecorrelation function by the emission lines. Residuals fromstrong sky lines were masked out.
In order to estimate the uncertainties on the stellar kine-matical measurements, rather than rely on the formal errorsprovided by the cross-correlation technique, we have fol-lowed a more empirical approach based on the assumptionof perfect symmetry between the two sides of each spectrum.This assumption is justiÐed by the high degree of symmetryshown by the stellar velocity and sigma proÐles, even inthose objects with kinematical peculiarities.
For each galaxy, we computed the di†erences in velocity(or more precisely, its absolute value) *V and in velocitydispersion *p between points located symmetrically withrespect to the kinematical center and associated them to thelocal line strength (i.e., the average signal in the absorptionlines), The data for all spectra have been mergedL
S.
together, and a smooth curve was then interpolatedthrough the data points in the and plots.L
S[ *V L
S[ *p
This curve was then used to compute the error bars for thedata points in each galaxy spectrum. We notice that thismethod cannot be applied to emission lines, since thegaseous kinematics often exhibits marked deviations fromregular and symmetric behavior.
Di†erent cross-correlation runs were performed on eachspectrum, using di†erent spatial bins. The results were thencombined, so as to maximize the spatial resolution in thecentral regions while smoothing out the noise in the exter-nal parts.
We have compared the velocity dispersions obtained foreach object using di†erent template stars or varying withinreasonable limits the parameters in the cross-correlationalgorithm; they all agree within ^5%, in line with what isreported in the literature. Final rotation curves and velocitydispersion proÐles were then obtained by averaging themeasurements from the di†erent templates, after bringingthem into a common reference system by correcting for theradial velocity (computed with respect to an appropriatesynthetic rest-frame spectrum) of each template.
We determined the stellar kinematical centers for eachspectrum by Ðnding the point about which the folded rota-tion and dispersion curves show the maximum kinematicalsymmetry. They generally agree with the photometriccenter to within ^2 pixel (1A.2).
5. RESULTS
Stellar and gas rotation curves and stellar velocity disper-sion proÐles are presented in Figure 2.2 They terminate atthe radial distance where the di†erences between the twosides become larger than the error bars, or when we judgethat the error bars are too large for the measurement to beof any use.
In a few cases, the radial extension on one side is smallerthan on the other, because of the presence of a foregroundstar or a companion galaxy falling on the slit.
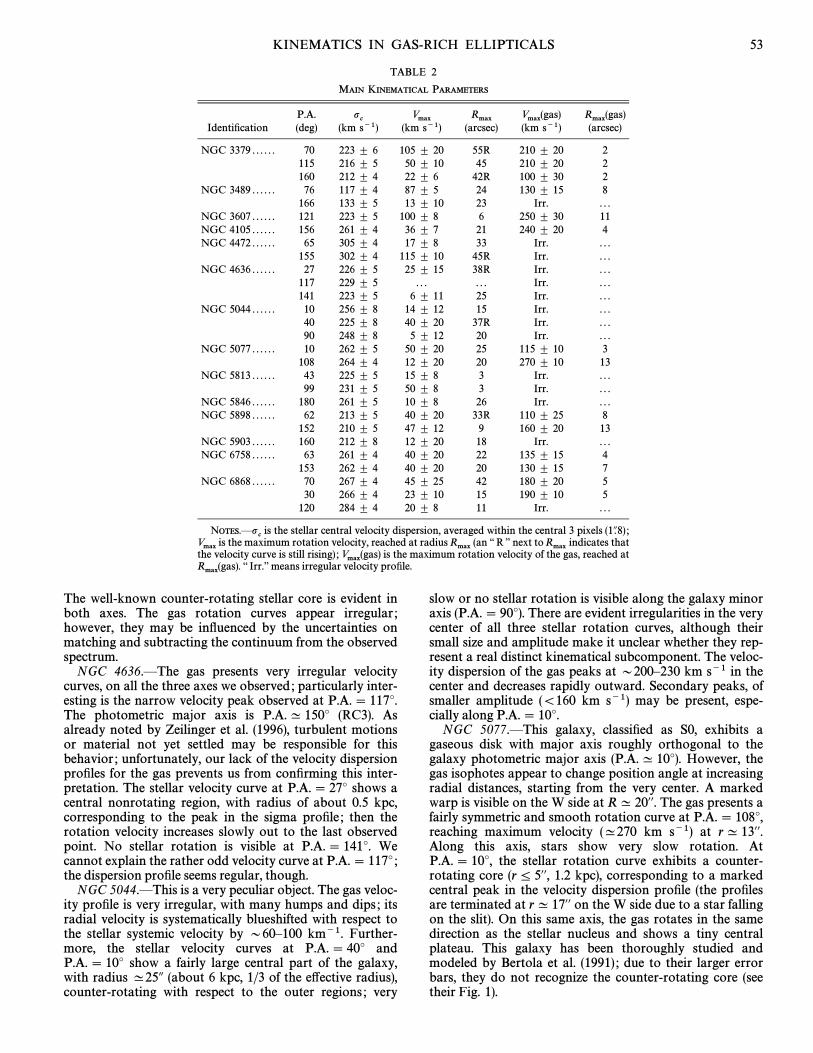
Table 2 lists the main kinematical parameters for thegalaxies studied. Maximum rotation velocities and corre-sponding radii for the gas are given only for those galaxieswith regular and symmetrical rotation curves.
In what follows we discuss the main kinematical charac-teristics and peculiarities of each galaxy in our sample.
NGC 3379.ÈThis nearby galaxy shows gas emission con-centrated in a small nuclear region. We were able to modelthe stellar continuum using the signal outside the line-emitting region (at r [ 10@@) and subtract it from the centralspectral rows. We then measured the position of the [N II]and Ha lines on the resulting continuum-free spectrum; reli-able data were obtained only in the central 5A. A detailedanalysis of the kinematic properties of this galaxy is present-ed in Pastoriza et al. (2000).
NGC 3489.ÈIn this lenticular, gas and stars show fastrotation along the major axis (P.A. \ 76¡) of the gas dis-tribution, which roughly coincides with the major axis ofthe stellar isophotes. The gas also shows rotation along theminor axis, though with a somewhat irregular behavior ; nostellar rotation is seen. There is evidence for a distinctnuclear stellar component (r ^ 3@@) : it is visible on the majoraxis as the central part of the rotation curve delimited bythe sharp discontinuities in its slope, and on the minor axisas a small rotating core.
NGC 3607.ÈFor this S0 galaxy, we only have data alongthe major axis (which is also the major axis of the gasdistribution). The gas rotation curve, which has a steepergradient than the stellar one, reaches its maximum at r ^ 7@@and then stays Ñat out to the last observed point (r ^ 16@@).The stellar rotation curve presents a maximum at r ^ 5@@and then decreases steadily ; the stellar velocity dispersionexhibits a central peak, then decreases slowly to p ^ 200 kms~1.
NGC 4105.ÈThis S0 was observed only along the majoraxis of the line-emitting region, a little skewed (^5¡) withrespect to the photometric major axis (P.A.\ 151¡ ; de Vau-couleurs et al. 1991, hereafter RC3). The gas rotates muchfaster and in the opposite direction to the stars and presentsa somewhat di†erent behavior on the two sides : the NWpart shows a less steep central gradient, and a dip at about13A.
NGC 4472.ÈWe obtained a continuum-free spectrum ofthe central part in the same way as we did for NGC 3379.
2 Kinematical data are provided in tabular form at CDS viahttp ://vizier.u-strasbg.fr/cgi-bin/VizieR?-source\J/ApJS/127/39 or ftp ://cdsarc.u-strasbg.fr/pub/cats/J/ApJS/127/39.
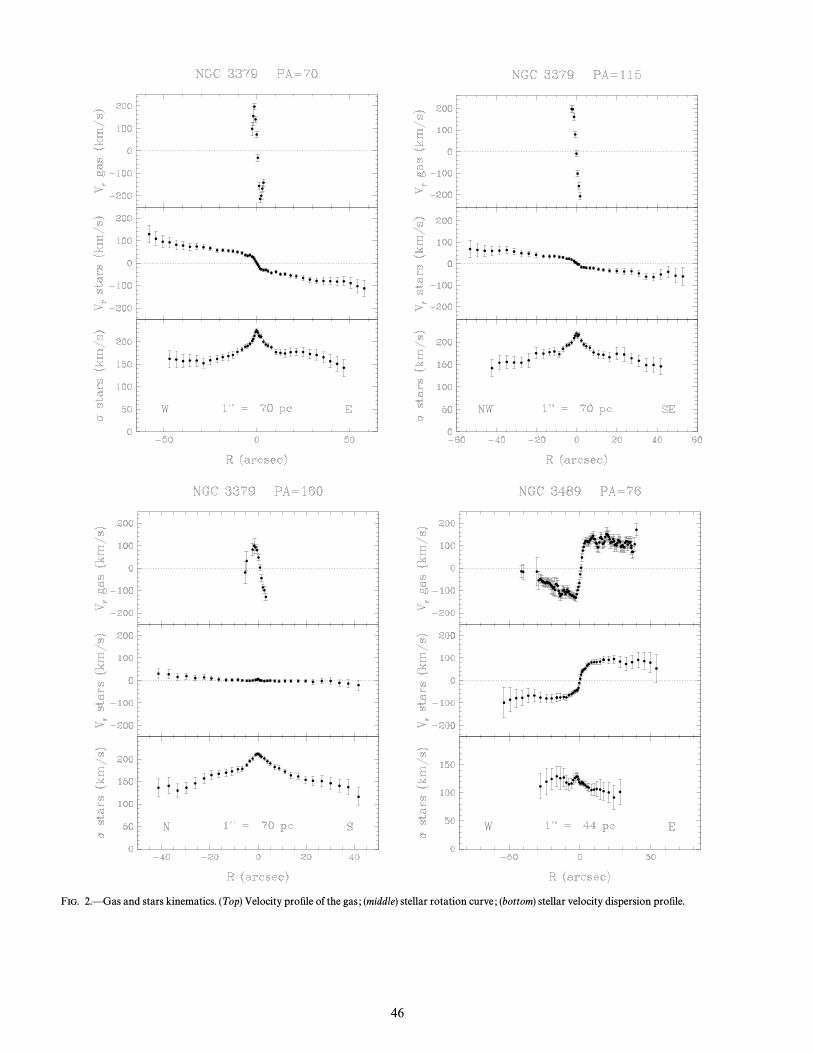
FIG. 2.ÈGas and stars kinematics. (Top) Velocity proÐle of the gas ; (middle) stellar rotation curve ; (bottom) stellar velocity dispersion proÐle.
46
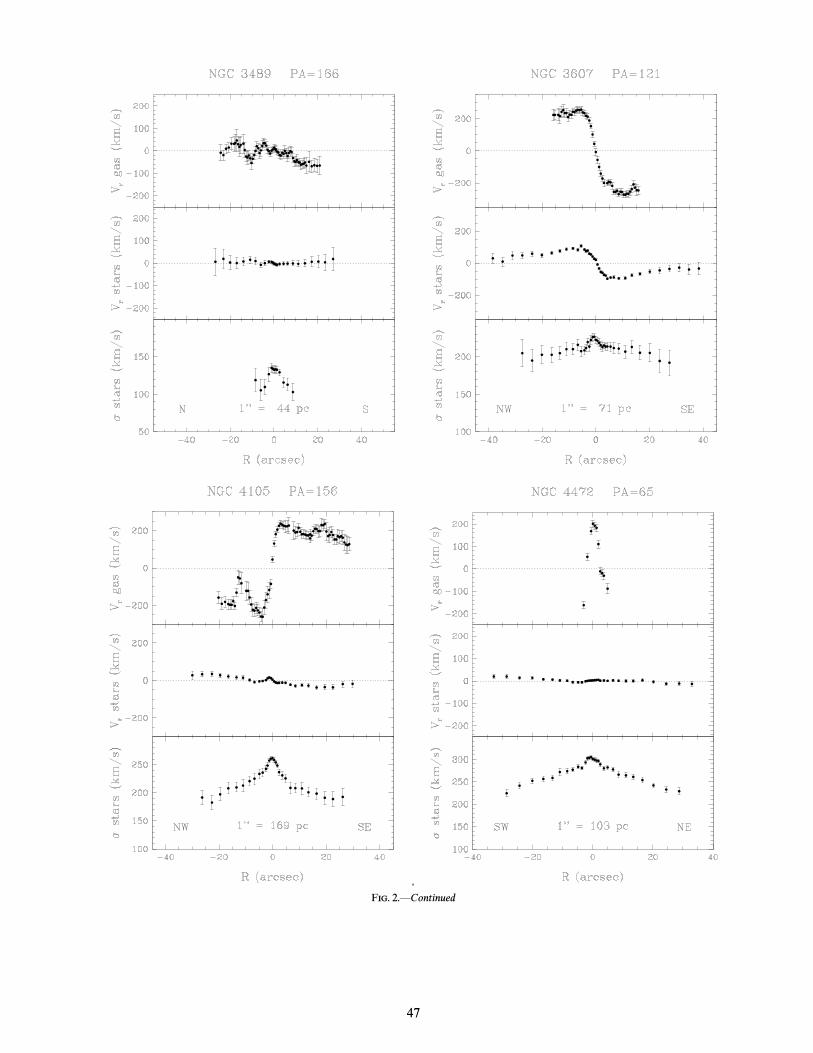
FIG. 2.ÈContinued
47
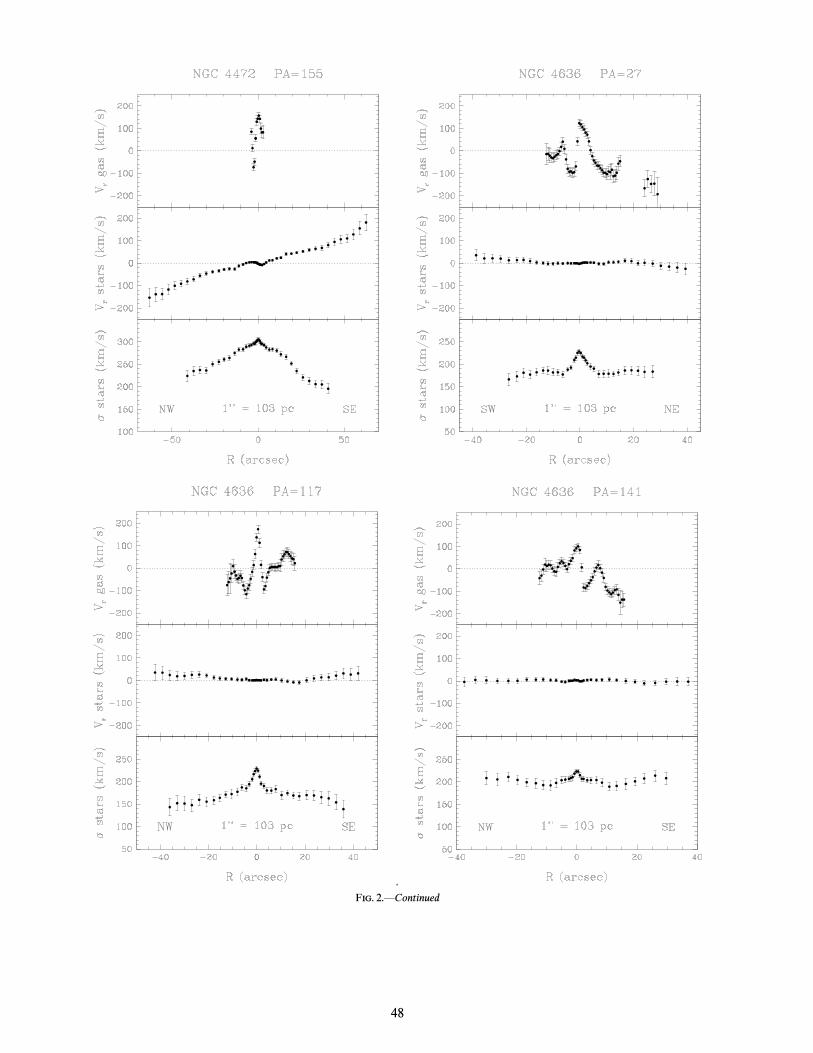
FIG. 2.ÈContinued
48
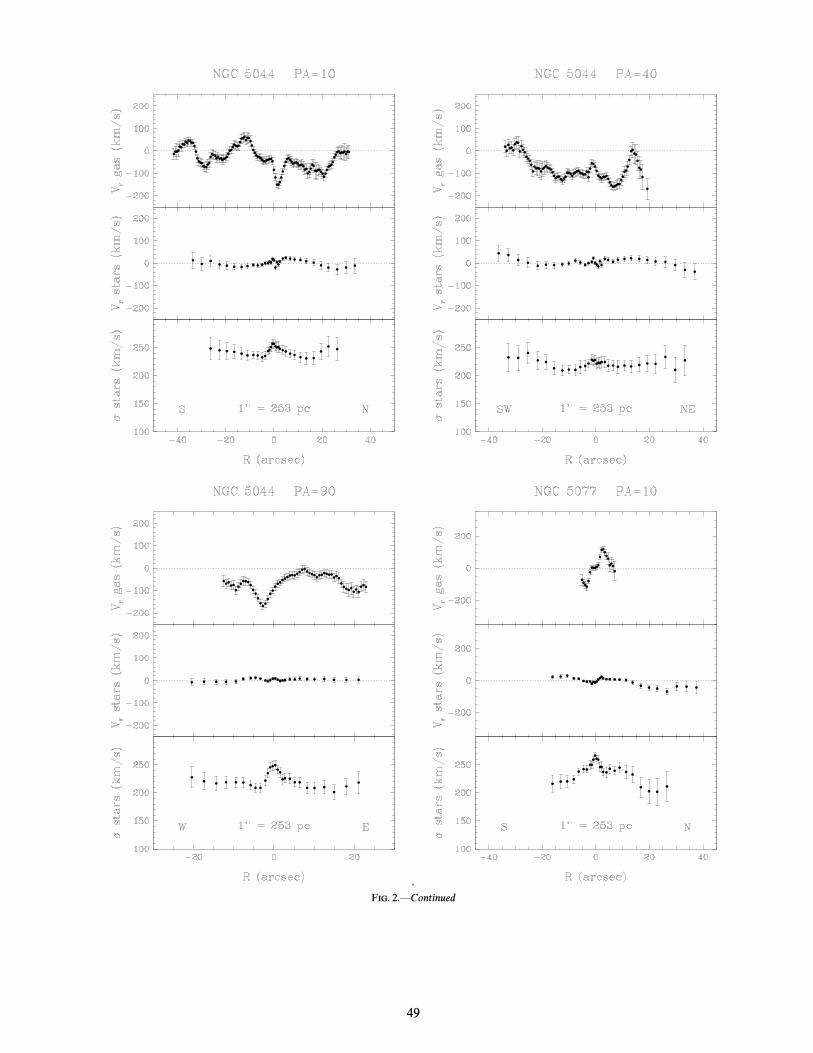
FIG. 2.ÈContinued
49
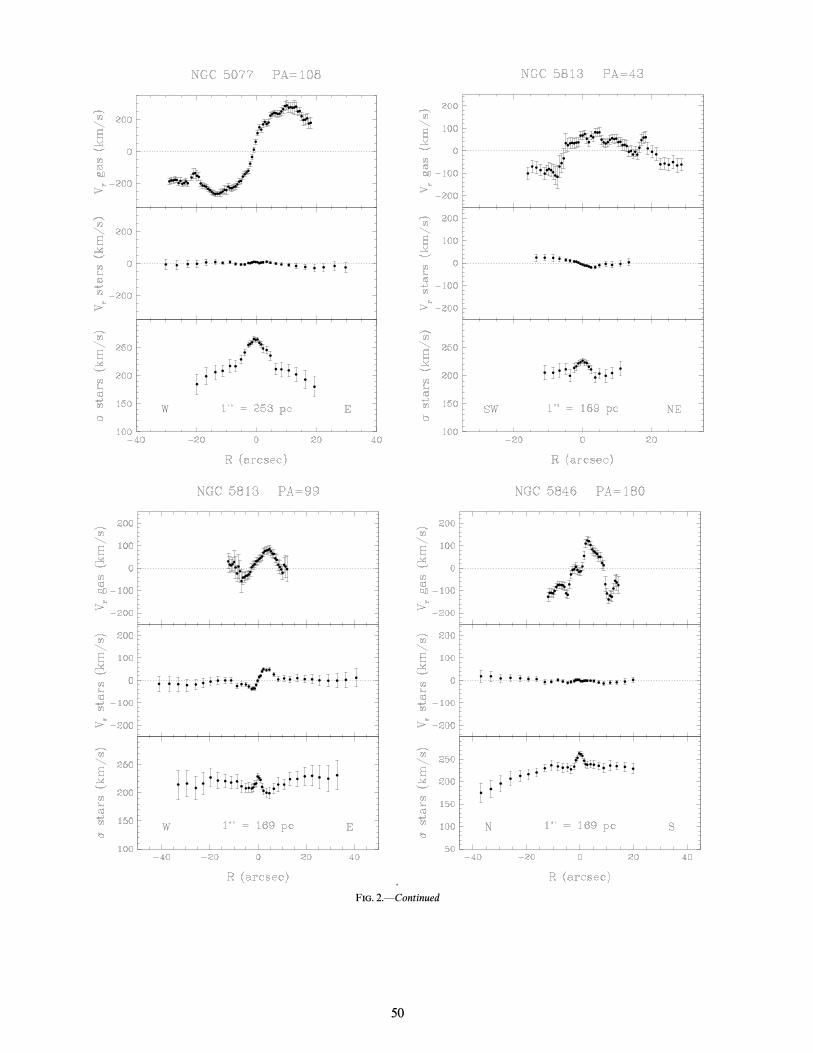
FIG. 2.ÈContinued
50
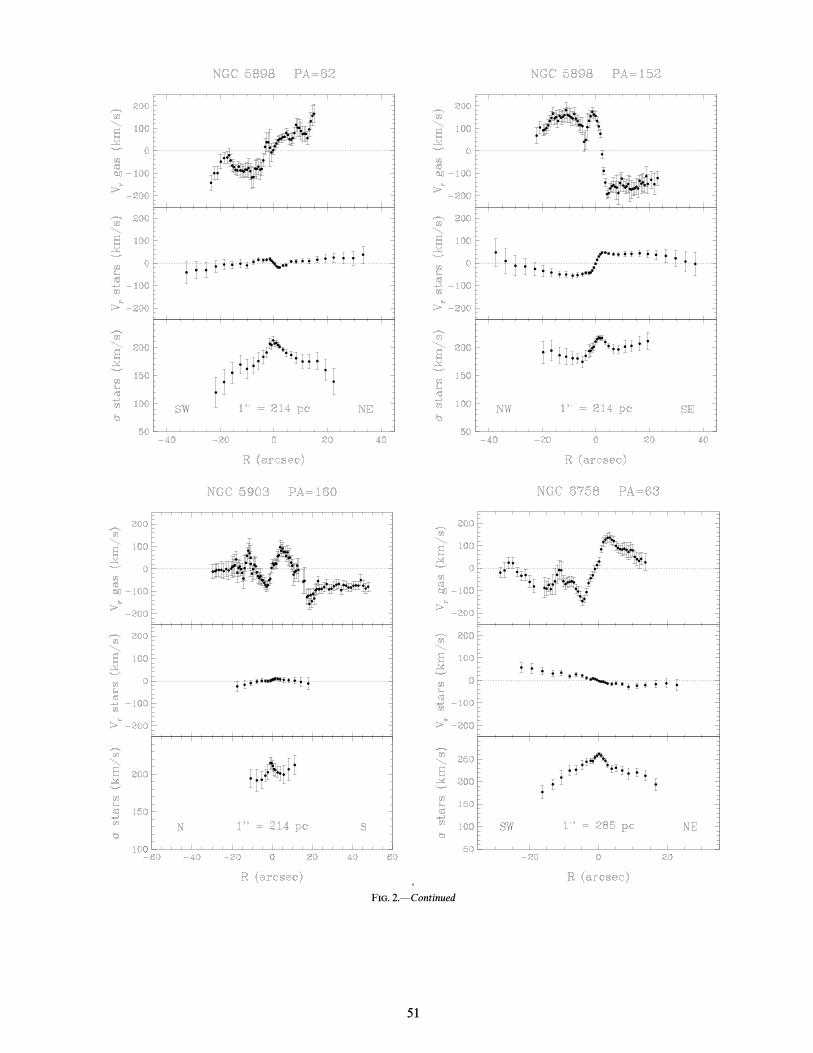
FIG. 2.ÈContinued
51
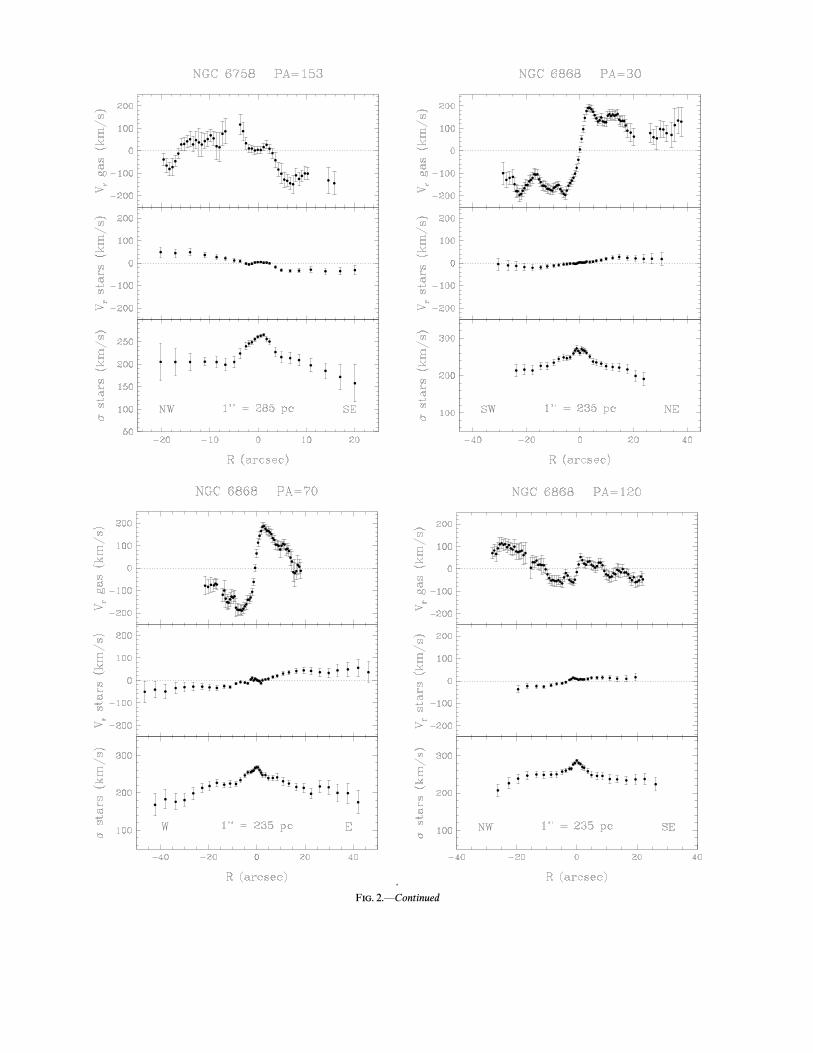
FIG. 2.ÈContinued
KINEMATICS IN GAS-RICH ELLIPTICALS 53
TABLE 2
MAIN KINEMATICAL PARAMETERS
P.A. pc
Vmax Rmax Vmax(gas) Rmax(gas)IdentiÐcation (deg) (km s~1) (km s~1) (arcsec) (km s~1) (arcsec)
NGC 3379 . . . . . . 70 223 ^ 6 105 ^ 20 55R 210 ^ 20 2115 216 ^ 5 50 ^ 10 45 210 ^ 20 2160 212 ^ 4 22 ^ 6 42R 100 ^ 30 2
NGC 3489 . . . . . . 76 117 ^ 4 87 ^ 5 24 130 ^ 15 8166 133 ^ 5 13 ^ 10 23 Irr. . . .
NGC 3607 . . . . . . 121 223 ^ 5 100 ^ 8 6 250 ^ 30 11NGC 4105 . . . . . . 156 261 ^ 4 36 ^ 7 21 240 ^ 20 4NGC 4472 . . . . . . 65 305 ^ 4 17 ^ 8 33 Irr. . . .
155 302 ^ 4 115 ^ 10 45R Irr. . . .NGC 4636 . . . . . . 27 226 ^ 5 25 ^ 15 38R Irr. . . .
117 229 ^ 5 . . . . . . Irr. . . .141 223 ^ 5 6 ^ 11 25 Irr. . . .
NGC 5044 . . . . . . 10 256 ^ 8 14 ^ 12 15 Irr. . . .40 225 ^ 8 40 ^ 20 37R Irr. . . .90 248 ^ 8 5 ^ 12 20 Irr. . . .
NGC 5077 . . . . . . 10 262 ^ 5 50 ^ 20 25 115 ^ 10 3108 264 ^ 4 12 ^ 20 20 270 ^ 10 13
NGC 5813 . . . . . . 43 225 ^ 5 15 ^ 8 3 Irr. . . .99 231 ^ 5 50 ^ 8 3 Irr. . . .
NGC 5846 . . . . . . 180 261 ^ 5 10 ^ 8 26 Irr. . . .NGC 5898 . . . . . . 62 213 ^ 5 40 ^ 20 33R 110 ^ 25 8
152 210 ^ 5 47 ^ 12 9 160 ^ 20 13NGC 5903 . . . . . . 160 212 ^ 8 12 ^ 20 18 Irr. . . .NGC 6758 . . . . . . 63 261 ^ 4 40 ^ 20 22 135 ^ 15 4
153 262 ^ 4 40 ^ 20 20 130 ^ 15 7NGC 6868 . . . . . . 70 267 ^ 4 45 ^ 25 42 180 ^ 20 5
30 266 ^ 4 23 ^ 10 15 190 ^ 10 5120 284 ^ 4 20 ^ 8 11 Irr. . . .
is the stellar central velocity dispersion, averaged within the central 3 pixelsNOTES.Èpc
(1A.8) ;is the maximum rotation velocity, reached at radius (an ““ R ÏÏ next to indicates thatVmax Rmax Rmaxthe velocity curve is still rising) ; is the maximum rotation velocity of the gas, reached atVmax(gas)
““ Irr.ÏÏ means irregular velocity proÐle.Rmax(gas).
The well-known counter-rotating stellar core is evident inboth axes. The gas rotation curves appear irregular ;however, they may be inÑuenced by the uncertainties onmatching and subtracting the continuum from the observedspectrum.
NGC 4636.ÈThe gas presents very irregular velocitycurves, on all the three axes we observed ; particularly inter-esting is the narrow velocity peak observed at P.A.\ 117¡.The photometric major axis is P.A.^ 150¡ (RC3). Asalready noted by Zeilinger et al. (1996), turbulent motionsor material not yet settled may be responsible for thisbehavior ; unfortunately, our lack of the velocity dispersionproÐles for the gas prevents us from conÐrming this inter-pretation. The stellar velocity curve at P.A.\ 27¡ shows acentral nonrotating region, with radius of about 0.5 kpc,corresponding to the peak in the sigma proÐle ; then therotation velocity increases slowly out to the last observedpoint. No stellar rotation is visible at P.A. \ 141¡. Wecannot explain the rather odd velocity curve at P.A. \ 117¡ ;the dispersion proÐle seems regular, though.
NGC 5044.ÈThis is a very peculiar object. The gas veloc-ity proÐle is very irregular, with many humps and dips ; itsradial velocity is systematically blueshifted with respect tothe stellar systemic velocity by D60È100 km~1. Further-more, the stellar velocity curves at P.A.\ 40¡ andP.A.\ 10¡ show a fairly large central part of the galaxy,with radius ^25A (about 6 kpc, 1/3 of the e†ective radius),counter-rotating with respect to the outer regions ; very
slow or no stellar rotation is visible along the galaxy minoraxis (P.A.\ 90¡). There are evident irregularities in the verycenter of all three stellar rotation curves, although theirsmall size and amplitude make it unclear whether they rep-resent a real distinct kinematical subcomponent. The veloc-ity dispersion of the gas peaks at D200È230 km s~1 in thecenter and decreases rapidly outward. Secondary peaks, ofsmaller amplitude (\160 km s~1) may be present, espe-cially along P.A.\ 10¡.
NGC 5077.ÈThis galaxy, classiÐed as S0, exhibits agaseous disk with major axis roughly orthogonal to thegalaxy photometric major axis (P.A.^ 10¡). However, thegas isophotes appear to change position angle at increasingradial distances, starting from the very center. A markedwarp is visible on the W side at R^ 20@@. The gas presents afairly symmetric and smooth rotation curve at P.A. \ 108¡,reaching maximum velocity (^270 km s~1) at r ^ 13@@.Along this axis, stars show very slow rotation. AtP.A.\ 10¡, the stellar rotation curve exhibits a counter-rotating core (r ¹ 5@@, 1.2 kpc), corresponding to a markedcentral peak in the velocity dispersion proÐle (the proÐlesare terminated at r ^ 17@@ on the W side due to a star fallingon the slit). On this same axis, the gas rotates in the samedirection as the stellar nucleus and shows a tiny centralplateau. This galaxy has been thoroughly studied andmodeled by Bertola et al. (1991) ; due to their larger errorbars, they do not recognize the counter-rotating core (seetheir Fig. 1).
54 CAON ET AL. Vol. 127
NGC 5813.ÈThe stellar rotation curve at P.A.\ 99¡shows the kinematically decoupled stellar core discoveredby Efstathiou, Ellis, & Carter (1982), and further studied byKormendy (1984). There is excellent agreement between ourdata and theirs (compare with Fig. 1 in the former paper) :we observe the central peak in the velocity dispersion curve,the minimum at r ^ 3@@, and then the rise out to r D 20@@.Our data do not extend far enough to see the decrease atlarger radii. We measure km s~1, compatibleVmax\ 50 ^ 8with their value of 89 ^ 7 km s~1, taking into account the31¡ di†erence in the slit angle.
Slow rotation is also seen along P.A.\ 43¡. The gaseousvelocity proÐles on both position angles are irregular andmay be the result of still unsettled material, which shows upas a Ðlamentary structure in the Ha ] [N II] map. The gasvelocity dispersion peaks at about 200 km s~1 in the galaxycenter.
NGC 5846.ÈWe only observed one position angle,P.A.\ 0¡. The stars show slow rotation, if any ; the proÐle iscut at r ^ 25@@ on the S side due to a companion galaxyfalling on the slit. The gas displays an irregular velocityproÐle, with a central plateau, a very steep gradient on bothsides, and then a rapid change in velocity direction on the Sside.
NGC 5898.ÈA counter-rotating core is observed on thegalaxy major axis (P.A.\ 62¡), with transition radius ^5A(1 kpc) ; the rotation curve of the main spheroid keeps risingout to the last observed point. Along this same axis, the gasrotates in the same sense as the stellar body, although not ina smooth fashion and presents a ““ hump ÏÏ a few arcsec o†setto the SW. The minor axis, P.A.\ 152¡, shows the gasrotating in a sense opposite to the stars, with its barycenterpossibly displaced by a couple of arcsec SE, in line with theasymmetric distribution of the ionized gas visible in theHa ] [N II] map; also, there is a velocity dip at r ^ 5@@ onthe NW side. This galaxy was studied by Bertola & Bettoni(1988) ; as their data points at P.A.\ 60¡ only extend out toD10A, they fail to recognize the change of rotation senseoutside the central region.
NGC 5903.ÈThere is faint, di†use emission visible andmeasurable in our spectrum out to r ^ 50@@ along the S side,which is not visible in our Ha ] [N II] map as it was belowour detection threshold. Stars show little rotation, while thegas presents an irregular velocity proÐle.
NGC 6758.ÈWe see an overall regular gaseous rotationcurve at P.A.\ 63¡, reaching maximum amplitude (^140km s~1) at ^4A (0.8 kpc) and then decreasing to TheV
RD 0.
stars rotate in a sense opposite to the gas, and more slowlykm s~1). The gas velocity curve at P.A.\ 153¡ is(Vmax ^ 40
more irregular, though it shows a deÐnite rotation sensecoincident with that of the stars. The central plateau(r \ 3@@) visible in the stellar velocity curve suggests the pres-ence of a nuclear region with an angular momentum vectormisaligned with respect to that of the main body.
NGC 6868.ÈThe gas exhibits a more or less regular rota-tion curve at P.A.\ 30¡ and P.A.\ 70¡, in agreement withthe stellar rotation ; at P.A.\ 120¡, the gas counter-rotateswith respect to stars, and it even shows a sort of innercounter-rotating component, somewhat o†set to the NWside with respect to the kinematical center for the stars.Zeilinger et al. (1996) already noticed this feature andexplain it as the superposition of two unresolved com-ponents rotating in a sense opposite to each other, onedominating in the inner region, the other dominating in the
external parts. The present spectral resolution does notallow us to check their conclusions.
The central velocity dispersion of the gas is ^170 kms~1. A kinematically decoupled, counter-rotating core isvisible in all three stellar velocity curves, more evident atP.A.\ 70¡, where the kinematical break radius is r \ 3@@(0.7 kpc) ; at P.A.\ 30¡, the velocity dispersion appears tofall toward the very center.
6. COMPARISON WITH THE LITERATURE
In order to assess the quality of our data and to check forthe presence of possible systematic e†ects related to theinstrumental resolution we used, we have compared ourrotation curves and velocity dispersion proÐles withpublished measurements. This comparison also permits amore general valuation of the typical uncertainties anddegree of (dis)agreement among di†erent authors, withevident implications on the accuracy and reliability of thosegalaxy models built on gaseous and stellar kinematics data.
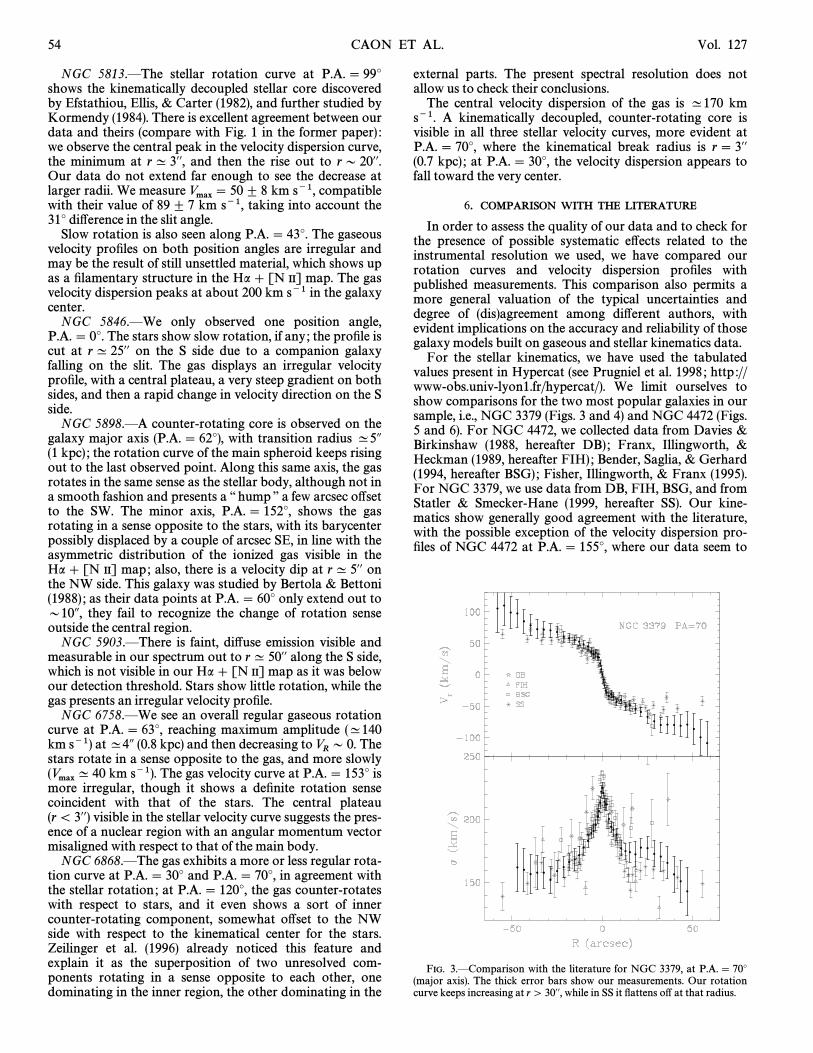
For the stellar kinematics, we have used the tabulatedvalues present in Hypercat (see Prugniel et al. 1998 ; http ://www-obs.univ-lyon1.fr/hypercat/). We limit ourselves toshow comparisons for the two most popular galaxies in oursample, i.e., NGC 3379 (Figs. 3 and 4) and NGC 4472 (Figs.5 and 6). For NGC 4472, we collected data from Davies &Birkinshaw (1988, hereafter DB) ; Franx, Illingworth, &Heckman (1989, hereafter FIH) ; Bender, Saglia, & Gerhard(1994, hereafter BSG) ; Fisher, Illingworth, & Franx (1995).For NGC 3379, we use data from DB, FIH, BSG, and fromStatler & Smecker-Hane (1999, hereafter SS). Our kine-matics show generally good agreement with the literature,with the possible exception of the velocity dispersion pro-Ðles of NGC 4472 at P.A.\ 155¡, where our data seem to
FIG. 3.ÈComparison with the literature for NGC 3379, at P.A.\ 70¡(major axis). The thick error bars show our measurements. Our rotationcurve keeps increasing at r [ 30@@, while in SS it Ñattens o† at that radius.
No. 1, 2000 KINEMATICS IN GAS-RICH ELLIPTICALS 55
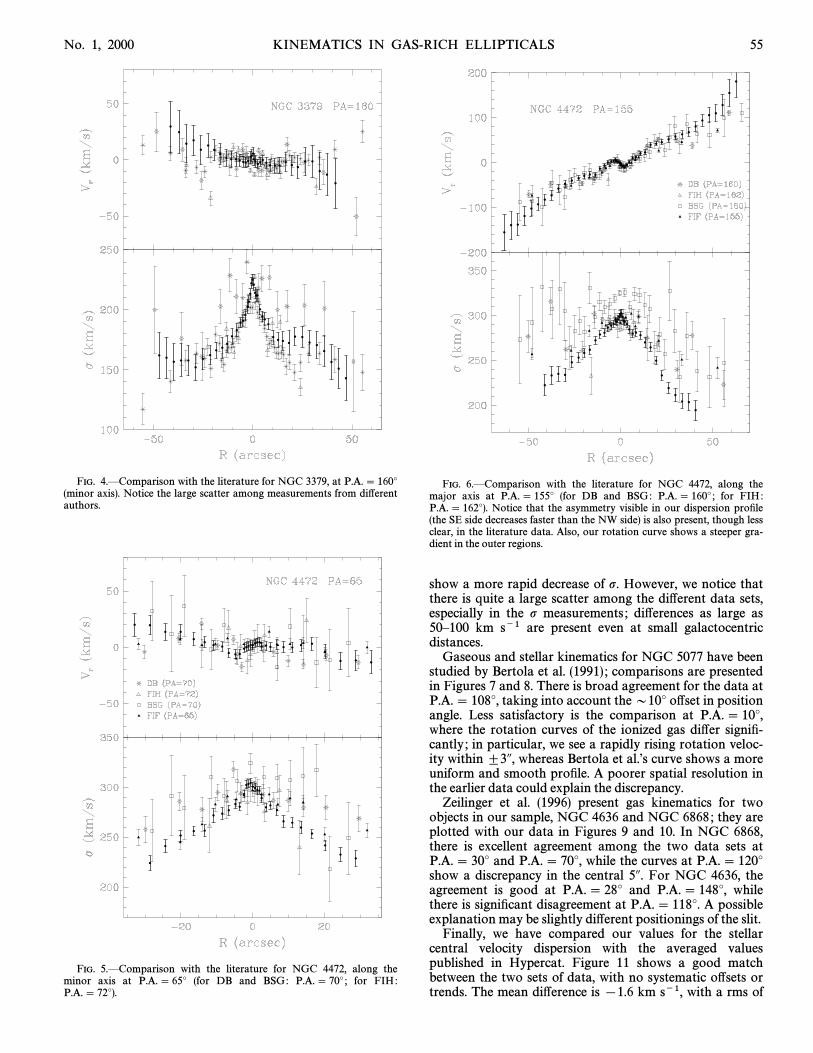
FIG. 4.ÈComparison with the literature for NGC 3379, at P.A. \ 160¡(minor axis). Notice the large scatter among measurements from di†erentauthors.
FIG. 5.ÈComparison with the literature for NGC 4472, along theminor axis at P.A. \ 65¡ (for DB and BSG: P.A. \ 70¡ ; for FIH:P.A.\ 72¡).
FIG. 6.ÈComparison with the literature for NGC 4472, along themajor axis at P.A.\ 155¡ (for DB and BSG: P.A.\ 160¡ ; for FIH:P.A.\ 162¡). Notice that the asymmetry visible in our dispersion proÐle(the SE side decreases faster than the NW side) is also present, though lessclear, in the literature data. Also, our rotation curve shows a steeper gra-dient in the outer regions.
show a more rapid decrease of p. However, we notice thatthere is quite a large scatter among the di†erent data sets,especially in the p measurements ; di†erences as large as50È100 km s~1 are present even at small galactocentricdistances.
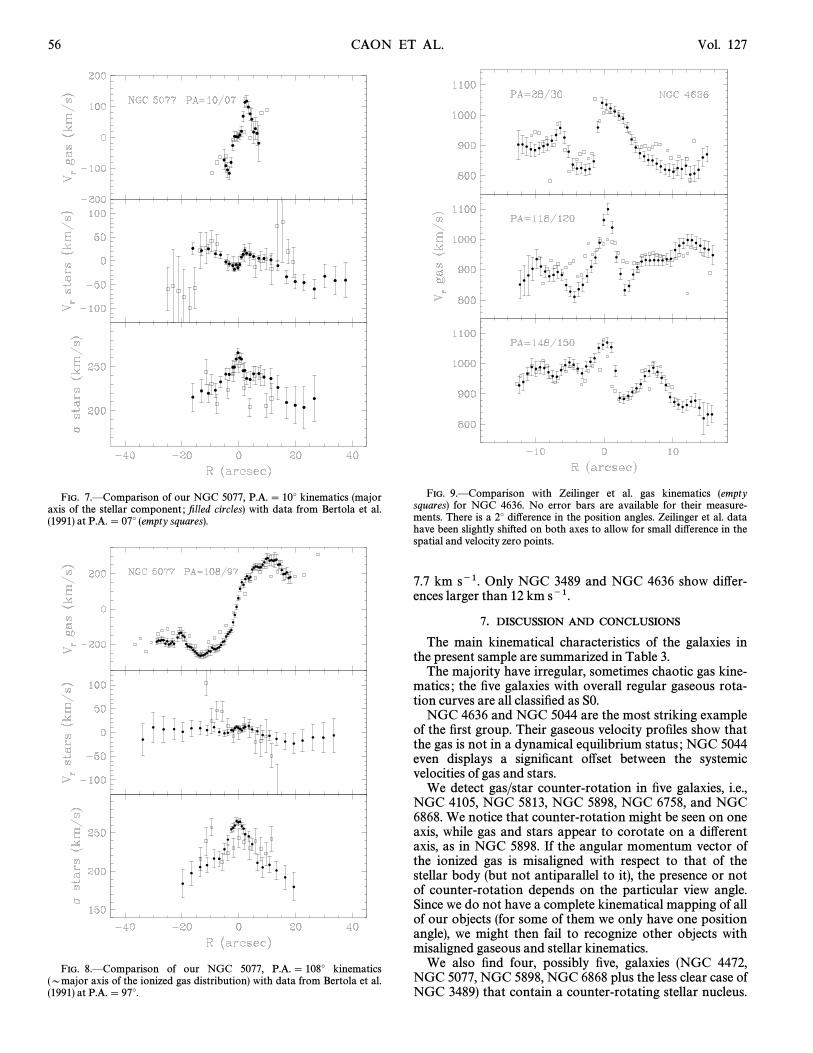
Gaseous and stellar kinematics for NGC 5077 have beenstudied by Bertola et al. (1991) ; comparisons are presentedin Figures 7 and 8. There is broad agreement for the data atP.A.\ 108¡, taking into account the D10¡ o†set in positionangle. Less satisfactory is the comparison at P.A.\ 10¡,where the rotation curves of the ionized gas di†er signiÐ-cantly ; in particular, we see a rapidly rising rotation veloc-ity within ^3A, whereas Bertola et al.Ïs curve shows a moreuniform and smooth proÐle. A poorer spatial resolution inthe earlier data could explain the discrepancy.
Zeilinger et al. (1996) present gas kinematics for twoobjects in our sample, NGC 4636 and NGC 6868 ; they areplotted with our data in Figures 9 and 10. In NGC 6868,there is excellent agreement among the two data sets atP.A.\ 30¡ and P.A.\ 70¡, while the curves at P.A.\ 120¡show a discrepancy in the central 5A. For NGC 4636, theagreement is good at P.A.\ 28¡ and P.A.\ 148¡, whilethere is signiÐcant disagreement at P.A.\ 118¡. A possibleexplanation may be slightly di†erent positionings of the slit.
Finally, we have compared our values for the stellarcentral velocity dispersion with the averaged valuespublished in Hypercat. Figure 11 shows a good matchbetween the two sets of data, with no systematic o†sets ortrends. The mean di†erence is [1.6 km s~1, with a rms of
56 CAON ET AL. Vol. 127
FIG. 7.ÈComparison of our NGC 5077, P.A.\ 10¡ kinematics (majoraxis of the stellar component ; Ðlled circles) with data from Bertola et al.(1991) at P.A.\ 07¡ (empty squares).
FIG. 8.ÈComparison of our NGC 5077, P.A.\ 108¡ kinematics(Dmajor axis of the ionized gas distribution) with data from Bertola et al.(1991) at P.A.\ 97¡.
FIG. 9.ÈComparison with Zeilinger et al. gas kinematics (emptysquares) for NGC 4636. No error bars are available for their measure-ments. There is a 2¡ di†erence in the position angles. Zeilinger et al. datahave been slightly shifted on both axes to allow for small di†erence in thespatial and velocity zero points.
7.7 km s~1. Only NGC 3489 and NGC 4636 show di†er-ences larger than 12 km s~1.
7. DISCUSSION AND CONCLUSIONS
The main kinematical characteristics of the galaxies inthe present sample are summarized in Table 3.
The majority have irregular, sometimes chaotic gas kine-matics ; the Ðve galaxies with overall regular gaseous rota-tion curves are all classiÐed as S0.
NGC 4636 and NGC 5044 are the most striking exampleof the Ðrst group. Their gaseous velocity proÐles show thatthe gas is not in a dynamical equilibrium status ; NGC 5044even displays a signiÐcant o†set between the systemicvelocities of gas and stars.
We detect gas/star counter-rotation in Ðve galaxies, i.e.,NGC 4105, NGC 5813, NGC 5898, NGC 6758, and NGC6868. We notice that counter-rotation might be seen on oneaxis, while gas and stars appear to corotate on a di†erentaxis, as in NGC 5898. If the angular momentum vector ofthe ionized gas is misaligned with respect to that of thestellar body (but not antiparallel to it), the presence or notof counter-rotation depends on the particular view angle.Since we do not have a complete kinematical mapping of allof our objects (for some of them we only have one positionangle), we might then fail to recognize other objects withmisaligned gaseous and stellar kinematics.
We also Ðnd four, possibly Ðve, galaxies (NGC 4472,NGC 5077, NGC 5898, NGC 6868 plus the less clear case ofNGC 3489) that contain a counter-rotating stellar nucleus.
No. 1, 2000 KINEMATICS IN GAS-RICH ELLIPTICALS 57
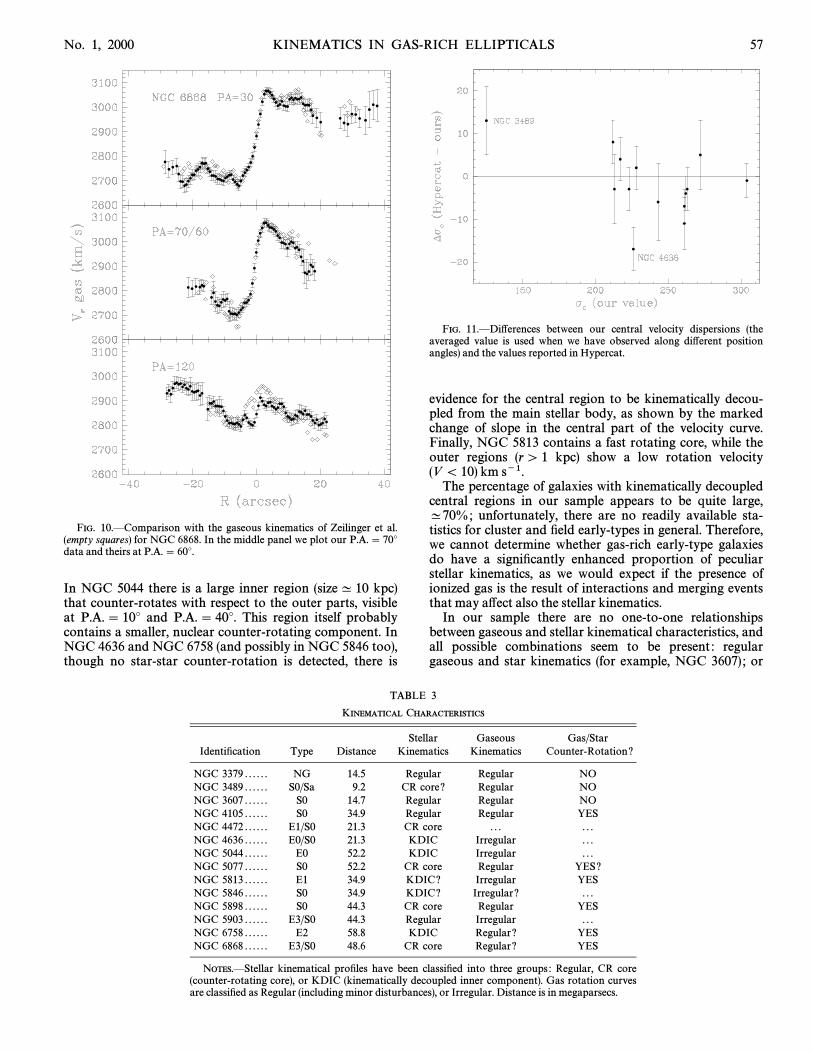
FIG. 10.ÈComparison with the gaseous kinematics of Zeilinger et al.(empty squares) for NGC 6868. In the middle panel we plot our P.A.\ 70¡data and theirs at P.A.\ 60¡.
In NGC 5044 there is a large inner region (size^ 10 kpc)that counter-rotates with respect to the outer parts, visibleat P.A.\ 10¡ and P.A.\ 40¡. This region itself probablycontains a smaller, nuclear counter-rotating component. InNGC 4636 and NGC 6758 (and possibly in NGC 5846 too),though no star-star counter-rotation is detected, there is
FIG. 11.ÈDi†erences between our central velocity dispersions (theaveraged value is used when we have observed along di†erent positionangles) and the values reported in Hypercat.
evidence for the central region to be kinematically decou-pled from the main stellar body, as shown by the markedchange of slope in the central part of the velocity curve.Finally, NGC 5813 contains a fast rotating core, while theouter regions (r [ 1 kpc) show a low rotation velocity(V \ 10) km s~1.
The percentage of galaxies with kinematically decoupledcentral regions in our sample appears to be quite large,^70%; unfortunately, there are no readily available sta-tistics for cluster and Ðeld early-types in general. Therefore,we cannot determine whether gas-rich early-type galaxiesdo have a signiÐcantly enhanced proportion of peculiarstellar kinematics, as we would expect if the presence ofionized gas is the result of interactions and merging eventsthat may a†ect also the stellar kinematics.
In our sample there are no one-to-one relationshipsbetween gaseous and stellar kinematical characteristics, andall possible combinations seem to be present : regulargaseous and star kinematics (for example, NGC 3607) ; or
TABLE 3
KINEMATICAL CHARACTERISTICS
Stellar Gaseous Gas/StarIdentiÐcation Type Distance Kinematics Kinematics Counter-Rotation?
NGC 3379 . . . . . . NG 14.5 Regular Regular NONGC 3489 . . . . . . S0/Sa 9.2 CR core? Regular NONGC 3607 . . . . . . S0 14.7 Regular Regular NONGC 4105 . . . . . . S0 34.9 Regular Regular YESNGC 4472 . . . . . . E1/S0 21.3 CR core . . . . . .NGC 4636 . . . . . . E0/S0 21.3 KDIC Irregular . . .NGC 5044 . . . . . . E0 52.2 KDIC Irregular . . .NGC 5077 . . . . . . S0 52.2 CR core Regular YES?NGC 5813 . . . . . . E1 34.9 KDIC? Irregular YESNGC 5846 . . . . . . S0 34.9 KDIC? Irregular? . . .NGC 5898 . . . . . . S0 44.3 CR core Regular YESNGC 5903 . . . . . . E3/S0 44.3 Regular Irregular . . .NGC 6758 . . . . . . E2 58.8 KDIC Regular? YESNGC 6868 . . . . . . E3/S0 48.6 CR core Regular? YES
NOTES.ÈStellar kinematical proÐles have been classiÐed into three groups : Regular, CR core(counter-rotating core), or KDIC (kinematically decoupled inner component). Gas rotation curvesare classiÐed as Regular (including minor disturbances), or Irregular. Distance is in megaparsecs.
58 CAON ET AL.
both irregular (as in NGC 5044) ; regular gaseous velocitycurve together with a counter-rotating stellar core (NGC5898) ; and Ðnally chaotic gaseous kinematics coexistingwith ordered stellar kinematics (NGC 4636, though it mayhave a decoupled central region as previously described).
Mehlert et al. (1998) present a list of the 17 galaxies withkinematically decoupled cores mentioned in the literature,which includes two of our galaxies. Here we Ðnd four newobjects containing a counter-rotating stellar core (NGC5077, NGC 5898, NGC 6868, NGC 3489), and four morewith evidence for a kinematically distinct inner region(NGC 4636, NGC 5044, NGC 5846, NGC 6758).
We can conclude that, in the present sample of gas-richgalaxies, gas distributions which are irregular or chaoticboth in spatial and velocity distributions, gaseous com-ponents kinematically decoupled from the stellar body, as
well as peculiarities in the stellar kinematics, seem to be therule rather than the exception.
These Ðndings support the model in which the gas isaccreted from outside the galaxy, rather than producedinside it. Irregular/chaotic gas velocity proÐles indicate thatin many cases the gas has not yet settled into the equi-librium conÐguration, and the accretion took place recent-ly. The existence of di†erent gaseous components is also apossibility, and they may be the result of multiple acquisi-tion events. The accretion processes have probably left theirsignature in the stellar kinematics, either as a result of sub-sequent star formation, or the ingestion of the stellar com-ponent of the accreted object.
This study was partly Ðnanced by the Spanish DGES(grant PB97-0158).
REFERENCESBender, R., Saglia, R. P., & Gerhard, O. E. 1994, MNRAS, 269, 785 (BSG)Bertola, F., & Bettoni, D. 1988, ApJ, 329, 102Bertola, F., Bettoni, D., Danziger, J., Sadler, E., Sparke, L., & de Zeeuw, T.
1991, ApJ, 373, 369Bertola, F., Cinzano, P., Corsini, E. M., Rix, H.-W., & Zeilinger, W. W.
1995, ApJ, 448, L13Binette, L., Magris, C. G., Stasins̀ka, G., & Bruzual, A. G. 1994, A&AS,
292, 13Buson, L. M., et al. 1993, A&AS, 280, 409Dalle Ore, C., Faber, S. M., Jesus, J., Stoughton, R., & Burstein, D. 1991,
ApJ, 366, 38Davies, R. L., & Birkinshaw, M. 1988, ApJS, 68, 409 (DB)de Vaucouleurs, G., de Vaucouleurs, A., Corwin, H. G. Jr., Buta, R. J.,
Paturel, H. G., & Fouqui, P. 1991, Third Reference Catalogue of BrightGalaxies (Austin : Univ. Texas) (RC3)
Efstathiou, G., Ellis, R. S., & Carter, D. 1982, MNRAS, 201, 975Fabian, A. C. 1994, ARA&A, 32, 277Ferrari, F., Pastoriza, M., Macchetto, D., & Caon, N. 1999, A&AS, 136,
269Fisher, D., Illingworth, G., & Franx, M. 1995, ApJ, 438, 539Fosbury, R. A. E., et al. 1982, MNRAS, 201, 991Franx, M., Illingworth, G., & Heckman, T. 1989, ApJ, 344, 613 (FIH)Goudfrooij, P. 1996, Ap&SS, 209, 400Goudfrooij, P., Hansen, L., H. E., & H. U.JÔrgensen, NÔrgaard-Nielsen,
1994, A&AS, 105, 341
Heckman, T., Baum, S. A., vanBreugel, W. J. M., & McCarthy, P. 1989,ApJ, 338, 48
Kim, D.-W. 1989, ApJ, 346, 653Kormendy, J. 1984, ApJ, 287, 577Macchetto, D., Pastoriza, M., Caon, N., Sparks, W. B., Giavalisco, M.,
Bender, R., & Capaccioli, M. 1996, A&AS, 120, 463 (Paper I)Mehlert, D., Saglia, R. P., Bender, R., & Wegner, G. 1998, A&A, 332, 33Osterbrock, D. E. 1974, Astrophysics of Gaseous Nebulae (San Francisco :
Freeman)Pastoriza, M. G., Winge, C., Ferrari, F., Macchetto, D., & Caon, N. 2000,
ApJ, 529, 866Phillips, M. M., Jenkins, C. R., Dopita, M. A., Sadler, E. M., & Binette, L.
1986, AJ, 91, 1062Plana, H., Boulesteix, J., Amram, Ph., Carignan, C., & Mendes de Oliveira,
C. 1998, A&AS, 128, 75Prugniel, Ph., Zasov, A., Busarello, G., & Simien, F. 1998, A&AS, 127, 117Saglia, R. P., et al. 1993, ApJ, 567, 572Shields, J. 1991, AJ, 102, 1314Sparks, W. B., & Collier-Cameron, A. 1988, MNRAS, 232, 215Sparks, W. B., Macchetto, D., & Golombek, D. 1989, ApJ, 345, 153Statler, T. S., & Smecker-Hane, T. 1999, AJ, 117, 839Zeilinger, W. W., et al. 1996, A&AS, 120, 257