1 © hermann koller sustainable and efficient packaging waste management - experiences from austria...
TRANSCRIPT
1 © Hermann Koller
Sustainable and efficient Packaging Waste Management - Experiences from Austria
Budapest, 24 February 2009

2 © Hermann Koller
Contents
1. Legal Requirements
2. Political Considerations
3. Operation of the System
4. Results and Experiences
Confidentiality Clause:This document including an oral presentation is exclusively intended for a certain addressee. Underlying analytical data and oral explanations may have to be added to the document in order for the latter to be regarded as complete. Any disclosure of the information it contains to third parties, in any form whatsoever, even in an extracted form, shall only be permissible upon prior written consent of the author. The author assumes liability for the correctness and completeness of information only in compliance with a relevant contractual relationship.

3 © Hermann Koller
Austria: Facts & Figures
Capital: Vienna
Area: 84,000 km²
Population: 8.2 mio.
GNP 20061): 257.9 billion €
GNP per inhabitant1): 31,140 €
Household waste (MSW)2): 3.4 mio. tons 27.5 mio. m³
Packaging waste3): 1.1 mio. tons app. 135 kg/cap*a
1) per July 2007; Statistics Austria2) Federal Environment Agency, 20063) Federal Ministry of Environment, 2006

4 © Hermann Koller
Different Targets and Quotas are set
– Minimum recycling quotas for companies not participating in an authorized collection and recyovery scheme (set in the Packaging Ordinance)
– National recycling quotas (set in the Packaging Ordinance)
– Recycling quotas for authorized collection and recovery schemes (set by the Ministry of Environment)
1. Legal Requirements

5 © Hermann Koller
Collection/Material Recycling 2007
40
65
9595
8080
35*
15
95959585
65
84
15
96
15
30
8075
65
16
34
8384
65
0
20
40
60
80
100
120
Paper Glass Plastics Compounds Metals Packaging on a biol.Basis
Wood Lightw eightpackaging and
Metals
Collection quota set Collection quota reached
Material recycling quota set Material recycling quota reached
* Goal for material recycling quota for plastics, compounds, wood, textiles and ceramics, packaging on a biological basis and metals: > 35 %
Household system: quota set/reached, in %
1. Legal Requirements

6 © Hermann Koller
Collection/Material Recycling 2007
65
50
8590
40*
65
86
96
15
104
46
65
15
65
85
24
65
15
70
104
0
25
50
75
100
125
Paper Plastics Compounds Metals Wood Lightw eight packaging &Metals
Collection quota set Collection quota reached
Material recycling quota set Material recycling quota reached
* Goal for material recycling quota for plastics, compounds, wood, textiles, ceramics and metals: > 40 %
Industrial/commercial system: quota set/reached, in %
1. Legal Requirements

7 © Hermann Koller
No ecological reasons to implement deposit system in Austria
● EU directive and the national packaging ordinance have been implemented successfully
● Only 5.8% of littering are packaging, and only 0.45% of littering are beverage packaging
● Vienna has Europe-wide the most insignificant share of littering waste
● Return rate in Austria is nearly 90% without deposit (this is more than in countries with deposit)
● Existence of enough and appropriate capacities for recycling of metals and plastics
The situation in Austria
2. Political Considerations
8 © Hermann Koller
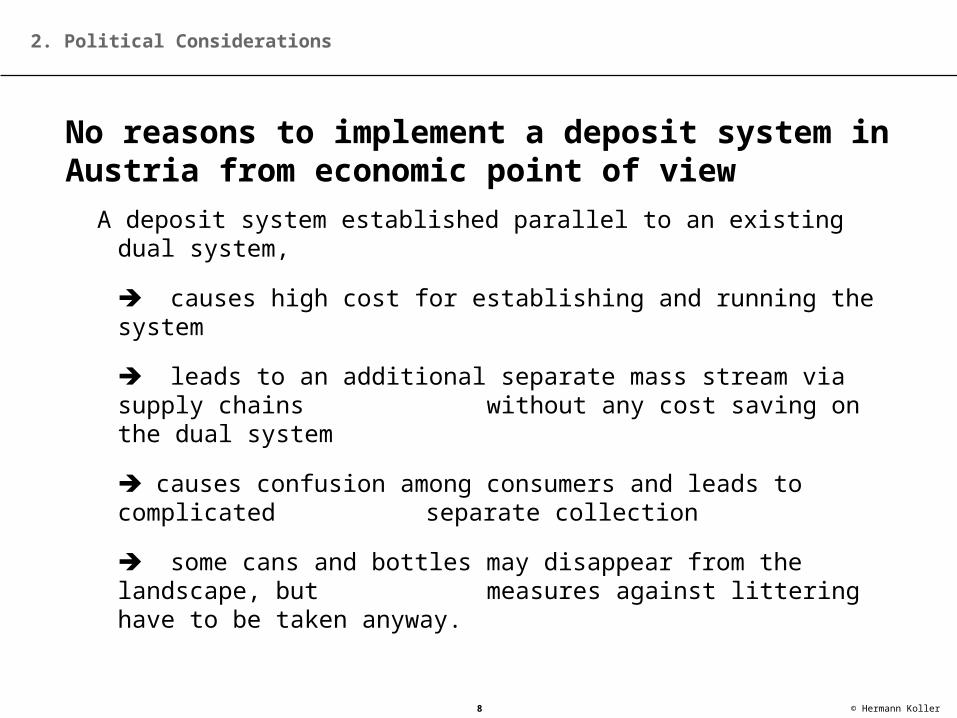
No reasons to implement a deposit system in Austria from economic point of view
A deposit system established parallel to an existing dual system,
causes high cost for establishing and running the system
leads to an additional separate mass stream via supply chains without any cost saving on the dual system
causes confusion among consumers and leads to complicated separate collection
some cans and bottles may disappear from the landscape, but measures against littering have to be taken anyway.
2. Political Considerations

9 © Hermann Koller
The Sustainability Agenda as the Austrian Approach
The Austrian Industry and Politics have agreed to reach the following goals:
– Recycling of PET beverage packaging at an amount of minimum 50%
– Bottle-to-Bottle recycling for PET (2007: 6,000 tons)
– 30% share of recycling materials in cycle PET bottles
– Beer mainly in refillable bottles
– 80% quota for refill or recycling of beverage packaging
– Continuos consumer information concerning refillable products
– Support the use of returnable systems at big events
– Preparation of annual implementation report
2. Political Considerations

10 © Hermann Koller
Comprehensive range of bins for separate collection are available for households
Household Waste Household waste
General Waste Collection Other waste MSW Packaging waste
All WasteTypes
Sorting/Recovery
Sor
ting/
Tre
atm
ent/
Inci
nera
tion
Land
fill
Com
post
ing
Sor
ting/
Tre
atm
ent/
Rec
over
y
Inci
nera
tion/
Land
fill
Bio
Haz
ardo
us
Bul
ky
Res
idua
lw
aste
Pla
stic
s
Met
als
Pap
er
Whi
teG
lass
Col
oure
dG
lass
3. Operation of the System

11 © Hermann Koller
Sorting Plants for lightweight packaging and metal packaging
Al packetised
MSW
Fe packetised
Metal sorting
MSW
Fe shreddered Al shreddered
Shredder
Legend:
Magnet
Eddy current separator
Shredder
Mixed plastic fraction
Fe -> ShredderLDPE foils
HDPE buckets
MSW
Lightweight Packaging
PET
PET HDPE
PS/PP
Metal packaging only
Lightweight packaging output fractions in bales
Metal output fractions
Input Collection
3. Operation of the System
12 © Hermann Koller
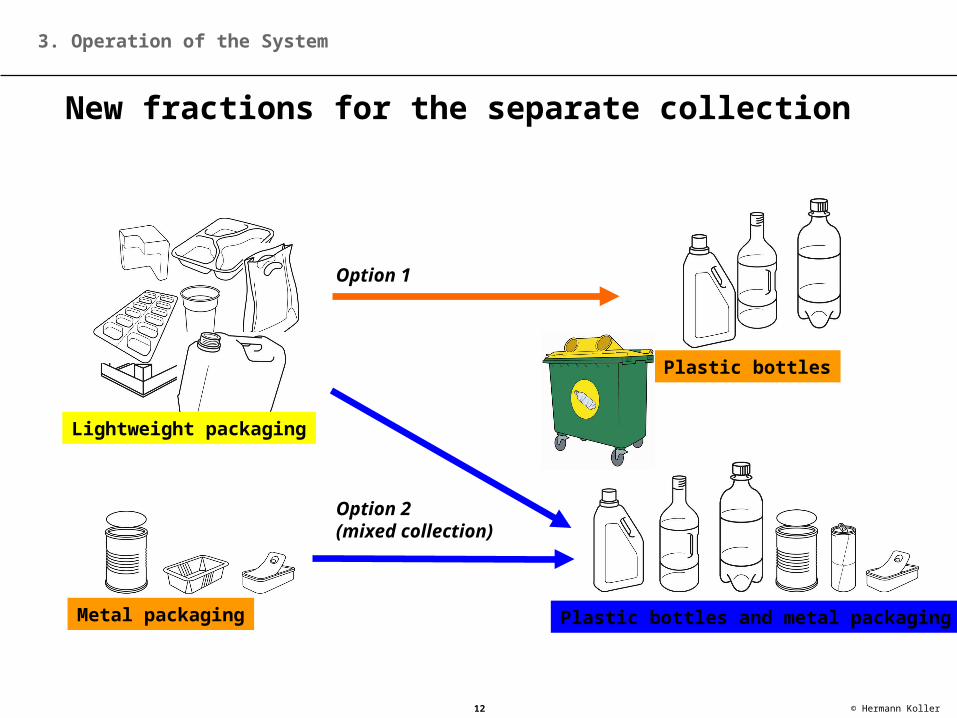
New fractions for the separate collection
Lightweight packaging
Metal packaging Plastic bottles and metal packaging
Plastic bottles
Option 1
Option 2(mixed collection)
3. Operation of the System

13 © Hermann Koller
New plastic-sorting-plant in Vienna: fully automated sorting of plastic-bottles
Sorting capacity: up to 4 tons per hour
Fully automated sorting via near infrared sensors and compressed air valves
3. Operation of the System

14 © Hermann Koller
New Bottle to Bottle Recycling Plant
3. Operation of the System

15 © Hermann Koller
Marketable Products
3. Operation of the System

16 © Hermann Koller
Landfilled packaging waste quantities dropped down: 1990/91, 1994, 1998, 2001, 2004
1) “Ordinance on targets“: Ordinance establishing targets for the prevention and recycling of waste from drinks packaging and other packaging materials
Note: I= Range for actual landfilled volumes
Sources: Prognos AG, 1995; Austrian Ministry of Environment, 1998; Amendment of “ordinance on targets”, 2000; FHAnalytik GmbH, 2002;FHAnalytik and TB Hauer, 2006
0,000
20,000
40,000
60,000
80,000
100,000
120,000
140,000
160,000
180,000
200,000
220,000
240,000
260,000
Glass Plastics Paper, board Metals Composites
1990/91 1994 1998 (from - to) 2001 (from - to) 2004 (from - to)
Non-beverage packaging, in tons per year
Residual quantities per 2001according to amendment of
"ordinance on targets"1)
Reduction of packaging volume in MSW resp. on landfills:from 695,000 t (1991)to 42,300 t (2004)
= minus 94 %
4. Results and Experiences
17 © Hermann Koller
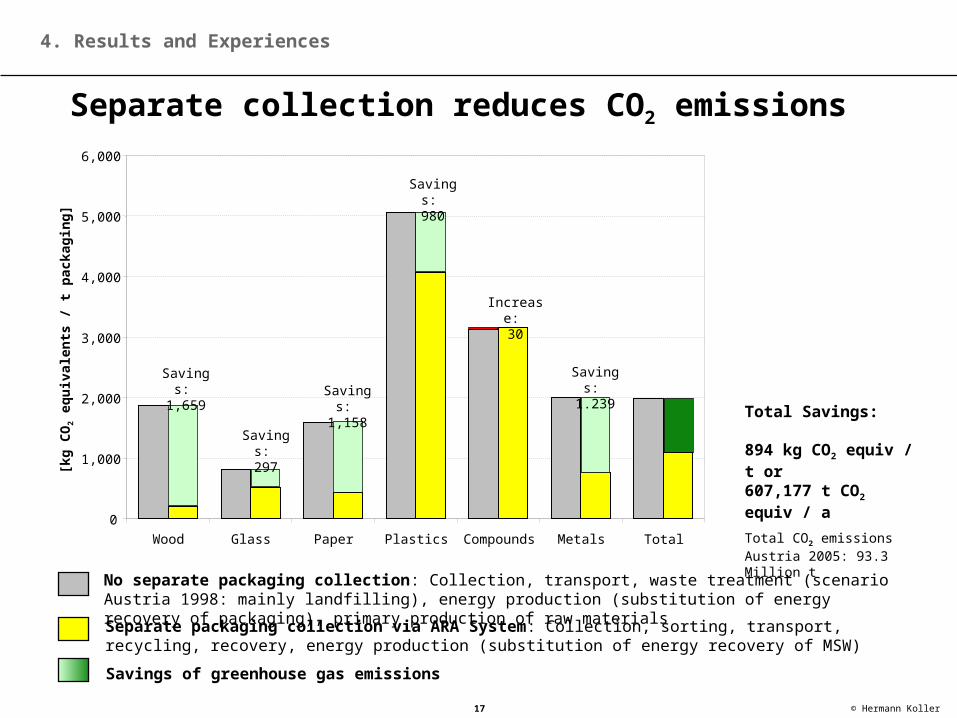
Separate collection reduces CO2 emissions
No separate packaging collection: Collection, transport, waste treatment (scenario Austria 1998: mainly landfilling), energy production (substitution of energy recovery of packaging), primary production of raw materials
Separate packaging collection via ARA System: Collection, sorting, transport, recycling, recovery, energy production (substitution of energy recovery of MSW)
0
1,000
2,000
3,000
4,000
5,000
6,000
Wood Glass Paper Plastics Compounds Metals Total
[kg
CO
2 eq
uiv
alen
ts /
t p
acka
gin
g]
Savings:
1,659
Savings:
297
Savings:
1,158
Savings:
980
Increase: 30
Savings:
1.239 Total Savings:
894 kg CO2 equiv / t or607,177 t CO2 equiv / a
Total CO2 emissions Austria 2005: 93.3 Million t
Savings of greenhouse gas emissions
4. Results and Experiences

18 © Hermann Koller
Official Packaging Waste Data for Austria
Source: Eurostat, Environmental Data Centre on Waste (http://epp.eurostat.ec.europa.eu/portal/page?_pageid=3155,70491033,3155_70521316&_dad=portal&_schema=PORTAL#end)
4. Results and Experiences
AustriaPackaging waste data for 2006, in tonnes
Material recycling
Other forms of recycling
Total recycling
Energy recovery
Other forms of recovery
Incineration at waste
incineration plants with
energy recovery
Total recovery and incineration
at waste incineration plants with
energy recovery
(a) (b) (c) (d) = (b) + (c) (e) (f) (g) (h) = (d)+(e)+(f)+(g) = (d) / (a) = (h) / (a)
231.645 195.801 0 195.801 0 0 0 195.801 84,5 84,5238.134 85.173 0 85.173 55.897 0 74.925 215.995 35,8 90,7523.206 455.056 0 455.056 0 0 42.651 497.707 87,0 95,1
Total 63.598 37.888 0 37.888 0 0 0 37.888 59,6 59,6Aluminium
Steel77.082 12.348 709 13.057 5.811 0 22.102 40.970 16,9 53,232.687 10.582 0 10.582 10.875 0 10.376 31.833 32,4 97,4
1.166.352 796.848 709 797.557 72.583 0 150.054 1.020.194 68,4 87,5
Material
Glass
Paper and board Plastic
Table 1: Quantities of packaging waste generated in the Member State and recovered or incinerated at waste incineration
Packaging waste
generated
Recovered or incinerated at waste incineration plants with energy recovery by
Recycling rate (%)
Rate of recovery or incineration
at waste incineration plants with
energy recovery
Metals
WoodOtherTotal

19 © Hermann Koller
Comparison Recovery Targets in EU Countries
Austria
Source: Eurostat, Environmental Data Centre on Waste
4. Results and Experiences

20 © Hermann Koller
Efficient Recovery Schemes Show Best Results
0
10
20
30
40
50
60
70
80
90
100
Recovery Rate Total in % Recycling Rate Total in %
Finland
Sweden
Germany
Austria
Belgium
in %
Source: Eurostat, Environmental Data Centre on Waste

21 © Hermann Koller
Since 1993 ...
Collection and recovery of approx. 10 million tons of packaging – that corresponds to approx. 36 medium-sized landfills
All quotas set by the Austrian Packaging Ordinance, the EU Directive and the Ministry of Environment have been reached
90 % of the Austrians are convinced of separate waste collection and try to collect packaging separately.
4. Results and Experiences