1 global market overview€¦ · global market overview in the late 1990s, wealth management was...
TRANSCRIPT

JWBK082-01 JWBK082-Maude May 29, 2006 20:47 Char Count= 0
1
Global Market Overview
In the late 1990s, wealth management was reported to be the fastest growing sector of thefinancial services industry. Though the 2000–2002 downturn took its toll on many wealthmanagement providers, looking ahead, the industry remains attractive, with strong fundamen-tals. Globally, the number of millionaires continues to grow at more than 7% a year – around 6times the pace of the population as a whole.1 The industry is certainly up there with investmentbanking in terms of fun, glamour and glitz. However, to meet the evolving needs of clients,the industry has become increasingly broad and complex.
For decades, the industry was dominated by a select group of sleepy, very traditional players.But during the 1990s, the industry changed almost beyond recognition. There was a huge influxof new players offering a wide range of specialised products and services to a broader, evermore demanding client base.
The aims of this introductory chapter are to:� Define the wealth management market and provide an idea of its size and recent growth.� Examine the key drivers of the wealth management industry.� Outline the economics of the industry.� Briefly describe the competitive landscape.
Most of the themes introduced here will be explored in more detail in later chapters.
1.1 THE WEALTH MANAGEMENT MARKET
There is no generally accepted standard definition of wealth management – both in terms ofthe products and services provided and the constitution of the client base served – but a basicdefinition would be financial services provided to wealthy clients, mainly individuals and theirfamilies.
Private banking forms an important, more exclusive, subset of wealth management. Atleast until recently, it largely consisted of banking services (deposit taking and payments),discretionary asset management, brokerage, limited tax advisory services and some basicconcierge-type services, offered by a single designated relationship manager. On the whole,many clients trusted their private banking relationship manager to ‘get on with it’, and took alargely passive approach to financial decision making.
Private banking has a very long pedigree, stretching back at least as far as the seventeethcentury in the case of some British private banks.2 It is, however, only really over the last15 years or so that the term ‘wealth management’ has found its way into common industryparlance. It developed in response to the arrival of mass affluence during the latter part of
1 The compound annual growth rate (CAGR) in the global number of millionaires, 2002–2004, is 7.4% (source: Capgemini/MerrillLynch). The CAGR in the global population, 2000–2005, is 1.2% (source: Population Division of the Department of Economic andSocial Affairs of the United Nations Secretariat, 2004).
2 See Maude and Molyneux (1996), Chapter 1, for a discussion of private banking origins and historical evolution.
1
COPYRIG
HTED M
ATERIAL

JWBK082-01 JWBK082-Maude May 29, 2006 20:47 Char Count= 0
2 Global Private Banking and Wealth Management
the twentieth century; more sophisticated client needs throughout the wealth spectrum; adesire among some clients to be more actively involved in the management of their money;a willingness on the part of some types of financial services players, such as retail banksand brokerages, to extend their offerings to meet the new demand; and, more generally, arecognition among providers that, for many clients, conventional mass-market retail financialservices are inadequate. Wealth management is therefore a broader area of financial servicesthan private banking in two main ways:� Product range. As in private banking, asset management services are at the heart of the wealth
management industry. But wealth management is more than asset management. It focuseson both sides of the client’s balance sheet. Wealth management has a greater emphasis onfinancial advice and is concerned with gathering, maintaining, preserving, enhancing andtransferring wealth. It includes the following types of products and services:(a) Brokerage.(b) Core banking-type products, such as current accounts, time deposits and liquidity man-
agement.(c) Lending products, such as margin lending, credit cards, mortgages and private jet
finance.(d) Insurance and protection products, such as property and health insurance, life assurance
and pensions.(e) Asset management in its broadest sense: discretionary and advisory, financial and non-
financial assets (such as real estate, commodities, wine and art), conventional, structuredand alternative investments.
(f) Advice in all shapes and forms: asset allocation, wealth structuring, tax and trusts,various types of planning (financial, inheritance, pensions, philanthropic), family-disputearbitration – even psychotherapy to children suffering from ‘affluenza’.
(g) A wide range of concierge-type services, including yacht broking, art storage, real estatelocation, and hotel, restaurant and theatre booking.
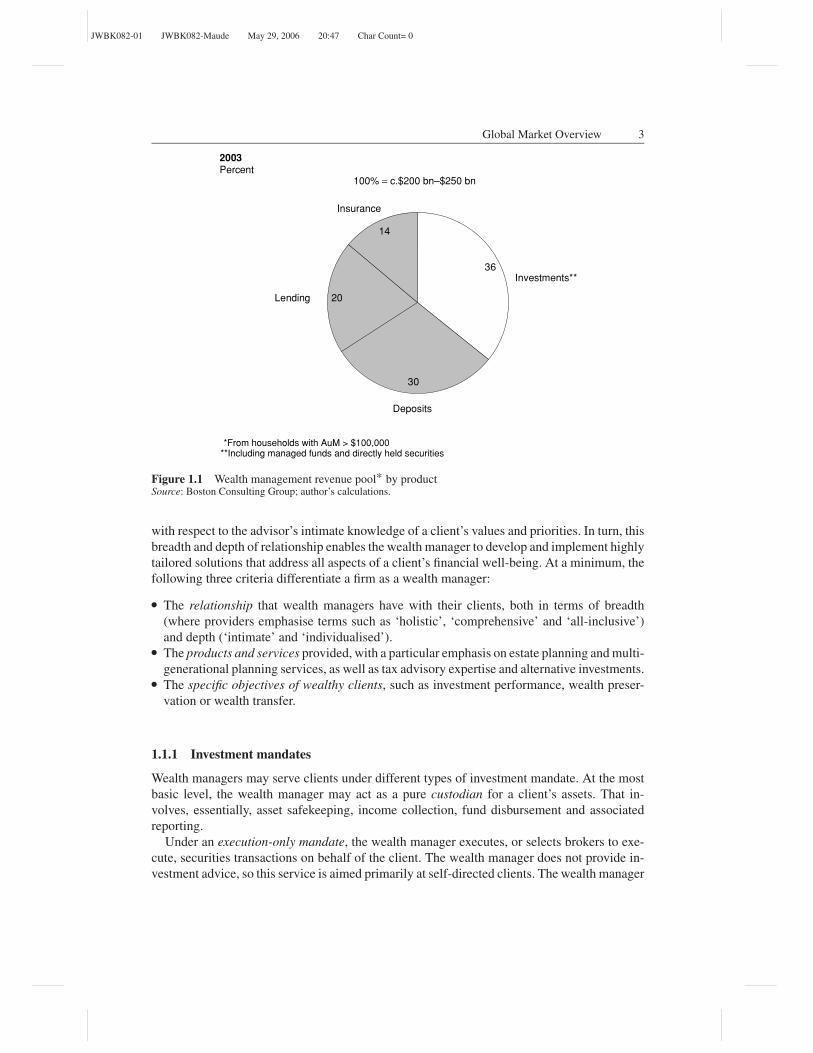
Based on research by BCG, non-cash investments may account for no more than c.36% ofthe global wealth management revenue pool (see Figure 1.1).� Client segments. Private banking targets only the very wealthiest clients or high net worthindividuals (HNWIs): broadly speaking, those with more than around $1 million in investableassets. Wealth management, by contrast, targets clients with assets as low as $100 000, i.e.affluent as well as high net worth (HNW) clients.
Robert J. McCann, President of the Private Client Group at Merrill Lynch, provided asuccinct definition of wealth management at a recent industry conference:
[Wealth management] addresses every aspect of a client’s financial life in a consultative and ahighly individualised way. It uses a complete range of products, services and strategies. A wealthmanager has to gather information both financial and personal to create an individualised series ofrecommendations, and be able to make those recommendations completely tailored to each client.Off the shelf – it won’t do. What [wealth management] requires is connecting with clients on apersonal level that is way beyond the [retail financial services] industry norm.
When asked to describe the factors that distinguish their services from other types of retailfinancial institution, wealth managers emphasise the uniqueness of their client relationships –relationships that are broad, in that they encompass all areas of a client’s financial life, and deep
JWBK082-01 JWBK082-Maude May 29, 2006 20:47 Char Count= 0
Global Market Overview 3
36
30
20
14
Investments**
Deposits
Lending
Insurance
2003Percent
*From households with AuM > $100,000**Including managed funds and directly held securities
100% = c.$200 bn–$250 bn
Figure 1.1 Wealth management revenue pool* by productSource: Boston Consulting Group; author’s calculations.
with respect to the advisor’s intimate knowledge of a client’s values and priorities. In turn, thisbreadth and depth of relationship enables the wealth manager to develop and implement highlytailored solutions that address all aspects of a client’s financial well-being. At a minimum, thefollowing three criteria differentiate a firm as a wealth manager:� The relationship that wealth managers have with their clients, both in terms of breadth
(where providers emphasise terms such as ‘holistic’, ‘comprehensive’ and ‘all-inclusive’)and depth (‘intimate’ and ‘individualised’).� The products and services provided, with a particular emphasis on estate planning and multi-generational planning services, as well as tax advisory expertise and alternative investments.� The specific objectives of wealthy clients, such as investment performance, wealth preser-vation or wealth transfer.
1.1.1 Investment mandates
Wealth managers may serve clients under different types of investment mandate. At the mostbasic level, the wealth manager may act as a pure custodian for a client’s assets. That in-volves, essentially, asset safekeeping, income collection, fund disbursement and associatedreporting.
Under an execution-only mandate, the wealth manager executes, or selects brokers to exe-cute, securities transactions on behalf of the client. The wealth manager does not provide in-vestment advice, so this service is aimed primarily at self-directed clients. The wealth manager

JWBK082-01 JWBK082-Maude May 29, 2006 20:47 Char Count= 0
4 Global Private Banking and Wealth Management
is typically required to seek ‘best execution’ for client transactions, i.e. executing transactionsso that the client’s total cost, or proceeds, in each transaction is as favourable as possible tothe client under the particular circumstances at that time.
The next level of investment mandate is a formal service-level contract, of which there aretwo types:� Advisory mandate, under which the wealth manager will discuss and advise the client on
investment opportunities. The client then makes the buying and selling decisions based on acombination of his or her own ideas and the investment advice of the wealth manager. Thewealth manager will not make any investment decision without the client’s prior approval.The wealth manager is generally paid a commission based on the volume of executed trades,plus custody fees.� Discretionary mandate, under which the wealth manager usually has sole authority to buyand sell assets and execute transactions for the benefit of the client, in addition to providinginvestment advice. Discretionary management works by starting off with the constructionof a brief with the client, detailing investment aims, level of risk-aversion and other factorsthat will influence the portfolio. In some discretionary accounts, the wealth manager is givenonly limited investment authority. However, in all cases, major investment decisions, suchas changing the account’s investment strategy or asset allocation guidelines, may be subjectto the client’s approval. The wealth manager is generally paid on the basis of a flat-feearrangement linked to the value of the assets under management. The gross revenue marginof a discretionary mandate is typically at least double that of an execution-only mandate.
The proportion of clients using advisory mandates is, in general, relatively stable acrossthe various client wealth bands. Execution-only mandates become more prevalent, and discre-tionary mandates less prevalent, as client wealth rises. That typically reflects a greater degreeof financial sophistication among the wealthier clients.
Wealth management can mean different things in different geographic regions. The US andEurope have traditionally stood at two extremes in this regard. In the US, wealth management ismore closely allied to transaction-driven brokerage and is typically investment-product driven.In Europe, the term is more synonymous with traditional private banking, with its greateremphasis on advice and exclusivity.
1.1.2 Offshore versus onshore
A fundamental distinction within wealth management is onshore versus offshore. Onshorewealth management is the provision of products and services within the client’s main countryof residence. Offshore wealth management, by contrast, serves clients wishing to manage theirwealth outside their main country of residence for reasons such as: financial confidentiality;legal-system flexibility; tax considerations; the lack of appropriate products and services on-shore; a low level of trust in domestic financial markets and governments; and the need forsafety and geographical diversification in response to domestic political and macroeconomicrisks. Indeed, some clients treat their offshore account(s) primarily as a ‘vault’.
Some practitioners go further and refer to four types of wealth management. Take the exam-ple of a Swiss wealth manager. It will, of course, have a presence in Switzerland: its domesticbusiness. Its domestic business will typically serve two types of clients. First, there are Swissclients seeking to keep assets within their own country of residence, which is referred to as the

JWBK082-01 JWBK082-Maude May 29, 2006 20:47 Char Count= 0
Global Market Overview 5
Importance of bank attributes* for given types of bank%
Off
sh
ore
70
00
Onshore
7035
35
Caring//attentive
Accessible// conveniently located branches
Brand//reputation
Proactive
Helpful
Relationships
Forward looking
Easy to use
Innovative
Professional
Approachable/ easy to deal with
Keep promise
Consistent
Sincere/honest
Transparent
Flexible
Trustworthy and reliable
Confidentiality
Performance
*Multiple answers possible
Figure 1.2 Wealth manager attributesSource: McKinsey & Company, ‘Annual Investment and Wealth Management CEO Conference, 2005’. Reproducedby permission.
wealth manager’s domestic onshore business. Its domestic business may also serve clients fromoutside Switzerland, which is referred to as the wealth manager’s domestic offshore business.The Swiss wealth manager may also have a presence outside Switzerland: its internationalbusiness. That may include a presence in Italy, serving both Italian clients (i.e. its internationalonshore business) and non-Italian clients (i.e. its international offshore business).
The onshore/offshore distinction matters because these two types of wealth managementhave very different client appeal, dynamics, product sets and economics (see below). Figure 1.2illustrates that offshore private banks need, in particular, strong brands, trustworthiness and ahigh degree of professionalism. For onshore private banks, there is greater emphasis on localbranch presence, strong relationships and ‘user friendliness’.
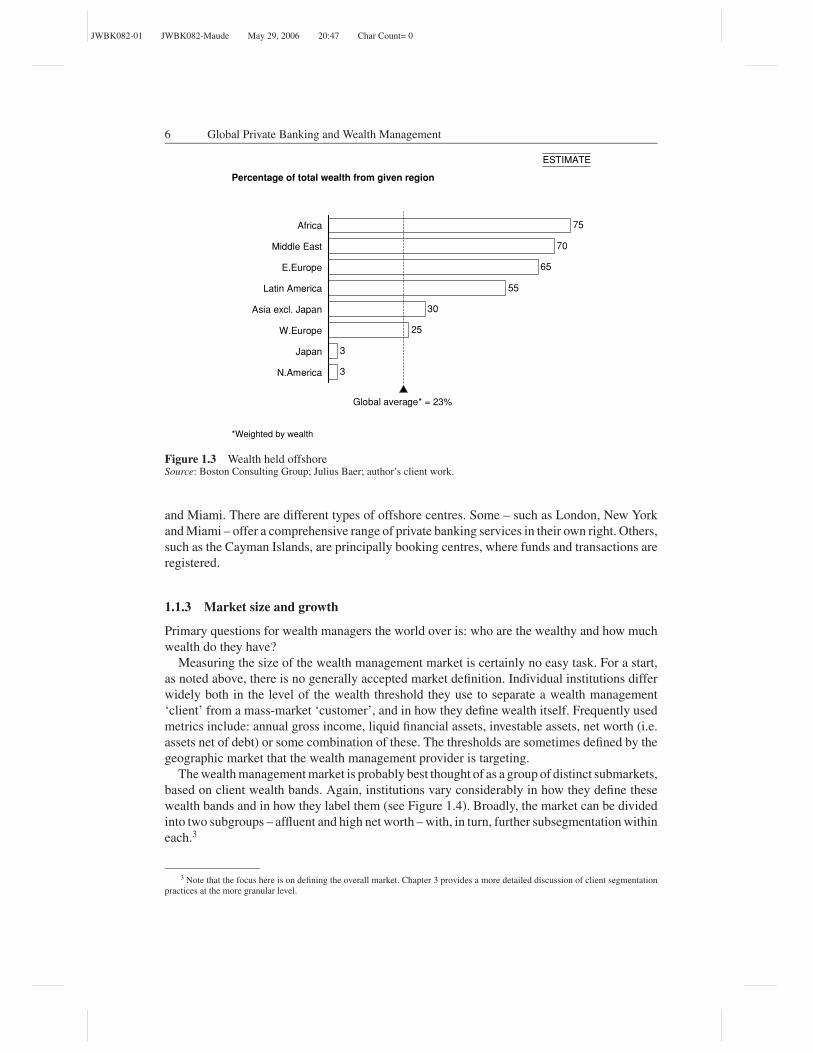
As Figure 1.3 illustrates, the proportion of wealth managed offshore varies significantlyacross regions. There is a general trend for assets to shift onshore, particularly in WesternEurope, which is primarily driven by a series of global tax initiatives (see Chapter 9). But thatshift is happening at different speeds, and some regions – including Africa, the Middle East,Latin America and Eastern Europe – continue to have a sizeable offshore wealth component.At the client level, the proportion of wealth held offshore tends to rise in line with the level ofwealth. In terms of offshore wealth destinations, the main offshore centres are Switzerland, theUnited Kingdom (including the UK Channel Islands – Jersey, Guernsey and Isle of Man), HongKong, Singapore, Luxembourg, Gibraltar, Monaco, Cayman Islands, the Bahamas, New York
JWBK082-01 JWBK082-Maude May 29, 2006 20:47 Char Count= 0
6 Global Private Banking and Wealth Management
*Weighted by wealth
Percentage of total wealth from given region
Middle East
E.Europe
Latin America
Asia excl. Japan
75
70
65
55
30
25
3
3
Africa
W.Europe
Japan
N.America
Global average* = 23%
ESTIMATE
Figure 1.3 Wealth held offshoreSource: Boston Consulting Group; Julius Baer; author’s client work.
and Miami. There are different types of offshore centres. Some – such as London, New Yorkand Miami – offer a comprehensive range of private banking services in their own right. Others,such as the Cayman Islands, are principally booking centres, where funds and transactions areregistered.
1.1.3 Market size and growth
Primary questions for wealth managers the world over is: who are the wealthy and how muchwealth do they have?
Measuring the size of the wealth management market is certainly no easy task. For a start,as noted above, there is no generally accepted market definition. Individual institutions differwidely both in the level of the wealth threshold they use to separate a wealth management‘client’ from a mass-market ‘customer’, and in how they define wealth itself. Frequently usedmetrics include: annual gross income, liquid financial assets, investable assets, net worth (i.e.assets net of debt) or some combination of these. The thresholds are sometimes defined by thegeographic market that the wealth management provider is targeting.
The wealth management market is probably best thought of as a group of distinct submarkets,based on client wealth bands. Again, institutions vary considerably in how they define thesewealth bands and in how they label them (see Figure 1.4). Broadly, the market can be dividedinto two subgroups – affluent and high net worth – with, in turn, further subsegmentation withineach.3
3 Note that the focus here is on defining the overall market. Chapter 3 provides a more detailed discussion of client segmentationpractices at the more granular level.

JWBK082-01 JWBK082-Maude May 29, 2006 20:47 Char Count= 0
Global Market Overview 7
Investable asset
definitions
• Definition: financial assets, often liquid (e.g. excludes property)
• Benefits: useful for middle aged people or older
• Limitations: does not reveal complete financial profile if sizeable portion of assets derived from business/partnership
Institution/source
Investable assets
0 $25,000 100,000 200,000 250,000 500,00 5 MM 10 MM
US retail bank
Global institution
Capgemini/Merrill Lynch WorldWealthReport
300,000 1 MM 50 MM
Credit Suisse
Mass affluent Upscale affluent HNW
UHNWHNW
US institution Affluent
Emerging affluent
HNW VHNW
VIP Forum Decamillionaire
US private client survey* HNWAffluentEmerging affluent** VHNW
3 MM
UHNW
Mass affluent HNW
Income definitions• Definition: annual gross household income
• Benefits: useful for targeting young potential customers (i.e. the “nouveau riche”)
• Limitations: not meaningful for elderly, inheritance recipients and big spenders
Institution/source
Household income
0 75,000 100,000 125,000 150,000 175,000 200,000 225,000 250,000
European universal bank
Mendelsohn Affluent Survey
Net worth
definitions
Net worth
definitions
• Definition:Assets–Liabilities or
(Financial Assets + Non-financial Assets)–Debts
• Benefits: useful for the very rich and those with sizeable interests in a business/partnership
• Limitations: not useful for the young
Institution/source
0 250,000 500,000 1M 5M 50M
• Coutts HNW
• J.P. Morgan Chase/ Goldman Sachs HNW
Net worth
* Income must be >$100 K; affluent+ people must be between age 30-70; investable assets are defined as assets including 401K and retirement assets; but
excludes primary home
** Age 21-44
*** Affluent defined as either >$100K in income or >$500 K in net worth (not including property)† HNW defined on basis of investable assets, not net worth
†† Not including propertyNote: Not drawn to scale
Affluent*** HNW† Pentamillionaire††• Spectrem Group
Figure 1.4 What is wealthy? Client indicative wealth threshold definitionsSource: Author’s analysis.
JWBK082-01 JWBK082-Maude May 29, 2006 20:47 Char Count= 0
8 Global Private Banking and Wealth Management
Example 1
Example 2
Example 3
Example 4
Example 5
• Minimum account size USD 1m
• USD 5m+of bankable assets
• Minimum account size USD 0.5m or• Use of derivative products or• Use of discretionary mandate or• Language requirements
• Decision of relationship manager based on assessment of client's financial potential
• Minimum USD 0.2m with minimum advisory management services
• Minimum USD 0.5m in discretionary management with limits on investment possibilities
• Minimum USD 1m in discretionary management without limits
EXAMPLES OF DIFFERENT ENTRY CRITERIA APPLIED BY PRIVATE BANKS
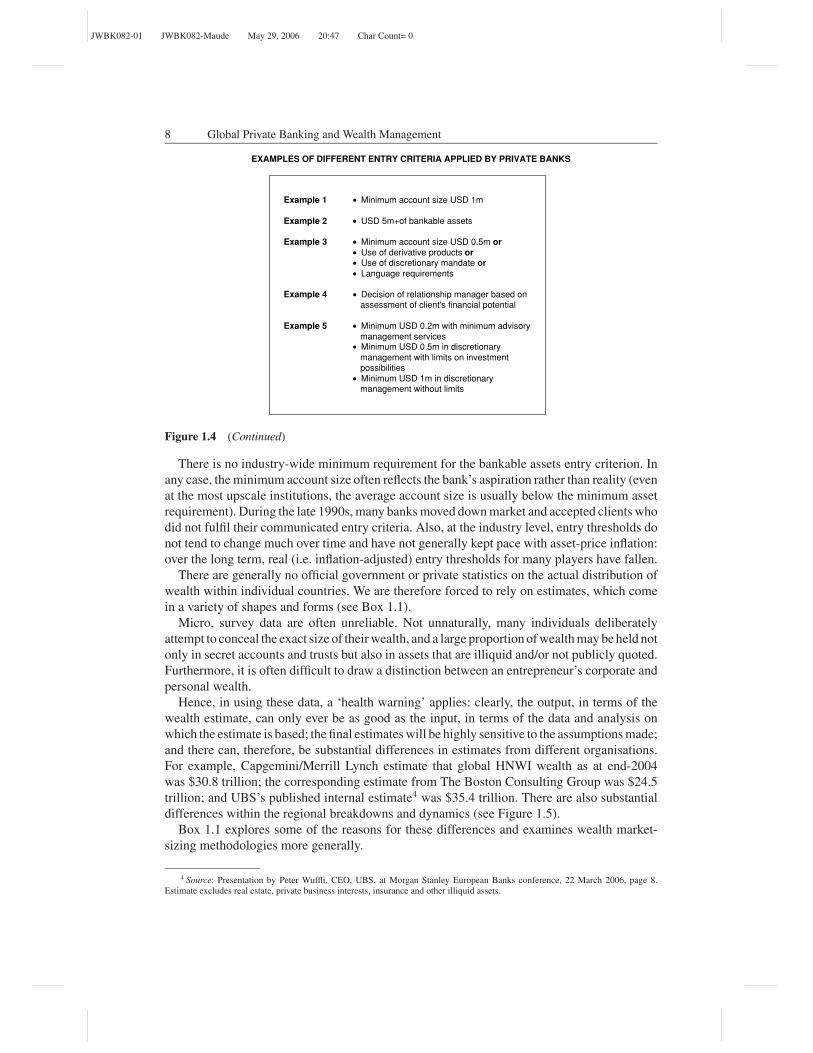
Figure 1.4 (Continued)
There is no industry-wide minimum requirement for the bankable assets entry criterion. Inany case, the minimum account size often reflects the bank’s aspiration rather than reality (evenat the most upscale institutions, the average account size is usually below the minimum assetrequirement). During the late 1990s, many banks moved down market and accepted clients whodid not fulfil their communicated entry criteria. Also, at the industry level, entry thresholds donot tend to change much over time and have not generally kept pace with asset-price inflation:over the long term, real (i.e. inflation-adjusted) entry thresholds for many players have fallen.
There are generally no official government or private statistics on the actual distribution ofwealth within individual countries. We are therefore forced to rely on estimates, which comein a variety of shapes and forms (see Box 1.1).
Micro, survey data are often unreliable. Not unnaturally, many individuals deliberatelyattempt to conceal the exact size of their wealth, and a large proportion of wealth may be held notonly in secret accounts and trusts but also in assets that are illiquid and/or not publicly quoted.Furthermore, it is often difficult to draw a distinction between an entrepreneur’s corporate andpersonal wealth.
Hence, in using these data, a ‘health warning’ applies: clearly, the output, in terms of thewealth estimate, can only ever be as good as the input, in terms of the data and analysis onwhich the estimate is based; the final estimates will be highly sensitive to the assumptions made;and there can, therefore, be substantial differences in estimates from different organisations.For example, Capgemini/Merrill Lynch estimate that global HNWI wealth as at end-2004was $30.8 trillion; the corresponding estimate from The Boston Consulting Group was $24.5trillion; and UBS’s published internal estimate4 was $35.4 trillion. There are also substantialdifferences within the regional breakdowns and dynamics (see Figure 1.5).
Box 1.1 explores some of the reasons for these differences and examines wealth market-sizing methodologies more generally.
4 Source: Presentation by Peter Wuffli, CEO, UBS, at Morgan Stanley European Banks conference, 22 March 2006, page 8.Estimate excludes real estate, private business interests, insurance and other illiquid assets.

JWBK082-01 JWBK082-Maude May 29, 2006 20:47 Char Count= 0
Global Market Overview 9
Box 1.1 Wealth market measurement methodologies: lies, damn lies and wealth statistics?
Most estimates of the wealth market for a given country (or region) follow a two-stepmethodology:� Estimate the stock of total wealth.� Estimate how that wealth is distributed across the adult population.
To estimate the stock of total wealth, basic source data are typically available from nationalstatistical offices, central banks and investment industry associations. In the absence ofwealth-stock data, one approach is to cumulate national accounts-based private savings flowdata. Another approach is to rely on the relationship between net private investment assetsand nominal gross domestic product (GDP). For both approaches, the financial asset dataare captured at book value, so a market-value adjustment is required, based on movementsin equity, bond and real estate prices. To the extent that offshore investment flows are notaccurately reflected in all national accounts data, a further adjustment will be required.
Total wealth is then distributed within each country using the relevant official statisticsfor those countries where such data are available. For countries without such data, estimatesare made on the basis of the wealth distribution patterns of countries with similar incomedistributions. Income-distribution data can be summarised by the ‘Gini coefficient’, whichmeasures the extent to which the distribution of income (or, in some cases, consumptionexpenditure) among individuals or households within an economy deviates from a perfectlyequal distribution. The coefficient falls between zero for perfect equality and one for extremeinequality. Gini coefficients for individual countries vary between close to 0.25 for egali-tarian high-income countries such as Japan and Sweden and close to 0.6 for Brazil, whichis one of world’s most inegalitarian countries. The World Bank (2005) provides estimatesof the Gini coefficient for most countries in its World Development Indicators publication;its most recent estimates show the US coefficient as 0.41 and the UK coefficient as 0.36.(Calculating the Gini coefficient is based on the Lorenz curve, which plots the cumulativepercentages of total income received against the cumulative number of recipients, startingwith the poorest individual or household. The coefficient measures the area between theLorenz curve and a hypothetical line of absolute equality, expressed as a percentage of themaximum area under the line.)
Within this general methodology, approaches vary, particularly with regard to how wealthis defined. For example:� The Capgemini/Merrill Lynch annual World Wealth Report defines the market in terms
of individuals with financial wealth of more than $1 million. Its data include privateequity holdings as well as all forms of publicly quoted equities, bonds and funds, andcash deposits. It excludes ownership of collectibles and real estate used for primaryresidences. Offshore investments are theoretically accounted for but, in practice, onlyinsofar as countries are able to make accurate estimates of relative flows of property andinvestment in and out of their jurisdictions. It accommodates undeclared savings in itsfigures. It applies the methodology to 68 countries, which account for 98% of global GDPand 99% of global equity market capitalisation.� The Boston Consulting Group (BCG), in its most recent annual Global Wealth Report(2005), defines the market in terms of assets under management (AuM). For this itincludes listed securities, held either directly or indirectly through managed funds, cash

JWBK082-01 JWBK082-Maude May 29, 2006 20:47 Char Count= 0
10 Global Private Banking and Wealth Management
deposits, and life and pension assets. For larger countries, for 2004 and also for pastyears, it calculates AuM based on national accounts and other public records. For smallercountries, AuM is calculated as a proportion of nominal GDP, adjusted for country-specific economic factors. It calculates market movements as the weighted-average pricechanges of the asset classes held by households in each country, factoring in both domesticand overseas equity and bond holdings. To identify asset-holding patterns across differentcountries and wealth segments, it uses national statistics. When such data are not available,it assumes that countries with similar cultures and regulatory environments have similarasset-holding patterns. BCG defines ‘mass affluent investors’ as those with $100k–$1million in AuM, ‘emerging wealthy investors’ as those with $1 million–$5 million inAuM and ‘established wealthy investors’ as those with more than $5 million in AuM. Itnow provides estimates for 62 countries.� Datamonitor defines wealth by reference to onshore liquid assets only, including cash,equities, bonds and funds. Its typical approach is to use the UK as a base country: the UK isone of the few countries that has relatively robust liquid-asset distribution data (sourcedfrom HM Revenue and Customs). For other countries, it calculates total wealth frompublic data sources, and then establishes a distribution for that wealth based on a skewedversion of the UK’s wealth distribution. The degree of skew applied is determined by aseries of multipliers, which take into account factors such as population, asset holdingsper capita and relative Gini coefficients. Datamonitor defines ‘mass affluent’ individualsas those with liquid assets of $54k–$360k, HNWIs as those with liquid assets of $360k–$9 million and UHNWIs (ultra-high net worth individuals) as those with liquid assets ofmore than $9 million.
HNW wealth, 2004
$ trillion
*Latin America, Middle East and Africa
Not disclosed; estimate takes BCG’s $4.5 trillion estimate for 2003 (as published in The Economist, 10 June
2004), and assumes growth in line with that of non-Japan Asia
ROW*
Asia-Pacific
Europe
N.America
TOTAL
5.4
7.2
8.9
9.3
30.8
1.6
7.3
5.4
10.2
24.5
5.12.2
Capgemini/
Merrill Lynch BCG Difference
Japan**
3.8
-0.1
3.5
-0.9
6.3
**
Figure 1.5 HNW wealth estimate comparisonSource: Capgemini/Merrill Lynch; Boston Consulting Group; The Economist; author’s calculations.

JWBK082-01 JWBK082-Maude May 29, 2006 20:47 Char Count= 0
Global Market Overview 11
2004, $ trillions
*Japan, Germany, UK, France, Italy, Canada, Russia
11.7
14.9
14.3
HNW wealth
Globalfinancial
stock
Global GDP
30.8
40.9
136.0
US
Other G8*
G8 = $26.6 tn
Non-G8
Figure 1.6 Global HNW wealth in contextSource: Capgemini/Merrill Lynch; IMF; McKinsey Global Institute.
Regardless of the measurement methodology, the size of the wealth market is large. AsFigure 1.6 shows, the stock of global HNW wealth represents around a quarter of the globalfinancial stock (which includes all bank deposits, government and private debt securities, andequities). Also by way of context, HNW wealth is larger than the annual GDP of the G8, andis more than 2.5 times the size of US annual GDP.
Figure 1.7 shows that mass affluent wealth, i.e. the wealth of individuals holding $100k–$1 million of assets, makes up around two-thirds of the global wealth market. Turning toHNW wealth, as one would expect, North America and Europe currently dominate the market,accounting for 59% of the total, representing the wealth of 5.3 million millionaires. The averagewealth of the world’s 8.3 million millionaires is $3.7 million, but Latin American and Africanmillionaires stand out as having much higher average wealth levels.
How much wealth is booked or managed offshore? That is notoriously difficult to assess withmuch confidence – and, needless to say, estimates vary substantially. At one extreme, the TaxJustice Network estimated total offshore wealth as at end 2004 of c.$11.5 trillion, or 37% ofglobal HNW wealth, an estimate they consider conservative. Applying the indicative regionalonshore-offshore splits given in Figure 1.3 yields an estimated total offshore wealth of c.$7 tril-lion. The Boston Consulting Group estimate c.$6.4 trillion, or 7.5% of total global wealth, in2004.
In earlier work, BCG analysed the sources and destinations (‘booking centres’) of offshorewealth (see Figure 1.8). In terms of sources, they found that Europe accounted for more than halfof the total, flowing mainly to Switzerland, Luxembourg and the Channel Islands. Geographicproximity appears to be a key driver in selecting an offshore destination: Latin Americansfavour Miami, New York and the Caribbean; Asians favour Singapore and Hong Kong. But

JWBK082-01 JWBK082-Maude May 29, 2006 20:47 Char Count= 0
12 Global Private Banking and Wealth Management
5.2
5.6
17.3
66.7
5.2
9.3 2.7
8.92.6
7.2
2.3
3.7
0.31.0 0.3
>$100m
$5m-$20m
$100k-$1m
$1m-$5m
$20m-$100m
$30.8 tn
AfricaMiddle East
Latin America
N.America
HNW wealth($ tn)
Asia-Pacific
Europe
0.7 0.1
8.3 m
Average wealth per HNWI $m
3.7
7.03.3
12.3
3.1
3.4
3.4
No. of HNWIs(m)
2004
100% = $74 trillion−$93 trillion
Figure 1.7 Global wealth by region and client wealth bandSource: Boston Consulting Group: Capgemini/Merrill Lynch; author’s calculations.
Figure 1.8 Offshore wealth: sources and destinationsSource: Boston Consulting Group; Huw van Steenis, Morgan Stanley. Reproduced by permission.

JWBK082-01 JWBK082-Maude May 29, 2006 20:47 Char Count= 0
Global Market Overview 13
$ trillions
7.2
19.1
21.6
25.527.0
26.2 26.728.5
30.8
1986No. ofmillionaires
(m)
19
5.2n/a 5.9 7.0 7.2 7.1 7.2 7.7 8.3
97 1999 2000 2001 2002 2003 20041998
CAGRs, %1986-2004:1997-2000:
1997-2004:
8.412.2
7.12003-2004: 8.2
Figure 1.9 Growth in global HNW wealthSource: Capgemini/Merrill Lynch ‘World Wealth Report’ (various years); author’s calculations.
overall, Switzerland dominates the destinations, managing around one-third of total offshoreassets.5
Since 1986, global HNW wealth has grown at a compound annual growth rate (CAGR)of 8.4% (see Figure 1.9), substantially higher than the 5.6% CAGR of global nominal GDP.Growth was particularly strong during the late 1990s, linked to strong growth in global equitymarkets in particular. Market growth faltered during 2000–2002, and there was widespreadwealth destruction for the first time in recent history in 2001, driven by asset price falls and theglobal economic downturn. The market returned to growth in 2003, with further expansion in2004. But recent growth at 8.2% is well down on that seen in the late 1990s.
Since 1997, the highest growth in wealth has been in Asia, followed by Europe and NorthAmerica (see Figure 1.10). Recently, however, growth in the Middle East and Africa has pickedup very strongly. Globally, the number of millionaires continues to grow at more than 7% ayear – around 6 times the pace of the population as a whole.
1.2 KEY WEALTH DRIVERS
What are the key factors driving the growth in the wealth management market? These factorscan be divided into a group of drivers that are common to all wealth markets, and those driversthat are region specific. In considering wealth market growth, it is useful to decompose it intoappreciation of existing wealth, net new inflows from existing wealth owners and entry of newwealth owners. That, in turn, can have important implications for market accessibility.
There is also a group of less tangible factors at work. Kevin Phillips (2002) in his book,Wealth and Democracy, argues that a few common factors appear to support ‘wealth waves’,
5 Note that this analysis focuses on the stock of assets. As discussed in Chapters 9 and 10, the picture with regard to new offshoreasset flows would look very different.

JWBK082-01 JWBK082-Maude May 29, 2006 20:47 Char Count= 0
14 Global Private Banking and Wealth Management
CAGR, %
28.9
17.3
10.2
8.5
7.9
3.7
8.2
1.5
4.9
6.7
8.8
5.8
7.7
7.1
Middle East
Africa
N. America
Asia-Pacific
Latin America
Europe
TOTAL
2003-2004
1997-2004
Figure 1.10 Growth in HNW wealth by regionSource: Capgemini/Merrill Lynch ‘World Wealth Report’ (various years); author’s analysis.
including: a fascination with technology, creative finance, supportive government, the rule oflaw, patented inventions and an international dimension of immigrants and overseas conquests.
1.2.1 Generic drivers
A key driver of the wealth management market is clearly the growth of wealth itself and howit is distributed. In principle, the revenues of most financial services are driven by ‘surplus’wealth. As individuals grow wealthier, they make more use of financial services. Wealthyindividuals invest and spend more, they seek more protection for their existing wealth andlifestyle, and they feel comfortable borrowing large sums of money. They also seek advicewhen addressing this collection of financial needs.
Growth in wealth, in turn, is impacted by four main generic drivers: economic growth, assetprices, wealth allocation and demographic factors.
1.2.1.1 Economic growth
From a long-term perspective, the key wealth driver is economic growth (which, in turn, ulti-mately helps drive asset prices). Within aggregate economic growth, its balance/composition,volatility and the pattern of productivity growth also have an impact on wealth creation andallocation.
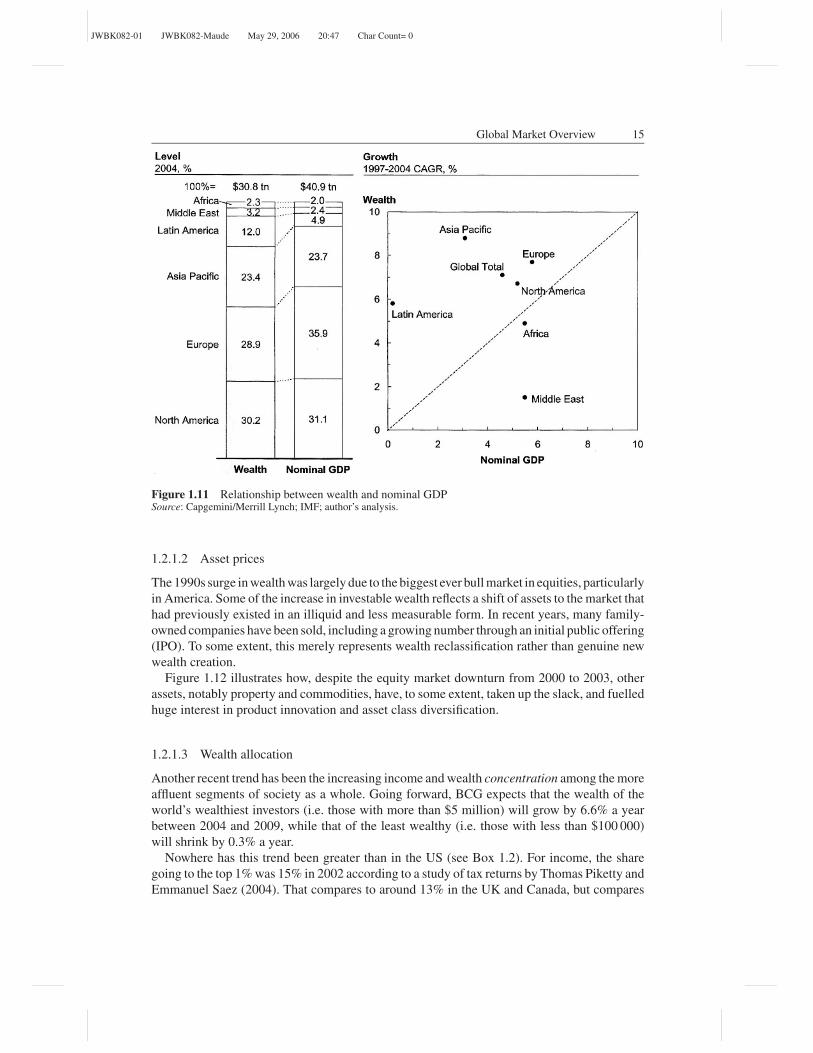
Figure 1.11 shows that growth in global wealth has exceeded that of global GDP in recentyears. Asia Pacific and Latin America stand out as having grown wealth well in excess of theirGDP growth rates, while the opposite has been the case in the Middle East. Latin Americaalso accounts for a disproportionately high share of global wealth relative to its share of globalGDP; on the other hand, Europe’s wealth share is disproportionately low.
JWBK082-01 JWBK082-Maude May 29, 2006 20:47 Char Count= 0
Global Market Overview 15
Figure 1.11 Relationship between wealth and nominal GDPSource: Capgemini/Merrill Lynch; IMF; author’s analysis.
1.2.1.2 Asset prices
The 1990s surge in wealth was largely due to the biggest ever bull market in equities, particularlyin America. Some of the increase in investable wealth reflects a shift of assets to the market thathad previously existed in an illiquid and less measurable form. In recent years, many family-owned companies have been sold, including a growing number through an initial public offering(IPO). To some extent, this merely represents wealth reclassification rather than genuine newwealth creation.
Figure 1.12 illustrates how, despite the equity market downturn from 2000 to 2003, otherassets, notably property and commodities, have, to some extent, taken up the slack, and fuelledhuge interest in product innovation and asset class diversification.
1.2.1.3 Wealth allocation
Another recent trend has been the increasing income and wealth concentration among the moreaffluent segments of society as a whole. Going forward, BCG expects that the wealth of theworld’s wealthiest investors (i.e. those with more than $5 million) will grow by 6.6% a yearbetween 2004 and 2009, while that of the least wealthy (i.e. those with less than $100 000)will shrink by 0.3% a year.
Nowhere has this trend been greater than in the US (see Box 1.2). For income, the sharegoing to the top 1% was 15% in 2002 according to a study of tax returns by Thomas Piketty andEmmanuel Saez (2004). That compares to around 13% in the UK and Canada, but compares

JWBK082-01 JWBK082-Maude May 29, 2006 20:47 Char Count= 0
16 Global Private Banking and Wealth Management
80
100
120
140
160
180
200
220
240
260
280
1994
Notes:1. UK residential property; Halifax house price index2. Based on US Treasury bonds3. Based on world equity market index of Morgan Stanley Capital International4. US Fed funds rate5. Based on Reuters–CRB index
1995 1996 1997 1998 1999 2000 2001 2002 2003 2004 2005
Equities (3)
Bonds (2)
Property (1)
Cash (4)
Commodities (5)
Indexed: 31 January 1994 = 100
Figure 1.12 Selected asset pricesSource: Author’s analysis.
Box 1.2 US Wealth Dynamics6
Recent trends
Every year since 1982, Forbes has published data on what staff of that magazine estimateto be the wealthiest 400 people in the United States. The Forbes wealth data show stronggrowth in real terms across a variety of dimensions from 1989 to 2001. There are, however,some striking differences within the period and across different groups (see Table 1.1).
Table 1.1 The wealthiest 400 people in the US according to Forbes: wealth by rank and averagewealth in millions of 2001 dollars
Year
Forbes rank 1989 1992 1995 1998 1999 2000 2001 2002Wealth by
1 7 106 7 746 17 002 63 214 89 716 64 318 54 000 42 36110 3 417 4 303 4 940 11 907 17 943 17 356 17 500 11 72350 1 736 1 537 2 068 3 139 4 222 4 798 3 900 3 152
100 957 984 1 034 1 840 2 533 2 654 2 000 1 773200 615 584 689 1 028 1 267 1 531 1 200 1 084300 478 430 500 731 897 1 000 875 763400 376 326 391 541 660 740 600 542
Average wealth 921 937 1 025 1 997 2 731 3 057 2 366 2 148
Memo item:Number of billionaires 97 92 107 205 278 301 266 205
Source: Kennickell (2003); US Federal Reserve Survey of Consumer Finances.
6 This box draws heavily on Kennickell (2003).
JWBK082-01 JWBK082-Maude May 29, 2006 20:47 Char Count= 0
Global Market Overview 17
From 1989 to 1995, overall mean Forbes wealth was relatively stable, as was the levelof wealth at most of the ranks of the distribution of this population up to around the top 50.The top 50 showed substantial growth in wealth over this period. From 1995 to 1999, theentire distribution shifted up, particularly at the top. By 1999, the wealth of the wealthiestindividual was 5.3 times larger than in 1995, while that of the tenth wealthiest individualwas 3.6 times higher. Over the same period, the cut-off point for membership of the Forbesgroup rose 69%. After 1999, the top end led the way to a general downturn in 2001 thatcontinued into 2002. Nonetheless, even at the end of the period, the entire distribution wassignificantly above the levels of 1989. The total wealth of the Forbes 400 as a proportion oftotal individual wealth ranged from 1.5% in 1989 to a high of 2.5% in 1998 to 2.2% in 2001.
The overall growth in the entire distribution of the Forbes wealth masked a considerableamount of composition churning. Of the 400 people in the 2001 list, 230 were not in the 1989list. Even between 1998 and 2001, nearly a quarter of the people on the list were replacedby others. Although some of the movement is explained by the transfer of wealth throughinheritance, the number of such instances appears to be small – only about 20 of the membersin the 1989 list did not appear in the 2001 list. Others may have died and fragmented theirwealth into pieces smaller than the Forbes cut-off. Persistence of individuals in the list washighest for people who were in the top 100. Of the people in the top 100 in the 2001 list,45 were included in the same group in 1989 and 23 others were in the lower ranks of thelist. Of the bottom 100 in 1989, only 29 remained in the 2001 list.
Historical perspective
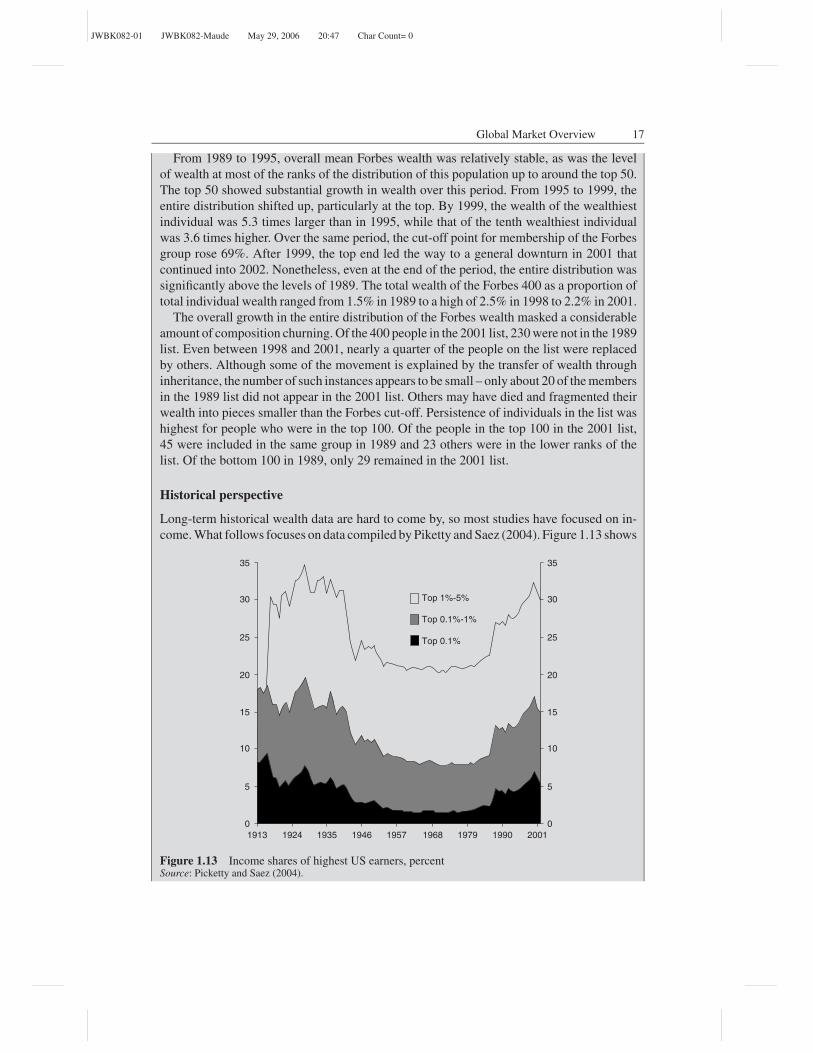
Long-term historical wealth data are hard to come by, so most studies have focused on in-come. What follows focuses on data compiled by Piketty and Saez (2004). Figure 1.13 shows
Top 1%-5%
Top 0.1%-1%
Top 0.1%
35
30
25
20
15
10
5
0
35
30
25
20
15
10
5
0
1913 1924 1935 1946 1957 1968 1979 1990 2001
Figure 1.13 Income shares of highest US earners, percentSource: Picketty and Saez (2004).

JWBK082-01 JWBK082-Maude May 29, 2006 20:47 Char Count= 0
18 Global Private Banking and Wealth Management
01916 1926 1936 1946 1956 1966 1976 1986 1996
10
20
30
40
50
60
70
80
90
100
0
10
20
30
40
50
60
70
80
90
100
Wage
Interest
Entrepreneurial Dividends
Rents
Figure 1.14 Sources of income, top 1% of earners, percentSource: Citigroup Global Markets (2005), based on Piketty and Saez (2004).
the share of income for the top 0.1%, 1% and 5% since 1913. The fortunes of the top 0.1%(roughly 100 000 households) fluctuate the most, and account for the bulk of the movementof the top 5%. Between World War II and the early 1980s, all of their income shares fell,partly linked to loss of capital income and progressive corporate and estate taxation. Butsince then, the income shares of these groups have all reverted pretty much to where theywere in the roaring 1920s, partly linked again to reductions in taxes. As Figure 1.14 shows,the way in which this income is earned has shifted, because in the earlier period, dividend andrental income were more important than they are now; wages and entrepreneurial receiptsnow dominate the income of the rich.
with levels of around 8% in Japan, France and Switzerland, for example.7 Take wealth, ratherthan income, and America’s disparity is even more stark. In 2001, the wealthiest 1% of house-holds controlled 33% of US wealth, while the lowest 50% of households held only 3%, ac-cording to the Federal Reserve.
The relative inequality in America reflects the people at the top doing unusually well. The top10% of Americans are nearly twice as well off as the top 10% of Nordic households. They arealso much further away from the US mean. As Robert Frank and Philip Cook (1996) point out in
7 The drivers of these differences are not entirely clear. Tax plays some part, but relative to the US, Canada is a high-tax country andSwitzerland a low-tax one. To some extent, the figures may be distorted because they are based on tax returns and in some countries itis easier to park income offshore than it is in others. In addition, people move. There is, for example, a programme in France currentlyto try to pursuade the rich to move back, as large numbers have apparently decamped to Belgium and the UK.

JWBK082-01 JWBK082-Maude May 29, 2006 20:47 Char Count= 0
Global Market Overview 19
their book The Winner-Take-All Society, new technology, globalisation and market economicshave changed the structure of many industries in such a way that their star performers now earnvastly more than the average. That has been most visible in sports (think golf, tennis, soccer,baseball and basketball stars) and the arts (think music, TV and movie icons, supermodels,designers, celebrity chefs, etc.), where the best can become global celebrities and typicallyearn far more than those who manage and advise them, whereas average performers receiveonly mediocre pay. Oprah Winfrey, who neatly combines both managing and performing inher company, Harpo Productions, became the world’s first self-made billionairess in 2003. Butsuperstar remuneration has also become widespread in less glamorous businesses, includinglaw, investment banking and hedge fund management.8
Going forward, government policy, such as the tax policies of the Bush administration, willprobably further exacerbate the wide gap between rich and poor. US inheritance tax has beenall but scrapped. Marginal rates on top incomes have fallen. Most important may be the 2003reduction in capital gains and dividends taxes, which will have a disproportionate impact onthe top 20% of households.
Continued growth in income inequality is one factor that is expected to support greater futurewealth concentration across the globe going forward.
1.2.1.4 Demographic factors
Demographics are also a powerful catalyst to wealth market development. The basic rationaleis as follows. The age group that has generally mattered most to the industry from a growthperspective is those aged 45–64. These are the people who are most likely to be accumulatingassets for retirement, while at the same time enjoying their peak years of earnings. Becauseof the baby boom that took place between 1946 and 1965, that age cohort has been growingrapidly from around 1991.
Economic and technological change has also been driving the recent growth in HNWIwealth and has led to a transformation in the profile of the contemporary wealthy individual.Entrepreneurial wealth has become increasingly important, while the significance of inheritedwealth has declined somewhat.
Going forward, though, inheritance-related wealth transfers are likely to increase in impor-tance and are expected to peak in 2015. It is important to note that this, of course, is not newwealth – merely a redistribution of existing wealth. The baby boomers are poised to benefitfrom a substantial generational transfer of assets as their parents leave inheritances that could,in the US, easily exceed $41 trillion9 over their children’s lifetime. Boomer parents enjoyed thestrongest asset growth rate of any demographic group over the last decade. How these assetswill be distributed among the boomer group, and what effect this pending transfer will have onboomer savings patterns and on the industry, both pre- and post-transfer, is not entirely clear.One suggestion is that it will create opportunities in two main ways:
1. ‘Money in motion’, a chance for wealth managers to grab share (‘wealth redistribution’) asclients potentially switch providers (one study, Grove and Prince (2003), found that a full92% of heirs switch wealth managers after receiving their inheritance).
2. Expand the addressable market, because younger clients tend to use wealth managers morethan their parents, who often hold securities directly.
8 Dew-Becker and Gordon (2005) show that corporate executives now account for more than half of the incomes of the top 0.1%of the US income distribution. The ratio of the pay of US chief executive officers to average wages rose from 27 in 1973 to 300 in2000.
9 This is the lower-bound estimate of Havens and Schervish (1999), confirmed in their 2003 paper.

JWBK082-01 JWBK082-Maude May 29, 2006 20:47 Char Count= 0
20 Global Private Banking and Wealth Management
1.2.2 Regional drivers
Though there are clear differences among the drivers of wealth growth at the individual countrylevel – reflecting, in part, different stages of market evolution and maturity – some regionalpatterns and stylised facts emerge. Wealthy clients’ international lifestyles and business in-terests mean that a grasp of the regional dimensions is important to serve these clients well.Appendix 1 provides a more detailed country-by-country analysis.
1.2.2.1 North America: Industry shift towards full-service model
In the US and Canada, the key wealth drivers are well known. Chief among them are consistentlyhigh economic and productivity growth rates. Wealth has also been driven by strong USfinancial market returns,10 particularly equities, in which North American investors hold morethan half their assets – far more than the global average. The bulk of the wealth is heldonshore, reflecting low domestic tax rates and general economic stability. Though the earlyphases of economic development were dominated by family businesses, start-up businesseshave grown significantly since the 1980s. In the 1990s, there was a further pick-up in thenumber of entrepreneurs, and the booming IPO market turned many of them into instantmillionaires.11 Most recently, for example, the August 2005 IPO of Google, the Internet searchengine company, is reported to have created 5 billionaires and 1 000 millionaires.
The bulk of America’s wealthy individuals and families are self-made. During the periodfrom the early 1950s to the mid-1970s, many millionaires were senior corporate executives.However, from the early 1980s the bulk of the newly created wealth has come from en-trepreneurs; the market was given a boost during the mid-to-late 1980s as there was a tendencyfor wealth to be liquidated through leveraged buyouts. The majority of these wealthy individualsare retired business owners, corporate executives or other professionals. A third of respondentsto US Trust’s June 2002 Survey of Affluent Americans emphasised earnings from corporateemployment, private business, professional practice and securities; a quarter emphasised realestate. By far the least important source of wealth was inheritance.
Demographic factors have also played a strong role. There are around 60 million US babyboomers at present, and the cohort is likely to continue growing for the next decade to around80 million.
US UHNW wealth has recently been growing particularly strongly. Many of the wealthiestfamilies have their own private investment offices, or ‘family offices’, with a staff of profes-sionals providing a variety of wealth management services.
1.2.2.2 Western Europe: Wealth transfer between generations
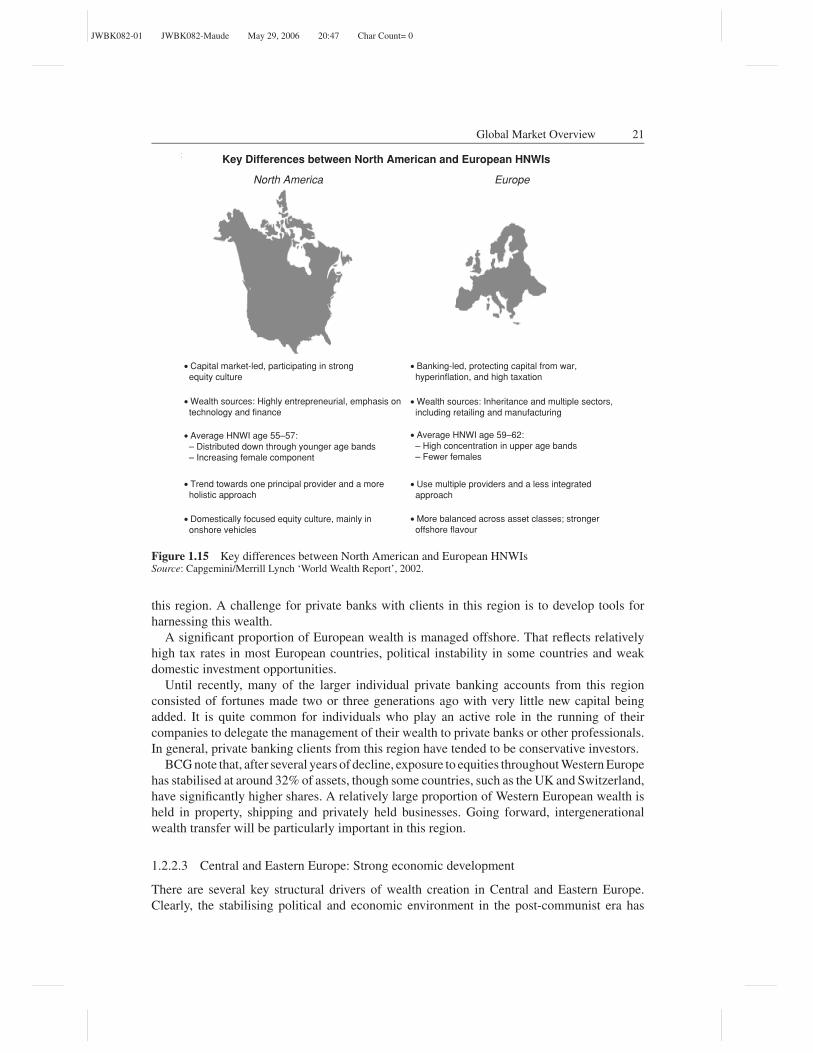
Western Europe is one of the most mature wealth management markets. In contrast to theUS (see Figure 1.15), it includes a significant proportion of global ‘old’ wealth – associatedwith inheritance and more traditional forms of asset growth rather than entrepreneurial wealthcreation. A significant proportion of industrial companies remain privately owned, particularlyin Germany and Italy. That, together with a tendency for wealth to be tied up in land andproperty in some countries in particular, has contributed to a degree of wealth illiquidity in
10 Domestic financial market returns are relevant because of investors’ well-documented home bias.11 During this period, Silicon Valley originated a term to describe the sort of money that frees an individual from ever having to
work again: ‘fuck-you money’.
JWBK082-01 JWBK082-Maude May 29, 2006 20:47 Char Count= 0
Global Market Overview 21
Key Differences between North American and European HNWIs
North America Europe
• Capital market-led, participating in strong equity culture
• Banking-led, protecting capital from war, hyperinflation, and high taxation
• Wealth sources: Inheritance and multiple sectors, including retailing and manufacturing
• Average HNWI age 59–62: – High concentration in upper age bands – Fewer females
• Use multiple providers and a less integrated approach
• More balanced across asset classes; stronger offshore flavour
• Wealth sources: Highly entrepreneurial, emphasis on technology and finance
• Average HNWI age 55–57: – Distributed down through younger age bands – Increasing female component
• Trend towards one principal provider and a more holistic approach
• Domestically focused equity culture, mainly in onshore vehicles
Figure 1.15 Key differences between North American and European HNWIsSource: Capgemini/Merrill Lynch ‘World Wealth Report’, 2002.
this region. A challenge for private banks with clients in this region is to develop tools forharnessing this wealth.
A significant proportion of European wealth is managed offshore. That reflects relativelyhigh tax rates in most European countries, political instability in some countries and weakdomestic investment opportunities.
Until recently, many of the larger individual private banking accounts from this regionconsisted of fortunes made two or three generations ago with very little new capital beingadded. It is quite common for individuals who play an active role in the running of theircompanies to delegate the management of their wealth to private banks or other professionals.In general, private banking clients from this region have tended to be conservative investors.
BCG note that, after several years of decline, exposure to equities throughout Western Europehas stabilised at around 32% of assets, though some countries, such as the UK and Switzerland,have significantly higher shares. A relatively large proportion of Western European wealth isheld in property, shipping and privately held businesses. Going forward, intergenerationalwealth transfer will be particularly important in this region.
1.2.2.3 Central and Eastern Europe: Strong economic development
There are several key structural drivers of wealth creation in Central and Eastern Europe.Clearly, the stabilising political and economic environment in the post-communist era has

JWBK082-01 JWBK082-Maude May 29, 2006 20:47 Char Count= 0
22 Global Private Banking and Wealth Management
been supportive. For some countries in the region, the prospect of European Union (EU)accession, with its associated real economic convergence, has led to high, sustained growthover recent years. That, in turn, has been a result of capital availability (including foreigndirect investment, EU structural funds, domestic investment and saving) and gains in capitaland labour productivity (linked, in part, to privatisation and restructuring).
Poland, Hungary and the Czech Republic, for example, have recently benefited greatly froman influx of foreign capital as the last hurdles to full membership of the EU were removed.In 2004, GDP growth averaged 4.3% in these countries. Simultaneously, Russia continued theimpressive recovery from its late 1990s financial crisis, posting GDP growth of 7.2%; that,combined with the oil price rise, has generated very strong growth in the local equity market.
That the early stages of the transition from communism to market-oriented economiesallowed many opportunists to get rich quick is well known. Some did so honestly but, as TheEconomist put it, ‘many more cheated, bribed and stole from the state or small investors, usingconniving banks as a source of everlasting loans and a place to wash their money’.
In Russia, the wealth market has been supported by a slew of IPOs and by the recentoil price rise, which has helped stabilise the economy, given that it is the second-largest oilexporter in the world. But political instability, and a lack of services aimed at long-term wealthpreservation and wealth transfer, have traditionally driven much of the wealth offshore. TheRussian Finance Ministry officially projects that capital flight will rise to $10 billion in 2005.
Throughout the region, there is also a legitimate – more onshore-oriented – affluent middleclass emerging, supported by market liberalisation, low inflation and interest rates, steadying lo-cal currencies, higher risk-adjusted local returns, a growing number of entrepreneurs and smallbusinesses, and broad-based increases in real disposable income. Eastern Europe’s newly afflu-ent people are younger, better educated, more familiar with technology and more likely to be en-trepreneurs – with an associated greater appetite for credit – than their counterparts in the West.
1.2.2.4 Asia-Pacific: Strong economic development
Strong economic growth and development across Asia has led to considerable wealth accu-mulation, mainly over the last 25 years. That growth has been supported by high savings rates,young and productive populations, and strong inflows of foreign direct investment.
A key contributory factor has been intense regional entrepreneurial activity, particularly inreal estate, banking and trading-related businesses. Throughout the region, some 500 millionpeople are employed in non-agricultural sectors. Of these, around 60% work in small andmedium-sized businesses. The entrepreneurs who run these businesses have generally faredwell in Asia’s rapidly expanding economies.
The ethnic Chinese (diaspora) population stands out as being particularly successful inaccumulating wealth. In Asia, there are currently around 2 million Asians of Chinese descent,driven by the large waves of emigration from mainland China during the twentieth century.Initially, they were banned from owning land and often barred from entering local politics,so local commerce and regional trade were their only options. But Chinese communities haveconsistently managed to turn adversity into prosperity. The cumulative impact of Chinesediaspora accomplishments are dramatic. In Thailand, for example, they comprise 10% of thepopulation, but hold up to 80% of the wealth.
Many individuals throughout the region became wealthy simply by having had family landon the outskirts of Asia’s fast-emerging cities. For example, it is not unusual in places likeTaiwan or Hong Kong to encounter families whose net worth exceeds US$10 million simply as

JWBK082-01 JWBK082-Maude May 29, 2006 20:47 Char Count= 0
Global Market Overview 23
a result of having owned a plot of land bought before the 1970s, and sold after the mid-1980s.From the mid-1980s, and prior to the 1997–1998 crisis, real estate and financial asset pricesrapidly appreciated in the region and capital markets boomed.
The Asian crisis of 1997–1998 had uneven effects within the region. South Korea and Taiwanwere particularly affected, but it did not significantly affect Australia or China. For the regionas a whole, the number of wealthy clients and their wealth remained remarkably stable overthis period. The crisis did have the effect of increasing the investment conservatism of manyclients, which enabled them to cope much better with the recent global equity market falls of2000–2002. Most Asian assets are still held in cash, with equity exposure currently only around28% of total assets. Most recently, China’s huge export industry, along with many successfulIPOs of Chinese companies in Hong Kong and New York, have been key wealth drivers.
Indian wealth has been driven mainly by very high economic growth in recent years, whichhas averaged 6.1% since 1995. India is now a major hub for outsourcing and global manufactur-ing, linked to its highly skilled workforce. Another driver is India’s very high personal savingsrate and, more generally, the current and prospective economic deregulation. The 20 millionnon-resident Indians (NRIs) around the world include around 150 000 dollar millionaires,and represent a particularly attractive segment. NRI remittances and asset repatriation havepicked up sharply in recent years as they seek to take advantage of attractive domestic invest-ment opportunities. Other wealth segments include entrepreneurs, corporate executives andprofessionals.
1.2.2.5 Latin America: Traditional offshore-banking stronghold
Rapid expansion and modernisation of Latin American economies over the last decade hasresulted in a substantial increase in personal wealth. Tax systems in the region are, in general,not effectively redistributive so this newly created wealth is very unequally held. World Bankdata show that Latin America has the greatest degree of income inequality in the world, withthe top 10% of income earners accounting for around 45% of total income (compared to 30%in the US and around 25% in Europe and Asia-Pacific).
Latin American governments have been privatising state assets by selling off state-ownedcompanies. They have also been loosening capital controls, eliminating export taxes, loweringtrade barriers and opening up their banking systems to market influences. That, in turn, hasencouraged repatriation of capital and boosted foreign direct investment. In Brazil, for instance,investors have recently been allowed to invest more freely abroad. As a result, lower yield andlower risk investments in bank deposits and bonds have been falling from favour.
Investment in local markets has grown, as confidence in some local economies has hard-ened. Increasingly benign government attitudes towards foreign investors has provided theopportunity for families in the region to increase liquidity by selling family-owned businessesto international investors and multinational companies. For example, in May 2001, Citigroupacquired the first-generation family-owned Grupo Financiero Banamex-Accival, which wasMexico’s second-largest bank. During the 1990s, regional capital market development andhigh equity market valuations encouraged some family-owned firms to seek market listings.Growing numbers of entrepreneurs (e.g. in the offshore trade assembly and services sectors)have also been generating new sources of wealth.
Overall, these drivers mean that Latin America has many substantial wealth managementclients. Unlike the rest of the world, Latin America’s small pockets of relatively immobile,concentrated wealth have provided an easily identifiable client segment for local and foreign

JWBK082-01 JWBK082-Maude May 29, 2006 20:47 Char Count= 0
24 Global Private Banking and Wealth Management
banks to pursue in each country in the region. So far, wealth managers have generally focusedon the HNW, rather than the affluent, market, which is not growing as rapidly as in otherdeveloping countries.
Though Latin America made substantial progress in handling its macro economy duringthe 1990s, sustained economic growth and political stability have remained elusive. Mexico,Brazil and, most recently, Argentina have lurched from one financial crisis to another.
Capital preservation has always been the ultimate goal of most Latin American privatebanking clients. For decades, Latin American HNW investors have been eager to get theirmoney out of their countries and their region. They considered their home and businessesmore than ample exposure to their volatile domestic economies and were interested only inthe most conservative and discrete US, European and offshore investments. Latin America hasvery low equity exposure (BCG estimates 14% of total assets in 2004), with the bulk of assetsheld in fixed income and cash instruments.
Today, however, there appears to be a new willingness among some clients to keep at leastpart of their money at home. Domestic onshore investment has grown in popularity somewhatas governments try to create a more favourable tax and regulatory environment. Clients haveshifted from traditional offshore private banking products to integrated, global solutions thataddress a complex set of business and personal needs across their entire balance sheet – notjust the offshore portion.
There are, however, considerable differences among countries. Real GDP grew by c.4.5% inMexico and Brazil in 2004, supporting wealth levels in those countries. At the other extreme,Argentina has suffered the greatest value destruction, with a large currency devaluation anda massive default on government and corporate debt in early 2002; its economy shrank at anaverage rate of 5% a year between 1999 and 2002, though growth has since rebounded strongly.Separately, the oil crisis in Venezuela in 2002–2003 sparked a recession that inhibited wealthgeneration there, though the economy is now recovering. Onshore providers in these countrieshave therefore downsized dramatically.
Overall in Latin America, political and economic instability have continued to drive wealthoffshore. Latin American clients have generally booked their offshore assets in the UnitedStates, the Caribbean or Switzerland. There has been a shift recently towards booking moreassets in Switzerland due to the increased transparency requirements under US legislation (e.g.the US Patriot Act – see Chapter 9).
1.2.2.6 Middle East: Oil-driven growth
The wealth of the Gulf region, both public and private, has derived almost entirely from oiland other natural resources such as gas, as well as from property and land. The oil boomreached its peak following the price shocks of the 1970s, creating a vast amount of prosperity.Sustained GDP growth has also supported wealth creation. The region’s non-oil exports aresmall, even though countries such as the United Arab Emirates and Iran have successfullydiversified their economies.
Wealth in the Middle East is highly concentrated and predominantly in the hands of rel-atively few families, who invest mainly in their own businesses. These family businessesact as agents, diversifying into other sectors of the economy and building a chain of de-pendencies. The majority of these families have inherited their wealth over several gen-erations and continue to control large segments of the domestic economy. Financial insti-tutions managing private wealth have recognised this and have started to meet the needsof these clients by establishing family offices (see Chapter 6). Some of these offices have

JWBK082-01 JWBK082-Maude May 29, 2006 20:47 Char Count= 0
Global Market Overview 25
been known to employ 50 or more people in several locations in the Gulf, Europe and theUS.
There are five broad categories of Middle Eastern wealth:� Classical inherited wealth accumulated over several generations. That is by far the mostcommon form of wealth. This segment mainly consists of long-established wealthy MiddleEastern families who are part of the rulers of the region.� First-generation oil wealth. These holders of ‘old money’ tend to be conservative in theirchoice of overseas investments, with a preference for cash deposits, bonds and real estate.� Younger generation family businesses. These are usually enthusiastic investors who havebeen to business school in the US or Europe. Many of them have evolved through thegrowth of the non-oil sector, including entrepreneurs, traders and holders of importantfranchises.� Female inheritors. With the shift of affluence beginning to take place, mainly due to thedeath of one generation, there are now growing levels of wealth in the hands of women.12
Views differ as to how much real control and influence these women have over their financialaffairs. But there is a growing level of competitive activity in connection with this segment,suggesting that there are enough women who control their own wealth to present a sustainedmarketing opportunity.13 An indication of this is the increased presence of female bankersin the region, particularly in the Gulf and Saudi Arabia, where women in business are aninnovation.� Funds held in Islamic institutions. Since its beginnings in the 1980s, the global pool of fundsbeing managed according to Islamic principles14 now totals around $265 billion. Islamicbanking services are in high demand in the Middle East and constitute a rapidly growingsegment of the market (see Chapter 4). In Saudi Arabia, for example, Islamic mutual fundshave grown at an annual rate of more than 20% over the past few years and now account forsome 60% of the total mutual fund market.
Much of the region’s wealth has traditionally been held offshore (‘petrodollars’). Thatreflects regional economic and political instability, underdeveloped local financial sectorsand, in some cases, the need to support international lifestyles. Most recently, the regionis experiencing wealth generation not seen since the 1970s, primarily driven again by thegrowth in oil revenues.15 The pick-up in oil revenue initially drives increases in public-sectorinfrastructure spending and employment which, in turn, feeds through to benefit entrepreneurs,importers and property developers. McKinsey estimates that close to half of new wealth iscurrently staying onshore, with half of that wealth invested in local equity markets, which haveshown staggering gains in recent years.16 Other recent drivers of wealth market developmentinclude greater intra-regional and international economic integration, and the development ofdomestic financial and other asset markets.
12 In Islamic law, daughters as well as sons inherit, although unequally, on the basis of one part to two parts in the son’s favour.Where cross-border wealth is concerned, the beneficial owner dictates how the wealth is distributed, and some international wealthmanagers detect that a more even-handed approach is now being taken.
13 In Saudi Arabia, women own 40% of private wealth and account for more than 50% of university graduates – a situation that isunique in the Arab world. Yet they make up only 5% of the country’s workforce.
14 The conviction underpinning Islamic banking is that investments should be put to productive rather than speculative use and thata lender, instead of charging interest, should be compensated with a share of the profits—See Box 4.1 on Islamic Private Banking.
15 The Middle East accounts for around 65% of global oil exports. In 2005, global oil export revenue more than doubled, and inreal terms is now well above its previous 1980 peak. For oil exporters, the current oil shock is in real terms slightly larger than theshocks of the 1970s. See Chapter II of IMF (2006a).
16 In the two years to September 2005, annual growth in local equity markets averaged 101% in the UAE, 80% in Saudi Arabia,75% in Quatar and 49% in Kuwait. There have since been partial reversals in most markets – see Box 3 in IMF (2006b).

JWBK082-01 JWBK082-Maude May 29, 2006 20:47 Char Count= 0
26 Global Private Banking and Wealth Management
1.2.2.7 Africa: Commodity-driven growth
Africa has, in recent years, experienced relatively robust growth in wealth volumes and clientnumbers. That has primarily been driven by oil- and other commodity-related revenues. Otherdrivers include the pick-up in GDP growth, higher foreign direct investment, the relativelystrong performance of local stock markets and local currency appreciation.
The African wealth market is dominated by South Africa, which accounts for around 60% ofthe region’s wealth and has more than 35 000 HNWIs. Other key markets include Nigeria andEgypt. The ruling class, corporate executives, professionals, small and family-run businessesand, in some countries such as South Africa and Botswana, an emerging middle class representthe key target client segments. The bulk of African wealth is held offshore, mainly driven bypolitical and economic instability. The region’s wealth is highly concentrated, with levels ofinequality very similar to those of Latin America.
1.3 INDUSTRY ECONOMICS
While, again, it is difficult to generalise, this section outlines some stylised facts on wealthmanagement economics. At least on the face of it, the economics of the wealth managementindustry are extremely attractive, reflecting five key factors:
1. Large and growing market. Given the size and growth metrics outlined above it is unsur-prising that wealth management is big business. It accounts for a disproportionately largeshare of the assets under management, revenues and profits of the personal financial servicesindustry – up to 80% of the personal financial services profit pool in Europe, for example(Figure 1.16). Wealth management is also attractive relative to many other areas of financial
88
36
20
12
46
51
1
1829
No. ofhouseholds
Assets Profit
Mass
Affluent
HNW
100%= 132 m 20,646 bn 38 bn
2003
%
ESTIMATES
Figure 1.16 Wealth management component of personal financial services EuropeSource: Boston Consulting Group; author’s calculations.
JWBK082-01 JWBK082-Maude May 29, 2006 20:47 Char Count= 0
Global Market Overview 27
Onshore
PB
FixedincomeAsset
Management
US
Private-
Client
Investmentbank Equities
Intl PB
Swiss
PB
SwissRetail
SwissCorporate
highlow
low
Mark
et gro
wth
pote
ntial
hig
h
Potential net margin
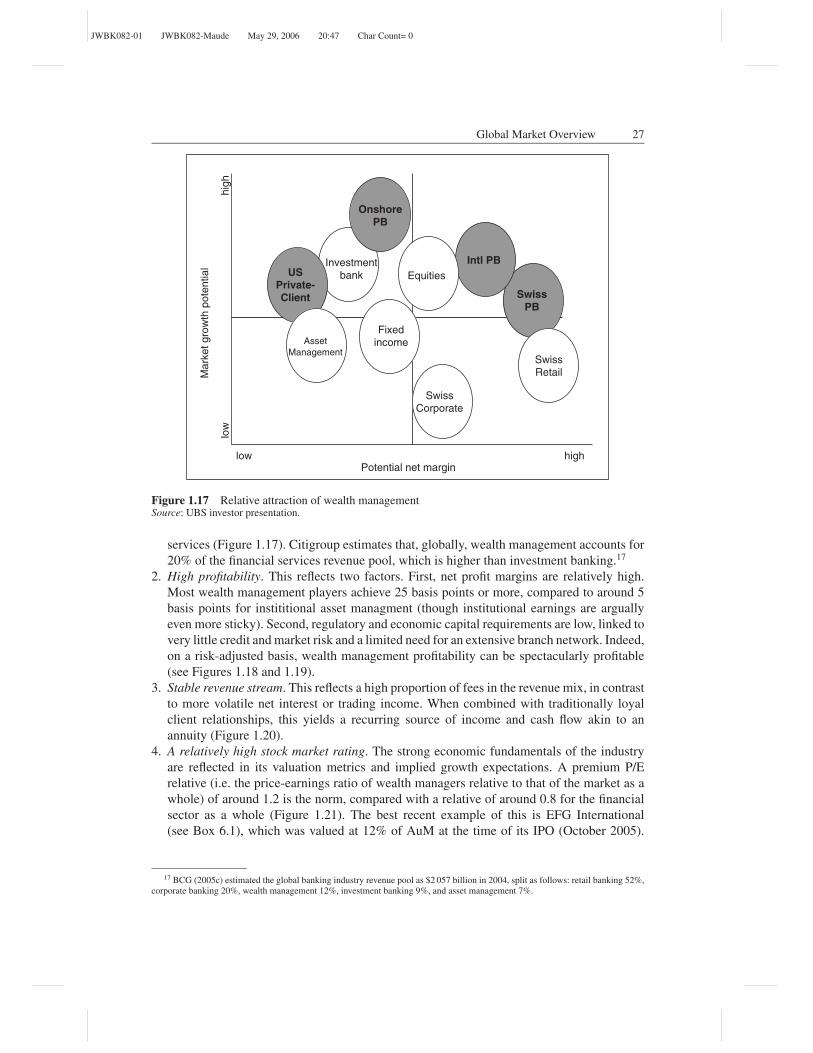
Figure 1.17 Relative attraction of wealth managementSource: UBS investor presentation.
services (Figure 1.17). Citigroup estimates that, globally, wealth management accounts for20% of the financial services revenue pool, which is higher than investment banking.17
2. High profitability. This reflects two factors. First, net profit margins are relatively high.Most wealth management players achieve 25 basis points or more, compared to around 5basis points for instititional asset managment (though institutional earnings are arguallyeven more sticky). Second, regulatory and economic capital requirements are low, linked tovery little credit and market risk and a limited need for an extensive branch network. Indeed,on a risk-adjusted basis, wealth management profitability can be spectacularly profitable(see Figures 1.18 and 1.19).
3. Stable revenue stream. This reflects a high proportion of fees in the revenue mix, in contrastto more volatile net interest or trading income. When combined with traditionally loyalclient relationships, this yields a recurring source of income and cash flow akin to anannuity (Figure 1.20).
4. A relatively high stock market rating. The strong economic fundamentals of the industryare reflected in its valuation metrics and implied growth expectations. A premium P/Erelative (i.e. the price-earnings ratio of wealth managers relative to that of the market as awhole) of around 1.2 is the norm, compared with a relative of around 0.8 for the financialsector as a whole (Figure 1.21). The best recent example of this is EFG International(see Box 6.1), which was valued at 12% of AuM at the time of its IPO (October 2005).
17 BCG (2005c) estimated the global banking industry revenue pool as $2 057 billion in 2004, split as follows: retail banking 52%,corporate banking 20%, wealth management 12%, investment banking 9%, and asset management 7%.

JWBK082-01 JWBK082-Maude May 29, 2006 20:47 Char Count= 0
28 Global Private Banking and Wealth Management
Figure 1.18 Wealth management profitabilitySource: UniCredito Italiano investor presentation, 19 June 2001.
At the time of writing (March 2006), it was trading on c.62 times trailing earnings pershare.
5. Strong intragroup synergies. Integrated players benefit from their wealth management busi-nesses in two ways. On the revenue side, there are opportunities for wealth managementoperations to acquire clients from other parts of the group, e.g. the retail and businessbanking divisions. There are also opportunities for other parts of the group, e.g. investmentbanking divisions, to leverage the private client base for product sales. On the cost side, thereare opportunities to share infrastructure and spread fixed costs, for example (see Chapter 8).
Wealth management economics have four simple components: assets, leverage, fees andcosts. From the wealth manager’s perspective, an attractive wealth management client has as-sets that comfortably exceed the stated minimum requirement, that grow steadily with limitedvolatility and that are invested under a discretionary mandate which produces recurring an-nual fees. A very attractive client will actively trade a portion of their assets, thus generatingadditional commission revenue. The truly ideal client will borrow against existing assets toincrease the leverage of their investments, with little risk to the bank. If the client is financiallysophisticated and understands the products reasonably well, an active portfolio can be effec-tively managed by a strong relationship manager with reasonably little time devoted to eachclient. If all goes well, such an account will reward the wealth manager with referrals to otherwealthy clients.
Steady assets, consistent revenue streams, a low cost per account and a flow of new businessintroductions is a strong combination for wealth management economics. These objectivesare not incompatible with serving the client’s best interests, as long as adequate time is spentup-front to define the client’s investment objectives, risk tolerance and service preferences.

JWBK082-01 JWBK082-Maude May 29, 2006 20:47 Char Count= 0
Global Market Overview 29
75
58
46
29
24
22
18
11
Private Bank(1)
Smith Barney
Transaction Services
Cards
Capital Markets and Banking
Consumer Finance
Retail Banking
Asset Management(2)
(1) Private Bank ROIC excluding Private Bank Japan Discontinuation Charge of $ 244MM after tax.
(2) Asset Management ROIC excluding Transfer Agent Settlement of $ 151MM after tax.
Note: Does not include Life Insurance & Annuities and Proprietary Investment Activities.
%
Figure 1.19 Post-tax return on invested capital, 2004Source: Citigroup.
1.3.1 Value drivers and key performance indicators
Wealth management’s basic value drivers divide into two: the net profit margin and assets undermanagement (AuM). Figure 1.22 provides a simple value-tree framework. This framework canbe applied to decompose current valuation or to identify the drivers of change in valuation overtime. On the latter, recent McKinsey European survey evidence shows that, at the aggregatelevel, revenue generation rather than cost efficiency has been the most critical factor. WithinAuM, market performance rather than net new money or a greater share of wallet has been thedominant factor.

JWBK082-01 JWBK082-Maude May 29, 2006 20:47 Char Count= 0
30 Global Private Banking and Wealth Management
Gross revenue margin
Basis points
*Q1-Q3 average
71 71 76 75
3027 28
26
2002 2003 2005*
97101 103 103
80 77 82 80
5652 51
40
2002 2003 2004 2005*
120
133 134 131
Recurring
Non-recurring
Type of revenue:
UBS Credit Suisse
2004
Figure 1.20 High proportion of recurring income: large Swiss bank examplesSource: Company financial reports.
Specific key performance indicators (KPIs) should be tailored to the wealth manager’sindividual circumstances. They should also be systematically tracked over time and, wherepossible, benchmarked against competitors.
Surveys have found that healthy profits can be generated across a range of different wealthmanagement business models. The quality of execution is a key differentiator; other factorsinfluencing wealth management economics include:� Level and volatility of asset prices. Indeed, following the post-2000 equity market correction,
one UK bank analyst remarked that ‘wealth-management economics boil down to a smallnumber times the equity market, less a big number (fixed costs)’. There is more than a grainof truth here as weaker financial markets exposed the fragility of many wealth managementmodels. Merrill Lynch estimated that private banking profits fell by 20% a year on averagebetween 2000 and 2002, driven mainly by falling asset-related revenues and sticky costs.Over that period, private banks’ average cost-income ratio surged from 57% to 71%.� Scale. Are there economies of scale in wealth management? As Raoul Weil, head of WealthManagement International, UBS, recently put it, ‘Very wealthy clients do not want to entrusttheir fortune to a bank whose balance sheet is smaller than their own!’ (IBM ConsultingServices, 2005, p.80). Larger wealth managers certainly weathered the recent downturnbetter than the smaller firms. To some extent, this reflects their more diversified revenue

JWBK082-01 JWBK082-Maude May 29, 2006 20:47 Char Count= 0
Global Market Overview 31
Multiples
16.1
15.5
15.4
13.1
10.8
12.3
12.3
12.2
11.4
10.4
11.9
11.0
10.8
10.7
Anglo Irish
Deutsche Postbank
Monte dei Paschi
Banco Popular
Monte dei Paschi
Merrill Lynch
Morgan Stanley
Goldman Sachs
Lehman Brothers
Bear Stearns
JP Morgan Chase
Credit Suisse
Citigroup
Deutsche Bank
EU Retail//
Corporate Banks
14.1
16.0
15.7
17.7
17.2
16.5
17.4
17.4
17.3
12.7
17.9
Charles Schwab
Raymond James
AG Edwards
Northern Trust
Julius Baer
Vontobel
Mellon Financial
Franklin Resources
Federate Investors
Amvescap
Alliance Capital
Man Group
Wealth manager
average
Retail Brokers
18.8
XUnweighted average
24.8
19.1
21.3
Wealth management ‘pure plays’ Other financial services players
Private// Trust
Banks
17.6
Asset Managers
17.2
Investment Banks
14.1
Universal Banks
11.1
Figure 1.21 Financial services price-earnings ratios, 2005Source: UBS; IBES; author’s analysis.
streams. They also benefited from a ‘flight to size’, as heightened risk aversion led in-vestors to seek comfort in institutions perceived as being systemically too important tofail. But recent survey evidence shows that smaller players appear to have a structuraldisadvantage with regard to profitability (see Figure 1.23). BCG has said that players withmore than $10 billion–$15 billion of AuM are not demonstrably subscale. In IBM’s 2005European Wealth Management and Private Banking Industry Survey, 20% of respondentsclaim that the minimum threshold is €20 billion, with another 20% of respondents putting it at€50 billion. Larger firms have more bargaining power (and more resources to conduct duediligence) in product sourcing, have greater access to growth markets and, in the case ofintegrated providers, can lower their client-acquisition costs by using other parts of the groupas client-feeder networks. That has contributed to their ability to achieve superior growthin net new money. On the other hand, as an institution grows beyond a critical size, clientscan become more wary of potential conflicts of interest; client service quality – which re-mains the industry’s key hallmark – can suffer (‘I’ve become a number’, an issue that canapply as much to relationship managers as to clients); greater bureaucracy can increase staffturnover; and the institution can become inherently more difficult to manage. Traditionally,private banking has a reputation for being a non-scalable industry. To the extent that thereare economies of scale, most are likely to be found in the back office (see Chapter 7). TheSwiss Banking School’s International Private Banking Study 2005 (Cocca, 2005) concluded:‘Overall there seems to be some evidence for a moderate level of economies of scale in termsof profitability. However, size [in itself] has no significant influence on efficiency.’

JWBK082-01 JWBK082-Maude May 29, 2006 20:47 Char Count= 0
32 Global Private Banking and Wealth Management
NOT EXHAUSTIVE
Value
Value//AuM
AuM
P//E
Profit/ / AuM
Key performance indicators
Gross revenuemargin
Costmargin
××××
××××
–
• P/E relatives
• RM productivity– Clients/RM– Revenue/RM
• Asset productivity– Revenue margin by product– Proportion of high-margin products– Number of products per client
• Client segmentation– Revenue by client/ client wealth band/ region/ relationship age– Assets per client
• Profit per client• Profit per RM
• Cost-income ratio• Number and mix of FTEs*• Ratio of front- to back-office staff• Cost per RM• Front office cost per client• Cost by type/ AuM
– Front-, middle-, and back-office– Overhead– Product related
• IT spend
*Full-time equivalent staff
• Growth in net new money– Performance of existing assets– New asset acquisition– Asset attrition (including account diminishment)
• Asset mix (region, product)• Market share
Figure 1.22 Wealth management value driversSource: Author’s analysis.� Business model.
(a) Onshore versus offshore models. Margins tend to be higher offshore than onshore (seeFigure 1.24), reflecting a number of factors. In the offshore business, clients are often lessprice sensitive and less focused on investment performance; there is a lack of aggressivecompetition; and client and asset loadings per relationship manager tend to be higher(linked to less frequent client interaction and the prevalence of ‘suitcase banking’). In theonshore business, competition is more intense from both incumbents and new entrants;players compete more on price; and costs are higher. Offshore margins are often used tocross-subsidise onshore efforts.
(b) Fee- versus commission-based models. Fee-based models are inherently more stablethan commission-based models, which are driven by clients’ trading activity. At least inpart, that helps to explain why private banks generally have superior economics to thoseof brokers (see Figure 1.25). Other factors include higher average assets per relationshipmanager and a lower compensation–revenue ratio. Many US brokers are, in fact, activelyfocusing on boosting fees, which now account for more than half of total revenue forsome players (see Chapter 6).
(c) Target client segment and client mix. Economics vary significantly by client wealthband (see Figure 1.26). Revenue margins tend to be lower for wealthier clients, linkedto their greater bargaining power, financial sophistication, more product/deal-drivenapproach and price sensitivity. Yet for some players, the costs of maintaining a large

JWBK082-01 JWBK082-Maude May 29, 2006 20:47 Char Count= 0
Global Market Overview 33
Profit marginBasis points, 2003
Maximum
Average
Minimum
0
65
4541
31
00
<5 5-10 >10
710
5
Assets under management billion
Figure 1.23 Wealth management economies of scale: European surveySource: McKinsey European Private Banking Economics Survey 2004. Reproduced by permission.
number of low-growth small accounts can offset any revenue advantage, and many ofthe very wealthiest clients can also be very expensive to serve. Sitting between theseextremes, there is a ‘sweet spot’, which may be client asset levels of around $1 million–$5 million. But it is important to note that any client wealth level can, in principle, beprofitable. Wealth managers need to pick their target client segments and then tailor their
LOX-ZZU464-20050127-GRJT-ME priv bank opp
Maximum
Average
MinimumProfit margin
Basis points, 2003
62
55
2624
30
-19
Onshore Offshore
Revenue margin
Bps90 100
Figure 1.24 Offshore versus onshore economics: European surveySource: Boston Consulting Group. Reproduced by permission.
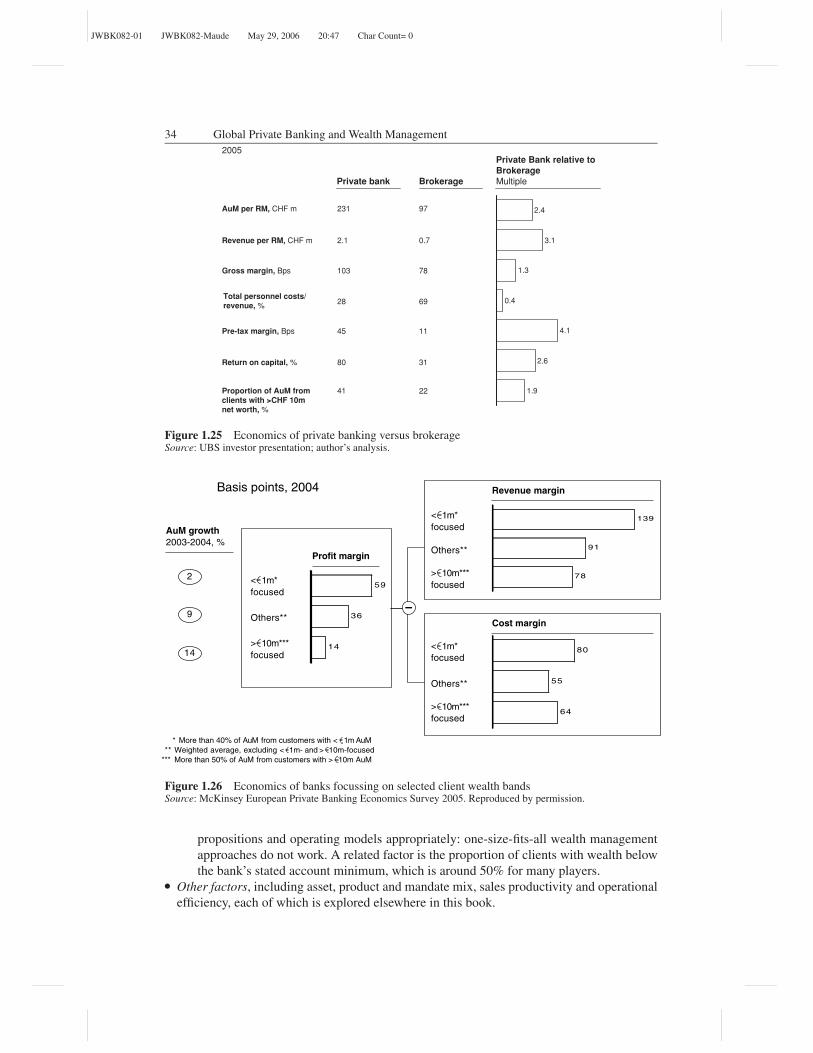
JWBK082-01 JWBK082-Maude May 29, 2006 20:47 Char Count= 0
34 Global Private Banking and Wealth Management
2005Private Bank relative to BrokerageMultiplePrivate bank Brokerage
2.4
3.1
1.3
0.4
4.1
2.6
1.9
AuM per RM, CHF m 97231
Revenue per RM, CHF m 2.1 0.7
Gross margin, Bps 103 78
Total personnel costs/ revenue, % 28 69
Pre-tax margin, Bps 45 11
Return on capital, % 80 31
Proportion of AuM from clients with >CHF 10m net worth, %
41 22
Figure 1.25 Economics of private banking versus brokerageSource: UBS investor presentation; author’s analysis.
Basis points, 2004
14
36
59< 1m*
focused
Others**
focused
Profit margin
78
91
139
focused
Others**
focused
Revenue margin
64
55
80focused
Others**
focused
Cost margin
AuM growth
2003-2004, %
2
9
14
* More than 40% of AuM from customers with < 1m AuM
** Weighted average, excluding < 1m- and > 10m-focused
*** More than 50% of AuM from customers with > 10m AuM
< 1m*
< 1m*> 10m***
> 10m***
> 10m***
Figure 1.26 Economics of banks focussing on selected client wealth bandsSource: McKinsey European Private Banking Economics Survey 2005. Reproduced by permission.
propositions and operating models appropriately: one-size-fits-all wealth managementapproaches do not work. A related factor is the proportion of clients with wealth belowthe bank’s stated account minimum, which is around 50% for many players.� Other factors, including asset, product and mandate mix, sales productivity and operational
efficiency, each of which is explored elsewhere in this book.

JWBK082-01 JWBK082-Maude May 29, 2006 20:47 Char Count= 0
Global Market Overview 35
1.4 COMPETITIVE LANDSCAPE
Against this backdrop of historically strong growth and attractive economics, it is no surprisethat the number and range of institutions providing wealth management services has beenrising dramatically. A decade ago, wealth managers mostly cloaked themselves in secrecy;very few people knew the names of more than a handful of players. Today, the types of playerscalling themselves wealth managers is truly vast – everyone from one-man-band advisors tocompanies as large as Citigroup. It is difficult to name a single large bank that is not targetingthe wealth management market.
Traditionally, the industry was dominated by private banks and stockbrokers. But there wereimportant regional differences in the dominant types of player. To some extent, this reflecteddifferences in the structure and regulation of the financial services industry as a whole. Broadly,there are two main models:� North American model, where the industry is dominated by full-service and discount broker-
ages and money managers, whose strengths lie in the investment area, rather than in tradi-tional deposit gathering. As noted above, the traditional emphasis here is on a (transaction-driven) commission-based business model.� European model, where universal and traditional private banks dominate, due to their abilityto offer a comprehensive range of wealth management products and services. The emphasishere is on a fee-based business model.
Breadth of offer
Client segment
High(advice,
banking, etc)
Low(products/
transactions)
Affluent HNW UHNW
Private Banks•
UB
EFG InternationalBordier
S
•
Credit Suisse
• Julius Baer• Pictet
• Coutts• C Hoare & Co
• Vontobel• Sarasin
Trust Institutions//Custodians
• Northern Trust•
• Wilmington Trust• Fiduciary Trust
• Bank of New York• Mellon Financial
Retail/ Universal Banks
• Bank of America•
•Citigroup• Deutsche
• HSBC•
BNP•• ABN Amro
Family Offices• Global Wealth Management• Fleming Family & Partners• Rockefeller• Bessemer Trust• Stanhope CapitalAdvisers & Access Providers
• MLP• Banca Fideuram
• UK IFAs• 21i.net
Direct Banks
• ING Direct • Egg • DAB
Stockbrokers
••
E*
Cortal
TRADE • Merrill Lynch
• Fidelity• Old mutual
Asset Managers• Sa• AMVESCAP
nford Bernstein
• Man Investments • GAM • Permal • Blackstone • Apax Partners • 3i
Product Specialists
Investment Banks
• JP Morgan
• Goldman Sachs
• Lehman Brothers/ Neuberger Berman
• Lazard
• Rothschild
• Morgan Stanley
• Charles Schwab
• Consors
• BGI• Schroders
ILLUSTRATIVE
Atlantic Trust
Figure 1.27 Wealth management competitor landscapeSource: Author’s analysis.

JWBK082-01 JWBK082-Maude May 29, 2006 20:47 Char Count= 0
36 Global Private Banking and Wealth Management
The following provides a brief overview of the main types of wealth management players.There are huge differences among them in terms of the types of clients served and the typesof products and services offered (see Figure 1.27). They also differ in terms of distributionchannels, participation within the industry value chain, geographic coverage and scale. It is acomplex patchwork. Chapter 6 provides more detail. The main types of player are:� Pure private banks is a broad category of player that includes the classic Swiss private bank-
ing partnerships and other independent players. Mainly targeting HNWIs, these institutionsoffer clients end-to-end capabilities via a relationship with a senior banker (the relationshipmanager) that is confidential and founded on trust. Typically, the relationship manager isthe client’s sole contact point and handles all aspects of the relationship. But private banks,though important, are by no means the only player in the wealth management industry. Infact, recent research by Scorpio Partnership shows that private banks manage only around$4.6 trillion, or 16%, of global HNW wealth.� Trust banks are essentially the US equivalent of the traditional European private bank. Mosthave their roots in providing trust and custody services, but have broadened their productrange over the years. They now also provide asset management, insurance and financial,tax and estate planning. Their core target client segment is UHNWIs, but many have alsodeveloped tailored propositions for HNWIs.� Retail and universal banks target affluent clients who need comprehensive advice and whovalue a close banking relationship. Most of them have been shifting their focus up the wealthcurve. They offer products across the full client balance sheet, but often struggle to integrateand coordinate them effectively. The emphasis is on ‘farming’ their existing customer base,including business banking clients. Examples include Citigroup, HSBC, Bank of Americaand ABN AMRO.� Family offices serve the very wealthiest clients, acting as an integrated hub for the fam-ily’s financial administration. They perform, essentially, three main functions: (a) specialistadvice and planning (including financial, tax, strategic and philanthropic); (b) investmentmanagement (including asset allocation, risk management, investment due diligence andanalysis, discretionary asset management and trading); and (c) administration (includingcoordination of relationships with financial services providers and consolidated financialreporting). From the client’s point of view, the family office’s key attractions include inde-pendence, control and highly tailored, specialist expertise. A family office may be dedicatedeither to a single family or serve a small number of families. Some of the major privatebanks, such as Pictet and JP Morgan, have developed their own multifamily offices, but thevast majority are independent specialists (and have, in some instances, evolved from single-family offices). Family offices are particularly well developed in the US, and are starting toevolve in Europe.� Financial advisors focus on clients who seek independent investment advice. Their distri-bution traditionally relies heavily on a mobile sales force of well-trained and highly incen-tivised advisors. Over recent years, a number of web-based advisors have emerged. Theyoffer above-average advisory quality and act as a gateway to third-party product providers.� Stockbrokers and wirehouses18 target self-directed investors and traders for their day-to-day transaction execution and investment needs. They offer low-cost access to a range ofinvestment products as well as to extensive investment research. But they are not exclusivelydedicated to affluent clients, do not typically offer much in the way of customised advice and
18 US term for the largest brokerage houses.
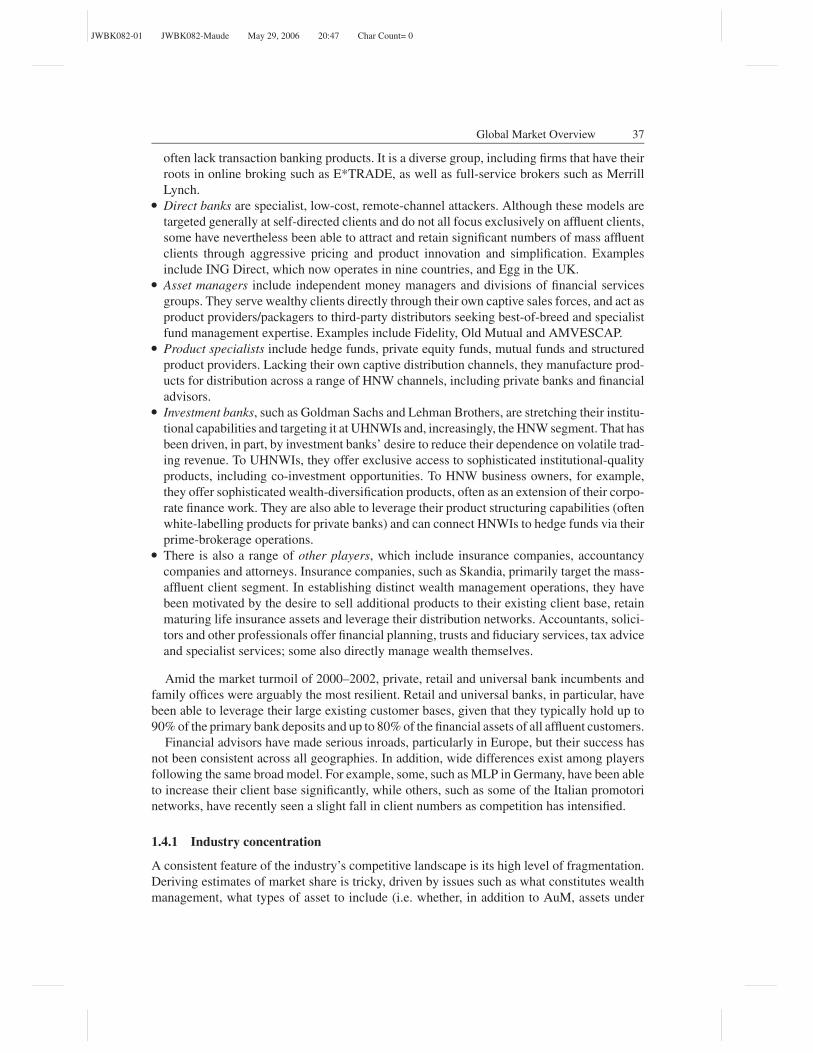
JWBK082-01 JWBK082-Maude May 29, 2006 20:47 Char Count= 0
Global Market Overview 37
often lack transaction banking products. It is a diverse group, including firms that have theirroots in online broking such as E*TRADE, as well as full-service brokers such as MerrillLynch.� Direct banks are specialist, low-cost, remote-channel attackers. Although these models aretargeted generally at self-directed clients and do not all focus exclusively on affluent clients,some have nevertheless been able to attract and retain significant numbers of mass affluentclients through aggressive pricing and product innovation and simplification. Examplesinclude ING Direct, which now operates in nine countries, and Egg in the UK.� Asset managers include independent money managers and divisions of financial servicesgroups. They serve wealthy clients directly through their own captive sales forces, and act asproduct providers/packagers to third-party distributors seeking best-of-breed and specialistfund management expertise. Examples include Fidelity, Old Mutual and AMVESCAP.� Product specialists include hedge funds, private equity funds, mutual funds and structuredproduct providers. Lacking their own captive distribution channels, they manufacture prod-ucts for distribution across a range of HNW channels, including private banks and financialadvisors.� Investment banks, such as Goldman Sachs and Lehman Brothers, are stretching their institu-tional capabilities and targeting it at UHNWIs and, increasingly, the HNW segment. That hasbeen driven, in part, by investment banks’ desire to reduce their dependence on volatile trad-ing revenue. To UHNWIs, they offer exclusive access to sophisticated institutional-qualityproducts, including co-investment opportunities. To HNW business owners, for example,they offer sophisticated wealth-diversification products, often as an extension of their corpo-rate finance work. They are also able to leverage their product structuring capabilities (oftenwhite-labelling products for private banks) and can connect HNWIs to hedge funds via theirprime-brokerage operations.� There is also a range of other players, which include insurance companies, accountancycompanies and attorneys. Insurance companies, such as Skandia, primarily target the mass-affluent client segment. In establishing distinct wealth management operations, they havebeen motivated by the desire to sell additional products to their existing client base, retainmaturing life insurance assets and leverage their distribution networks. Accountants, solici-tors and other professionals offer financial planning, trusts and fiduciary services, tax adviceand specialist services; some also directly manage wealth themselves.
Amid the market turmoil of 2000–2002, private, retail and universal bank incumbents andfamily offices were arguably the most resilient. Retail and universal banks, in particular, havebeen able to leverage their large existing customer bases, given that they typically hold up to90% of the primary bank deposits and up to 80% of the financial assets of all affluent customers.
Financial advisors have made serious inroads, particularly in Europe, but their success hasnot been consistent across all geographies. In addition, wide differences exist among playersfollowing the same broad model. For example, some, such as MLP in Germany, have been ableto increase their client base significantly, while others, such as some of the Italian promotorinetworks, have recently seen a slight fall in client numbers as competition has intensified.
1.4.1 Industry concentration
A consistent feature of the industry’s competitive landscape is its high level of fragmentation.Deriving estimates of market share is tricky, driven by issues such as what constitutes wealthmanagement, what types of asset to include (i.e. whether, in addition to AuM, assets under
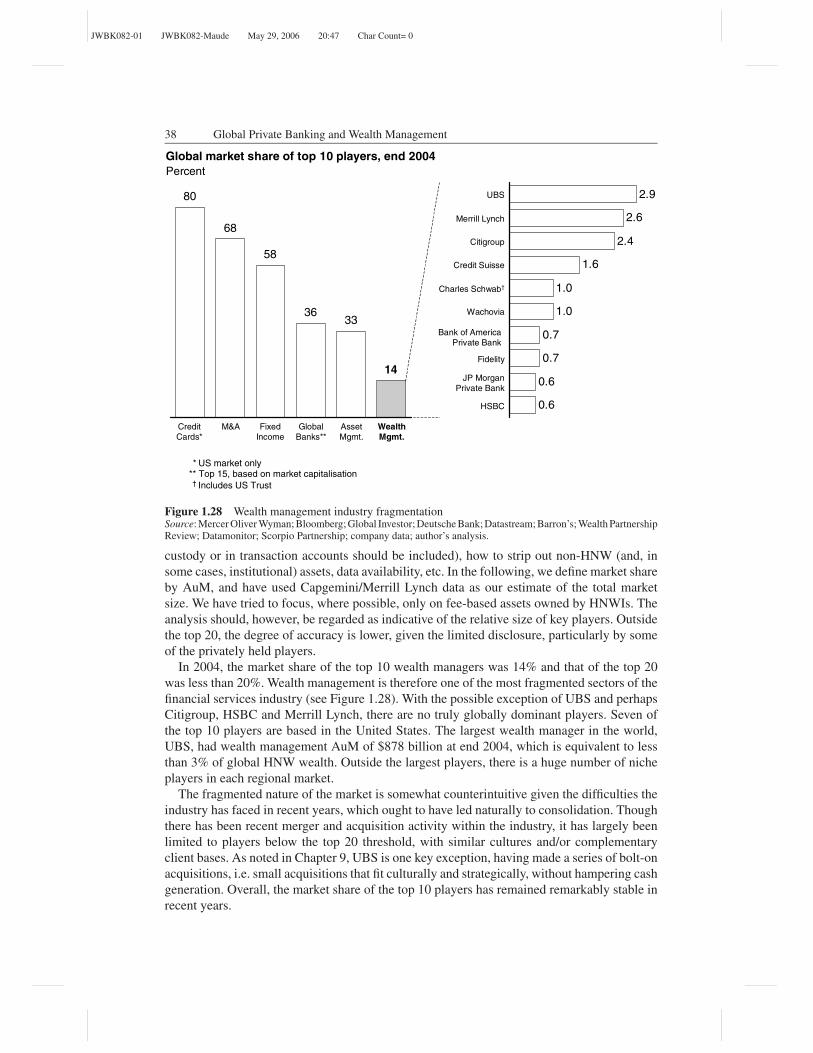
JWBK082-01 JWBK082-Maude May 29, 2006 20:47 Char Count= 0
38 Global Private Banking and Wealth Management
Global market share of top 10 players, end 2004
Percent
* US market only** Top 15, based on market capitalisation† Includes US Trust
80
68
58
3633
14
Credit Cards*
M&A Fixed Income
Global Banks**
Wealth
Mgmt.
Asset Mgmt.
2.9
2.6
2.4
1.6
1.0
1.0
0.7
0.7
0.6
0.6
UBS
Citigroup
Charles Schwab†
Bank of America Private Bank
HSBC
Merrill Lynch
Credit Suisse
Wachovia
Fidelity
JP Morgan Private Bank
Figure 1.28 Wealth management industry fragmentationSource: Mercer Oliver Wyman; Bloomberg; Global Investor; Deutsche Bank; Datastream; Barron’s; Wealth PartnershipReview; Datamonitor; Scorpio Partnership; company data; author’s analysis.
custody or in transaction accounts should be included), how to strip out non-HNW (and, insome cases, institutional) assets, data availability, etc. In the following, we define market shareby AuM, and have used Capgemini/Merrill Lynch data as our estimate of the total marketsize. We have tried to focus, where possible, only on fee-based assets owned by HNWIs. Theanalysis should, however, be regarded as indicative of the relative size of key players. Outsidethe top 20, the degree of accuracy is lower, given the limited disclosure, particularly by someof the privately held players.
In 2004, the market share of the top 10 wealth managers was 14% and that of the top 20was less than 20%. Wealth management is therefore one of the most fragmented sectors of thefinancial services industry (see Figure 1.28). With the possible exception of UBS and perhapsCitigroup, HSBC and Merrill Lynch, there are no truly globally dominant players. Seven ofthe top 10 players are based in the United States. The largest wealth manager in the world,UBS, had wealth management AuM of $878 billion at end 2004, which is equivalent to lessthan 3% of global HNW wealth. Outside the largest players, there is a huge number of nicheplayers in each regional market.
The fragmented nature of the market is somewhat counterintuitive given the difficulties theindustry has faced in recent years, which ought to have led naturally to consolidation. Thoughthere has been recent merger and acquisition activity within the industry, it has largely beenlimited to players below the top 20 threshold, with similar cultures and/or complementaryclient bases. As noted in Chapter 9, UBS is one key exception, having made a series of bolt-onacquisitions, i.e. small acquisitions that fit culturally and strategically, without hampering cashgeneration. Overall, the market share of the top 10 players has remained remarkably stable inrecent years.