high performance plastics - a global market overview
TRANSCRIPT
Page 1
MARKET RESEARCH REPORTS TO DEFINE THE RIGHT STRATEGY AND EXECUTE THROUGH TO THE SUCCESS
Click here to buy the report
High Performance Plastics – A Global Market Overview “The report reviews, analyzes and projects the global market for High Performance Plastics - Fluoropolymers (PTFE, FEP, PVDF, PVF, PFA, ETFE, ECTFE, PCTFE), High Performance Polyamides (PA11, PA12, PA46, PA9T, PPA, PARA/PAMXD6), Sulfone Polymers (PSU, PPSU, PESU), Polyphenylene Sulphide, Liquid Crystal Polymers, Polyetherimide and Polyetheretherketone for the period 2012-2022.” Published: November 2016 Report Code: CP011 Pages: 560 Charts: 642 Price: $6300 Single User License, $9900 Enterprise License
SUMMARY High performance plastics are used in applications demanding higher requirements than standard and engineering plastics because of their high strength, good chemical resistance, low coefficient of friction, performance at high temperatures, high quality electrical resistance. Major demand driver for the consumption of high performance plastics is the metal and other low performance materials replacement in demanding applications such as automotive, aerospace, electronics and medical, where high temperature resistance and strength is required. In the automotive & transportation industry including aerospace, growth is supported by metal replacement to reduce weight, while thinner and smaller components in electrical & electronics.
This global report analyzes the high performance plastics comprising Fluoropolymers (PTFE, PVDF, FEP, PCTFE, PFA, PVF, ECTFE and ETFE), High Performance Polyamides (PA 11, PA12, PA 46, PA 9T, PPA and PARA), Sulfone Polymers (PESU, PSU and PPSU), Polyphenylene Sulphide (PPS), Liquid Crystal Polymers (LCP), Polyetherimide (PEI) and Polyetheretherketone (PEEK). The study also analyzes the key end-use sectors of high performance plastics including Automotive & Transportation, Building & Construction, Consumer Goods, Electrical & Electronics, Mechanical/Industrial and Others (such as Medical etc.).
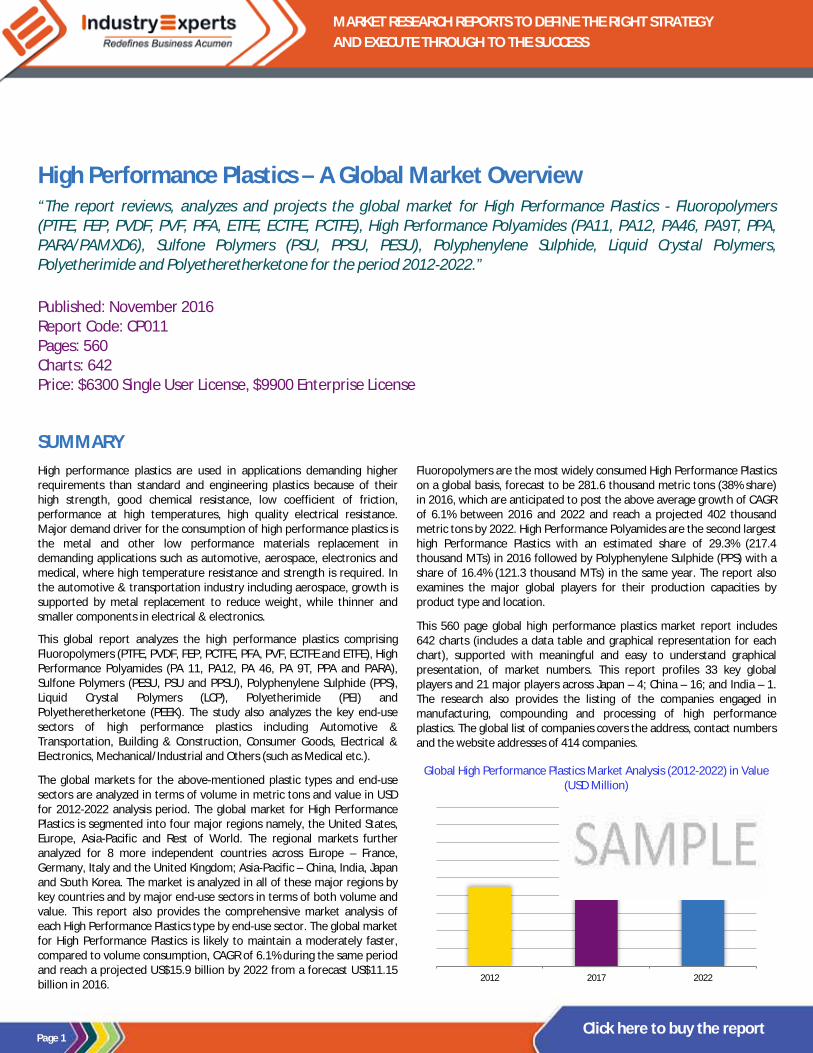
The global markets for the above-mentioned plastic types and end-use sectors are analyzed in terms of volume in metric tons and value in USD for 2012-2022 analysis period. The global market for High Performance Plastics is segmented into four major regions namely, the United States, Europe, Asia-Pacific and Rest of World. The regional markets further analyzed for 8 more independent countries across Europe – France, Germany, Italy and the United Kingdom; Asia-Pacific – China, India, Japan and South Korea. The market is analyzed in all of these major regions by key countries and by major end-use sectors in terms of both volume and value. This report also provides the comprehensive market analysis of each High Performance Plastics type by end-use sector. The global market for High Performance Plastics is likely to maintain a moderately faster, compared to volume consumption, CAGR of 6.1% during the same period and reach a projected US$15.9 billion by 2022 from a forecast US$11.15 billion in 2016.
Fluoropolymers are the most widely consumed High Performance Plastics on a global basis, forecast to be 281.6 thousand metric tons (38% share) in 2016, which are anticipated to post the above average growth of CAGR of 6.1% between 2016 and 2022 and reach a projected 402 thousand metric tons by 2022. High Performance Polyamides are the second largest high Performance Plastics with an estimated share of 29.3% (217.4 thousand MTs) in 2016 followed by Polyphenylene Sulphide (PPS) with a share of 16.4% (121.3 thousand MTs) in the same year. The report also examines the major global players for their production capacities by product type and location.
This 560 page global high performance plastics market report includes 642 charts (includes a data table and graphical representation for each chart), supported with meaningful and easy to understand graphical presentation, of market numbers. This report profiles 33 key global players and 21 major players across Japan – 4; China – 16; and India – 1. The research also provides the listing of the companies engaged in manufacturing, compounding and processing of high performance plastics. The global list of companies covers the address, contact numbers and the website addresses of 414 companies.
Global High Performance Plastics Market Analysis (2012-2022) in Value (USD Million)
2012 2017 2022
Page 2
High Performance Plastics – A Global Market Overview November 2016 |560 Pages | 642 Charts | Price $6300
Click here to buy the report
SAMPLE COMPANY PROFILE
ARKEMA GROUP (FRANCE) 420 rue d'Estienne d'Orves 92 700 Colombes France Phone: 33 (0)1 49 00 80 80 Fax: 33 (0)1 49 00 83 76 Website: www.arkema.com
Business Overview Arkema Group is a leading global manufacturer and provider of specialty chemicals that operates three business segments, viz., High Performance Materials, Industrial Specialties and Coating Solutions, which offer well-known brands. The High Performance Materials unit offers Specialty Adhesives (Bostik), Technical Polymers (Specialty Polyamides and Fluoropolymers) and Performance Additives (Filtration and Adsorption/CECA, Organic Peroxydes and UV Curing Resins/Sartomer), while the Industrial Specialties unit’s products include Thiochemicals, Fluorochemicals, PMMA (Altuglas International) and Hydrogen Peroxides. Coating Solutions offered by Arkema include Acrylics, Coating Resins and Additives (Coating Resins, Rheology Additives/Coatex). Technical Polymers include two subdivisions, viz., specialty polyamides used in the automotive, aerospace and aeronautics, oil, electronics and consumer goods (sports and cosmetics) industries, as also in producing hotmelts, and polyvinylidene fluoride (PVDF) used in chemical engineering, manufacturing paints and anti- corrosive coatings, oil and gas extraction, photovoltaic panels, lithium-ion batteries, and membranes for water treatment.
Product Portfolio
Arkema Group offers two types of high performance plastics – specialty polyamides such as PA10, PA11, PA12 and fluoropolymer polyvinylidene fluoride (PVDF).
· Kynar® and Kynar Flex® PVDF resins, fine powders, Kynar® Aquatec® PVDF emulsions, Kynar® PVDF foams and Kynar® PVDF polymer processing additives
· The specialty polyamides product line offered by the group encompasses high performance polyamides such as Rilsan® PA 11, Rilsamid® PA 12, Rilsan® T PA 10.10, Rilsan® HT PPA, Rilsan®S PA 6.10 and Hiprolon® PA 6.10, PA 6.12, PA 10.10, PA 10.12.
…………………….more
SAMPLE TABLE/CHART Glance at 2017 Global High Performance Plastics Volume Market Share (%) by
Global Region - United States, Europe, Asia-Pacific and Rest of World
United States High Performance Plastics Market Analysis (2012-2022) by Plastic
Type - Fluoropolymers, High Performance Polyamides, Sulfone Polymers, Polyphenylene Sulphide, Liquid Crystal Polymers, Polyetherimide and
Polyetheretherketone in Metric Tons
KEY PLAYERS PROFILED
· 3M Company · Arkema Group · Asahi Glass Co Ltd · BASF SE · Celanese Corporation · Daikin Industries Ltd · DIC Corporation · E. I. Du Pont De Nemours and Company · EMS-Chemie Holding AG · Evonik Industries AG · Honeywell International Inc. · Kureha Corporation · Mitsui Chemicals, Inc. · Royal DSM N.V. · Saudi Basic Industries Corporation (SABIC) · Shanghai 3F New Material Co Ltd · SK Chemicals Co Ltd (INITZ) · Solvay SA · Sumitomo Chemical Company, Limited · The Chemours Company · Toray Industries, Inc. · UBE Industries, Ltd. · Zhejiang Juhua Co Ltd
…………………….more
2012 2017 2022

Page 3
High Performance Plastics – A Global Market Overview November 2016 |560 Pages | 642 Charts | Price $6300
Click here to buy the report
TABLE OF CONTENTS
PART A: GLOBAL MARKET PERSPECTIVE ........ 1 1. INTRODUCTION .................................................. 1
Chart 1: Global High Performance Plastics Market 2012, 2016 and 2022 .................................................................. 1 Chart 2: Global High Performance Plastics Market 2016 and 2022 by Geographic Region ....................................... 2 Chart 3: Global High Performance Plastics Market 2016 and 2022 by Plastic Type .................................................. 3
1.1 Product Outline .................................................... 4 Figure 1: Plastics Performance Pyramid ........................... 4 Table 1: Thermal Properties of High Performance Plastics 5
1.1.1 High Performance Plastics Types ...................... 6 1.1.1.1 Fluoropolymers .............................................. 6 1.1.1.1.1 Types of Fluoropolymers ............................ 6
Table 2: Fluoropolymers Types ......................................... 6 1.1.1.1.1.1 Polytetrafluoroethylene (PTFE) ................ 7 1.1.1.1.1.1.1 Structure and Properties of PTFE .......... 7
Figure 2: TFE Polymerization ............................................ 7 Table 3: Typical Properties of PTFE ................................... 8
1.1.1.1.1.1.2 Production of Polytetrafluoroethylene (PTFE) ......................................................................... 8 1.1.1.1.1.1.3 PTFE Forms and Applications ................ 9 1.1.1.1.1.2 Fluorinated Ethylene Propylene (FEP) .... 13 1.1.1.1.1.2.1 Structure and Properties of FEP .......... 13
Figure 3: Preparation of FEP ............................................13 Table 4: Typical Properties of FEP ....................................14
1.1.1.1.1.2.2 Production of Fluorinated Ethylene Propylene (FEP) ....................................................... 14 1.1.1.1.1.2.3 FEP Forms and Applications ................ 14 1.1.1.1.1.3 Polyvinylidene Fluoride (PVDF) .............. 16 1.1.1.1.1.3.1 Structure and Properties of PVDF ....... 16
Figure 4: Chemical Structure of PVDF ..............................16 Table 5: Typical Properties of PVDF .................................18
1.1.1.1.1.3.2 Production Processes of PVDF ............ 18 1.1.1.1.1.3.3 Applications and End-Use Sectors of PVDF ........................................................................ 18 1.1.1.1.1.4 Perfluoroalkoxy (PFA/MFA) ................... 23 1.1.1.1.1.4.1 Structure and Properties of PFA/MFA . 23
Figure 5: Chemical Structure of PFA ................................23 Table 6: Typical Properties of PFA ...................................24
1.1.1.1.1.4.2 Production Process of PFA/MFA ......... 24 1.1.1.1.1.4.3 Applications and End-Use Sectors of PFA/MFA .................................................................. 24 1.1.1.1.1.5 Polyvinyl Fluoride (PVF) ......................... 26 1.1.1.1.1.5.1 Structure and Properties of PVF .......... 26
Figure 6: Chemical Structure of PVF ................................27 1.1.1.1.1.5.2 Production Process of PVF .................. 27
Figure 7: Polymerization of VF .........................................27 1.1.1.1.1.5.3 Applications and End-Use Sectors of PVF . 27 1.1.1.1.1.6 Ethylene Tetrafluoroethylene (ETFE) ..... 28 1.1.1.1.1.6.1 Structure and Properties of ETFE ........ 29
Figure 8: Chemical Structure of ETFE ...............................29 Table 7: Typical Properties of ETFE ..................................29
1.1.1.1.1.6.2 Production Process of ETFE ................. 29 Figure 9: ETFE Preparation Process .................................29
1.1.1.1.1.6.3 Applications and End-Use Sectors of ETFE ... 29 1.1.1.1.1.7 Ethylene Chlorotrifluoroethylene (ECTFE) ... 30 1.1.1.1.1.7.1 Structure and Properties of ECTFE ...... 30
Figure 10: Chemical Structure of ECTFE ...........................30 Table 8: Typical Properties of ECTFE ................................30
1.1.1.1.1.7.2 Production Process of ECTFE ............... 31 Figure 11: ECTFE Preparation Process .............................31
1.1.1.1.1.7.3 Applications and End-Use Sectors of ECTFE ....................................................................... 31 1.1.1.1.1.8 Polychlorotrifluoroethylene (PCTFE) ...... 33 1.1.1.1.1.8.1 Structure and Properties of PCTFE ...... 33
Figure 12: Chemical Structure of PCTFE ...........................33 Table 9: Typical Properties of PCTFE ................................33
1.1.1.1.1.8.2 Production Process of PCTFE .............. 33 Figure 13: CTFE Polymerization Process ..........................33
1.1.1.1.1.8.3 Applications and End-Use Sectors of PCTFE . 34 1.1.1.2 High Performance Polyamides ..................... 34 1.1.1.2.1 Polyamide 11 (PA 11) ................................ 35
Figure 14: Chemical Structure of Rilsan PA 11 ................. 35 Table 10: Properties of Polyamide 11 ............................. 36
1.1.1.2.1.1 Applications of Polyamide 11 ................. 36 1.1.1.2.2 Polyamide 12 (PA 12) ................................ 37
Figure 15: Chemical Structure of PA 12 ........................... 37 Table 11: Properties of Polyamide 12 ............................. 38
1.1.1.2.2.1 Applications of Polyamide 12 ................. 38 1.1.1.2.3 Polyamide 46 (PA 46) ................................ 39
Figure 16: Chemical Structure of PA 46 ........................... 39 Table 12: Properties of Polyamide 46 ............................. 40
1.1.1.2.3.1 Applications of Polyamide 46 ................. 40 1.1.1.2.4 Polyarylamide (PARA) or Polyamide MXD6 (PA MXD6) ............................................................... 41
Figure 17: Chemical Structure of PA MXD6 ..................... 41 Table 13: Properties of Polyarylamide (PARA)/PA MXD6 41
1.1.1.2.4.1 Applications of Polyarylamide ................ 42 1.1.1.2.5 Polyphthalamide (PPA) ............................. 42
Figure 18: Repeating unit of Polyphthalamide (PPA) ....... 42 Figure 19: Chemical Structure of Terephthalic acid (TPA) & isophthalic acid (IPA) ....................................................... 42 Figure 20: PPA’s 6T-Segment .......................................... 43 Figure 21: PPA’s DT-Segment .......................................... 43 Figure 22: Chemical structures of three common PPAs ... 43 Table 14: Selected Properties of Polyphthalamides ........ 44
1.1.1.2.5.1 Applications of Polyphthalamides .......... 44 1.1.1.2.6 Polyamide 9T (PA9T) ................................. 45
Figure 23: Chemical Structure of Genestar PA 9T ............ 45 Figure 24: Production Process of Genestar PA 9T ........... 45 Table 15: Properties of Polyamide 9T .............................. 45
1.1.1.2.6.1 Applications of Polyamide 9T ................. 46 1.1.1.3 Sulfone Polymers ......................................... 46 1.1.1.3.1 Polysulfone (PSU) ...................................... 47 1.1.1.3.1.1 Structure and Properties of PSU ............ 47
Figure 25: Chemical Structure of PSU .............................. 47 Table 16: Properties of PSU ............................................. 47
1.1.1.3.1.2 Applications of Polysulfone .................... 48 1.1.1.3.2 Polyethersulfone (PESU) ........................... 49 1.1.1.3.2.1 Structure and Properties of PESU .......... 49
Figure 26: Chemical Structure of PESU ............................ 49 Table 17: Properties of PSU ............................................. 49
1.1.1.3.2.2 Applications of Polyethersulfone ........... 50 1.1.1.3.3 Polyphenylsulfone (PPSU) ......................... 51 1.1.1.3.3.1 Structure and Properties of PPSU .......... 51
Figure 27: Chemical Structure of PPSU ............................ 51 Table 18: Properties of PPSU ........................................... 52
1.1.1.3.3.2 Applications of Polyphenylsulfone ......... 52 1.1.1.3.4 Sulfone Polymers Synthesis ...................... 52 1.1.1.4 Polyphenylene Sulfide (PPS) ........................ 55
Figure 28: Polyphenylene Sulfide (PPS) Chemical Formula. 55 1.1.1.4.1 Properties of Polyphenylene Sulfide (PPS) 55
Table 19: Performance Properties of PPS ........................ 55 Table 20: Comparison of Performance Properties of Select Commercial 40% Glass Fiber Filled PPS Grades ............... 56
1.1.1.4.2 Polyphenylene Sulfide (PPS) Product Types ... 57 Table 21: Comparison of Storage Modulus (E’) Between Cross-Linked and Linear PPS ........................................... 57 Figure 29: Comparison of Cross-Linked and Linear PPS ... 57
1.1.1.4.3 Applications of Polyphenylene Sulfide ...... 57 1.1.1.5 Liquid Crystal Polymers (LCP) ....................... 61 1.1.1.5.1 Types of Liquid Crystal Polymers............... 61
Figure 30: Types of Liquid Crystal Polymers .................... 61 1.1.1.5.2 Structure and Properties of LCP ................ 62
Figure 31: Chemical Structure of Liquid Crystal State Generator ....................................................................... 62 Figure 32: Conventional Design of Liquid Crystal Polymer . 62 Figure 33: Chemical Structure of LCPs ............................. 63 Table 22: Classification Commercial Grades of LCP ......... 63 Figure 34: Monomers used in the Synthesis of LCPs ....... 63
1.1.1.5.3 Polymerization of Liquid Crystal Polymers 63 Figure 35: Standard Polymerization Process of LCP ........ 64
1.1.1.5.4 Applications of Liquid Crystal Polymers .... 65 1.1.1.6 Polyetherimide (PEI) .................................... 66 1.1.1.6.1 Structure and Properties of PEI ................. 66
Figure 36: Chemical Structure of PEI ............................... 67 Table 23: Typical Properties of Ultem Polyetherimide .... 67
1.1.1.6.2 Applications of Polyetherimide (PEI) ......... 67 1.1.1.6.3 Manufacturing Process of PEI ................... 68
Figure 37: Ultem high temperature solution polymerization ............................................................... 68 Figure 38: Reaction of activated bisnitroimide monomer with bisphenoxide .......................................................... 68
1.1.1.7 Polyetheretherketone (PEEK) ...................... 69 1.1.1.7.1 Structure and Properties of PEEK .............. 69
Figure 39: Chemical Structure of PEEK ............................ 69 Table 24: Typical Properties of Polyetheretherketone .... 69
1.1.1.7.2 Manufacturing Process of PEEK ................ 70 Figure 40: Synthesis of Polyetheretherketone ................ 70
1.1.1.7.3 Applications of Polyetheretherketone ...... 70
2. KEY MARKET TRENDS ........................................ 72 2.1 Medical Device Industry Fuelling Demand for Fluoropolymers ....................................................... 72 2.2 Demand for PTFE to Gain Further Momentum from Products with Improved Properties ................ 74 2.3 New Energy Markets to Take PVDF in a Big Way 77 2.4 Demands of Membrane Market Being Addressed by PVDF ................................................................... 79 2.5 ETFE’s Progress in Architectural Applications Gains Prominence .................................................... 80 2.6 Bright Opportunities for Fluoropolymers in the Radiant Solar Modules Market ................................ 82 2.7 High Performance Polyamides Market Trends & Growth Drivers ........................................................ 84 2.8 Sulfone Polymers Market Trends & Growth Drivers ..................................................................... 87 2.9 Auto Industry Acts as Bedrock for Propelling PPS Demand ................................................................... 91 2.10 PPS Thermoplastics Usage Continue to Grow in Aerospace Industry .................................................. 94 2.11 Above Average Growth for PPS to be Driven by Filter Bag Industry in Asia-Pacific ............................. 96 2.12 Liquid Crystal Polymers Market Trends & Growth Drivers ..................................................................... 98
3. INDUSTRY LANDSCAPE .................................... 100 3.1 High Performance Plastics Production Capacities .. 100 3.1.1 Fluoropolymers Producers and Production Capacities .............................................................. 100 3.1.1.1 Polytetrafluoroethylene (PTFE) .................. 100
Chart 4: 2015 Global Polytetrafluoroethylene (PTFE) Estimated Capacities (Metric Tons/Year) by Company . 100 Chart 5: 2015 Global Polytetrafluoroethylene (PTFE) Estimated Capacities (Metric Tons/Year) by Country/Region ............................................................ 101 Chart 6: Polytetrafluoroethylene (PTFE) Producers’ Plant-wise Production Capacities ........................................... 101
3.1.1.2 Fluorinated Ethylene Propylene (FEP) ....... 102 Chart 7: 2015 Global Fluorinated Ethylene Propylene (FEP) Estimated Capacities (Metric Tons/Year) by Company . 102 Chart 8: 2015 Global Fluorinated Ethylene Propylene (FEP) Estimated Capacities (Metric Tons/Year) by Country/Region ............................................................ 102 Chart 9: Fluorinated Ethylene Propylene (FEP) Producers’ Plant-wise Production Capacities ................................. 103
3.1.1.3 Polyvinylidene Fluoride (PVDF) .................. 103 Chart 10: 2015 Global Polyvinylidene Fluoride (PVDF) Estimated Capacities (Metric Tons/Year) by Company . 103 Chart 11: 2015 Global Polyvinylidene Fluoride (PVDF) Estimated Capacities (Metric Tons/Year) by Country .... 104
Page 4
High Performance Plastics – A Global Market Overview November 2016 |560 Pages | 642 Charts | Price $6300
Click here to buy the report
Chart 12: Polyvinylidene Fluoride (PVDF) Producers’ Plant-wise Production Capacities ............................................ 104
3.1.1.4 Ethylene tetrafluoroethylene (ETFE) .......... 105 Chart 13: 2015 Global Ethylene tetrafluoroethylene (ETFE) Estimated Capacities (Metric Tons/Year) by Company .. 105 Chart 14: 2015 Global Ethylene tetrafluoroethylene (ETFE) Estimated Capacities (Metric Tons/Year) by Country/Region ............................................................. 105 Chart 15: Ethylene tetrafluoroethylene (ETFE) Producers’ Plant-wise Production Capacities .................................. 105
3.1.1.5 Perfluoroalkoxy (PFA/MFA) ....................... 106 Chart 16: 2015 Global Perfluoroalkoxy (PFA) Estimated Capacities (Metric Tons/Year) by Company ................... 106 Chart 17: 2015 Global Perfluoroalkoxy (PFA) Estimated Capacities (Metric Tons/Year) by Country/Region ......... 106 Chart 18: Perfluoroalkoxy (PFA/MFA) Producers’ Plant-wise Production Capacities ............................................ 106
3.1.1.6 Polychlorotrifluoroethylene (PCTFE) .......... 107 Chart 19: 2015 Global Polychlorotrifluoroethylene (PCTFE) Estimated Capacities (Metric Tons/Year) by Company .. 107 Chart 20: 2015 Global Polychlorotrifluoroethylene (PCTFE) Estimated Capacities (Metric Tons/Year) by Country/Region ............................................................. 107
3.1.1.7 Polyvinyl fluoride (PVF) .............................. 107 3.1.1.8 Ethylene chlorotrifluoroethylene (ECTFE) .. 107 3.1.2 High Performance Polyamides Producers and Production Capacities ............................................ 108 3.1.2.1 Polyamide 11 ............................................. 108 3.1.2.2 Polyamide 12 ............................................. 108
Chart 21: Global Polyamide 12 (PA 12) Installed Capacities by Manufacturer in Metric Tons .................................... 108
3.1.2.3 Polyamide 9T ............................................. 108 3.1.2.4 Polyarylamide/Polyamide MXD6 ............... 109
Chart 22: Global Polyarylamide (PARA)/Polyamide MXD6 (PA MXD6) Installed Capacities by Manufacturer in Metric Tons............................................................................... 109
3.1.2.5 Polyamide 46 ............................................. 109 3.1.2.6 Polyphthalamide/Polyamide 6T ................. 109 3.1.3 Sulfone Polymers Producers and Production Capacities .............................................................. 110
Chart 23: 2015 Global Sulfone Polymers Neat Resin Installed Capacity by Manufacturer in Metric Tons ....... 110 Chart 24: Global Sulfone Polymers Neat Resin Installed Capacity by Country in Metric Tons ............................... 110 Chart 25: Global Sulfone Polymers Neat Resin Installed Capacity by Manufacturer and Country in Metric Tons . 110
3.1.4 Polyphenylene Sulfide Producers and Production Capacities ............................................ 111
Chart 26: Global Polyphenylene Sulfide (PPS) Installed Capacities by Country in Metric Tons ............................ 111 Chart 27: Global Polyphenylene Sulfide (PPS) Installed Capacities by Manufacturer and Country in Metric Tons . 112
3.1.5 Liquid Crystal Polymer Producers and Production Capacities ............................................ 113
Chart 28: 2015 Global Liquid Crystal Polymer (LCP) Installed Capacity by Manufacturer in Terms of Neat Resin and Compounds in Metric Tons ..................................... 113 Chart 29: Global Liquid Crystal Polymer (LCP) Neat Resin Installed Capacities by Country in Metric Tons .............. 114 Chart 30: Global Liquid Crystal Polymer (LCP) Neat Resin Installed Capacities by Manufacturer and Country in Metric Tons ................................................................... 114
3.1.6 Polyetherimide (PEI) Producers and Production Capacities .............................................................. 115 3.1.7 Polyetheretherketone (PEEK) Producers and Production Capacities ............................................ 115
Chart 31: Global Polyetheretherketone (PEEK) Installed Capacities by Manufacturer and Country in Metric Tons . 115 Chart 32: Global Polyetheretherketone (PEEK) Installed Capacities by Country in Metric Tons ............................ 115
3.2 Key Global Players............................................ 117 3M Company (United States) ........................................ 117 Arkema Group (France) ................................................. 119 Asahi Glass Co Ltd (Japan) ............................................. 121 BASF SE (Germany) ........................................................ 122 Celanese Corporation (United States) ........................... 123
Fortron Industries LLC (United States) .......................... 124 Daikin Industries Ltd (Japan) ......................................... 125 DIC Corporation (Japan) ................................................ 127 Dongyue Group Limited (China) .................................... 128 E. I. Du Pont De Nemours and Company (United States) . 129 Ems-Chemie Holding AG (Switzerland) .......................... 131 Evonik Industries AG (Germany) ................................... 133 Gujarat Fluorochemicals Limited (India) ....................... 135 Halopolymer OJSC (Russia) ........................................... 135 Honeywell International Inc. (United States) ................ 137 Jiangsu Meilan Chemical Co Ltd (China) ........................ 137 Kuraray Co., Ltd. (Japan) ............................................... 138 Kureha Corporation (Japan) .......................................... 139 Mitsubishi Gas Chemical Company, Inc. (Japan) ........... 141 Mitsui Chemicals, Inc. (Japan) ....................................... 143 Polyplastics Co., Ltd. (Japan) ......................................... 144 Royal Dsm N.V. (The Netherlands) ................................ 145 Saudi Basic Industries Corporation (SABIC) (Saudi Arabia) 146 Shanghai 3F New Material Co Ltd (China) ..................... 148 SK Chemicals Co Ltd (INITZ) (South Korea) .................... 149 Solvay SA (Belgium)....................................................... 150 Sumitomo Chemical Company, Limited (Japan) ............ 153 The Chemours Company (United States) ...................... 155 Toray Industries, Inc. (Japan) ........................................ 157 UBE Industries, Ltd. (Japan) .......................................... 158 Victrex PLC (United Kingdom) ....................................... 159 Zhejiang Juhua Co Ltd (China) ....................................... 160 Zhejiang NHU Special Materials Co Ltd (China) ............. 161 Zhonghao Chenguang Research Institute Chemical Industry (China) ............................................................ 161
3.3 Other Major Players ......................................... 162 Changshu Xinhua Chemical Co., Ltd (China) .................. 162 Chengdu Letian Plastics Co., Ltd (China)........................ 162 China Lumena New Materials Corp. (China) .................. 163 Fuxin Hengtong Fluorine Chemicals Co., Ltd. (China) .... 163 Guangzhou LiChang Fluorine Plastic Co Ltd (China)....... 164 Haohua Honghe Chemical Co Ltd. (China) ..................... 164 Hindustan Fluorocarbons Limited (India) ...................... 165 Jiangmen Youju New Materials Co., Ltd (China) ............ 165 Jiangsu Huaao High-Tech Development Co., Ltd. (China) . 166 Jilin Zhongyan High Performance Plastic Co., Ltd. (China) 166 Jinhua Yonghe Fluorochemical Co Ltd (China) ............... 167 Jx Nippon Oil & Energy Corporation (Japan) ................. 167 Kingfa Science & Technology Co., Ltd. (China) .............. 167 Panjin Zhongrun High Performance Polymers Co., Ltd (China) .......................................................................... 168 Shandong Huafu Fluoro-Chemical Co., Ltd (Jinan 3F) (China) .......................................................................... 168 Shanghai Ofluorine Chemical Technology Co., Ltd (China) 169 Shanghai Pret Composites Co., Ltd. (China) .................. 169 Shenzhen Wote Advanced Materials Co., Ltd. (China) .. 170 Tosoh Corporation (Japan) ............................................ 170 Toyobo Co., Ltd. (Japan) ................................................ 171 Ueno Fine Chemicals Industry, Ltd. (Japan) ................... 172
4. KEY BUSINESS & PRODUCT TRENDS ................. 173 Solvay Offered its Ryton® PPS for the Polimotor 2 Engine's Water Pump Components ............................................. 173 Solvay Plans to Rise its Sulfone Polymer Production Capacity by 35 Percent .................................................. 173 Celanese to Takeover SO.F.TER. Group ......................... 173 DIC's LP-150-LDS is the World's First PPS Compound Suited for 3D LDS ..................................................................... 173 SkyTender Chose VICTREX™ PEEK Polymer for Use in its Mobile Drinks Dispenser ............................................... 174 Shanghai Reach Developed Lighter, More Ergonomic and Highly Cost-Effective Spinal Surgery Instrument Kit Using Solvay's KetaSpire® PEEK and AvaSpire® PAEK .............. 174 Kureha Renewed its PPS Business Alliance with Polyplastics .................................................................. 174 Establishment of BASF's New Ultrason® Polyarylsulfone Facility in Korea ............................................................. 174 New Single-Use Electrocautery Instrument for Adenoid and Tonsil Surgeries Used Solvay's Ixef® GS-1022 PARA Resin .... 174 Arkema Invested €10 Million to Broaden its Specialty Polyamides Production Capacities ................................ 175 DSM NHU's Xytron PPS Compounds Complemented DSM's High Temperature Performance Engineering Plastics Portfolio ....................................................................... 175
VICTREX ™ PAEK Polymers Used in the Development of COMAC's Jet ARJ21 Aircraft Floor Brackets ................... 175 Sumitomo Chemical to Build Second Polyethersulfone (PESU) Plant in Japan .................................................... 175 Impossible Objects to Produce PEEK-based Composite Parts Using New 3D Printing Process ............................ 175 Apollo Broadens its line of Extruded Microtubes for Healthcare Applications ................................................ 176 Dacon Systems Selected Solvay's KetaSpire® PEEK for Hardest Wire and Cable Coating Applications .............. 176 Construction of Sumitomo Chemical's Second Commercial PES Production Facility in Chiba .................................... 176 Nippon's Electric Wire Binding Bands Used Daicel-Evonik's VESTAKEEP-J ZV7801 PEEK Resin ................................. 176 Japan's First Injection-Molded ESD Bolts are the First to Use VESTAKEEP®-J PEEK Resin ...................................... 176 Addition of Three Ryton® PPS Grades to Solvay's Product Line for Food and Beverage Use .................................. 176 World's First Integrated PPS Plant Sited in Gunsan City, Korea ............................................................................ 177 Development of AvaSpire® AV-651 CF30 PAEK based Structural Components for Polimotor 2 Engine's Oil Pump Housing ........................................................................ 177 AOI's PS-fit Resin Joints Utilized Daicel-Evonik's VESTAKEEP® PEEK Resin ............................................... 177 Inauguration of New European PPS Technical Centre by Sun Chemical and the DIC Corporation ......................... 177 Solvay Offered its Ryton® XK-2340 PPS Reinforced Resin for the Polimotor 2 Engine's Fuel Rail ........................... 177 Extension of Pan-European Distribution Pact between Solvay and Biesterfeld Plastic ....................................... 178 Solvay Broadened Deal with Nevicolor for Distributing the Complete Line of Ryton® PPS in Italy ............................ 178 Arkema and HP form 3D Printing Materials Development Pact .............................................................................. 178 Toska-Bano’k Chose VESTAKEEP-J PEEK Resin to Develop Colored Tag Pins for Medical Laboratory Specimens ... 178 Nippon Chemical Adopted Daicel-Evonik's VESTAKEEP® PEEK Resin for Use in ANSI Bolts ................................... 178 DuPont Established its Largest Compounding Facility .. 178 Launch of Royal DSM's Stanyl HGR1 for Frictional Torque Reduction in Automobile Engine Timing Systems ......... 179 UJU Signed an Exclusive Deal with Conventus to Meet Polysulfone Crisis in North America ............................. 179 The Largest and Longest Ever VICTREX® PEEK-based m-pipe® Subsea Intervention Line by Magma ................... 179 Use of KetaSpire® PEEK in BGISEQ-500 Sequencer ....... 179 Launch of Evonik's VESTAKEEP® Dental at MedTec Europe . 179 Solvay's Ultra High Performance, Aromatic Polyketones to Coat Optacore's OptaGuide HT™ Optical Fiber Systems . 179 Solvay Showcases Extensive Line of High-Performance Polymers for Electric Vehicle Battery and Battery Packs180 Solvay Offered its Amodel® PPA for the Polimotor 2 Water Inlet / Outlet Application .............................................. 180 Solvay's New Deal with ResMart to Distribute Eight Radel® PPSU Resin Grades ....................................................... 180 Solvay's TegraCore™ PPSU Foam Received Airbus Qualification ................................................................. 180 Toho Tenax Introduces New Polyethersulfone Impregnated Thermoplastic Textile Prepreg................. 180 China FDA Approval for Zeniva ® PEEK ......................... 181 Solvay's New Deal with ResMart to Distribute KetaSpire® PEEK Resin Grades ........................................................ 181 Solvay Offered Zeniva PEEK® for Use in Instratek's ToeTac™ Implant .......................................................... 181 SABIC's ULTEM PEI Resin is a Material of Choice for ZoffSMART Glasses Frame ............................................ 181 Polymem Develops Production Line for Hollow Fiber Membranes Made from Arkema’s Kynar® .................... 181 European Plastics Innovation Award received by Evonik's Resource Efficiency Segment ........................................ 181 50% Rise in the Annual Production Capacity of Evonik's VESTOSINT® PA12 Powder............................................ 182 New Veradel® HC A-301 PESU for Challenging Healthcare Applications Unveiled by Solvay ................................... 182 Biorep Technologies Employed Radel® R-5000 PPSU to Enhance its Ricordi Chamber ........................................ 182 Solvay's Veradel® HC A-301 PESU Used as an Alternative for PEI in ASTi's Sensors ................................................ 182
Page 5
High Performance Plastics – A Global Market Overview November 2016 |560 Pages | 642 Charts | Price $6300
Click here to buy the report
Surface Dynamics Validated VESTAKEEP® PEEK for Titanium Coating Processes ........................................... 182 Invibio in Collaboration with Maxx Orthopedics Developed PEEK-OPTIMA® Femoral Knee Replacement Technology .... 182 Drake Plastics Enhanced its Product Line with the Addition of AvaSpire® PAEK Products .......................................... 183 DuPont Tedlar Films to be Distributed by American Durafilm® ...................................................................... 183 New Line of Rilsan® Fine Powders Added to Arkema's Bio-based Polyamide Coating Powders Portfolio for Outdoor Furniture ....................................................................... 183 Establishment of DuPont's First Zytel® HTN Polymer Production Unit in Europe ............................................ 183 Selection of DSM's Stanyl® PA46 for Use in New Turbocharged Petrol Engine Components .................... 183 EMS-GRIVORY Offered Grilamid L20A HL NZ Special PA12 Grade for Ski Sports ....................................................... 183 Industry’s first PPS resin particles for powder bed fusion 3D printing developed by Toray .................................... 184 Production Capacity of Polyplastics' Facility in Malaysia Increased by 9,000 Tons ................................................ 184 BIOTEK Received CE Mark Certificate and Indian FDA Approval for its VESTAKEEP® PEEK-based Arthroscopy Implants ........................................................................ 184 Polimotor 2 Automotive Engine Project Selected Solvay's KetaSpire® PEEK for Oil Scavenger Line ......................... 184 Arkema Expands Scope of Use for Patent-Pending Kynar® Foam Extrusion .............................................................. 184 Arkema and PPG Celebrate Half a Century of Association ... 185 Kureha Takes Over Kureha Battery Materials Japan ...... 185 Grivory HT2VS-HH, Novel range of High Heat Polyamides from EMS-GRIVORY ....................................................... 185 Valeo Schalter und Sensoren GmbH Selected Evonik's VESTAMID® L1930 PA12 for the Gear Drive of the Steering Angle Sensor ................................................................. 185 DSM Engineering Plastics Solidified its Position in the EMEA Market ............................................................... 185 Strong Compatibility with Ford's New ULV 25 ATF Exhibited by Solvay High Performance Polymer Grades 185 USB Type-C Connectors Molded Using DuPont™ Zytel® HTN FR52 NH Polyamide Resin ...................................... 186 Polyphenylene Sulfide Fiber TORCON™ and Polyacrylonitrile-base Flame Resistant Yarn Utilized to Develop High Performance Flame Shielding Paper ........ 186 Solvay's KetaSpire® PEEK Demonstrated Strong Compatibility with Ford's new ULV 25 ATF .................... 186 Solvay's KetaSpire® PEEK Selected for Polimotor 2's 3D-Printed Fuel Intake Runner ............................................ 186 VICTREX Pipes™ Replaced Metal Tubing in High Voltage Cable Conduits .............................................................. 186 Automotives Installed with Plastic-rubber Technology-based Cooling Components Made of Special PPA VESTAMID® HTplus R1033 and HNBR Elastomer .......... 187 Solvay's New Deal with Chase Plastics to Distribute High-Performance Amodel® PPA Resins ............................... 187 Introduction of Solvay's Pre-Colored Radel® R-7159 Series Resins for Use in Commercial Aircraft Interiors ............. 187 Hankuk Carbon Selected Virantage® PESU Tougheners to Produce Enhanced Thermoset Composite Prepregs ...... 187 Celanese to Launch Two Premium Industrial PEEK Grades in the Second Half of 2016 ............................................ 187 CFDA Approval for Invibio's PEEK-OPTIMA® HA Enhanced for Spinal Fusion Implants ............................................. 188 Broadening of PEEK Polymers Production Capacity at Evonik's China Site ......................................................... 188 Arkema’s High Performing Kynar Flex® Grade for the Wire and Cable Sector Launched ........................................... 188 Addition of Five New Glass Fiber-Reinforced Grades of Amodel® AE-8900 Series by Solvay for Automotive Electronics Use .............................................................. 188 Addition of LFT Technology Complemented Solvay Specialty Polymers' High Performance Lightweight Materials Portfolio ........................................................ 188 Introduction of VICTREX® AE250 Composites for Aircrafts ... 189 Vertera Spine Selected Solvay's Zeniva® PEEK for the Development of PEEK Scoria™ Technology ................... 189 VESTAKEEP® 5000 HCM Micro Granules Enhanced Production Efficiency of Customized PEEK Seals ........... 189 Innov'spine Received CE Mark Approval for its New PEEK Polymer-based Spinal Rods ........................................... 189
AGC Introduces Fluon® LM-ETFE LH-8000 for New Applications .................................................................. 189 Arkema Launches Additional PVDF Polymer Process Aids ... 190 Instratek's STAPiX™ Staple Fixation System Components Molded Using Solvay's Ixef® 1022 PARA Resin .............. 190 VESTAMID® HTplus M1933 PPA Outperformed Other Competitive Polymers with Outstanding Electrical RTI . 190 Medical Illumination Used Solvay's Medical-Grade Polymers in its New MI-750 LED Lighting System .......... 190 Launch of Celanese® PPS Grades in Japan .................... 190 VICTREX® PEEK 90HMF40 Replaced Aluminum in Making the Airbus A350-900 Aircraft Door Fitting ..................... 191 Toyota MIRAI FCV Component Used Kuraray's GENESTAR PA 9T Resin ................................................................... 191 Evonik's VESTAMID® HTplus PPA Used in the Manufacture of HELLA Laser-Welded Actuator Housing Components 191 Launch of Evonik's VESTAMID® HTplus M1035 P1 for Automotive Use ........................................................... 191 Solvay Signed a New Licensing Deal with RTP Company to Broaden the Supply of its Radel® R-7000 PPSU Resins to Global Aerospace Market ............................................. 191 3M™ Dyneon™ Compound NST 1111R Launched ......... 191 The Chemours Company Spun Off from DuPont ........... 192 Solvay to Commence PVDF Production at its Chinese Plant by 2017 ......................................................................... 192 Solvay Specialty Polymers’ ECTEF Resin Films Used in Amcor’s Flexible Solar Front Sheets .............................. 192 Acquisition of Kleiss Gears Enhanced Victrex's Potential to Offer Complete Integrated Solutions ............................ 192 Morphix Selected Solvay Radel® PPSU Resins to Replace Metals in its Tattoo Needle Grips ................................. 192 Sumitomo Chemical Increases the Capacity of Polyethersulfone (PESU) at its Ehime Plant ................... 193 Denroy Formed Pact with Bombardier and Victrex to Deploy its Brackets in Commercial Aircraft ................... 193 EU Intends to Ban PFOA ................................................ 193 AGC Chemicals Enters Brazilian Fluoropolymer Market 193 Solvay's New Veradel® 3300 SL 30 PESU Launched at the CTI Symposium ............................................................. 193 Strategic Alliance with NHU Reinforces the High Performance Engineering Plastics Portfolio of DSM ...... 193 Development of the Polimotor 2 All-Plastic Automotive Engine by Solvay ........................................................... 194 SK Chemicals and INITZ to Exhibit Super Engineering Plastics at Chinaplas 2015 ............................................. 194 Tulip, a PEEK-OPTIMA® Polymer based Spinal Stabilisation System from Weigao ................................................... 194 Evonik's VESTAKEEP® i-Grade PEEK Passed Biocompability Test in China ................................................................. 194 Establishment of Victrex's New PAEK Facility Opens Up New Possibilities .......................................................... 194 ATO's Semi-Finished Tubes Made of KetaSpire® PEEK Resin Compliant with NORSOK M-710 Standard for Oil & Gas 195 National Nonwovens Used ULTEM™ PEI to Develop the First Fire Blocker for All Aircraft Seating Dress Covers .. 195 Shanghai 3F New Materials’ PTFE Capacity Expanded .. 195 NSF Certification Enabled the Use of Amodel® PPA Resin Grades of Solvay in Food Service Industry ..................... 195 Construction of New Production Line to Broaden DIC's PPS Polymer Production Capacity ........................................ 195 New TECATEC Product Series Exemplified the Close Collaboration of Ensinger and Victrex ........................... 195 US FDA Offered 510(k) Clearance for Meditech Spine's Talos®-C (HA) Cervical IBF Devices ................................ 196 NSF Certified Solvay's KetaSpire® PEEK Resin for Highly Demanding Food Processing and Household Appliance Applications .................................................................. 196 SABIC to Increase Production Capacity of Ultem PEI Resin by 30% .......................................................................... 196 AGC FluoroCompounds Group Inaugurates Pilot Plant . 196 DuPont Increased its Zytel® HTN PPA Production to Meet the Rising Global Market Demand ................................ 196 ELITechGroup Selected Solvay's Radel® PPSU as an Alternative to Transparent PC Resin for Injection Molding Two Redesigned Slide Stainer Carousels ....................... 196 Solvay Named Infinity LTL an Authorized Color Compounder of Amodel® PPA, Udel® PSU and Xydar® LCP Resins ............................................................................ 197 Victrex and Lenorplastics to form PAEK Distribution Pact .... 197
HuanTian to Use VICTREX® PEEK Valve Plates in Reciprocating Compressors ........................................ 197 Evonik's VESTAKEEP® PEEK Used in the Production of High Precision One-Inch Sized Screws................................... 197 CE Mark for Osimplant's Cervical Expandable Bladed HA PEEK Cage Line of Spinal Implants ................................ 197 Arkema’s New Grade of Kynar® PVDF Resin Launched . 197 Strong Compatibility exhibited by Radel® PPSU based Instrument Trays with STERIZONE® VP4 Sterilizer ........ 198 Solvay to Raise Total PEEK Production Capacity to over 2,500 Metric Tons Globally ........................................... 198 Victrex to Construct a Polymer Innovation Centre in Northern England ......................................................... 198 Launch of EMS-GRIVORY's New Grivory HT Products with Outstanding Hydrolysis Resistance ............................... 198 Ryton® PPS Acquired by Solvay .................................... 198 Solvay Launched Xydar® MG-850 LCP to Meet the Demands of New 12-Gigabyte Connectors ................... 198 Infinity Joined Forces with LTL to Form Infinity LTL Engineered Compounds ............................................... 199 Karmed's Superfusion Line of Spinal Implants Granted with CE Mark ....................................................................... 199 RelaxBogen Developed a New Treatment Alternative for Bruxism and TMD ......................................................... 199 Solvay to Raise Ultra-Polymer Resin Production Capacity in India by 25% ................................................................. 199 New Semi-Rigid PEEK-OPTIMA® Polymer Based Spinal Rod Components Bridge Treatment Gap ............................. 199 Victrex to Open its £90 Million PEEK Production Unit in Early 2015 ..................................................................... 199 BoneBac® TLIF Spacer from Thompson MIS Received the US 510(k) Clearance ..................................................... 199 New Invibio Trauma Device Technology based on PEEK-OPTIMA Ultra Reinforced Polymer for Healing Fractures .... 200 Evonik's VESTAMID® Molding Compounds for Rail and Automotive Industry..................................................... 200 Osram Chose Royal DSM's Stanyl® TC PA 46 in the Heat Sinks of its LED Downlights ........................................... 200 First Supply Deal of SK Chemicals with a Major International Company for Super Engineering Plastic Materials ..................................................................... 200 Launch of Solvay's New 30% Glass-Reinforced AvaSpire® AV-652 PAEK................................................................. 201 COMAC Qualified Five of Solvay's KetaSpire® PEEK Grades for Use in its C919 Aircraft ............................................ 201 Medshine Launched AvaSpire® PAEK-based Locally-Produced Surgical Sterilization Cases ........................... 201 Victrex and Tri-Mack Joined Forces to Develop New Hybrid-Molded VICTREX® PAEK-based Composite Aerospace Bracket ........................................................ 201 PEEK-based JUVORA™ Dental Disc is a Time-Saving Non-Metal Alternative to Metal-based Removable Partial Denture ....................................................................... 201 DuPont Fluoropolymer Solutions Consolidates Chinese Operations .................................................................... 202 Solvay Launches Two New ECTFE Film Grades for PV Front Sheet Applications ........................................................ 202 Launch of Two Novel Grades of Ryton® PPS for Food Contact Applications ..................................................... 202 VICTREX PEEK-based Diamould Connectors for Deepwater, HPHT Wellhead and Downhole Applications ............... 202 3M Introduces 3M™ Dyneon™ PTFE Dispersion TF 5035GZ without APEO and APFO ............................................... 202 Kureha Completes Construction of PVDF Plant in China 202 Zhejiang Juhua Co Ltd to Build PVDF Facility................. 203 Distribution Pacts Formed by DSM to Reinforce its Footprint in Mexico ..................................................... 203 World's First High-Heat Plastic Air Intake Manifold with Integrated Charge Air Cooler Utilized DSM's Stanyl® Diablo PA46 ............................................................................. 203 Establishment of DIC Corporation's First PPS Compounds Facility in the PRC ......................................................... 203 Arkema Expands Kynar® PVDF Portfolio with New Grade for Drinking Water Systems .......................................... 203 Honeywell’s Brazilian Operations See Growth .............. 204 Evonik Increased PA12 Production Capacity at its Marl Facility by 5,000 MTs .................................................... 204 US FDA Offered 510 (k) Clearance for Extremity Medical's New HammerFiX™ IP Fusion System Produced Using Solvay's Zeniva® PEEK Resin ......................................... 204

Page 6
High Performance Plastics – A Global Market Overview November 2016 |560 Pages | 642 Charts | Price $6300
Click here to buy the report
Zeus Offered its New PEEK Engineered Surface Tubing with Enhanced Lubricity for Medical Use .............................. 204 Broadening of Celanese's Kentucky Compounding Production Facility ......................................................... 204 Solvay's KetaSpire® KT-825 Provided 50% Greater Stiffness than Standard Neat PEEK Grades .................................. 204 KetaSpire® PEEK-based Ketron® PEEK Stock Shapes Compliant with NORSOK M-710 Standards for Oil and Gas . 204 Solvay Introduces Novel Grades of Halar® ECTFE Film ... 205 Korean Researchers Develop Novel Technology for Manufacturing VDF ....................................................... 205 Arkema Showcases Kynar® Aquatec® CRX Latex ........... 205 Solvay High Performance Polymers Earned Regulatory Approvals for Use in Food Contact and Drinking Water Applications .................................................................. 205 Celanese to Expand Compounding Capabilities at Nanjing Integrated Chemical Complex ....................................... 206 Development of Halogen-free Fortron® PPS CES50 for Consumer Electronics Device Housings ......................... 206 Use of Celanese's Fortron ICE PPS in Making Allied Series VX-Mid™ HT UHF RFID Tag ............................................ 206 PolyOne to Launch LubriOne™ PEEK Solutions for Use in Electrical Power Tools ................................................... 206 AvaSpire® PAEK-based Structural Components in Technifab's New High-Performance Polymeric Foam Ducting System ............................................................. 206 Airbus Qualified Three of Solvay's KetaSpire® PEEK Grades . 206 AS9100C/ISO9001:2008 Aerospace Certification for VICTREX Pipes™ ............................................................ 207 Greene, Tweed Adds ARLON® 3000 XT as Substitute .... 207 CE Mark Certification for VESTAKEEP® PEEK based Cage System ........................................................................... 207 Evonik’s VESTAKEEP® PEEK Implant Product Line Receives FDA 510(k) Clearance .................................................... 207 Evonik Clears NORSOK M-710 Test for VESTAKEEP® PEEK 5000 G .......................................................................... 207 DuPont™ Fluoropolymer Solutions Expands Melt-Processable Fluoroplastic Resin Capacity ...................... 207 UL Plastics Component Database Certifies DuPont Fluoroplastic’s ECCtreme™ ECA 3000 as Having the Highest Temperature Rating ......................................... 208 Victrex Supplies VICTREX® PEEK Polymers Solutions to COMAC .......................................................................... 208 Inauguration of BASF's Ultrason® Production Facility in South Korea ................................................................... 208
5. GLOBAL MARKET OVERVIEW........................... 209 Chart 33: Global High Performance Plastics Market Analysis (2012-2022) in Volume (Metric Tons) and Value (USD Million) 209
5.1 Global High Performance Plastics Market Overview by End-use Sector .................................. 210 Volume Analysis ..................................................... 210
Chart 34: Global High Performance Plastics Market Analysis (2012-2022) by End-use Sector – Automotive & Transportation, Building & Construction, Consumer Goods, Electrical & Electronics, Mechanical/Industrial and Other in Metric Tons ... 210 Chart 35: Glance at 2012, 2017 and 2022 Global High Performance Plastics Volume Market Share (%) by End-use Sector – Automotive & Transportation, Building & Construction, Consumer Goods, Electrical & Electronics, Mechanical/Industrial and Other................................... 210
Value Analysis ........................................................ 211 Chart 36: Global High Performance Plastics Market Analysis (2012-2022) by End-use Sector – Automotive & Transportation, Building & Construction, Consumer Goods, Electrical & Electronics, Mechanical/Industrial and Other in USD Million211 Chart 37: Glance at 2012, 2017 and 2022 Global High Performance Plastics Value Market Share (%) by End-use Sector – Automotive & Transportation, Building & Construction, Consumer Goods, Electrical & Electronics, Mechanical/Industrial and Other................................... 211
5.1.1 High Performance Plastics End-use Sector Market Overview by Global Region ....................... 212 5.1.1.1 Automotive & Transportation .................... 212 Volume Analysis ..................................................... 212
Chart 38: Global Market for High Performance Plastics in Automotive & Transportation Sector (2012-2022) by Geographic Region – United States, Europe, Asia-Pacific and Rest of World in Metric Tons .................................. 212
Chart 39: Glance at 2012, 2017 and 2022 Global High Performance Plastics Volume Market Share (%) in Automotive & Transportation Sector by Geographic Region – United States, Europe, Asia-Pacific and Rest of World ............................................................................ 212
Value Analysis ........................................................ 213 Chart 40: Global Market for High Performance Plastics in Automotive & Transportation Sector (2012-2022) by Geographic Region – United States, Europe, Asia-Pacific and Rest of World in USD Million .................................. 213 Chart 41: Glance at 2012, 2017 and 2022 Global High Performance Plastics Value Market Share (%) in Automotive & Transportation Sector by Geographic Region – United States, Europe, Asia-Pacific and Rest of World ................. 213
5.1.1.2 Building & Construction ............................. 214 Volume Analysis..................................................... 214
Chart 42: Global Market for High Performance Plastics in Building & Construction Sector (2012-2022) by Geographic Region – United States, Europe, Asia-Pacific and Rest of World in Metric Tons .................................................... 214 Chart 43: Glance at 2012, 2017 and 2022 Global High Performance Plastics Volume Market Share (%) in Building & Construction Sector by Geographic Region – United States, Europe, Asia-Pacific and Rest of World .............. 214
Value Analysis ........................................................ 215 Chart 44: Global Market for High Performance Plastics in Building & Construction Sector (2012-2022) by Geographic Region – United States, Europe, Asia-Pacific and Rest of World in USD Million ..................................................... 215 Chart 45: Glance at 2012, 2017 and 2022 Global High Performance Plastics Value Market Share (%) in Building & Construction Sector by Geographic Region – United States, Europe, Asia-Pacific and Rest of World ......................... 215
5.1.1.3 Consumer Goods ....................................... 216 Volume Analysis..................................................... 216
Chart 46: Global Market for High Performance Plastics in Consumer Goods Sector (2012-2022) by Geographic Region – United States, Europe, Asia-Pacific and Rest of World in Metric Tons .................................................... 216 Chart 47: Glance at 2012, 2017 and 2022 Global High Performance Plastics Volume Market Share (%) in Consumer Goods Sector by Geographic Region – United States, Europe, Asia-Pacific and Rest of World .............. 216
Value Analysis ........................................................ 217 Chart 48: Global Market for High Performance Plastics in Consumer Goods Sector (2012-2022) by Geographic Region – United States, Europe, Asia-Pacific and Rest of World in USD Million ..................................................... 217 Chart 49: Glance at 2012, 2017 and 2022 Global High Performance Plastics Value Market Share (%) in Consumer Goods Sector by Geographic Region – United States, Europe, Asia-Pacific and Rest of World ......................... 217
5.1.1.4 Electrical & Electronics ............................... 218 Volume Analysis..................................................... 218
Chart 50: Global Market for High Performance Plastics in Electrical & Electronics Sector (2012-2022) by Geographic Region – United States, Europe, Asia-Pacific and Rest of World in Metric Tons .................................................... 218 Chart 51: Glance at 2012, 2017 and 2022 Global High Performance Plastics Volume Market Share (%) in Electrical & Electronics Sector by Geographic Region – United States, Europe, Asia-Pacific and Rest of World .. 218
Value Analysis ........................................................ 219 Chart 52: Global Market for High Performance Plastics in Electrical & Electronics Sector (2012-2022) by Geographic Region – United States, Europe, Asia-Pacific and Rest of World in USD Million ..................................................... 219 Chart 53: Glance at 2012, 2017 and 2022 Global High Performance Plastics Value Market Share (%) in Electrical & Electronics Sector by Geographic Region – United States, Europe, Asia-Pacific and Rest of World .............. 219
5.1.1.5 Mechanical/Industrial ................................ 220 Volume Analysis..................................................... 220
Chart 54: Global Market for High Performance Plastics in Mechanical/Industrial Sector (2012-2022) by Geographic Region – United States, Europe, Asia-Pacific and Rest of World in Metric Tons .................................................... 220
Chart 55: Glance at 2012, 2017 and 2022 Global High Performance Plastics Volume Market Share (%) in Mechanical/Industrial Sector by Geographic Region – United States, Europe, Asia-Pacific and Rest of World .. 220
Value Analysis ........................................................ 221 Chart 56: Global Market for High Performance Plastics in Mechanical/Industrial Sector (2012-2022) by Geographic Region – United States, Europe, Asia-Pacific and Rest of World in USD Million .................................................... 221 Chart 57: Glance at 2012, 2017 and 2022 Global High Performance Plastics Value Market Share (%) in Mechanical/Industrial Sector by Geographic Region – United States, Europe, Asia-Pacific and Rest of World .. 221
5.1.1.6 Other Sectors ............................................. 222 Volume Analysis .................................................... 222
Chart 58: Global Market for High Performance Plastics in Other Sectors (2012-2022) by Geographic Region – United States, Europe, Asia-Pacific and Rest of World in Metric Tons .............................................................................. 222 Chart 59: Glance at 2012, 2017 and 2022 Global High Performance Plastics Volume Market Share (%) in Other Sectors by Geographic Region – United States, Europe, Asia-Pacific and Rest of World ...................................... 222
Value Analysis ........................................................ 223 Chart 60: Global Market for High Performance Plastics in Other Sectors (2012-2022) by Geographic Region – United States, Europe, Asia-Pacific and Rest of World in USD Million .......................................................................... 223 Chart 61: Glance at 2012, 2017 and 2022 Global High Performance Plastics Value Market Share (%) in Other Sectors by Geographic Region – United States, Europe, Asia-Pacific and Rest of World ...................................... 223
5.2 Global High Performance Plastics Market Overview by Plastic Type ....................................... 224 Volume Analysis .................................................... 224
Chart 62: Global High Performance Plastics Market Analysis (2012-2022) by Plastic Type – Fluoropolymers, High Performance Polyamides, Sulfone Polymers, Polyphenylene Sulphide, Liquid Crystal Polymers, Polyetherimide and Polyetheretherketone in Metric Tons ............................... 224 Chart 63: Glance at 2012, 2017 and 2022 Global High Performance Plastics Volume Market Share (%) by Plastic Type – Fluoropolymers, High Performance Polyamides, Sulfone Polymers, Polyphenylene Sulphide, Liquid Crystal Polymers, Polyetherimide and Polyetheretherketone .. 224
Value Analysis ........................................................ 225 Chart 64: Global High Performance Plastics Market Analysis (2012-2022) by Plastic Type – Fluoropolymers, High Performance Polyamides, Sulfone Polymers, Polyphenylene Sulphide, Liquid Crystal Polymers, Polyetherimide and Polyetheretherketone in USD Million ............................... 225 Chart 65: Glance at 2012, 2017 and 2022 Global High Performance Plastics Value Market Share (%) by Plastic Type – Fluoropolymers, High Performance Polyamides, Sulfone Polymers, Polyphenylene Sulphide, Liquid Crystal Polymers, Polyetherimide and Polyetheretherketone .. 225
5.2.1 Fluoropolymers ............................................. 226 Chart 66: Global Fluoropolymers Market Analysis (2012-2022) in Volume (Metric Tons) and Value (USD Million) 226
5.2.1.1 Global Fluoropolymers Market Overview by Fluoropolymer Type .............................................. 227 Volume Analysis .................................................... 227
Chart 67: Global Fluoropolymers Market Analysis (2012-2022) by Fluoropolymer Type – PTFE, FEP, PVDF, ETFE, PFA, PVF, PCTFE and ECTFE in Metric Tons ................... 227 Chart 68: Glance at 2012, 2017 and 2022 Global Fluoropolymers Volume Market Share (%) by Fluoropolymer Type – PTFE, FEP, PVDF, ETFE, PFA, PVF, PCTFE and ECTFE .......................................................... 227
Value Analysis ........................................................ 228 Chart 69: Global Fluoropolymers Market Analysis (2012-2022) by Fluoropolymer Type – PTFE, FEP, PVDF, ETFE, PFA, PVF, PCTFE and ECTFE in USD Million ................... 228 Chart 70: Glance at 2012, 2017 and 2022 Global Fluoropolymers Value Market Share (%) by Fluoropolymer Type – PTFE, FEP, PVDF, ETFE, PFA, PVF, PCTFE and ECTFE ...................................................... 228
Page 7
High Performance Plastics – A Global Market Overview November 2016 |560 Pages | 642 Charts | Price $6300
Click here to buy the report
5.2.1.2 Global Fluoropolymers Market Overview by Geographic Region................................................. 229 Volume Analysis ..................................................... 229
Chart 71: Global Fluoropolymers Market Analysis (2012-2022) by Geographic Region – United States, Europe, Asia-Pacific and Rest of World in Metric Tons ............... 229 Chart 72: Glance at 2012, 2017 and 2022 Global Fluoropolymers Volume Market Share (%) by Geographic Region – United States, Europe, Asia-Pacific and Rest of World ............................................................................ 229
Value Analysis ........................................................ 230 Chart 73: Global Fluoropolymers Market Analysis (2012-2022) by Geographic Region – United States, Europe, Asia-Pacific and Rest of World in USD Million ................ 230 Chart 74: Glance at 2012, 2017 and 2022 Global Fluoropolymers Value Market Share (%) by Geographic Region – United States, Europe, Asia-Pacific and Rest of World ............................................................................ 230
5.2.1.3 Global Fluoropolymers Market Overview by End-use Sector ....................................................... 231 Volume Analysis ..................................................... 231
Chart 75: Global Fluoropolymers Market Analysis (2012-2022) by End-use Sector – Chemical Processing, Electrical & Electronics, Mechanical/Industrial, Automotive & Transportation, Building & Construction and Others in Metric Tons ................................................................... 231 Chart 76: Glance at 2012, 2017 and 2022 Global Fluoropolymers Volume Market Share (%) by End-use Sector – Chemical Processing, Electrical & Electronics, Mechanical/Industrial, Automotive & Transportation, Building & Construction and Others .............................. 231
Value Analysis ........................................................ 232 Chart 77: Global Fluoropolymers Market Analysis (2012-2022) by End-use Sector – Chemical Processing, Electrical & Electronics, Mechanical/Industrial, Automotive & Transportation, Building & Construction and Others in USD Million ........................................................................... 232 Chart 78: Glance at 2012, 2017 and 2022 Global Fluoropolymers Value Market Share (%) by End-use Sector – Chemical Processing, Electrical & Electronics, Mechanical/Industrial, Automotive & Transportation, Building & Construction and Others .............................. 232
5.2.2 High Performance Polyamides ...................... 233 Chart 79: Global High Performance Polyamides Market Analysis (2012-2022) in Volume (Metric Tons) and Value (USD Million) ................................................................. 233
5.2.2.1 Global High Performance Polyamides Market Overview by Polyamide Type ................................. 234 Volume Analysis ..................................................... 234
Chart 80: Global High Performance Polyamides Market Analysis (2012-2022) by Polyamide Type – Polyamide 11 & 12, Polyphthalamide/Polyamide 6T, Polyamide 46, Polyamide 9T and Polyarylamide/Polyamide MXD6 in Metric Tons ................................................................... 234 Chart 81: Glance at 2012, 2017 and 2022 Global High Performance Polyamides Volume Market Share (%) by Polyamide Type – Polyamide 11 & 12, Polyphthalamide/Polyamide 6T, Polyamide 46, Polyamide 9T and Polyarylamide/Polyamide MXD6 ....................... 234
Value Analysis ........................................................ 235 Chart 82: Global High Performance Polyamides Market Analysis (2012-2022) by Polyamide Type – Polyamide 11 & 12, Polyphthalamide/Polyamide 6T, Polyamide 46, Polyamide 9T and Polyarylamide/Polyamide MXD6 in USD Million ........................................................................... 235 Chart 83: Glance at 2012, 2017 and 2022 Global High Performance Polyamides Value Market Share (%) by Polyamide Type – Polyamide 11 & 12, Polyphthalamide/Polyamide 6T, Polyamide 46, Polyamide 9T and Polyarylamide/Polyamide MXD6 ....................... 235
5.2.2.2 Global High Performance Polyamides Market Overview by Geographic Region ............................ 236 Volume Analysis ..................................................... 236
Chart 84: Global High Performance Polyamides Market Analysis (2012-2022) by Geographic Region – United States, Europe, Asia-Pacific and Rest of World in Metric Tons............................................................................... 236
Chart 85: Glance at 2012, 2017 and 2022 Global High Performance Polyamides Volume Market Share (%) by Geographic Region – United States, Europe, Asia-Pacific and Rest of World ......................................................... 236
Value Analysis ........................................................ 237 Chart 86: Global High Performance Polyamides Market Analysis (2012-2022) by Geographic Region – United States, Europe, Asia-Pacific and Rest of World in USD Million ......... 237 Chart 87: Glance at 2012, 2017 and 2022 Global High Performance Polyamides Value Market Share (%) by Geographic Region – United States, Europe, Asia-Pacific and Rest of World ......................................................... 237
5.2.2.3 Global High Performance Polyamides Market Overview by End-use Sector .................................. 238 Volume Analysis..................................................... 238
Chart 88: Global High Performance Polyamides Market Analysis (2012-2022) by End-Use Sector – Automotive, Electrical & Electronics, Mechanical/Industrial and Other in Metric Tons ............................................................... 238 Chart 89: Glance at 2012, 2017 and 2022 Global High Performance Polyamides Volume Market Share (%) by End-Use Sector – Automotive, Electrical & Electronics, Mechanical/Industrial and Other .................................. 238
Value Analysis ........................................................ 239 Chart 90: Global High Performance Polyamides Market Analysis (2012-2022) by End-Use Sector – Automotive, Electrical & Electronics, Mechanical/Industrial and Other in USD Million ............................................................... 239 Chart 91: Glance at 2012, 2017 and 2022 Global High Performance Polyamides Value Market Share (%) by End-Use Sector – Automotive, Electrical & Electronics, Mechanical/Industrial and Other .................................. 239
5.2.3 Sulfone Polymers .......................................... 240 Chart 92: Global Sulfone Polymers Market Analysis (2012-2022) in Volume (Metric Tons) and Value (USD Million) 240
5.2.3.1 Global Sulfone Polymers Market Overview by Polymer Type ......................................................... 241 Volume Analysis..................................................... 241
Chart 93: Global Sulfone Polymers Market Analysis (2012-2022) by Polymer Type – Polysulfone (PSU), Polyphenylsulfone (PPSU) and Polyethersulfone (PESU) in Metric Tons ............ 241 Chart 94: Glance at 2012, 2017 and 2022 Global Sulfone Polymers Volume Market Share (%) by Polymer Type – Polysulfone (PSU), Polyphenylsulfone (PPSU) and Polyethersulfone (PESU) .............................................. 241
Value Analysis ........................................................ 242 Chart 95: Global Sulfone Polymers Market Analysis (2012-2022) by Polymer Type – Polysulfone (PSU), Polyphenylsulfone (PPSU) and Polyethersulfone (PESU) in USD Million ............. 242 Chart 96: Glance at 2012, 2017 and 2022 Global Sulfone Polymers Value Market Share (%) by Polymer Type – Polysulfone (PSU), Polyphenylsulfone (PPSU) and Polyethersulfone (PESU) ............................................... 242
5.2.3.2 Global Sulfone Polymers Market Overview by Geographic Region ................................................ 243 Volume Analysis..................................................... 243
Chart 97: Global Sulfone Polymers Market Analysis (2012-2022) by Geographic Region – United States, Europe, Asia-Pacific and Rest of World in Metric Tons ............... 243 Chart 98: Glance at 2012, 2017 and 2022 Global Sulfone Polymers Volume Market Share (%) by Geographic Region – United States, Europe, Asia-Pacific and Rest of World 243
Value Analysis ........................................................ 244 Chart 99: Global Sulfone Polymers Market Analysis (2012-2022) by Geographic Region – United States, Europe, Asia-Pacific and Rest of World in USD Million ............... 244 Chart 100: Glance at 2012, 2017 and 2022 Global Sulfone Polymers Value Market Share (%) by Geographic Region – United States, Europe, Asia-Pacific and Rest of World .. 244
5.2.3.3 Global Sulfone Polymers Market Overview by End-use Sector ....................................................... 245 Volume Analysis..................................................... 245
Chart 101: Global Sulfone Polymers Market Analysis (2012-2022) by End-Use Sector – Aerospace & Military, Automotive, Building & Construction, Electrical & Electronics, Food & Household, Mechanical/Industrial, Medical & Healthcare and Others in Metric Tons ......... 245
Chart 102: Glance at 2012, 2017 and 2022 Global Sulfone Polymers Volume Market Share (%) by End-Use Sector – Aerospace & Military, Automotive, Building & Construction, Electrical & Electronics, Food & Household, Mechanical/Industrial, Medical & Healthcare and Others 245
Value Analysis ........................................................ 246 Chart 103: Global Sulfone Polymers Market Analysis (2012-2022) by End-Use Sector – Aerospace & Military, Automotive, Building & Construction, Electrical & Electronics, Food & Household, Mechanical/Industrial, Medical & Healthcare and Others in USD Million ......... 246 Chart 104: Glance at 2012, 2017 and 2022 Global Sulfone Polymers Value Market Share (%) by End-Use Sector – Aerospace & Military, Automotive, Building & Construction, Electrical & Electronics, Food & Household, Mechanical/Industrial, Medical & Healthcare and Others 246
5.2.4 Polyphenylene Sulphide (PPS) ...................... 247 Chart 105: Global Polyphenylene Sulfide (PPS) Market Analysis (2012-2022) in Volume (Metric Tons) and Value (USD Million) ................................................................ 247
5.2.4.1 Global Polyphenylene Sulphide (PPS) Market Overview by Geographic Region ............................ 248 Volume Analysis .................................................... 248
Chart 106: Global Polyphenylene Sulphide (PPS) Market Analysis (2012-2022) by Geographic Region – United States, Europe, Asia-Pacific and Rest of World in Metric Tons ..... 248 Chart 107: Glance at 2012, 2017 and 2022 Global Polyphenylene Sulphide (PPS) Volume Market Share (%) by Geographic Region – United States, Europe, Asia-Pacific and Rest of World ......................................................... 248
Value Analysis ........................................................ 249 Chart 108: Global Polyphenylene Sulphide (PPS) Market Analysis (2012-2022) by Geographic Region – United States, Europe, Asia-Pacific and Rest of World in USD Million ..... 249 Chart 109: Glance at 2012, 2017 and 2022 Global Polyphenylene Sulphide (PPS) Value Market Share (%) by Geographic Region – United States, Europe, Asia-Pacific and Rest of World ......................................................... 249
5.2.4.2 Global Polyphenylene Sulphide (PPS) Market Overview by End-use Sector .................................. 250 Volume Analysis .................................................... 250
Chart 110: Global Polyphenylene Sulphide (PPS) Market Analysis (2012-2022) by End-use Sector – Automotive, Electrical & Electronics, Mechanical/Industrial and Other in Metric Tons .............................................................. 250 Chart 111: Glance at 2012, 2017 and 2022 Global Polyphenylene Sulphide (PPS) Volume Market Share (%) by End-use Sector – Automotive, Electrical & Electronics, Mechanical/Industrial and Other .................................. 250
Value Analysis ........................................................ 251 Chart 112: Global Polyphenylene Sulphide (PPS) Market Analysis (2012-2022) by End-use Sector – Automotive, Electrical & Electronics, Mechanical/Industrial and Other in USD Million ............................................................... 251 Chart 113: Glance at 2012, 2017 and 2022 Global Polyphenylene Sulphide (PPS) Value Market Share (%) by End-use Sector – Automotive, Electrical & Electronics, Mechanical/Industrial and Other .................................. 251
5.2.5 Liquid Crystal Polymers (LCP) ........................ 252 Chart 114: Global Liquid Crystal Polymers (LCP) Market Analysis (2012-2022) in Volume (Metric Tons) and Value (USD Million) ................................................................ 252
5.2.5.1 Global Liquid Crystal Polymers (LCP) Market Overview by Geographic Region ............................ 253 Volume Analysis .................................................... 253
Chart 115: Global Liquid Crystal Polymers (LCP) Market Analysis (2012-2022) by Geographic Region – United States, Europe, Asia-Pacific and Rest of World in Metric Tons ..... 253 Chart 116: Glance at 2012, 2017 and 2022 Global Liquid Crystal Polymers (LCP) Volume Market Share (%) by Geographic Region – United States, Europe, Asia-Pacific and Rest of World ......................................................... 253
Value Analysis ........................................................ 254 Chart 117: Global Liquid Crystal Polymers (LCP) Market Analysis (2012-2022) by Geographic Region – United States, Europe, Asia-Pacific and Rest of World in USD Million .......................................................................... 254
Page 8
High Performance Plastics – A Global Market Overview November 2016 |560 Pages | 642 Charts | Price $6300
Click here to buy the report
Chart 118: Glance at 2012, 2017 and 2022 Global Liquid Crystal Polymers (LCP) Value Market Share (%) by Geographic Region – United States, Europe, Asia-Pacific and Rest of World.......................................................... 254
5.2.5.2 Global Liquid Crystal Polymers (LCP) Market Overview by End-use Sector .................................. 255 Volume Analysis ..................................................... 255
Chart 119: Global Liquid Crystal Polymers (LCP) Market Analysis (2012-2022) by End-use Sector – Automotive, Electrical & Electronics, Mechanical/Industrial and Others in Metric Tons ............................................................... 255 Chart 120: Glance at 2012, 2017 and 2022 Global Liquid Crystal Polymers (LCP) Volume Market Share (%) by End-use Sector – Automotive, Electrical & Electronics, Mechanical/Industrial and Others ................................. 255
Value Analysis ........................................................ 256 Chart 121: Global Liquid Crystal Polymers (LCP) Market Analysis (2012-2022) by End-use Sector – Automotive, Electrical & Electronics, Mechanical/Industrial and Others in USD Million .. 256 Chart 122: Glance at 2012, 2017 and 2022 Global Liquid Crystal Polymers (LCP) Value Market Share (%) by End-use Sector – Automotive, Electrical & Electronics, Mechanical/Industrial and Others ................................. 256
5.2.6 Polyetherimide (PEI) ..................................... 257 Chart 123: Global Polyetherimide (PEI) Market Analysis (2012-2022) in Volume (Metric Tons) and Value (USD Million) .......................................................................... 257
5.2.6.1 Global Polyetherimide (PEI) Market Overview by Geographic Region ............................................ 258 Volume Analysis ..................................................... 258
Chart 124: Global Polyetherimide (PEI) Market Analysis (2012-2022) by Geographic Region – United States, Europe, Asia-Pacific and Rest of World in Metric Tons .. 258 Chart 125: Glance at 2012, 2017 and 2022 Global Polyetherimide (PEI) Volume Market Share (%) by Geographic Region – United States, Europe, Asia-Pacific and Rest of World.......................................................... 258
Value Analysis ........................................................ 259 Chart 126: Global Polyetherimide (PEI) Market Analysis (2012-2022) by Geographic Region – United States, Europe, Asia-Pacific and Rest of World in USD Million .. 259 Chart 127: Glance at 2012, 2017 and 2022 Global Polyetherimide (PEI) Value Market Share (%) by Geographic Region – United States, Europe, Asia-Pacific and Rest of World.......................................................... 259
5.2.6.2 Global Polyetherimide (PEI) Market Overview by End-use Sector .................................................. 260 Volume Analysis ..................................................... 260
Chart 128: Global Polyetherimide (PEI) Market Analysis (2012-2022) by End-use Sector – Automotive, Electrical & Electronics, Mechanical/Industrial, Consumer Goods, Aerospace & Military and Others in Metric Tons ........... 260 Chart 129: Glance at 2012, 2017 and 2022 Global Polyetherimide (PEI) Volume Market Share (%) by End-use Sector – Automotive, Electrical & Electronics, Mechanical/Industrial, Consumer Goods, Aerospace & Military and Others ....................................................... 260
Value Analysis ........................................................ 261 Chart 130: Global Polyetherimide (PEI) Market Analysis (2012-2022) by End-use Sector – Automotive, Electrical & Electronics, Mechanical/Industrial, Consumer Goods, Aerospace & Military and Others in USD Million ........... 261 Chart 131: Glance at 2012, 2017 and 2022 Global Polyetherimide (PEI) Value Market Share (%) by End-use Sector – Automotive, Electrical & Electronics, Mechanical/Industrial, Consumer Goods, Aerospace & Military and Others ....................................................... 261
5.2.7 Polyetheretherketone (PEEK) ....................... 262 Chart 132: Global Polyetheretherketone (PEEK) Market Analysis (2012-2022) in Volume (Metric Tons) and Value (USD Million) ................................................................. 262
5.2.7.1 Global Polyetheretherketone (PEEK) Market Overview by Geographic Region ............................ 263 Volume Analysis ..................................................... 263
Chart 133: Global Polyetheretherketone (PEEK) Market Analysis (2012-2022) by Geographic Region – United States, Europe, Asia-Pacific and Rest of World in Metric Tons ..... 263
Chart 134: Glance at 2012, 2017 and 2022 Global Polyetheretherketone (PEEK) Volume Market Share (%) by Geographic Region – United States, Europe, Asia-Pacific and Rest of World ......................................................... 263
Value Analysis ........................................................ 264 Chart 135: Global Polyetheretherketone (PEEK) Market Analysis (2012-2022) by Geographic Region – United States, Europe, Asia-Pacific and Rest of World in USD Million ........................................................................... 264 Chart 136: Glance at 2012, 2017 and 2022 Global Polyetheretherketone (PEEK) Value Market Share (%) by Geographic Region – United States, Europe, Asia-Pacific and Rest of World ......................................................... 264
5.2.7.2 Global Polyetheretherketone (PEEK) Market Overview by End-use Sector .................................. 265 Volume Analysis..................................................... 265
Chart 137: Global Polyetheretherketone (PEEK) Market Analysis (2012-2022) by End-use Sector – Automotive, Electrical & Electronics, Mechanical/Industrial, Medical & Healthcare, Aerospace & Military and Others in Metric Tons .............................................................................. 265 Chart 138: Glance at 2012, 2017 and 2022 Global Polyetheretherketone (PEEK) Volume Market Share (%) by End-use Sector – Automotive, Electrical & Electronics, Mechanical/Industrial, Medical & Healthcare, Aerospace & Military and Others ....................................................... 265
Value Analysis ........................................................ 266 Chart 139: Global Polyetheretherketone (PEEK) Market Analysis (2012-2022) by End-use Sector – Automotive, Electrical & Electronics, Mechanical/Industrial, Medical & Healthcare, Aerospace & Military and Others in USD Million ........................................................................... 266 Chart 140: Glance at 2012, 2017 and 2022 Global Polyetheretherketone (PEEK) Value Market Share (%) by End-use Sector – Automotive, Electrical & Electronics, Mechanical/Industrial, Medical & Healthcare, Aerospace & Military and Others ....................................................... 266
PART B: REGIONAL MARKET PERSPECTIVE .. 267 Global High Performance Plastics Market Overview by Geographic Region ................................................ 267 Volume Analysis..................................................... 267
Chart 141: Global High Performance Plastics Market Analysis (2012-2022) by Geographic Region - United States, Europe, Asia-Pacific and Rest of World in Metric Tons .............................................................................. 267 Chart 142: Glance at 2012, 2017 and 2022 Global High Performance Plastics Volume Market Share (%) by Global Region - United States, Europe, Asia-Pacific and Rest of World ............................................................................ 267
Value Analysis ........................................................ 268 Chart 143: Global High Performance Plastics Market Analysis (2012-2022) by Global Region - United States, Europe, Asia-Pacific and Rest of World in USD Million .. 268 Chart 144: Glance at 2012, 2017 and 2022 Global High Performance Plastics Value Market Share (%) by Global Region - United States, Europe, Asia-Pacific and Rest of World ............................................................................ 268
REGIONAL MARKET OVERVIEW ........................... 269
1. THE UNITED STATES ........................................ 269 Chart 145: United States High Performance Plastics Market Analysis (2012-2022) in Volume (Metric Tons) and Value (USD Million) ....................................................... 269
1.1 United States High Performance Plastics Market Overview by End-use Sector .................................. 270 Volume Analysis..................................................... 270
Chart 146: United States High Performance Plastics Market Analysis (2012-2022) by End-use Sector - Automotive & Transportation, Building & Construction, Consumer Goods, Electrical & Electronics, Mechanical/Industrial and Other in Metric Tons ........... 270 Chart 147: Glance at 2012, 2017 and 2022 United States High Performance Plastics Volume Market Share (%) by End-use Sector - Automotive & Transportation, Building & Construction, Consumer Goods, Electrical & Electronics, Mechanical/Industrial and Other .................................. 270
Value Analysis ........................................................ 271 Chart 148: United States High Performance Plastics Market Analysis (2012-2022) by End-use Sector - Automotive & Transportation, Building & Construction, Consumer Goods, Electrical & Electronics, Mechanical/Industrial and Other in USD Million .......... 271 Chart 149: Glance at 2012, 2017 and 2022 United States High Performance Plastics Value Market Share (%) by End-use Sector - Automotive & Transportation, Building & Construction, Consumer Goods, Electrical & Electronics, Mechanical/Industrial and Other .................................. 271
1.2 United States High Performance Plastics Market Overview by Plastic Type ....................................... 272 Volume Analysis .................................................... 272
Chart 150: United States High Performance Plastics Market Analysis (2012-2022) by Plastic Type - Fluoropolymers, High Performance Polyamides, Sulfone Polymers, Polyphenylene Sulphide, Liquid Crystal Polymers, Polyetherimide and Polyetheretherketone in Metric Tons .................................................................. 272 Chart 151: Glance at 2012, 2017 and 2022 United States High Performance Plastics Volume Market Share (%) by Plastic Type - Fluoropolymers, High Performance Polyamides, Sulfone Polymers, Polyphenylene Sulphide, Liquid Crystal Polymers, Polyetherimide and Polyetheretherketone .................................................. 272
Value Analysis ........................................................ 273 Chart 152: United States High Performance Plastics Market Analysis (2012-2022) by Plastic Type - Fluoropolymers, High Performance Polyamides, Sulfone Polymers, Polyphenylene Sulphide, Liquid Crystal Polymers, Polyetherimide and Polyetheretherketone in USD Million ................................................................... 273 Chart 153: Glance at 2012, 2017 and 2022 United States High Performance Plastics Value Market Share (%) by Plastic Type - Fluoropolymers, High Performance Polyamides, Sulfone Polymers, Polyphenylene Sulphide, Liquid Crystal Polymers, Polyetherimide and Polyetheretherketone .................................................. 273
1.2.1 Fluoropolymers ............................................. 274 Chart 154: United States Fluoropolymers Market Analysis (2012-2022) in Volume (Metric Tons) and Value (USD Million) ......................................................................... 274
1.2.1.1 United States Fluoropolymers Market Overview by End-use Sector .................................. 275 Volume Analysis .................................................... 275
Chart 155: United States Fluoropolymers Market Analysis (2012-2022) by End-use Sector - Chemical Processing, Electricals & Electronics, Mechanical/Industrial, Automotive & Transportation, Building & Construction and Others in Metric Tons ............................................ 275 Chart 156: Glance at 2012, 2017 and 2022 United States Fluoropolymers Volume Market Share (%) by End-use Sector - Chemical Processing, Electricals & Electronics, Mechanical/Industrial, Automotive & Transportation, Building & Construction and Others ............................. 275
Value Analysis ........................................................ 276 Chart 157: United States Fluoropolymers Market Analysis (2012-2022) by End-use Sector - Chemical Processing, Electricals & Electronics, Mechanical/Industrial, Automotive & Transportation, Building & Construction and Others in USD Million ............................................ 276 Chart 158: Glance at 2012, 2017 and 2022 United States Fluoropolymers Value Market Share (%) by End-use Sector - Chemical Processing, Electricals & Electronics, Mechanical/Industrial, Automotive & Transportation, Building & Construction and Others ............................. 276
1.2.1.2 United States Fluoropolymers Market Overview by Fluoropolymer Type .......................... 277 Volume Analysis .................................................... 277
Chart 159: United States Fluoropolymers Market Analysis (2012-2022) by Fluoropolymer Type - PTFE, FEP, PVDF, ETFE, PFA, PVF, PCTFE and ECTFE in Metric Tons .......... 277 Chart 160: Glance at 2012, 2017 and 2022 United States Fluoropolymers Volume Market Share (%) by Fluoropolymer Type - PTFE, FEP, PVDF, ETFE, PFA, PVF, PCTFE and ECTFE .......................................................... 277
Page 9
High Performance Plastics – A Global Market Overview November 2016 |560 Pages | 642 Charts | Price $6300
Click here to buy the report
Value Analysis ........................................................ 278 Chart 161: United States Fluoropolymers Market Analysis (2012-2022) by Fluoropolymer Type - PTFE, FEP, PVDF, ETFE, PFA, PVF, PCTFE and ECTFE in USD Million ........... 278 Chart 162: Glance at 2012, 2017 and 2022 United States Fluoropolymers Value Market Share (%) by Fluoropolymer Type - PTFE, FEP, PVDF, ETFE, PFA, PVF, PCTFE and ECTFE278
1.2.2 High Performance Polyamides ...................... 279 Chart 163: United States High Performance Polyamides Market Analysis (2012-2022) in Volume (Metric Tons) and Value (USD Million) ....................................................... 279
1.2.2.1 United States High Performance Polyamides Market Overview by End-Use Sector ..................... 280 Volume Analysis ..................................................... 280
Chart 164: United States High Performance Polyamides Market Analysis (2012-2022) by End-Use Sector - Automotive, Electrical & Electronics, Mechanical/Industrial and Other in Metric Tons ........... 280 Chart 165: Glance at 2012, 2017 and 2022 United States High Performance Polyamides Volume Market Share (%) by End-Use Sector - Automotive, Electrical & Electronics, Mechanical/Industrial and Other................................... 280
Value Analysis ........................................................ 281 Chart 166: United States High Performance Polyamides Market Analysis (2012-2022) by End-Use Sector - Automotive, Electrical & Electronics, Mechanical/Industrial and Other in USD Million ........... 281 Chart 167: Glance at 2012, 2017 and 2022 United States High Performance Polyamides Value Market Share (%) by End-Use Sector - Automotive, Electrical & Electronics, Mechanical/Industrial and Other................................... 281
1.2.2.2 United States High Performance Polyamides Market Overview by Polyamide Type .................... 282 Volume Analysis ..................................................... 282
Chart 168: United States High Performance Polyamides Market Analysis (2012-2022) by Polyamide Type - Polyamide 11 & 12, Polyphthalamide/Polyamide 6T, Polyamide 46, Polyamide 9T and Polyarylamide/Polyamide MXD6 in Metric Tons ..................................................... 282 Chart 169: Glance at 2012, 2017 and 2022 United States High Performance Polyamides Volume Market Share (%) by Polyamide Type - Polyamide 11 & 12, Polyphthalamide/Polyamide 6T, Polyamide 46, Polyamide 9T and Polyarylamide/Polyamide MXD6 ....................... 282
Value Analysis ........................................................ 283 Chart 170: United States High Performance Polyamides Market Analysis (2012-2022) by Polyamide Type - Polyamide 11 & 12, Polyphthalamide/Polyamide 6T, Polyamide 46, Polyamide 9T and Polyarylamide/Polyamide MXD6 in USD Million ..................................................... 283 Chart 171: Glance at 2012, 2017 and 2022 United States High Performance Polyamides Value Market Share (%) by Polyamide Type - Polyamide 11 & 12, Polyphthalamide/Polyamide 6T, Polyamide 46, Polyamide 9T and Polyarylamide/Polyamide MXD6 ....................... 283
1.2.3 Sulfone Polymers .......................................... 284 Chart 172: United States Sulfone Polymers Market Analysis (2012-2022) in Volume (Metric Tons) and Value (USD Million) ................................................................. 284
1.2.3.1 United States Sulfone Polymers Market Overview by End-Use Sector .................................. 285 Volume Analysis ..................................................... 285
Chart 173: United States Sulfone Polymers Market Analysis (2012-2022) by End-Use Sector – Aerospace & Military, Automotive, Building & Construction, Electrical & Electronics, Food & Household, Mechanical/Industrial, Medical & Healthcare and Others in Metric Tons .......... 285 Chart 174: Glance at 2012, 2017 and 2022 United States Sulfone Polymers Volume Market Share (%) by End-Use Sector – Aerospace & Military, Automotive, Building & Construction, Electrical & Electronics, Food & Household, Mechanical/Industrial, Medical & Healthcare and Others .... 285
Value Analysis ........................................................ 286 Chart 175: United States Sulfone Polymers Market Analysis (2012-2022) by End-Use Sector – Aerospace & Military, Automotive, Building & Construction, Electrical & Electronics, Food & Household, Mechanical/Industrial, Medical & Healthcare and Others in USD Million .......... 286
Chart 176: Glance at 2012, 2017 and 2022 United States Sulfone Polymers Value Market Share (%) by End-Use Sector – Aerospace & Military, Automotive, Building & Construction, Electrical & Electronics, Food & Household, Mechanical/Industrial, Medical & Healthcare and Others .... 286
1.2.3.2 United States Sulfone Polymers Market Overview by Polymer Type .................................... 287 Volume Analysis..................................................... 287
Chart 177: United States Sulfone Polymers Market Analysis (2012-2022) by Polymer Type – Polysulfone (PSU), Polyphenylsulfone (PPSU) and Polyethersulfone (PESU) in Metric Tons ................................................................... 287 Chart 178: Glance at 2012, 2017 and 2022 United States Sulfone Polymers Volume Market Share (%) by Polymer Type – Polysulfone (PSU), Polyphenylsulfone (PPSU) and Polyethersulfone (PESU) ............................................... 287
Value Analysis ........................................................ 288 Chart 179: United States Sulfone Polymers Market Analysis (2012-2022) by Polymer Type – Polysulfone (PSU), Polyphenylsulfone (PPSU) and Polyethersulfone (PESU) in USD Million ................................................................... 288 Chart 180: Glance at 2012, 2017 and 2022 United States Sulfone Polymers Value Market Share (%) by Polymer Type – Polysulfone (PSU), Polyphenylsulfone (PPSU) and Polyethersulfone (PESU) ............................................... 288
1.2.4 Polyphenylene Sulphide................................ 289 Chart 181: United States Polyphenylene Sulphide (PPS) Market Analysis (2012-2022) in Volume (Metric Tons) and Value (USD Million) ....................................................... 289
1.2.4.1 United States Polyphenylene Sulphide (PPS) Market Overview by End-use Sector ..................... 290 Volume Analysis..................................................... 290
Chart 182: United States Polyphenylene Sulfide (PPS) Market Analysis (2012-2022) by End-use Application – Automotive, Electricals & Electronics, Mechanical/Industrial and Other Applications in Metric Tons .............................................................................. 290 Chart 183: Glance at 2012, 2017 and 2022 United States Polyphenylene Sulfide (PPS) Volume Market Share (%) by End-use Application – Automotive, Electricals & Electronics, Mechanical/Industrial and Other Applications ................. 290
Value Analysis ........................................................ 291 Chart 184: United States Polyphenylene Sulfide (PPS) Market Analysis (2012-2022) by End-use Application – Automotive, Electricals & Electronics, Mechanical/Industrial and Other Applications in USD Million ............................................... 291 Chart 185: Glance at 2012, 2017 and 2022 United States Polyphenylene Sulfide (PPS) Value Market Share (%) by End-use Application – Automotive, Electricals & Electronics, Mechanical/Industrial and Other Applications ................. 291
1.2.5 Liquid Crystal Polymers ................................. 292 Chart 186: United States Liquid Crystal Polymers (LCP) Market Analysis (2012-2022) in Volume (Metric Tons) and Value (USD Million) ....................................................... 292
1.2.5.1 United States Liquid Crystal Polymers (LCP) Market Overview by End-use Sector ..................... 293 Volume Analysis..................................................... 293
Chart 187: United States Liquid Crystal Polymers (LCP) Market Analysis (2012-2022) by End-use Sector – Electrical & Electronics, Automotive, Industrial and Others in Metric Tons .............................................................................. 293 Chart 188: Glance at 2012, 2017 and 2022 United States Liquid Crystal Polymers (LCP) Volume Market Share (%) by End-use Sector – Electrical & Electronics, Automotive, Industrial and Others .................................................... 293
Value Analysis ........................................................ 294 Chart 189: United States Liquid Crystal Polymers (LCP) Market Analysis (2012-2022) by End-use Sector – Electrical & Electronics, Automotive, Industrial and Others in USD Million ........................................................................... 294 Chart 190: Glance at 2012, 2017 and 2022 United States Liquid Crystal Polymers (LCP) Value Market Share (%) by End-use Sector – Electrical & Electronics, Automotive, Industrial and Others .................................................... 294
1.2.6 Polyetherimide ............................................. 295 Chart 191: United States Polyetherimide (PEI) Market Analysis (2012-2022) in Volume (Metric Tons) and Value (USD Million) ................................................................. 295
1.2.6.1 United States Polyetherimide (PEI) Market Overview by End-use Sector .................................. 296 Volume Analysis .................................................... 296
Chart 192: United States Polyetherimide (PEI) Market Analysis (2012-2022) by End-use Sector - Automotive, Electrical & Electronics, Mechanical/Industrial, Consumer Goods, Aerospace & Military and Others in Metric Tons ............................................................. 296 Chart 193: Glance at 2012, 2017 and 2022 United States Polyetherimide (PEI) Volume Market Share (%) by End-use Sector - Automotive, Electrical & Electronics, Mechanical/Industrial, Consumer Goods, Aerospace & Military and Others ...................................................... 296
Value Analysis ........................................................ 297 Chart 194: United States Polyetherimide (PEI) Market Analysis (2012-2022) by End-use Sector - Automotive, Electrical & Electronics, Mechanical/Industrial, Consumer Goods, Aerospace & Military and Others in USD Million .............................................................. 297 Chart 195: Glance at 2012, 2017 and 2022 United States Polyetherimide (PEI) Value Market Share (%) by End-use Sector - Automotive, Electrical & Electronics, Mechanical/Industrial, Consumer Goods, Aerospace & Military and Others ...................................................... 297
1.2.7 Polyetheretherketone ................................... 298 Chart 196: United States Polyetheretherketone (PEEK) Market Analysis (2012-2022) in Volume (Metric Tons) and Value (USD Million) ...................................................... 298
1.2.7.1 United States Polyetheretherketone (PEEK) Market Overview by End-use Sector ..................... 299 Volume Analysis .................................................... 299
Chart 197: United States Polyetheretherketone (PEEK) Market Analysis (2012-2022) by End-use Sector - Automotive, Electrical & Electronics, Mechanical/Industrial, Medical & Healthcare, Aerospace & Military and Others in Metric Tons ............................... 299 Chart 198: Glance at 2012, 2017 and 2022 United States Polyetheretherketone (PEEK) Volume Market Share (%) by End-use Sector - Automotive, Electrical & Electronics, Mechanical/Industrial, Medical & Healthcare, Aerospace & Military and Others ...................................................... 299
Value Analysis ........................................................ 300 Chart 199: United States Polyetheretherketone (PEEK) Market Analysis (2012-2022) by End-use Sector - Automotive, Electrical & Electronics, Mechanical/Industrial, Medical & Healthcare, Aerospace & Military and Others in USD Million ............................... 300 Chart 200: Glance at 2012, 2017 and 2022 United States Polyetheretherketone (PEEK) Value Market Share (%) by End-use Sector - Automotive, Electrical & Electronics, Mechanical/Industrial, Medical & Healthcare, Aerospace & Military and Others ...................................................... 300
2. EUROPE .......................................................... 301 Chart 201: European High Performance Plastics Market Analysis (2012-2022) in Volume (Metric Tons) and Value (USD Million) ................................................................ 301
2.1 European High Performance Plastics Market Overview by Geographic Region ............................ 302 Volume Analysis .................................................... 302
Chart 202: European High Performance Plastics Market Analysis (2012-2022) by Geographic Region - France, Germany, Italy, The United Kingdom and Rest of Europe in Metric Tons .................................................................. 302 Chart 203: Glance at 2012, 2017 and 2022 European High Performance Plastics Volume Market Share (%) by Geographic Region - France, Germany, Italy, The United Kingdom and Rest of Europe ........................................ 302
Value Analysis ........................................................ 303 Chart 204: European High Performance Plastics Market Analysis (2012-2022) by Geographic Region - France, Germany, Italy, The United Kingdom and Rest of Europe in USD Million ................................................................... 303 Chart 205: Glance at 2012, 2017 and 2022 European High Performance Plastics Value Market Share (%) by Geographic Region - France, Germany, Italy, The United Kingdom and Rest of Europe ........................................ 303
Page 10
High Performance Plastics – A Global Market Overview November 2016 |560 Pages | 642 Charts | Price $6300
Click here to buy the report
2.2 European High Performance Plastics Market Overview by End-use Sector .................................. 304 Volume Analysis ..................................................... 304
Chart 206: European High Performance Plastics Market Analysis (2012-2022) by End-use Sector - Automotive & Transportation, Building & Construction, Consumer Goods, Electrical & Electronics, Mechanical/Industrial and Other in Metric Tons ..................................................... 304 Chart 207: Glance at 2012, 2017 and 2022 European High Performance Plastics Volume Market Share (%) by End-use Sector - Automotive & Transportation, Building & Construction, Consumer Goods, Electrical & Electronics, Mechanical/Industrial and Other................................... 304
Value Analysis ........................................................ 305 Chart 208: European High Performance Plastics Market Analysis (2012-2022) by End-use Sector - Automotive & Transportation, Building & Construction, Consumer Goods, Electrical & Electronics, Mechanical/Industrial and Other in USD Million ...................................................... 305 Chart 209: Glance at 2012, 2017 and 2022 European High Performance Plastics Value Market Share (%) by End-use Sector - Automotive & Transportation, Building & Construction, Consumer Goods, Electrical & Electronics, Mechanical/Industrial and Other................................... 305
2.3 European High Performance Plastics Market Overview by Plastic Type ....................................... 306 Volume Analysis ..................................................... 306
Chart 210: European High Performance Plastics Market Analysis (2012-2022) by Plastic Type - Fluoropolymers, High Performance Polyamides, Sulfone Polymers, Polyphenylene Sulphide, Liquid Crystal Polymers, Polyetherimide and Polyetheretherketone in Metric Tons ......................................................................... 306 Chart 211: Glance at 2012, 2017 and 2022 European High Performance Plastics Volume Market Share (%) by Plastic Type - Fluoropolymers, High Performance Polyamides, Sulfone Polymers, Polyphenylene Sulphide, Liquid Crystal Polymers, Polyetherimide and Polyetheretherketone ... 306
Value Analysis ........................................................ 307 Chart 212: European High Performance Plastics Market Analysis (2012-2022) by Plastic Type - Fluoropolymers, High Performance Polyamides, Sulfone Polymers, Polyphenylene Sulphide, Liquid Crystal Polymers, Polyetherimide and Polyetheretherketone in USD Million ...................................................................... 307 Chart 213: Glance at 2012, 2017 and 2022 European High Performance Plastics Value Market Share (%) by Plastic Type - Fluoropolymers, High Performance Polyamides, Sulfone Polymers, Polyphenylene Sulphide, Liquid Crystal Polymers, Polyetherimide and Polyetheretherketone ... 307
2.3.1 Fluoropolymers ............................................. 308 Chart 214: European Fluoropolymers Market Analysis (2012-2022) in Volume (Metric Tons) and Value (USD Million) .......................................................................... 308
2.3.1.1 European Fluoropolymers Market Overview by Geographic Region ............................................ 309 Volume Analysis ..................................................... 309
Chart 215: European Fluoropolymers Market Analysis (2012-2022) by Geographic Region - France, Germany, Italy, The United Kingdom and Rest of Europe in Metric Tons............................................................................... 309 Chart 216: Glance at 2012, 2017 and 2022 European Fluoropolymers Volume Market Share (%) by Geographic Region - France, Germany, Italy, The United Kingdom and Rest of Europe ............................................................... 309
Value Analysis ........................................................ 310 Chart 217: European Fluoropolymers Market Analysis (2012-2022) by Geographic Region - France, Germany, Italy, The United Kingdom and Rest of Europe in USD Million ........................................................................... 310 Chart 218: Glance at 2012, 2017 and 2022 European Fluoropolymers Value Market Share (%) by Geographic Region - France, Germany, Italy, The United Kingdom and Rest of Europe ............................................................... 310
2.3.1.2 European Fluoropolymers Market Overview by End-use Sector .................................................. 311 Volume Analysis ..................................................... 311
Chart 219: European Fluoropolymers Market Analysis (2012-2022) by End-use Sector - Chemical Processing, Electricals & Electronics, Mechanical/Industrial, Automotive & Transportation, Building & Construction and Others in Metric Tons ............................................ 311 Chart 220: Glance at 2012, 2017 and 2022 European Fluoropolymers Volume Market Share (%) by End-use Sector - Chemical Processing, Electricals & Electronics, Mechanical/Industrial, Automotive & Transportation, Building & Construction and Others .............................. 311
Value Analysis ........................................................ 312 Chart 221: European Fluoropolymers Market Analysis (2012-2022) by End-use Sector - Chemical Processing, Electricals & Electronics, Mechanical/Industrial, Automotive & Transportation, Building & Construction and Others in USD Million ............................................. 312 Chart 222: Glance at 2012, 2017 and 2022 European Fluoropolymers Value Market Share (%) by End-use Sector - Chemical Processing, Electricals & Electronics, Mechanical/Industrial, Automotive & Transportation, Building & Construction and Others .............................. 312
2.3.1.3 European Fluoropolymers Market Overview by Fluoropolymer Type .......................................... 313 Volume Analysis..................................................... 313
Chart 223: European Fluoropolymers Market Analysis (2012-2022) by Fluoropolymer Type - PTFE, FEP, PVDF, ETFE, PFA, PVF, PCTFE and ECTFE in Metric Tons .......... 313 Chart 224: Glance at 2012, 2017 and 2022 European Fluoropolymers Volume Market Share (%) by Fluoropolymer Type - PTFE, FEP, PVDF, ETFE, PFA, PVF, PCTFE and ECTFE ........................................................... 313
Value Analysis ........................................................ 314 Chart 225: European Fluoropolymers Market Analysis (2012-2022) by Fluoropolymer Type - PTFE, FEP, PVDF, ETFE, PFA, PVF, PCTFE and ECTFE in USD Million .......... 314 Chart 226: Glance at 2012, 2017 and 2022 European Fluoropolymers Value Market Share (%) by Fluoropolymer Type - PTFE, FEP, PVDF, ETFE, PFA, PVF, PCTFE and ECTFE ... 314
2.3.2 High Performance Polyamides ...................... 315 Chart 227: European High Performance Polyamides Market Analysis (2012-2022) in Volume (Metric Tons) and Value (USD Million) ....................................................... 315
2.3.2.1 European High Performance Polyamides Market Overview by Geographic Region ............... 316 Volume Analysis..................................................... 316
Chart 228: European High Performance Polyamides Market Analysis (2012-2022) by Geographic Region - France, Germany, Italy, The United Kingdom and Rest of Europe in Metric Tons ................................................... 316 Chart 229: Glance at 2012, 2017 and 2022 European High Performance Polyamides Volume Market Share (%) by Geographic Region - France, Germany, Italy, The United Kingdom and Rest of Europe ......................................... 316
Value Analysis ........................................................ 317 Chart 230: European High Performance Polyamides Market Analysis (2012-2022) by Geographic Region - France, Germany, Italy, The United Kingdom and Rest of Europe in USD Million ................................................... 317 Chart 231: Glance at 2012, 2017 and 2022 European High Performance Polyamides Value Market Share (%) by Geographic Region - France, Germany, Italy, The United Kingdom and Rest of Europe ......................................... 317
2.3.2.2 European High Performance Polyamides Market Overview by End-Use Sector ..................... 318 Volume Analysis..................................................... 318
Chart 232: European High Performance Polyamides Market Analysis (2012-2022) by End-Use Sector - Automotive, Electrical & Electronics, Mechanical/Industrial and Other in Metric Tons ........... 318 Chart 233: Glance at 2012, 2017 and 2022 European High Performance Polyamides Volume Market Share (%) by End-Use Sector - Automotive, Electrical & Electronics, Mechanical/Industrial and Other .................................. 318
Value Analysis ........................................................ 319 Chart 234: European High Performance Polyamides Market Analysis (2012-2022) by End-Use Sector - Automotive, Electrical & Electronics, Mechanical/Industrial and Other in USD Million ........... 319
Chart 235: Glance at 2012, 2017 and 2022 European High Performance Polyamides Value Market Share (%) by End-Use Sector - Automotive, Electrical & Electronics, Mechanical/Industrial and Other .................................. 319
2.3.2.3 European High Performance Polyamides Market Overview by Polyamide Type .................... 320 Volume Analysis .................................................... 320
Chart 236: European High Performance Polyamides Market Analysis (2012-2022) by Polyamide Type - Polyamide 11 & 12, Polyphthalamide/Polyamide 6T, Polyamide 46, Polyamide 9T and Polyarylamide/Polyamide MXD6 in Metric Tons .................................................... 320 Chart 237: Glance at 2012, 2017 and 2022 European High Performance Polyamides Volume Market Share (%) by Polyamide Type - Polyamide 11 & 12, Polyphthalamide/Polyamide 6T, Polyamide 46, Polyamide 9T and Polyarylamide/Polyamide MXD6....................... 320
Value Analysis ........................................................ 321 Chart 238: European High Performance Polyamides Market Analysis (2012-2022) by Polyamide Type - Polyamide 11 & 12, Polyphthalamide/Polyamide 6T, Polyamide 46, Polyamide 9T and Polyarylamide/Polyamide MXD6 in USD Million .................................................... 321 Chart 239: Glance at 2012, 2017 and 2022 European High Performance Polyamides Value Market Share (%) by Polyamide Type - Polyamide 11 & 12, Polyphthalamide/Polyamide 6T, Polyamide 46, Polyamide 9T and Polyarylamide/Polyamide MXD6....................... 321
2.3.3 Sulfone Polymers .......................................... 322 Chart 240: European Sulfone Polymers Market Analysis (2012-2022) in Volume (Metric Tons) and Value (USD Million) ......................................................................... 322
2.3.3.1 European Sulfone Polymers Market Overview by Geographic Region ............................................ 323 Volume Analysis .................................................... 323
Chart 241: European Sulfone Polymers Market Analysis (2012-2022) by Geographic Region – France, Germany, Italy, The United Kingdom and Rest of Europe in Metric Tons .............................................................................. 323 Chart 242: Glance at 2012, 2017 and 2022 European Sulfone Polymers Volume Market Share (%) by Geographic Region – France, Germany, Italy, The United Kingdom and Rest of Europe .............................................................. 323
Value Analysis ........................................................ 324 Chart 243: European Sulfone Polymers Market Analysis (2012-2022) by Geographic Region – France, Germany, Italy, The United Kingdom and Rest of Europe in USD Million .......................................................................... 324 Chart 244: Glance at 2012, 2017 and 2022 European Sulfone Polymers Value Market Share (%) by Geographic Region – France, Germany, Italy, The United Kingdom and Rest of Europe .............................................................. 324
2.3.3.2 European Sulfone Polymers Market Overview by End-Use Sector .................................................. 325 Volume Analysis .................................................... 325
Chart 245: European Sulfone Polymers Market Analysis (2012-2022) by End-Use Sector – Aerospace & Military, Automotive, Building & Construction, Electrical & Electronics, Food & Household, Mechanical/Industrial, Medical & Healthcare and Others in Metric Tons ......... 325 Chart 246: Glance at 2012, 2017 and 2022 European Sulfone Polymers Volume Market Share (%) by End-Use Sector – Aerospace & Military, Automotive, Building & Construction, Electrical & Electronics, Food & Household, Mechanical/Industrial, Medical & Healthcare and Others ... 325
Value Analysis ........................................................ 326 Chart 247: European Sulfone Polymers Market Analysis (2012-2022) by End-Use Sector – Aerospace & Military, Automotive, Building & Construction, Electrical & Electronics, Food & Household, Mechanical/Industrial, Medical & Healthcare and Others in USD Million ......... 326 Chart 248: Glance at 2012, 2017 and 2022 European Sulfone Polymers Value Market Share (%) by End-Use Sector – Aerospace & Military, Automotive, Building & Construction, Electrical & Electronics, Food & Household, Mechanical/Industrial, Medical & Healthcare and Others ............................................................... 326
Page 11
High Performance Plastics – A Global Market Overview November 2016 |560 Pages | 642 Charts | Price $6300
Click here to buy the report
2.3.3.3 European Sulfone Polymers Market Overview by Polymer Type .................................................... 327 Volume Analysis ..................................................... 327
Chart 249: European Sulfone Polymers Market Analysis (2012-2022) by Polymer Type – Polysulfone (PSU), Polyphenylsulfone (PPSU) and Polyethersulfone (PESU) in Metric Tons ................................................................... 327 Chart 250: Glance at 2012, 2017 and 2022 European Sulfone Polymers Volume Market Share (%) by Polymer Type – Polysulfone (PSU), Polyphenylsulfone (PPSU) and Polyethersulfone (PESU) ................................................ 327
Value Analysis ........................................................ 328 Chart 251: European Sulfone Polymers Market Analysis (2012-2022) by Polymer Type – Polysulfone (PSU), Polyphenylsulfone (PPSU) and Polyethersulfone (PESU) in USD Million ................................................................... 328 Chart 252: Glance at 2012, 2017 and 2022 European Sulfone Polymers Value Market Share (%) by Polymer Type – Polysulfone (PSU), Polyphenylsulfone (PPSU) and Polyethersulfone (PESU) ................................................ 328
2.3.4 Polyphenylene Sulphide ................................ 329 Chart 253: European Polyphenylene Sulphide Market Analysis (2012-2022) in Volume (Metric Tons) and Value (USD Million) ................................................................. 329
2.3.4.1 European Polyphenylene Sulphide (PPS) Market Overview by Geographic Region ............... 330 Volume Analysis ..................................................... 330
Chart 254: European Polyphenylene Sulfide (PPS) Market Analysis (2012-2022) by Geographic Region – France, Germany, Italy, United Kingdom and Rest of Europe in Metric Tons ................................................................... 330 Chart 255: Glance at 2012, 2017 and 2022 European Polyphenylene Sulfide (PPS) Volume Market Share (%) by Geographic Region – France, Germany, Italy, United Kingdom and Rest of Europe ......................................... 330
Value Analysis ........................................................ 331 Chart 256: European Polyphenylene Sulfide (PPS) Market Analysis (2012-2022) by Geographic Region – France, Germany, Italy, United Kingdom and Rest of Europe in USD Million ................................................................... 331 Chart 257: Glance at 2012, 2017 and 2022 European Polyphenylene Sulfide (PPS) Value Market Share (%) by Geographic Region – France, Germany, Italy, United Kingdom and Rest of Europe ......................................... 331
2.3.4.2 European Polyphenylene Sulphide (PPS) Market Overview by End-use Application .............. 332 Volume Analysis ..................................................... 332
Chart 258: European Polyphenylene Sulfide (PPS) Market Analysis (2012-2022) by End-use Application – Automotive, Electricals & Electronics, Mechanical/Industrial and Other Applications in Metric Tons ............................................... 332 Chart 259: Glance at 2012, 2017 and 2022 European Polyphenylene Sulfide (PPS) Volume Market Share (%) by End-use Application – Automotive, Electricals & Electronics, Mechanical/Industrial and Other Applications ................. 332
Value Analysis ........................................................ 333 Chart 260: European Polyphenylene Sulfide (PPS) Market Analysis (2012-2022) by End-use Application – Automotive, Electricals & Electronics, Mechanical/Industrial and Other Applications in USD Million ........................................................................... 333 Chart 261: Glance at 2012, 2017 and 2022 European Polyphenylene Sulfide (PPS) Value Market Share (%) by End-use Application – Automotive, Electricals & Electronics, Mechanical/Industrial and Other Applications ................. 333
2.3.5 Liquid Crystal Polymers ................................. 334 Chart 262: European Liquid Crystal Polymers (LCP) Market Analysis (2012-2022) in Volume (Metric Tons) and Value (USD Million) ................................................................. 334
2.3.5.1 European Liquid Crystal Polymers (LCP) Market Overview by Geographic Region ............... 335 Volume Analysis ..................................................... 335
Chart 263: European Liquid Crystal Polymers (LCP) Market Analysis (2012-2022) by Geographic Region – France, Germany, Italy, The United Kingdom and Rest of Europe in Metric Tons ................................................................... 335
Chart 264: Glance at 2012, 2017 and 2022 European Liquid Crystal Polymers (LCP) Volume Market Share (%) by Geographic Region – France, Germany, Italy, The United Kingdom and Rest of Europe ......................................... 335
Value Analysis ........................................................ 336 Chart 265: European Liquid Crystal Polymers (LCP) Market Analysis (2012-2022) by Geographic Region – France, Germany, Italy, The United Kingdom and Rest of Europe in USD Million ................................................................... 336 Chart 266: Glance at 2012, 2017 and 2022 European Liquid Crystal Polymers (LCP) Value Market Share (%) by Geographic Region – France, Germany, Italy, The United Kingdom and Rest of Europe ......................................... 336
2.3.5.2 European Liquid Crystal Polymers (LCP) Market Overview by End-use Sector ..................... 337 Volume Analysis..................................................... 337
Chart 267: European Liquid Crystal Polymers (LCP) Market Analysis (2012-2022) by End-use Sector – Automotive, Electrical & Electronics, Industrial and Others in Metric Tons .............................................................................. 337 Chart 268: Glance at 2012, 2017 and 2022 European Liquid Crystal Polymers (LCP) Volume Market Share (%) by End-use Sector –Automotive, Electrical & Electronics, Industrial and Others .................................................... 337
Value Analysis ........................................................ 338 Chart 269: European Liquid Crystal Polymers (LCP) Market Analysis (2012-2022) by End-use Sector –Automotive, Electrical & Electronics, Industrial and Others in USD Million .............. 338 Chart 270: Glance at 2012, 2017 and 2022 European Liquid Crystal Polymers (LCP) Value Market Share (%) by End-use Sector –Automotive, Electrical & Electronics, Industrial and Others .................................................... 338
2.3.6 Polyetherimide ............................................. 339 Chart 271: European Polyetherimide (PEI) Market Analysis (2012-2022) in Volume (Metric Tons) and Value (USD Million) ......................................................................... 339
2.3.6.1 European Polyetherimide (PEI) Market Overview by Geographic Region ............................ 340 Volume Analysis..................................................... 340
Chart 272: European Polyetherimide (PEI) Market Analysis (2012-2022) by Geographic Region - France, Germany, Italy, The United Kingdom and Rest of Europe in Metric Tons .............................................................................. 340 Chart 273: Glance at 2012, 2017 and 2022 European Polyetherimide (PEI) Volume Market Share (%) by Geographic Region - France, Germany, Italy, The United Kingdom and Rest of Europe ......................................... 340
Value Analysis ........................................................ 341 Chart 274: European Polyetherimide (PEI) Market Analysis (2012-2022) by Geographic Region - France, Germany, Italy, The United Kingdom and Rest of Europe in USD Million .. 341 Chart 275: Glance at 2012, 2017 and 2022 European Polyetherimide (PEI) Value Market Share (%) by Geographic Region - France, Germany, Italy, The United Kingdom and Rest of Europe ......................................... 341
2.3.6.2 European Polyetherimide (PEI) Market Overview by End-use Sector .................................. 342 Volume Analysis..................................................... 342
Chart 276: European Polyetherimide (PEI) Market Analysis (2012-2022) by End-use Sector - Automotive, Electrical & Electronics, Mechanical/Industrial, Consumer Goods, Aerospace & Military and Others in Metric Tons .......... 342 Chart 277: Glance at 2012, 2017 and 2022 European Polyetherimide (PEI) Volume Market Share (%) by End-use Sector - Automotive, Electrical & Electronics, Mechanical/Industrial, Consumer Goods, Aerospace & Military and Others ....................................................... 342
Value Analysis ........................................................ 343 Chart 278: European Polyetherimide (PEI) Market Analysis (2012-2022) by End-use Sector - Automotive, Electrical & Electronics, Mechanical/Industrial, Consumer Goods, Aerospace & Military and Others in USD Million ........... 343 Chart 279: Glance at 2012, 2017 and 2022 European Polyetherimide (PEI) Value Market Share (%) by End-use Sector - Automotive, Electrical & Electronics, Mechanical/Industrial, Consumer Goods, Aerospace & Military and Others ....................................................... 343
2.3.7 Polyetheretherketone ................................... 344 Chart 280: European Polyetheretherketone (PEEK) Market Analysis (2012-2022) in Volume (Metric Tons) and Value (USD Million) ................................................................ 344
2.3.7.1 European Polyetheretherketone (PEEK) Market Overview by Geographic Region ............... 345 Volume Analysis .................................................... 345
Chart 281: European Polyetheretherketone (PEEK) Market Analysis (2012-2022) by Geographic Region - France, Germany, Italy, The United Kingdom and Rest of Europe in Metric Tons .................................................................. 345 Chart 282: Glance at 2012, 2017 and 2022 European Polyetheretherketone (PEEK) Volume Market Share (%) by Geographic Region - France, Germany, Italy, The United Kingdom and Rest of Europe ........................................ 345
Value Analysis ........................................................ 346 Chart 283: European Polyetheretherketone (PEEK) Market Analysis (2012-2022) by Geographic Region - France, Germany, Italy, The United Kingdom and Rest of Europe in USD Million ................................................................... 346 Chart 284: Glance at 2012, 2017 and 2022 European Polyetheretherketone (PEEK) Value Market Share (%) by Geographic Region - France, Germany, Italy, The United Kingdom and Rest of Europe ........................................ 346
2.3.7.2 European Polyetheretherketone (PEEK) Market Overview by End-use Sector ..................... 347 Volume Analysis .................................................... 347
Chart 285: European Polyetheretherketone (PEEK) Market Analysis (2012-2022) by End-use Sector - Automotive, Electrical & Electronics, Mechanical/Industrial, Medical & Healthcare, Aerospace & Military and Others in Metric Tons .................. 347 Chart 286: Glance at 2012, 2017 and 2022 European Polyetheretherketone (PEEK) Volume Market Share (%) by End-use Sector - Automotive, Electrical & Electronics, Mechanical/Industrial, Medical & Healthcare, Aerospace & Military and Others ...................................................... 347
Value Analysis ........................................................ 348 Chart 287: European Polyetheretherketone (PEEK) Market Analysis (2012-2022) by End-use Sector - Automotive, Electrical & Electronics, Mechanical/Industrial, Medical & Healthcare, Aerospace & Military and Others in USD Million .................. 348 Chart 288: Glance at 2012, 2017 and 2022 European Polyetheretherketone (PEEK) Value Market Share (%) by End-use Sector - Automotive, Electrical & Electronics, Mechanical/Industrial, Medical & Healthcare, Aerospace & Military and Others ...................................................... 348
2.4 European High Performance Plastics Market Overview by Country ............................................. 349
2.4.1 France ........................................................ 349 Chart 289: French High Performance Plastics Market Analysis (2012-2022) in Volume (Metric Tons) and Value (USD Million) ................................................................ 349
2.4.1.1 French High Performance Plastics Market Overview by End-use Sector .................................. 350 Volume Analysis .................................................... 350
Chart 290: French High Performance Plastics Market Analysis (2012-2022) by End-use Sector - Automotive & Transportation, Building & Construction, Consumer Goods, Electrical & Electronics, Mechanical/Industrial and Other in Metric Tons .................................................... 350 Chart 291: Glance at 2012, 2017 and 2022 French High Performance Plastics Volume Market Share (%) by End-use Sector - Automotive & Transportation, Building & Construction, Consumer Goods, Electrical & Electronics, Mechanical/Industrial and Other .................................. 350
Value Analysis ........................................................ 351 Chart 292: French High Performance Plastics Market Analysis (2012-2022) by End-use Sector - Automotive & Transportation, Building & Construction, Consumer Goods, Electrical & Electronics, Mechanical/Industrial and Other in USD Million ..................................................... 351 Chart 293: Glance at 2012, 2017 and 2022 French High Performance Plastics Value Market Share (%) by End-use Sector - Automotive & Transportation, Building & Construction, Consumer Goods, Electrical & Electronics, Mechanical/Industrial and Other .................................. 351
Page 12
High Performance Plastics – A Global Market Overview November 2016 |560 Pages | 642 Charts | Price $6300
Click here to buy the report
2.4.1.2 French High Performance Plastics Market Overview by Plastic Type ....................................... 352 Volume Analysis ..................................................... 352
Chart 294: French High Performance Plastics Market Analysis (2012-2022) by Plastic Type - Fluoropolymers, High Performance Polyamides, Sulfone Polymers, Polyphenylene Sulphide, Liquid Crystal Polymers, Polyetherimide and Polyetheretherketone in Metric Tons ............................... 352 Chart 295: Glance at 2012, 2017 and 2022 French High Performance Plastics Volume Market Share (%) by Plastic Type - Fluoropolymers, High Performance Polyamides, Sulfone Polymers, Polyphenylene Sulphide, Liquid Crystal Polymers, Polyetherimide and Polyetheretherketone ... 352
Value Analysis ........................................................ 353 Chart 296: French High Performance Plastics Market Analysis (2012-2022) by Plastic Type - Fluoropolymers, High Performance Polyamides, Sulfone Polymers, Polyphenylene Sulphide, Liquid Crystal Polymers, Polyetherimide and Polyetheretherketone in USD Million ............................... 353 Chart 297: Glance at 2012, 2017 and 2022 French High Performance Plastics Value Market Share (%) by Plastic Type - Fluoropolymers, High Performance Polyamides, Sulfone Polymers, Polyphenylene Sulphide, Liquid Crystal Polymers, Polyetherimide and Polyetheretherketone ... 353
2.4.1.2.1 French Fluoropolymers Market Overview by Fluoropolymer Type............................................... 354 Volume Analysis ..................................................... 354
Chart 298: French Fluoropolymers Market Analysis (2012-2022) by Fluoropolymer Type - PTFE, FEP, PVDF, ETFE, PFA, PVF, PCTFE and ECTFE in Metric Tons .................... 354 Chart 299: Glance at 2012, 2017 and 2022 French Fluoropolymers Volume Market Share (%) by Fluoropolymer Type - PTFE, FEP, PVDF, ETFE, PFA, PVF, PCTFE and ECTFE ........................................................... 354
Value Analysis ........................................................ 355 Chart 300: French Fluoropolymers Market Analysis (2012-2022) by Fluoropolymer Type - PTFE, FEP, PVDF, ETFE, PFA, PVF, PCTFE and ECTFE in USD Million .................... 355 Chart 301: Glance at 2012, 2017 and 2022 French Fluoropolymers Value Market Share (%) by Fluoropolymer Type - PTFE, FEP, PVDF, ETFE, PFA, PVF, PCTFE and ECTFE ...................................................... 355
2.4.1.2.2 French High Performance Polyamides Market Overview by Polyamide Type .................... 356 Volume Analysis ..................................................... 356
Chart 302: French High Performance Polyamides Market Analysis (2012-2022) by Polyamide Type - Polyamide 11 & 12, Polyphthalamide/Polyamide 6T, Polyamide 46, Polyamide 9T and Polyarylamide/Polyamide MXD6 in Metric Tons ................................................................... 356 Chart 303: Glance at 2012, 2017 and 2022 French High Performance Polyamides Volume Market Share (%) by Polyamide Type - Polyamide 11 & 12, Polyphthalamide/Polyamide 6T, Polyamide 46, Polyamide 9T and Polyarylamide/Polyamide MXD6 ....................... 356
Value Analysis ........................................................ 357 Chart 304: French High Performance Polyamides Market Analysis (2012-2022) by Polyamide Type - Polyamide 11 & 12, Polyphthalamide/Polyamide 6T, Polyamide 46, Polyamide 9T and Polyarylamide/Polyamide MXD6 in USD Million ........................................................................... 357 Chart 305: Glance at 2012, 2017 and 2022 French High Performance Polyamides Value Market Share (%) by Polyamide Type - Polyamide 11 & 12, Polyphthalamide/Polyamide 6T, Polyamide 46, Polyamide 9T and Polyarylamide/Polyamide MXD6 ....................... 357
2.4.1.2.3 French Sulfone Polymers Market Overview by Polymer Type .................................................... 358 Volume Analysis ..................................................... 358
Chart 306: French Sulfone Polymers Market Analysis (2012-2022) by Polymer Type – Polysulfone (PSU), Polyphenylsulfone (PPSU) and Polyethersulfone (PESU) in Metric Tons ................................................................... 358 Chart 307: Glance at 2012, 2017 and 2022 French Sulfone Polymers Volume Market Share (%) by Polymer Type – Polysulfone (PSU), Polyphenylsulfone (PPSU) and Polyethersulfone (PESU) ................................................ 358
Value Analysis ........................................................ 359 Chart 308: French Sulfone Polymers Market Analysis (2012-2022) by Polymer Type – Polysulfone (PSU), Polyphenylsulfone (PPSU) and Polyethersulfone (PESU) in USD Million ............. 359 Chart 309: Glance at 2012, 2017 and 2022 French Sulfone Polymers Value Market Share (%) by Polymer Type – Polysulfone (PSU), Polyphenylsulfone (PPSU) and Polyethersulfone (PESU) ............................................... 359
2.4.2 Germany .................................................... 360 Chart 310: German High Performance Plastics Market Analysis (2012-2022) in Volume (Metric Tons) and Value (USD Million) ................................................................. 360
2.4.2.1 German High Performance Plastics Market Overview by End-use Sector .................................. 361 Volume Analysis..................................................... 361
Chart 311: German High Performance Plastics Market Analysis (2012-2022) by End-use Sector - Automotive & Transportation, Building & Construction, Consumer Goods, Electrical & Electronics, Mechanical/Industrial and Other in Metric Tons ..................................................... 361 Chart 312: Glance at 2012, 2017 and 2022 German High Performance Plastics Volume Market Share (%) by End-use Sector - Automotive & Transportation, Building & Construction, Consumer Goods, Electrical & Electronics, Mechanical/Industrial and Other .................................. 361
Value Analysis ........................................................ 362 Chart 313: German High Performance Plastics Market Analysis (2012-2022) by End-use Sector - Automotive & Transportation, Building & Construction, Consumer Goods, Electrical & Electronics, Mechanical/Industrial and Other in USD Million ..................................................... 362 Chart 314: Glance at 2012, 2017 and 2022 German High Performance Plastics Value Market Share (%) by End-use Sector - Automotive & Transportation, Building & Construction, Consumer Goods, Electrical & Electronics, Mechanical/Industrial and Other .................................. 362
2.4.2.2 German High Performance Plastics Market Overview by Plastic Type ....................................... 363 Volume Analysis..................................................... 363
Chart 315: German High Performance Plastics Market Analysis (2012-2022) by Plastic Type - Fluoropolymers, High Performance Polyamides, Sulfone Polymers, Polyphenylene Sulphide, Liquid Crystal Polymers, Polyetherimide and Polyetheretherketone in Metric Tons ............................... 363 Chart 316: Glance at 2012, 2017 and 2022 German High Performance Plastics Volume Market Share (%) by Plastic Type - Fluoropolymers, High Performance Polyamides, Sulfone Polymers, Polyphenylene Sulphide, Liquid Crystal Polymers, Polyetherimide and Polyetheretherketone .. 363
Value Analysis ........................................................ 364 Chart 317: German High Performance Plastics Market Analysis (2012-2022) by Plastic Type - Fluoropolymers, High Performance Polyamides, Sulfone Polymers, Polyphenylene Sulphide, Liquid Crystal Polymers, Polyetherimide and Polyetheretherketone in USD Million ............................... 364 Chart 318: Glance at 2012, 2017 and 2022 German High Performance Plastics Value Market Share (%) by Plastic Type - Fluoropolymers, High Performance Polyamides, Sulfone Polymers, Polyphenylene Sulphide, Liquid Crystal Polymers, Polyetherimide and Polyetheretherketone .. 364
2.4.2.2.1 German Fluoropolymers Market Overview by Fluoropolymer Type .......................................... 365 Volume Analysis..................................................... 365
Chart 319: German Fluoropolymers Market Analysis (2012-2022) by Fluoropolymer Type - PTFE, FEP, PVDF, ETFE, PFA, PVF, PCTFE and ECTFE in Metric Tons .......... 365 Chart 320: Glance at 2012, 2017 and 2022 German Fluoropolymers Volume Market Share (%) by Fluoropolymer Type - PTFE, FEP, PVDF, ETFE, PFA, PVF, PCTFE and ECTFE ........................................................... 365
Value Analysis ........................................................ 366 Chart 321: German Fluoropolymers Market Analysis (2012-2022) by Fluoropolymer Type - PTFE, FEP, PVDF, ETFE, PFA, PVF, PCTFE and ECTFE in USD Million .......... 366 Chart 322: Glance at 2012, 2017 and 2022 German Fluoropolymers Value Market Share (%) by Fluoropolymer Type - PTFE, FEP, PVDF, ETFE, PFA, PVF, PCTFE and ECTFE ... 366
2.4.2.2.2 German High Performance Polyamides Market Overview by Polyamide Type .................... 367 Volume Analysis .................................................... 367
Chart 323: German High Performance Polyamides Market Analysis (2012-2022) by Polyamide Type - Polyamide 11 & 12, Polyphthalamide/Polyamide 6T, Polyamide 46, Polyamide 9T and Polyarylamide/Polyamide MXD6 in Metric Tons .................................................................. 367 Chart 324: Glance at 2012, 2017 and 2022 German High Performance Polyamides Volume Market Share (%) by Polyamide Type - Polyamide 11 & 12, Polyphthalamide/Polyamide 6T, Polyamide 46, Polyamide 9T and Polyarylamide/Polyamide MXD6....................... 367
Value Analysis ........................................................ 368 Chart 325: German High Performance Polyamides Market Analysis (2012-2022) by Polyamide Type - Polyamide 11 & 12, Polyphthalamide/Polyamide 6T, Polyamide 46, Polyamide 9T and Polyarylamide/Polyamide MXD6 in USD Million ............ 368 Chart 326: Glance at 2012, 2017 and 2022 German High Performance Polyamides Value Market Share (%) by Polyamide Type - Polyamide 11 & 12, Polyphthalamide/Polyamide 6T, Polyamide 46, Polyamide 9T and Polyarylamide/Polyamide MXD6....................... 368
2.4.2.2.3 German Sulfone Polymers Market Overview by Polymer Type .................................................... 369 Volume Analysis .................................................... 369
Chart 327: German Sulfone Polymers Market Analysis (2012-2022) by Polymer Type – Polysulfone (PSU), Polyphenylsulfone (PPSU) and Polyethersulfone (PESU) in Metric Tons .................................................................. 369 Chart 328: Glance at 2012, 2017 and 2022 German Sulfone Polymers Volume Market Share (%) by Polymer Type – Polysulfone (PSU), Polyphenylsulfone (PPSU) and Polyethersulfone (PESU) ............................................... 369
Value Analysis ........................................................ 370 Chart 329: German Sulfone Polymers Market Analysis (2012-2022) by Polymer Type – Polysulfone (PSU), Polyphenylsulfone (PPSU) and Polyethersulfone (PESU) in USD Million ............. 370 Chart 330: Glance at 2012, 2017 and 2022 German Sulfone Polymers Value Market Share (%) by Polymer Type – Polysulfone (PSU), Polyphenylsulfone (PPSU) and Polyethersulfone (PESU) ............................................... 370
2.4.3 Italy ........................................................... 371 Chart 331: Italian High Performance Plastics Market Analysis (2012-2022) in Volume (Metric Tons) and Value (USD Million) 371
2.4.3.1 Italian High Performance Plastics Market Overview by End-use Sector .................................. 372 Volume Analysis .................................................... 372
Chart 332: Italian High Performance Plastics Market Analysis (2012-2022) by End-use Sector - Automotive & Transportation, Building & Construction, Consumer Goods, Electrical & Electronics, Mechanical/Industrial and Other in Metric Tons .................................................... 372 Chart 333: Glance at 2012, 2017 and 2022 Italian High Performance Plastics Volume Market Share (%) by End-use Sector - Automotive & Transportation, Building & Construction, Consumer Goods, Electrical & Electronics, Mechanical/Industrial and Other .................................. 372
Value Analysis ........................................................ 373 Chart 334: Italian High Performance Plastics Market Analysis (2012-2022) by End-use Sector - Automotive & Transportation, Building & Construction, Consumer Goods, Electrical & Electronics, Mechanical/Industrial and Other in USD Million ..................................................... 373 Chart 335: Glance at 2012, 2017 and 2022 Italian High Performance Plastics Value Market Share (%) by End-use Sector - Automotive & Transportation, Building & Construction, Consumer Goods, Electrical & Electronics, Mechanical/Industrial and Other .................................. 373
2.4.3.2 Italian High Performance Plastics Market Overview by Plastic Type ....................................... 374 Volume Analysis .................................................... 374
Chart 336: Italian High Performance Plastics Market Analysis (2012-2022) by Plastic Type - Fluoropolymers, High Performance Polyamides, Sulfone Polymers, Polyphenylene Sulphide, Liquid Crystal Polymers, Polyetherimide and Polyetheretherketone in Metric Tons ............................... 374
Page 13
High Performance Plastics – A Global Market Overview November 2016 |560 Pages | 642 Charts | Price $6300
Click here to buy the report
Chart 337: Glance at 2012, 2017 and 2022 Italian High Performance Plastics Volume Market Share (%) by Plastic Type - Fluoropolymers, High Performance Polyamides, Sulfone Polymers, Polyphenylene Sulphide, Liquid Crystal Polymers, Polyetherimide and Polyetheretherketone ... 374
Value Analysis ........................................................ 375 Chart 338: Italian High Performance Plastics Market Analysis (2012-2022) by Plastic Type - Fluoropolymers, High Performance Polyamides, Sulfone Polymers, Polyphenylene Sulphide, Liquid Crystal Polymers, Polyetherimide and Polyetheretherketone in USD Million ............................... 375 Chart 339: Glance at 2012, 2017 and 2022 Italian High Performance Plastics Value Market Share (%) by Plastic Type - Fluoropolymers, High Performance Polyamides, Sulfone Polymers, Polyphenylene Sulphide, Liquid Crystal Polymers, Polyetherimide and Polyetheretherketone ... 375
2.4.3.2.1 Italian Fluoropolymers Market Overview by Fluoropolymer Type............................................... 376 Volume Analysis ..................................................... 376
Chart 340: Italian Fluoropolymers Market Analysis (2012-2022) by Fluoropolymer Type - PTFE, FEP, PVDF, ETFE, PFA, PVF, PCTFE and ECTFE in Metric Tons .................... 376 Chart 341: Glance at 2012, 2017 and 2022 Italian Fluoropolymers Volume Market Share (%) by Fluoropolymer Type - PTFE, FEP, PVDF, ETFE, PFA, PVF, PCTFE and ECTFE ........................................................... 376
Value Analysis ........................................................ 377 Chart 342: Italian Fluoropolymers Market Analysis (2012-2022) by Fluoropolymer Type - PTFE, FEP, PVDF, ETFE, PFA, PVF, PCTFE and ECTFE in USD Million .................... 377 Chart 343: Glance at 2012, 2017 and 2022 Italian Fluoropolymers Value Market Share (%) by Fluoropolymer Type - PTFE, FEP, PVDF, ETFE, PFA, PVF, PCTFE and ECTFE377
2.4.3.2.2 Italian High Performance Polyamides Market Overview by Polyamide Type ................................. 378 Volume Analysis ..................................................... 378
Chart 344: Italian High Performance Polyamides Market Analysis (2012-2022) by Polyamide Type - Polyamide 11 & 12, Polyphthalamide/Polyamide 6T, Polyamide 46, Polyamide 9T and Polyarylamide/Polyamide MXD6 in Metric Tons ................................................................... 378 Chart 345: Glance at 2012, 2017 and 2022 Italian High Performance Polyamides Volume Market Share (%) by Polyamide Type - Polyamide 11 & 12, Polyphthalamide/Polyamide 6T, Polyamide 46, Polyamide 9T and Polyarylamide/Polyamide MXD6 ....................... 378
Value Analysis ........................................................ 379 Chart 346: Italian High Performance Polyamides Market Analysis (2012-2022) by Polyamide Type - Polyamide 11 & 12, Polyphthalamide/Polyamide 6T, Polyamide 46, Polyamide 9T and Polyarylamide/Polyamide MXD6 in USD Million ........................................................................... 379 Chart 347: Glance at 2012, 2017 and 2022 Italian High Performance Polyamides Value Market Share (%) by Polyamide Type - Polyamide 11 & 12, Polyphthalamide/Polyamide 6T, Polyamide 46, Polyamide 9T and Polyarylamide/Polyamide MXD6 ....................... 379
2.4.3.2.3 Italian Sulfone Polymers Market Overview by Polymer Type .................................................... 380 Volume Analysis ..................................................... 380
Chart 348: Italian Sulfone Polymers Market Analysis (2012-2022) by Polymer Type – Polysulfone (PSU), Polyphenylsulfone (PPSU) and Polyethersulfone (PESU) in Metric Tons ................................................................... 380 Chart 349: Glance at 2012, 2017 and 2022 Italian Sulfone Polymers Volume Market Share (%) by Polymer Type – Polysulfone (PSU), Polyphenylsulfone (PPSU) and Polyethersulfone (PESU) ............................................... 380
Value Analysis ........................................................ 381 Chart 350: Italian Sulfone Polymers Market Analysis (2012-2022) by Polymer Type – Polysulfone (PSU), Polyphenylsulfone (PPSU) and Polyethersulfone (PESU) in USD Million ................................................................... 381 Chart 351: Glance at 2012, 2017 and 2022 Italian Sulfone Polymers Value Market Share (%) by Polymer Type – Polysulfone (PSU), Polyphenylsulfone (PPSU) and Polyethersulfone (PESU) ................................................ 381
2.4.4 The United Kingdom ................................... 382 Chart 352: UK High Performance Plastics Market Analysis (2012-2022) in Volume (Metric Tons) and Value (USD Million) ......................................................................... 382
2.4.4.1 UK High Performance Plastics Market Overview by End-use Sector .................................. 383 Volume Analysis..................................................... 383
Chart 353: UK High Performance Plastics Market Analysis (2012-2022) by End-use Sector - Automotive & Transportation, Building & Construction, Consumer Goods, Electrical & Electronics, Mechanical/Industrial and Other in Metric Tons ..................................................... 383 Chart 354: Glance at 2012, 2017 and 2022 UK High Performance Plastics Volume Market Share (%) by End-use Sector - Automotive & Transportation, Building & Construction, Consumer Goods, Electrical & Electronics, Mechanical/Industrial and Other .................................. 383
Value Analysis ........................................................ 384 Chart 355: UK High Performance Plastics Market Analysis (2012-2022) by End-use Sector - Automotive & Transportation, Building & Construction, Consumer Goods, Electrical & Electronics, Mechanical/Industrial and Other in USD Million ..................................................... 384 Chart 356: Glance at 2012, 2017 and 2022 UK High Performance Plastics Value Market Share (%) by End-use Sector - Automotive & Transportation, Building & Construction, Consumer Goods, Electrical & Electronics, Mechanical/Industrial and Other .................................. 384
2.4.4.2 UK High Performance Plastics Market Overview by Plastic Type ....................................... 385 Volume Analysis..................................................... 385
Chart 357: UK High Performance Plastics Market Analysis (2012-2022) by Plastic Type - Fluoropolymers, High Performance Polyamides, Sulfone Polymers, Polyphenylene Sulphide, Liquid Crystal Polymers, Polyetherimide and Polyetheretherketone in Metric Tons ............................... 385 Chart 358: Glance at 2012, 2017 and 2022 UK High Performance Plastics Volume Market Share (%) by Plastic Type - Fluoropolymers, High Performance Polyamides, Sulfone Polymers, Polyphenylene Sulphide, Liquid Crystal Polymers, Polyetherimide and Polyetheretherketone .. 385
Value Analysis ........................................................ 386 Chart 359: UK High Performance Plastics Market Analysis (2012-2022) by Plastic Type - Fluoropolymers, High Performance Polyamides, Sulfone Polymers, Polyphenylene Sulphide, Liquid Crystal Polymers, Polyetherimide and Polyetheretherketone in USD Million ............................... 386 Chart 360: Glance at 2012, 2017 and 2022 UK High Performance Plastics Value Market Share (%) by Plastic Type - Fluoropolymers, High Performance Polyamides, Sulfone Polymers, Polyphenylene Sulphide, Liquid Crystal Polymers, Polyetherimide and Polyetheretherketone .. 386
2.4.4.2.1 United Kingdom Fluoropolymers Market Overview by Fluoropolymer Type .......................... 387 Volume Analysis..................................................... 387
Chart 361: UK Fluoropolymers Market Analysis (2012-2022) by Fluoropolymer Type - PTFE, FEP, PVDF, ETFE, PFA, PCTFE and ECTFE in Metric Tons ........................... 387 Chart 362: Glance at 2012, 2017 and 2022 UK Fluoropolymers Volume Market Share (%) by Fluoropolymer Type - PTFE, FEP, PVDF, ETFE, PFA, PCTFE and ECTFE ..................................................................... 387
Value Analysis ........................................................ 388 Chart 363: UK Fluoropolymers Market Analysis (2012-2022) by Fluoropolymer Type - PTFE, FEP, PVDF, ETFE, PFA, PCTFE and ECTFE in USD Million............................ 388 Chart 364: Glance at 2012, 2017 and 2022 UK Fluoropolymers Value Market Share (%) by Fluoropolymer Type - PTFE, FEP, PVDF, ETFE, PFA, PCTFE and ECTFE .... 388
2.4.4.2.2 UK High Performance Polyamides Market Overview by Polyamide Type ................................. 389 Volume Analysis..................................................... 389
Chart 365: UK High Performance Polyamides Market Analysis (2012-2022) by Polyamide Type - Polyamide 11 & 12, Polyphthalamide/Polyamide 6T, Polyamide 46, Polyamide 9T and Polyarylamide/Polyamide MXD6 in Metric Tons ................................................................... 389
Chart 366: Glance at 2012, 2017 and 2022 UK High Performance Polyamides Volume Market Share (%) by Polyamide Type - Polyamide 11 & 12, Polyphthalamide/Polyamide 6T, Polyamide 46, Polyamide 9T and Polyarylamide/Polyamide MXD6....................... 389
Value Analysis ........................................................ 390 Chart 367: UK High Performance Polyamides Market Analysis (2012-2022) by Polyamide Type - Polyamide 11 & 12, Polyphthalamide/Polyamide 6T, Polyamide 46, Polyamide 9T and Polyarylamide/Polyamide MXD6 in USD Million ............ 390 Chart 368: Glance at 2012, 2017 and 2022 UK High Performance Polyamides Value Market Share (%) by Polyamide Type - Polyamide 11 & 12, Polyphthalamide/Polyamide 6T, Polyamide 46, Polyamide 9T and Polyarylamide/Polyamide MXD6....................... 390
2.4.4.2.3 UK Sulfone Polymers Market Overview by Polymer Type ......................................................... 391 Volume Analysis .................................................... 391
Chart 369: UK Sulfone Polymers Market Analysis (2012-2022) by Polymer Type – Polysulfone (PSU), Polyphenylsulfone (PPSU) and Polyethersulfone (PESU) in Metric Tons ............. 391 Chart 370: Glance at 2012, 2017 and 2022 UK Sulfone Polymers Volume Market Share (%) by Polymer Type – Polysulfone (PSU), Polyphenylsulfone (PPSU) and Polyethersulfone (PESU) ............................................... 391
Value Analysis ........................................................ 392 Chart 371: UK Sulfone Polymers Market Analysis (2012-2022) by Polymer Type – Polysulfone (PSU), Polyphenylsulfone (PPSU) and Polyethersulfone (PESU) in USD Million ................................................................... 392 Chart 372: Glance at 2012, 2017 and 2022 UK Sulfone Polymers Value Market Share (%) by Polymer Type – Polysulfone (PSU), Polyphenylsulfone (PPSU) and Polyethersulfone (PESU) ............................................... 392
2.4.5 Rest of Europe ............................................ 393 Chart 373: Rest of Europe High Performance Plastics Market Analysis (2012-2022) in Volume (Metric Tons) and Value (USD Million) ...................................................... 393
2.4.5.1 Rest of Europe High Performance Plastics Market Overview by End-use Sector ..................... 394 Volume Analysis .................................................... 394
Chart 374: Rest of Europe High Performance Plastics Market Analysis (2012-2022) by End-use Sector - Automotive & Transportation, Building & Construction, Consumer Goods, Electrical & Electronics, Mechanical/Industrial and Other in Metric Tons .......... 394 Chart 375: Glance at 2012, 2017 and 2022 Rest of Europe High Performance Plastics Volume Market Share (%) by End-use Sector - Automotive & Transportation, Building & Construction, Consumer Goods, Electrical & Electronics, Mechanical/Industrial and Other .................................. 394
Value Analysis ........................................................ 395 Chart 376: Rest of Europe High Performance Plastics Market Analysis (2012-2022) by End-use Sector - Automotive & Transportation, Building & Construction, Consumer Goods, Electrical & Electronics, Mechanical/Industrial and Other in USD Million .......... 395 Chart 377: Glance at 2012, 2017 and 2022 Rest of Europe High Performance Plastics Value Market Share (%) by End-use Sector - Automotive & Transportation, Building & Construction, Consumer Goods, Electrical & Electronics, Mechanical/Industrial and Other .................................. 395
2.4.5.2 Rest of Europe High Performance Plastics Market Overview by Plastic Type .......................... 396 Volume Analysis .................................................... 396
Chart 378: Rest of Europe High Performance Plastics Market Analysis (2012-2022) by Plastic Type - Fluoropolymers, High Performance Polyamides, Sulfone Polymers, Polyphenylene Sulphide, Liquid Crystal Polymers, Polyetherimide and Polyetheretherketone in Metric Tons .................................................................. 396 Chart 379: Glance at 2012, 2017 and 2022 Rest of Europe High Performance Plastics Volume Market Share (%) by Plastic Type - Fluoropolymers, High Performance Polyamides, Sulfone Polymers, Polyphenylene Sulphide, Liquid Crystal Polymers, Polyetherimide and Polyetheretherketone .................................................. 396
Page 14
High Performance Plastics – A Global Market Overview November 2016 |560 Pages | 642 Charts | Price $6300
Click here to buy the report
Value Analysis ........................................................ 397 Chart 380: Rest of Europe High Performance Plastics Market Analysis (2012-2022) by Plastic Type - Fluoropolymers, High Performance Polyamides, Sulfone Polymers, Polyphenylene Sulphide, Liquid Crystal Polymers, Polyetherimide and Polyetheretherketone in USD Million ............................... 397 Chart 381: Glance at 2012, 2017 and 2022 Rest of Europe High Performance Plastics Value Market Share (%) by Plastic Type - Fluoropolymers, High Performance Polyamides, Sulfone Polymers, Polyphenylene Sulphide, Liquid Crystal Polymers, Polyetherimide and Polyetheretherketone ..... 397
2.4.5.2.1 Rest of Europe Fluoropolymers Market Overview by Fluoropolymer Type .......................... 398 Volume Analysis ..................................................... 398
Chart 382: Rest of Europe Fluoropolymers Market Analysis (2012-2022) by Fluoropolymer Type - PTFE, FEP, PVDF, ETFE, PFA, PVF, PCTFE and ECTFE in Metric Tons .......... 398 Chart 383: Glance at 2012, 2017 and 2022 Rest of Europe Fluoropolymers Volume Market Share (%) by Fluoropolymer Type - PTFE, FEP, PVDF, ETFE, PFA, PVF, PCTFE and ECTFE ........................................................... 398
Value Analysis ........................................................ 399 Chart 384: Rest of Europe Fluoropolymers Market Analysis (2012-2022) by Fluoropolymer Type - PTFE, FEP, PVDF, ETFE, PFA, PVF, PCTFE and ECTFE in USD Million ........... 399 Chart 385: Glance at 2012, 2017 and 2022 Rest of Europe Fluoropolymers Value Market Share (%) by Fluoropolymer Type - PTFE, FEP, PVDF, ETFE, PFA, PVF, PCTFE and ECTFE ... 399
2.4.5.2.2 Rest of Europe High Performance Polyamides Market Overview by Polyamide Type . 400 Volume Analysis ..................................................... 400
Chart 386: Rest of Europe High Performance Polyamides Market Analysis (2012-2022) by Polyamide Type - Polyamide 11 & 12, Polyphthalamide/Polyamide 6T, Polyamide 46, Polyamide 9T and Polyarylamide/Polyamide MXD6 in Metric Tons ..................................................... 400 Chart 387: Glance at 2012, 2017 and 2022 Rest of Europe High Performance Polyamides Volume Market Share (%) by Polyamide Type - Polyamide 11 & 12, Polyphthalamide/Polyamide 6T, Polyamide 46, Polyamide 9T and Polyarylamide/Polyamide MXD6 ....................... 400
Value Analysis ........................................................ 401 Chart 388: Rest of Europe High Performance Polyamides Market Analysis (2012-2022) by Polyamide Type - Polyamide 11 & 12, Polyphthalamide/Polyamide 6T, Polyamide 46, Polyamide 9T and Polyarylamide/Polyamide MXD6 in USD Million ..................................................... 401 Chart 389: Glance at 2012, 2017 and 2022 Rest of Europe High Performance Polyamides Value Market Share (%) by Polyamide Type - Polyamide 11 & 12, Polyphthalamide/Polyamide 6T, Polyamide 46, Polyamide 9T and Polyarylamide/Polyamide MXD6 ....................... 401
2.4.5.2.3 Rest of Europe Sulfone Polymers Market Overview by Polymer Type .................................... 402 Volume Analysis ..................................................... 402
Chart 390: Rest of Europe Sulfone Polymers Market Analysis (2012-2022) by Polymer Type – Polysulfone (PSU), Polyphenylsulfone (PPSU) and Polyethersulfone (PESU) in Metric Tons ................................................................... 402 Chart 391: Glance at 2012, 2017 and 2022 Rest of Europe Sulfone Polymers Volume Market Share (%) by Polymer Type – Polysulfone (PSU), Polyphenylsulfone (PPSU) and Polyethersulfone (PESU) ............................................... 402
Value Analysis .......................................................... 43 Chart 392: Rest of Europe Sulfone Polymers Market Analysis (2012-2022) by Polymer Type – Polysulfone (PSU), Polyphenylsulfone (PPSU) and Polyethersulfone (PESU) in USD Million ................................................................... 403 Chart 393: Glance at 2012, 2017 and 2022 Rest of Europe Sulfone Polymers Value Market Share (%) by Polymer Type – Polysulfone (PSU), Polyphenylsulfone (PPSU) and Polyethersulfone (PESU) ................................................ 403
3. ASIA-PACIFIC................................................... 404 Chart 394: Asia-Pacific High Performance Plastics Market Analysis (2012-2022) in Volume (Metric Tons) and Value (USD Million) ................................................................. 404
3.1 Asia-Pacific High Performance Plastics Market Overview by Geographic Region ............................ 405 Volume Analysis..................................................... 405
Chart 395: Asia-Pacific High Performance Plastics Market Analysis (2012-2022) by Geographic Region - China, India, Japan, South Korea and Rest of APAC in Metric Tons .... 405 Chart 396: Glance at 2012, 2017 and 2022 Asia-Pacific High Performance Plastics Volume Market Share (%) by Geographic Region - China, India, Japan, South Korea and Rest of APAC ................................................................. 405
Value Analysis ........................................................ 406 Chart 397: Asia-Pacific High Performance Plastics Market Analysis (2012-2022) by Geographic Region - China, India, Japan, South Korea and Rest of APAC in USD Million .... 406 Chart 398: Glance at 2012, 2017 and 2022 Asia-Pacific High Performance Plastics Value Market Share (%) by Geographic Region - China, India, Japan, South Korea and Rest of APAC ................................................................. 406
3.2 Asia-Pacific High Performance Plastics Market Overview by End-use Sector .................................. 407 Volume Analysis..................................................... 407
Chart 399: Asia-Pacific High Performance Plastics Market Analysis (2012-2022) by End-use Sector - Automotive & Transportation, Building & Construction, Consumer Goods, Electrical & Electronics, Mechanical/Industrial and Other in Metric Tons ..................................................... 407 Chart 400: Glance at 2012, 2017 and 2022 Asia-Pacific High Performance Plastics Volume Market Share (%) by End-use Sector - Automotive & Transportation, Building & Construction, Consumer Goods, Electrical & Electronics, Mechanical/Industrial and Other .................................. 407
Value Analysis ........................................................ 408 Chart 401: Asia-Pacific High Performance Plastics Market Analysis (2012-2022) by End-use Sector - Automotive & Transportation, Building & Construction, Consumer Goods, Electrical & Electronics, Mechanical/Industrial and Other in USD Million ..................................................... 408 Chart 402: Glance at 2012, 2017 and 2022 Asia-Pacific High Performance Plastics Value Market Share (%) by End-use Sector - Automotive & Transportation, Building & Construction, Consumer Goods, Electrical & Electronics, Mechanical/Industrial and Other .................................. 408
3.3 Asia-Pacific High Performance Plastics Market Overview by Plastic Type ....................................... 409 Volume Analysis..................................................... 409
Chart 403: Asia-Pacific High Performance Plastics Market Analysis (2012-2022) by Plastic Type - Fluoropolymers, High Performance Polyamides, Sulfone Polymers, Polyphenylene Sulphide, Liquid Crystal Polymers, Polyetherimide and Polyetheretherketone in Metric Tons ............................... 409 Chart 404: Glance at 2012, 2017 and 2022 Asia-Pacific High Performance Plastics Volume Market Share (%) by Plastic Type - Fluoropolymers, High Performance Polyamides, Sulfone Polymers, Polyphenylene Sulphide, Liquid Crystal Polymers, Polyetherimide and Polyetheretherketone ................................................... 409
Value Analysis ........................................................ 410 Chart 405: Asia-Pacific High Performance Plastics Market Analysis (2012-2022) by Plastic Type - Fluoropolymers, High Performance Polyamides, Sulfone Polymers, Polyphenylene Sulphide, Liquid Crystal Polymers, Polyetherimide and Polyetheretherketone in USD Million ............................... 410 Chart 406: Glance at 2012, 2017 and 2022 Asia-Pacific High Performance Plastics Value Market Share (%) by Plastic Type - Fluoropolymers, High Performance Polyamides, Sulfone Polymers, Polyphenylene Sulphide, Liquid Crystal Polymers, Polyetherimide and Polyetheretherketone ...................... 410
3.3.1 Fluoropolymers ............................................. 411 Chart 407: Asia-Pacific Fluoropolymers Market Analysis (2012-2022) in Volume (Metric Tons) and Value (USD Million) ......................................................................... 411
3.3.1.1 Asia-Pacific Fluoropolymers Market Overview by Geographic Region ............................................ 412 Volume Analysis..................................................... 412
Chart 408: Asia-Pacific Fluoropolymers Market Analysis (2012-2022) by Region - China, Japan, India, South Korea and Rest of Asia-Pacific in Metric Tons.......................... 412
Chart 409: Glance at 2012, 2017 and 2022 Asia-Pacific Fluoropolymers Volume Market Share (%) by Region - China, Japan, India, South Korea and Rest of Asia-Pacific ............ 412
Value Analysis ........................................................ 413 Chart 410: Asia-Pacific Fluoropolymers Market Analysis (2012-2022) by Region - China, Japan, India, South Korea and Rest of Asia-Pacific in USD Million ......................... 413 Chart 411: Glance at 2012, 2017 and 2022 Asia-Pacific Fluoropolymers Value Market Share (%) by Region - China, Japan, India, South Korea and Rest of Asia-Pacific ........ 413
3.3.1.2 Asia-Pacific Fluoropolymers Market Overview by End-use Sector .................................................. 414 Volume Analysis .................................................... 414
Chart 412: Asia-Pacific Fluoropolymers Market Analysis (2012-2022) by End-use Sector - Chemical Processing, Electricals & Electronics, Mechanical/Industrial, Automotive & Transportation, Building & Construction and Others in Metric Tons ............................................ 414 Chart 413: Glance at 2012, 2017 and 2022 Asia-Pacific Fluoropolymers Volume Market Share (%) by End-use Sector - Chemical Processing, Electricals & Electronics, Mechanical/Industrial, Automotive & Transportation, Building & Construction and Others ............................. 414
Value Analysis ........................................................ 415 Chart 414: Asia-Pacific Fluoropolymers Market Analysis (2012-2022) by End-use Sector - Chemical Processing, Electricals & Electronics, Mechanical/Industrial, Automotive & Transportation, Building & Construction and Others in USD Million ............................................ 415 Chart 415: Glance at 2012, 2017 and 2022 Asia-Pacific Fluoropolymers Value Market Share (%) by End-use Sector - Chemical Processing, Electricals & Electronics, Mechanical/Industrial, Automotive & Transportation, Building & Construction and Others ............................. 415
3.3.1.3 Asia-Pacific Fluoropolymers Market Overview by Fluoropolymer Type .......................................... 416 Volume Analysis .................................................... 416
Chart 416: Asia-Pacific Fluoropolymers Market Analysis (2012-2022) by Fluoropolymer Type - PTFE, FEP, PVDF, ETFE, PFA, PCTFE and ECTFE in Metric Tons ................. 416 Chart 417: Glance at 2012, 2017 and 2022 Asia-Pacific Fluoropolymers Volume Market Share (%) by Fluoropolymer Type - PTFE, FEP, PVDF, ETFE, PFA, PCTFE and ECTFE ..................................................................... 416
Value Analysis ........................................................ 417 Chart 418: Asia-Pacific Fluoropolymers Market Analysis (2012-2022) by Fluoropolymer Type - PTFE, FEP, PVDF, ETFE, PFA, PCTFE and ECTFE in USD Million .................. 417 Chart 419: Glance at 2012, 2017 and 2022 Asia-Pacific Fluoropolymers Value Market Share (%) by Fluoropolymer Type - PTFE, FEP, PVDF, ETFE, PFA, PCTFE and ECTFE ... 417
3.3.2 High Performance Polyamides ...................... 418 Chart 420: Asia-Pacific High Performance Polyamides Market Analysis (2012-2022) in Volume (Metric Tons) and Value (USD Million) ...................................................... 418
3.3.2.1 Asia-Pacific High Performance Polyamides Market Overview by Geographic Region ............... 419 Volume Analysis .................................................... 419
Chart 421: Asia-Pacific High Performance Polyamides Market Analysis (2012-2022) by Geographic Region – China, India, Japan, South Korea and Rest of Asia-Pacific in Metric Tons .................................................................. 419 Chart 422: Glance at 2012, 2017 and 2022 Asia-Pacific High Performance Polyamides Volume Market Share (%) by Geographic Region – China, India, Japan, South Korea and Rest of Asia-Pacific ................................................. 419
Value Analysis ........................................................ 420 Chart 423: Asia-Pacific High Performance Polyamides Market Analysis (2012-2022) by Geographic Region – China, India, Japan, South Korea and Rest of Asia-Pacific in USD Million ................................................................... 420 Chart 424: Glance at 2012, 2017 and 2022 Asia-Pacific High Performance Polyamides Value Market Share (%) by Geographic Region – China, India, Japan, South Korea and Rest of Asia-Pacific ....................................................... 420
3.3.2.2 Asia-Pacific High Performance Polyamides Market Overview by End-Use Sector ..................... 421

Page 15
High Performance Plastics – A Global Market Overview November 2016 |560 Pages | 642 Charts | Price $6300
Click here to buy the report
Volume Analysis ..................................................... 421 Chart 425: Asia-Pacific High Performance Polyamides Market Analysis (2012-2022) by End-Use Sector – Automotive, Electrical & Electronics, Mechanical/Industrial and Other in Metric Tons ........... 421 Chart 426: Glance at 2012, 2017 and 2022 Asia-Pacific High Performance Polyamides Volume Market Share (%) by End-Use Sector – Automotive, Electrical & Electronics, Mechanical/Industrial and Other................................... 421
Value Analysis ........................................................ 422 Chart 427: Asia-Pacific High Performance Polyamides Market Analysis (2012-2022) by End-Use Sector – Automotive, Electrical & Electronics, Mechanical/Industrial and Other in USD Million ........... 422 Chart 428: Glance at 2012, 2017 and 2022 Asia-Pacific High Performance Polyamides Value Market Share (%) by End-Use Sector – Automotive, Electrical & Electronics, Mechanical/Industrial and Other................................... 422
3.3.2.3 Asia-Pacific High Performance Polyamides Market Overview by Polyamide Type .................... 423 Volume Analysis ..................................................... 423
Chart 429: Asia-Pacific High Performance Polyamides Market Analysis (2012-2022) by Polyamide Type – Polyamide 11 & 12, Polyphthalamide/Polyamide 6T, Polyamide 46, Polyamide 9T and Polyarylamide/Polyamide MXD6 in Metric Tons ..................................................... 423 Chart 430: Glance at 2012, 2017 and 2022 Asia-Pacific High Performance Polyamides Volume Market Share (%) by Polyamide Type – Polyamide 11 & 12, Polyphthalamide/Polyamide 6T, Polyamide 46, Polyamide 9T and Polyarylamide/Polyamide MXD6 ....................... 423
Value Analysis ........................................................ 424 Chart 431: Asia-Pacific High Performance Polyamides Market Analysis (2012-2022) by Polyamide Type – Polyamide 11 & 12, Polyphthalamide/Polyamide 6T, Polyamide 46, Polyamide 9T and Polyarylamide/Polyamide MXD6 in USD Million ..................................................... 424 Chart 432: Glance at 2012, 2017 and 2022 Asia-Pacific High Performance Polyamides Value Market Share (%) by Polyamide Type – Polyamide 11 & 12, Polyphthalamide/Polyamide 6T, Polyamide 46, Polyamide 9T and Polyarylamide/Polyamide MXD6 ....................... 424
3.3.3 Sulfone Polymers .......................................... 425 Chart 433: Asia-Pacific Sulfone Polymers Market Analysis (2012-2022) in Volume (Metric Tons) and Value (USD Million) .......................................................................... 425
3.3.3.1 Asia-Pacific Sulfone Polymers Market Overview by Geographic Region ............................ 426 Volume Analysis ..................................................... 426
Chart 434: Asia-Pacific Sulfone Polymers Market Analysis (2012-2022) by Geographic Region – China, Japan, South Korea and Rest of Asia-Pacific in Metric Tons ................ 426 Chart 435: Glance at 2012, 2017 and 2022 Asia-Pacific Sulfone Polymers Volume Market Share (%) by Geographic Region – China, Japan, South Korea and Rest of Asia-Pacific ............................................................................ 426
Value Analysis ........................................................ 427 Chart 436: Asia-Pacific Sulfone Polymers Market Analysis (2012-2022) by Geographic Region – China, Japan, South Korea and Rest of Asia-Pacific in USD Million ................ 427 Chart 437: Glance at 2012, 2017 and 2022 Asia-Pacific Sulfone Polymers Value Market Share (%) by Geographic Region – China, Japan, South Korea and Rest of Asia-Pacific ............... 427
3.3.3.2 Asia-Pacific Sulfone Polymers Market Overview by End-Use Sector .................................. 428 Volume Analysis ..................................................... 428
Chart 438: Asia-Pacific Sulfone Polymers Market Analysis (2012-2022) by End-Use Sector – Aerospace & Military, Automotive, Building & Construction, Electrical & Electronics, Food & Household, Mechanical/Industrial, Medical & Healthcare and Others in Metric Tons .......... 428 Chart 439: Glance at 2012, 2017 and 2022 Asia-Pacific Sulfone Polymers Volume Market Share (%) by End-Use Sector – Aerospace & Military, Automotive, Building & Construction, Electrical & Electronics, Food & Household, Mechanical/Industrial, Medical & Healthcare and Others ............................................................... 428
Value Analysis ........................................................ 429 Chart 440: Asia-Pacific Sulfone Polymers Market Analysis (2012-2022) by End-Use Sector – Aerospace & Military, Automotive, Building & Construction, Electrical & Electronics, Food & Household, Mechanical/Industrial, Medical & Healthcare and Others in USD Million .......... 429 Chart 441: Glance at 2012, 2017 and 2022 Asia-Pacific Sulfone Polymers Value Market Share (%) by End-Use Sector – Aerospace & Military, Automotive, Building & Construction, Electrical & Electronics, Food & Household, Mechanical/Industrial, Medical & Healthcare and Others ............................................................... 429
3.3.3.3 Asia-Pacific Sulfone Polymers Market Overview by Polymer Type .................................... 430 Volume Analysis..................................................... 430
Chart 442: Asia-Pacific Sulfone Polymers Market Analysis (2012-2022) by Polymer Type – Polysulfone (PSU), Polyphenylsulfone (PPSU) and Polyethersulfone (PESU) in Metric Tons ................................................................... 430 Chart 443: Glance at 2012, 2017 and 2022 Asia-Pacific Sulfone Polymers Volume Market Share (%) by Polymer Type – Polysulfone (PSU), Polyphenylsulfone (PPSU) and Polyethersulfone (PESU) ............................................... 430
Value Analysis ........................................................ 431 Chart 444: Asia-Pacific Sulfone Polymers Market Analysis (2012-2022) by Polymer Type – Polysulfone (PSU), Polyphenylsulfone (PPSU) and Polyethersulfone (PESU) in USD Million ................................................................... 431 Chart 445: Glance at 2012, 2017 and 2022 Asia-Pacific Sulfone Polymers Value Market Share (%) by Polymer Type – Polysulfone (PSU), Polyphenylsulfone (PPSU) and Polyethersulfone (PESU) ............................................... 431
3.3.4 Polyphenylene Sulphide................................ 432 Chart 446: Asia-Pacific Polyphenylene Sulphide (PPS) Market Analysis (2012-2022) in Volume (Metric Tons) and Value (USD Million) ....................................................... 432
3.3.4.1 Asia-Pacific Polyphenylene Sulphide (PPS) Market Overview by Geographic Region ............... 433 Volume Analysis..................................................... 433
Chart 447: Asia-Pacific Polyphenylene Sulphide (PPS) Market Analysis (2012-2022) by Geographic Region - China, India, Japan, South Korea and Rest of APAC in Metric Tons ................................................................... 433 Chart 448: Glance at 2012, 2017 and 2022 Asia-Pacific Polyphenylene Sulphide (PPS) Volume Market Share (%) by Geographic Region - China, India, Japan, South Korea and Rest of APAC .......................................................... 433
Value Analysis ........................................................ 434 Chart 449: Asia-Pacific Polyphenylene Sulphide (PPS) Market Analysis (2012-2022) by Geographic Region - China, India, Japan, South Korea and Rest of APAC in USD Million ........................................................................... 434 Chart 450: Glance at 2012, 2017 and 2022 Asia-Pacific Polyphenylene Sulphide (PPS) Value Market Share (%) by Geographic Region - China, India, Japan, South Korea and Rest of APAC ................................................................. 434
3.3.4.2 Asia-Pacific Polyphenylene Sulphide (PPS) Market Overview by End-use Sector ..................... 435 Volume Analysis..................................................... 435
Chart 451: Asia-Pacific Polyphenylene Sulphide (PPS) Market Analysis (2012-2022) by End-use Sector - Automotive, Electrical & Electronics, Mechanical/Industrial and Other in Metric Tons ........... 435 Chart 452: Glance at 2012, 2017 and 2022 Asia-Pacific Polyphenylene Sulphide (PPS) Volume Market Share (%) by End-use Sector - Automotive, Electrical & Electronics, Mechanical/Industrial and Other .................................. 435
Value Analysis ........................................................ 436 Chart 453: Asia-Pacific Polyphenylene Sulphide (PPS) Market Analysis (2012-2022) by End-use Sector - Automotive, Electrical & Electronics, Mechanical/Industrial and Other in USD Million ........... 436 Chart 454: Glance at 2012, 2017 and 2022 Asia-Pacific Polyphenylene Sulphide (PPS) Value Market Share (%) by End-use Sector - Automotive, Electrical & Electronics, Mechanical/Industrial and Other .................................. 436
3.3.5 Liquid Crystal Polymers ................................. 437
Chart 455: Asia-Pacific Liquid Crystal Polymers (LCP) Market Analysis (2012-2022) in Volume (Metric Tons) and Value (USD Million) ...................................................... 437
3.3.5.1 Asia-Pacific Liquid Crystal Polymers (LCP) Market Overview by Geographic Region ............... 438 Volume Analysis .................................................... 438
Chart 456: Asia-Pacific Liquid Crystal Polymers (LCP) Market Analysis (2012-2022) by Region – China, Japan, South Korea and Rest of Asia-Pacific in Metric Tons ..... 438 Chart 457: Glance at 2012, 2017 and 2022 Asia-Pacific Liquid Crystal Polymers (LCP) Volume Market Share (%) by Region – China, Japan, South Korea and Rest of Asia-Pacific ........................................................................... 438
Value Analysis ........................................................ 439 Chart 458: Asia-Pacific Liquid Crystal Polymers (LCP) Market Analysis (2012-2022) by Region – China, Japan, South Korea and Rest of Asia-Pacific in USD Million ..... 439 Chart 459: Glance at 2012, 2017 and 2022 Asia-Pacific Liquid Crystal Polymers (LCP) Value Market Share (%) by Region – China, Japan, South Korea and Rest of Asia-Pacific ........................................................................... 439
3.3.5.2 Asia-Pacific Liquid Crystal Polymers (LCP) Market Overview by End-use Sector ..................... 440 Volume Analysis .................................................... 440
Chart 460: Asia-Pacific Liquid Crystal Polymers (LCP) Market Analysis (2012-2022) by End-use Sector – Electrical & Electronics, Automotive, Industrial and Others in Metric Tons .............................................................................. 440 Chart 461: Glance at 2012, 2017 and 2022 Asia-Pacific Liquid Crystal Polymers (LCP) Volume Market Share (%) by End-use Sector – Electrical & Electronics, Automotive, Industrial and Others .................................................... 440
Value Analysis ........................................................ 441 Chart 462: Asia-Pacific Liquid Crystal Polymers (LCP) Market Analysis (2012-2022) by End-use Sector – Electrical & Electronics, Automotive, Industrial and Others in USD Million .......................................................................... 441 Chart 463: Glance at 2012, 2017 and 2022 Asia-Pacific Liquid Crystal Polymers (LCP) Value Market Share (%) by End-use Sector – Electrical & Electronics, Automotive, Industrial and Others .................................................... 441
3.3.6 Polyetherimide ............................................. 442 Chart 464: Asia-Pacific Polyetherimide (PEI) Market Analysis (2012-2022) in Volume (Metric Tons) and Value (USD Million) ................................................................ 442
3.3.6.1 Asia-Pacific Polyetherimide (PEI) Market Overview by Geographic Region ............................ 443 Volume Analysis .................................................... 443
Chart 465: Asia-Pacific Polyetherimide (PEI) Market Analysis (2012-2022) by Geographic Region - China, India, Japan, South Korea and Rest of APAC in Metric Tons ... 443 Chart 466: Glance at 2012, 2017 and 2022 Asia-Pacific Polyetherimide (PEI) Volume Market Share (%) by Geographic Region - China, India, Japan, South Korea and Rest of APAC ................................................................. 443
Value Analysis ........................................................ 444 Chart 467: Asia-Pacific Polyetherimide (PEI) Market Analysis (2012-2022) by Geographic Region - China, India, Japan, South Korea and Rest of APAC in USD Million .... 444 Chart 468: Glance at 2012, 2017 and 2022 Asia-Pacific Polyetherimide (PEI) Value Market Share (%) by Geographic Region - China, India, Japan, South Korea and Rest of APAC ................................................................. 444
3.3.6.2 Asia-Pacific Polyetherimide (PEI) Market Overview by End-use Sector .................................. 445 Volume Analysis .................................................... 445
Chart 469: Asia-Pacific Polyetherimide (PEI) Market Analysis (2012-2022) by End-use Sector - Automotive, Electrical & Electronics, Mechanical/Industrial, Consumer Goods, Aerospace & Military and Others in Metric Tons ............................................................. 445 Chart 470: Glance at 2012, 2017 and 2022 Asia-Pacific Polyetherimide (PEI) Volume Market Share (%) by End-use Sector - Automotive, Electrical & Electronics, Mechanical/Industrial, Consumer Goods, Aerospace & Military and Others ...................................................... 445
Page 16
High Performance Plastics – A Global Market Overview November 2016 |560 Pages | 642 Charts | Price $6300
Click here to buy the report
Value Analysis ........................................................ 446 Chart 471: Asia-Pacific Polyetherimide (PEI) Market Analysis (2012-2022) by End-use Sector - Automotive, Electrical & Electronics, Mechanical/Industrial, Consumer Goods, Aerospace & Military and Others in USD Million .................. 446 Chart 472: Glance at 2012, 2017 and 2022 Asia-Pacific Polyetherimide (PEI) Value Market Share (%) by End-use Sector - Automotive, Electrical & Electronics, Mechanical/Industrial, Consumer Goods, Aerospace & Military and Others ....................................................... 446
3.3.7 Polyetheretherketone ................................... 447 Chart 473: Asia-Pacific Polyetheretherketone (PEEK) Market Analysis (2012-2022) in Volume (Metric Tons) and Value (USD Million) ....................................................... 447
3.3.7.1 Asia-Pacific Polyetheretherketone (PEEK) Market Overview by Geographic Region ............... 448 Volume Analysis ..................................................... 448
Chart 474: Asia-Pacific Polyetheretherketone (PEEK) Market Analysis (2012-2022) by Geographic Region - China, India, Japan, South Korea and Rest of APAC in Metric Tons ................................................................... 448 Chart 475: Glance at 2012, 2017 and 2022 Asia-Pacific Polyetheretherketone (PEEK) Volume Market Share (%) by Geographic Region - China, India, Japan, South Korea and Rest of APAC .................................................................. 448
Value Analysis ........................................................ 449 Chart 476: Asia-Pacific Polyetheretherketone (PEEK) Market Analysis (2012-2022) by Geographic Region - China, India, Japan, South Korea and Rest of APAC in USD Million ........................................................................... 449 Chart 477: Glance at 2012, 2017 and 2022 Asia-Pacific Polyetheretherketone (PEEK) Value Market Share (%) by Geographic Region - China, India, Japan, South Korea and Rest of APAC .................................................................. 449
3.3.7.2 Asia-Pacific Polyetheretherketone (PEEK) Market Overview by End-use Sector...................... 450 Volume Analysis ..................................................... 450
Chart 478: Asia-Pacific Polyetheretherketone (PEEK) Market Analysis (2012-2022) by End-use Sector - Automotive, Electrical & Electronics, Mechanical/Industrial, Medical & Healthcare, Aerospace & Military and Others in Metric Tons ................................ 450 Chart 479: Glance at 2012, 2017 and 2022 Asia-Pacific Polyetheretherketone (PEEK) Volume Market Share (%) by End-use Sector - Automotive, Electrical & Electronics, Mechanical/Industrial, Medical & Healthcare, Aerospace & Military and Others ....................................................... 450
Value Analysis ........................................................ 451 Chart 480: Asia-Pacific Polyetheretherketone (PEEK) Market Analysis (2012-2022) by End-use Sector - Automotive, Electrical & Electronics, Mechanical/Industrial, Medical & Healthcare, Aerospace & Military and Others in USD Million .................. 451 Chart 481: Glance at 2012, 2017 and 2022 Asia-Pacific Polyetheretherketone (PEEK) Value Market Share (%) by End-use Sector - Automotive, Electrical & Electronics, Mechanical/Industrial, Medical & Healthcare, Aerospace & Military and Others ....................................................... 451
3.4 Asia-Pacific High Performance Plastics Market Overview by Country ............................................. 452
3.4.1 China ......................................................... 452 Chart 482: Chinese High Performance Plastics Market Analysis (2012-2022) in Volume (Metric Tons) and Value (USD Million) ................................................................. 452
3.4.1.1 Chinese High Performance Plastics Market Overview by End-use Sector .................................. 453 Volume Analysis ..................................................... 453
Chart 483: Chinese High Performance Plastics Market Analysis (2012-2022) by End-use Sector - Automotive & Transportation, Building & Construction, Consumer Goods, Electrical & Electronics, Mechanical/Industrial and Other in Metric Tons ..................................................... 453 Chart 484: Glance at 2012, 2017 and 2022 Chinese High Performance Plastics Volume Market Share (%) by End-use Sector - Automotive & Transportation, Building & Construction, Consumer Goods, Electrical & Electronics, Mechanical/Industrial and Other................................... 453
Value Analysis ........................................................ 454 Chart 485: Chinese High Performance Plastics Market Analysis (2012-2022) by End-use Sector - Automotive & Transportation, Building & Construction, Consumer Goods, Electrical & Electronics, Mechanical/Industrial and Other in USD Million ..................................................... 454 Chart 486: Glance at 2012, 2017 and 2022 Chinese High Performance Plastics Value Market Share (%) by End-use Sector - Automotive & Transportation, Building & Construction, Consumer Goods, Electrical & Electronics, Mechanical/Industrial and Other .................................. 454
3.4.1.2 Chinese High Performance Plastics Market Overview by Plastic Type ....................................... 455 Volume Analysis..................................................... 455
Chart 487: Chinese High Performance Plastics Market Analysis (2012-2022) by Plastic Type - Fluoropolymers, High Performance Polyamides, Sulfone Polymers, Polyphenylene Sulphide, Liquid Crystal Polymers, Polyetherimide and Polyetheretherketone in Metric Tons ............................... 455 Chart 488: Glance at 2012, 2017 and 2022 Chinese High Performance Plastics Volume Market Share (%) by Plastic Type - Fluoropolymers, High Performance Polyamides, Sulfone Polymers, Polyphenylene Sulphide, Liquid Crystal Polymers, Polyetherimide and Polyetheretherketone .. 455
Value Analysis ........................................................ 456 Chart 489: Chinese High Performance Plastics Market Analysis (2012-2022) by Plastic Type - Fluoropolymers, High Performance Polyamides, Sulfone Polymers, Polyphenylene Sulphide, Liquid Crystal Polymers, Polyetherimide and Polyetheretherketone in USD Million ............................... 456 Chart 490: Glance at 2012, 2017 and 2022 Chinese High Performance Plastics Value Market Share (%) by Plastic Type - Fluoropolymers, High Performance Polyamides, Sulfone Polymers, Polyphenylene Sulphide, Liquid Crystal Polymers, Polyetherimide and Polyetheretherketone .. 456
3.4.1.2.1 Chinese Fluoropolymers Market Overview by Fluoropolymer Type .......................................... 457 Volume Analysis..................................................... 457
Chart 491: Chinese Fluoropolymers Market Analysis (2012-2022) by Fluoropolymer Type - PTFE, FEP, PVDF, ETFE, PFA, PCTFE and ECTFE in Metric Tons ........................... 457 Chart 492: Glance at 2012, 2017 and 2022 Chinese Fluoropolymers Volume Market Share (%) by Fluoropolymer Type - PTFE, FEP, PVDF, ETFE, PFA, PCTFE and ECTFE ..................................................................... 457
Value Analysis ........................................................ 458 Chart 493: Chinese Fluoropolymers Market Analysis (2012-2022) by Fluoropolymer Type - PTFE, FEP, PVDF, ETFE, PFA, PCTFE and ECTFE in USD Million............................ 458 Chart 494: Glance at 2012, 2017 and 2022 Chinese Fluoropolymers Value Market Share (%) by Fluoropolymer Type - PTFE, FEP, PVDF, ETFE, PFA, PCTFE and ECTFE .... 458
3.4.1.2.2 Chinese High Performance Polyamides Market Overview by Polyamide Type .................... 459 Volume Analysis..................................................... 459
Chart 495: Chinese High Performance Polyamides Market Analysis (2012-2022) by Polyamide Type – Polyamide 11 & 12, Polyphthalamide/Polyamide 6T, Polyamide 46, Polyamide 9T and Polyarylamide/Polyamide MXD6 in Metric Tons ................................................................... 459 Chart 496: Glance at 2012, 2017 and 2022 Chinese High Performance Polyamides Volume Market Share (%) by Polyamide Type – Polyamide 11 & 12, Polyphthalamide/Polyamide 6T, Polyamide 46, Polyamide 9T and Polyarylamide/Polyamide MXD6 ....................... 459
Value Analysis ........................................................ 460 Chart 497: Chinese High Performance Polyamides Market Analysis (2012-2022) by Polyamide Type – Polyamide 11 & 12, Polyphthalamide/Polyamide 6T, Polyamide 46, Polyamide 9T and Polyarylamide/Polyamide MXD6 in USD Million ........................................................................... 460 Chart 498: Glance at 2012, 2017 and 2022 Chinese High Performance Polyamides Value Market Share (%) by Polyamide Type – Polyamide 11 & 12, Polyphthalamide/Polyamide 6T, Polyamide 46, Polyamide 9T and Polyarylamide/Polyamide MXD6 ....................... 460
3.4.1.2.3 Chinese Sulfone Polymers Market Overview by Polymer Type .................................................... 461 Volume Analysis .................................................... 461
Chart 499: Chinese Sulfone Polymers Market Analysis (2012-2022) by Polymer Type – Polysulfone (PSU), Polyphenylsulfone (PPSU) and Polyethersulfone (PESU) in Metric Tons .................................................................. 461 Chart 500: Glance at 2012, 2017 and 2022 Chinese Sulfone Polymers Volume Market Share (%) by Polymer Type – Polysulfone (PSU), Polyphenylsulfone (PPSU) and Polyethersulfone (PESU) ............................................... 461
Value Analysis ........................................................ 462 Chart 501: Chinese Sulfone Polymers Market Analysis (2012-2022) by Polymer Type – Polysulfone (PSU), Polyphenylsulfone (PPSU) and Polyethersulfone (PESU) in USD Million ................................................................... 462 Chart 502: Glance at 2012, 2017 and 2022 Chinese Sulfone Polymers Value Market Share (%) by Polymer Type – Polysulfone (PSU), Polyphenylsulfone (PPSU) and Polyethersulfone (PESU) ............................................... 462
3.4.2 India........................................................... 463 Chart 503: Indian High Performance Plastics Market Analysis (2012-2022) in Volume (Metric Tons) and Value (USD Million) ................................................................ 463
3.4.2.1 Indian High Performance Plastics Market Overview by End-use Sector .................................. 464 Volume Analysis .................................................... 464
Chart 504: Indian High Performance Plastics Market Analysis (2012-2022) by End-use Sector - Automotive & Transportation, Building & Construction, Consumer Goods, Electrical & Electronics, Mechanical/Industrial and Other in Metric Tons .................................................... 464 Chart 505: Glance at 2012, 2017 and 2022 Indian High Performance Plastics Volume Market Share (%) by End-use Sector - Automotive & Transportation, Building & Construction, Consumer Goods, Electrical & Electronics, Mechanical/Industrial and Other .................................. 464
Value Analysis ........................................................ 465 Chart 506: Indian High Performance Plastics Market Analysis (2012-2022) by End-use Sector - Automotive & Transportation, Building & Construction, Consumer Goods, Electrical & Electronics, Mechanical/Industrial and Other in USD Million ..................................................... 465 Chart 507: Glance at 2012, 2017 and 2022 Indian High Performance Plastics Value Market Share (%) by End-use Sector - Automotive & Transportation, Building & Construction, Consumer Goods, Electrical & Electronics, Mechanical/Industrial and Other .................................. 465
3.4.2.2 Indian High Performance Plastics Market Overview by Plastic Type ....................................... 466 Volume Analysis .................................................... 466
Chart 508: Indian High Performance Plastics Market Analysis (2012-2022) by Plastic Type - Fluoropolymers, High Performance Polyamides, Sulfone Polymers, Polyphenylene Sulphide, Liquid Crystal Polymers, Polyetherimide and Polyetheretherketone in Metric Tons ........................................................................ 466 Chart 509: Glance at 2012, 2017 and 2022 Indian High Performance Plastics Volume Market Share (%) by Plastic Type - Fluoropolymers, High Performance Polyamides, Sulfone Polymers, Polyphenylene Sulphide, Liquid Crystal Polymers, Polyetherimide and Polyetheretherketone .. 466
Value Analysis ........................................................ 467 Chart 510: Indian High Performance Plastics Market Analysis (2012-2022) by Plastic Type - Fluoropolymers, High Performance Polyamides, Sulfone Polymers, Polyphenylene Sulphide, Liquid Crystal Polymers, Polyetherimide and Polyetheretherketone in USD Million ..................................................................... 467 Chart 511: Glance at 2012, 2017 and 2022 Indian High Performance Plastics Value Market Share (%) by Plastic Type - Fluoropolymers, High Performance Polyamides, Sulfone Polymers, Polyphenylene Sulphide, Liquid Crystal Polymers, Polyetherimide and Polyetheretherketone .. 467
Page 17
High Performance Plastics – A Global Market Overview November 2016 |560 Pages | 642 Charts | Price $6300
Click here to buy the report
3.4.2.2.1 Indian Fluoropolymers Market Overview by Fluoropolymer Type............................................... 468 Volume Analysis ..................................................... 468
Chart 512: Indian Fluoropolymers Market Analysis (2012-2022) by Fluoropolymer Type - PTFE, FEP, PVDF, ETFE, PFA and ECTFE in Metric Tons .............................................. 468 Chart 513: Glance at 2012, 2017 and 2022 Indian Fluoropolymers Volume Market Share (%) by Fluoropolymer Type - PTFE, FEP, PVDF, ETFE, PFA and ECTFE ................... 468
Value Analysis ........................................................ 469 Chart 514: Indian Fluoropolymers Market Analysis (2012-2022) by Fluoropolymer Type - PTFE, FEP, PVDF, ETFE, PFA and ECTFE in USD Million .............................................. 469 Chart 515: Glance at 2012, 2017 and 2022 Indian Fluoropolymers Value Market Share (%) by Fluoropolymer Type - PTFE, FEP, PVDF, ETFE, PFA and ECTFE ................ 469
3.4.2.2.2 Indian High Performance Polyamides Market Overview by Polyamide Type ................................. 470 Volume Analysis ..................................................... 470
Chart 516: Indian High Performance Polyamides Market Analysis (2012-2022) by Polyamide Type – Polyamide 11 & 12, Polyphthalamide/Polyamide 6T, Polyamide 46, Polyamide 9T and Polyarylamide/Polyamide MXD6 in Metric Tons ................................................................... 470 Chart 517: Glance at 2012, 2017 and 2022 Indian High Performance Polyamides Volume Market Share (%) by Polyamide Type – Polyamide 11 & 12, Polyphthalamide/Polyamide 6T, Polyamide 46, Polyamide 9T and Polyarylamide/Polyamide MXD6 ....................... 470
Value Analysis ........................................................ 471 Chart 518: Indian High Performance Polyamides Market Analysis (2012-2022) by Polyamide Type – Polyamide 11 & 12, Polyphthalamide/Polyamide 6T, Polyamide 46, Polyamide 9T and Polyarylamide/Polyamide MXD6 in USD Million ........................................................................... 471 Chart 519: Glance at 2012, 2017 and 2022 Indian High Performance Polyamides Value Market Share (%) by Polyamide Type – Polyamide 11 & 12, Polyphthalamide/Polyamide 6T, Polyamide 46, Polyamide 9T and Polyarylamide/Polyamide MXD6 ....................... 471
3.4.2.2.3 Indian Sulfone Polymers Market Overview by Polymer Type .................................................... 472 Volume Analysis ..................................................... 472
Chart 520: Indian Sulfone Polymers Market Analysis (2012-2022) by Polymer Type – Polysulfone (PSU), Polyphenylsulfone (PPSU) and Polyethersulfone (PESU) in Metric Tons ............. 472 Chart 521: Glance at 2012, 2017 and 2022 Indian Sulfone Polymers Volume Market Share (%) by Polymer Type – Polysulfone (PSU), Polyphenylsulfone (PPSU) and Polyethersulfone (PESU) ................................................ 472
Value Analysis ........................................................ 473 Chart 522: Indian Sulfone Polymers Market Analysis (2012-2022) by Polymer Type – Polysulfone (PSU), Polyphenylsulfone (PPSU) and Polyethersulfone (PESU) in USD Million ................................................................... 473 Chart 523: Glance at 2012, 2017 and 2022 Indian Sulfone Polymers Value Market Share (%) by Polymer Type – Polysulfone (PSU), Polyphenylsulfone (PPSU) and Polyethersulfone (PESU) ................................................ 473
3.4.3 Japan ......................................................... 474 Chart 524: Japanese High Performance Plastics Market Analysis (2012-2022) in Volume (Metric Tons) and Value (USD Million) ................................................................. 474
3.4.3.1 Japanese High Performance Plastics Market Overview by End-use Sector .................................. 475 Volume Analysis ..................................................... 475
Chart 525: Japanese High Performance Plastics Market Analysis (2012-2022) by End-use Sector - Automotive & Transportation, Building & Construction, Consumer Goods, Electrical & Electronics, Mechanical/Industrial and Other in Metric Tons ..................................................... 475 Chart 526: Glance at 2012, 2017 and 2022 Japanese High Performance Plastics Volume Market Share (%) by End-use Sector - Automotive & Transportation, Building & Construction, Consumer Goods, Electrical & Electronics, Mechanical/Industrial and Other................................... 475
Value Analysis ........................................................ 476 Chart 527: Japanese High Performance Plastics Market Analysis (2012-2022) by End-use Sector - Automotive & Transportation, Building & Construction, Consumer Goods, Electrical & Electronics, Mechanical/Industrial and Other in USD Million ..................................................... 476 Chart 528: Glance at 2012, 2017 and 2022 Japanese High Performance Plastics Value Market Share (%) by End-use Sector - Automotive & Transportation, Building & Construction, Consumer Goods, Electrical & Electronics, Mechanical/Industrial and Other .................................. 476
3.4.3.2 Japanese High Performance Plastics Market Overview by Plastic Type ....................................... 477 Volume Analysis..................................................... 477
Chart 529: Japanese High Performance Plastics Market Analysis (2012-2022) by Plastic Type - Fluoropolymers, High Performance Polyamides, Sulfone Polymers, Polyphenylene Sulphide, Liquid Crystal Polymers, Polyetherimide and Polyetheretherketone in Metric Tons ............................... 477 Chart 530: Glance at 2012, 2017 and 2022 Japanese High Performance Plastics Volume Market Share (%) by Plastic Type - Fluoropolymers, High Performance Polyamides, Sulfone Polymers, Polyphenylene Sulphide, Liquid Crystal Polymers, Polyetherimide and Polyetheretherketone .. 477
Value Analysis ........................................................ 478 Chart 531: Japanese High Performance Plastics Market Analysis (2012-2022) by Plastic Type - Fluoropolymers, High Performance Polyamides, Sulfone Polymers, Polyphenylene Sulphide, Liquid Crystal Polymers, Polyetherimide and Polyetheretherketone in USD Million ............................... 478 Chart 532: Glance at 2012, 2017 and 2022 Japanese High Performance Plastics Value Market Share (%) by Plastic Type - Fluoropolymers, High Performance Polyamides, Sulfone Polymers, Polyphenylene Sulphide, Liquid Crystal Polymers, Polyetherimide and Polyetheretherketone .. 478
3.4.3.2.1 Japanese Fluoropolymers Market Overview by Fluoropolymer Type .......................................... 479 Volume Analysis..................................................... 479
Chart 533: Japanese Fluoropolymers Market Analysis (2012-2022) by Fluoropolymer Type - PTFE, FEP, PVDF, ETFE, PFA, PCTFE and ECTFE in Metric Tons .................. 479 Chart 534: Glance at 2012, 2017 and 2022 Japanese Fluoropolymers Volume Market Share (%) by Fluoropolymer Type - PTFE, FEP, PVDF, ETFE, PFA, PCTFE and ECTFE ..................................................................... 479
Value Analysis ........................................................ 480 Chart 535: Japanese Fluoropolymers Market Analysis (2012-2022) by Fluoropolymer Type - PTFE, FEP, PVDF, ETFE, PFA, PCTFE and ECTFE in USD Million .................. 480 Chart 536: Glance at 2012, 2017 and 2022 Japanese Fluoropolymers Value Market Share (%) by Fluoropolymer Type - PTFE, FEP, PVDF, ETFE, PFA, PCTFE and ECTFE .... 480
3.4.3.2.2 Japanese High Performance Polyamides Market Overview by Polyamide Type .................... 481 Volume Analysis..................................................... 481
Chart 537: Japanese High Performance Polyamides Market Analysis (2012-2022) by Polyamide Type – Polyamide 11 & 12, Polyphthalamide/Polyamide 6T, Polyamide 46, Polyamide 9T and Polyarylamide/Polyamide MXD6 in Metric Tons ................................................................... 481 Chart 538: Glance at 2012, 2017 and 2022 Japanese High Performance Polyamides Volume Market Share (%) by Polyamide Type – Polyamide 11 & 12, Polyphthalamide/Polyamide 6T, Polyamide 46, Polyamide 9T and Polyarylamide/Polyamide MXD6 ....................... 481
Value Analysis ........................................................ 482 Chart 539: Japanese High Performance Polyamides Market Analysis (2012-2022) by Polyamide Type – Polyamide 11 & 12, Polyphthalamide/Polyamide 6T, Polyamide 46, Polyamide 9T and Polyarylamide/Polyamide MXD6 in USD Million ........................................................................... 482 Chart 540: Glance at 2012, 2017 and 2022 Japanese High Performance Polyamides Value Market Share (%) by Polyamide Type – Polyamide 11 & 12, Polyphthalamide/Polyamide 6T, Polyamide 46, Polyamide 9T and Polyarylamide/Polyamide MXD6 ....................... 482
3.4.3.2.3 Japanese Sulfone Polymers Market Overview by Polymer Type .................................... 483 Volume Analysis .................................................... 483
Chart 541: Japanese Sulfone Polymers Market Analysis (2012-2022) by Polymer Type – Polysulfone (PSU), Polyphenylsulfone (PPSU) and Polyethersulfone (PESU) in Metric Tons .................................................................. 483 Chart 542: Glance at 2012, 2017 and 2022 Japanese Sulfone Polymers Volume Market Share (%) by Polymer Type – Polysulfone (PSU), Polyphenylsulfone (PPSU) and Polyethersulfone (PESU) ............................................... 483
Value Analysis ........................................................ 484 Chart 543: Japanese Sulfone Polymers Market Analysis (2012-2022) by Polymer Type – Polysulfone (PSU), Polyphenylsulfone (PPSU) and Polyethersulfone (PESU) in USD Million ................................................................... 484 Chart 544: Glance at 2012, 2017 and 2022 Japanese Sulfone Polymers Value Market Share (%) by Polymer Type – Polysulfone (PSU), Polyphenylsulfone (PPSU) and Polyethersulfone (PESU) ............................................... 484
3.4.4 South Korea ............................................... 485 Chart 545: South Korean High Performance Plastics Market Analysis (2012-2022) in Volume (Metric Tons) and Value (USD Million) ...................................................... 485
3.4.4.1 South Korean High Performance Plastics Market Overview by End-use Sector ..................... 486 Volume Analysis .................................................... 486
Chart 546: South Korean High Performance Plastics Market Analysis (2012-2022) by End-use Sector - Automotive & Transportation, Building & Construction, Consumer Goods, Electrical & Electronics, Mechanical/Industrial and Other in Metric Tons .......... 486 Chart 547: Glance at 2012, 2017 and 2022 South Korean High Performance Plastics Volume Market Share (%) by End-use Sector - Automotive & Transportation, Building & Construction, Consumer Goods, Electrical & Electronics, Mechanical/Industrial and Other .................................. 486
Value Analysis ........................................................ 487 Chart 548: South Korean High Performance Plastics Market Analysis (2012-2022) by End-use Sector - Automotive & Transportation, Building & Construction, Consumer Goods, Electrical & Electronics, Mechanical/Industrial and Other in USD Million .......... 487 Chart 549: Glance at 2012, 2017 and 2022 South Korean High Performance Plastics Value Market Share (%) by End-use Sector - Automotive & Transportation, Building & Construction, Consumer Goods, Electrical & Electronics, Mechanical/Industrial and Other .................................. 487
3.4.4.2 South Korean High Performance Plastics Market Overview by Plastic Type .......................... 488 Volume Analysis .................................................... 488
Chart 550: South Korean High Performance Plastics Market Analysis (2012-2022) by Plastic Type - Fluoropolymers, High Performance Polyamides, Sulfone Polymers, Polyphenylene Sulphide, Liquid Crystal Polymers, Polyetherimide and Polyetheretherketone in Metric Tons .................................................................. 488 Chart 551: Glance at 2012, 2017 and 2022 South Korean High Performance Plastics Volume Market Share (%) by Plastic Type - Fluoropolymers, High Performance Polyamides, Sulfone Polymers, Polyphenylene Sulphide, Liquid Crystal Polymers, Polyetherimide and Polyetheretherketone .................................................. 488
Value Analysis ........................................................ 489 Chart 552: South Korean High Performance Plastics Market Analysis (2012-2022) by Plastic Type - Fluoropolymers, High Performance Polyamides, Sulfone Polymers, Polyphenylene Sulphide, Liquid Crystal Polymers, Polyetherimide and Polyetheretherketone in USD Million ................................................................... 489 Chart 553: Glance at 2012, 2017 and 2022 South Korean High Performance Plastics Value Market Share (%) by Plastic Type - Fluoropolymers, High Performance Polyamides, Sulfone Polymers, Polyphenylene Sulphide, Liquid Crystal Polymers, Polyetherimide and Polyetheretherketone .................................................. 489
Page 18
High Performance Plastics – A Global Market Overview November 2016 |560 Pages | 642 Charts | Price $6300
Click here to buy the report
3.4.4.2.1 South Korean Fluoropolymers Market Overview by Fluoropolymer Type .......................... 490 Volume Analysis ..................................................... 490
Chart 554: South Korean Fluoropolymers Market Analysis (2012-2022) by Fluoropolymer Type - PTFE, FEP, PVDF, ETFE, PFA, PCTFE and ECTFE in Metric Tons .................. 490 Chart 555: Glance at 2012, 2017 and 2022 South Korean Fluoropolymers Volume Market Share (%) by Fluoropolymer Type - PTFE, FEP, PVDF, ETFE, PFA, PCTFE and ECTFE ....... 490
Value Analysis ........................................................ 491 Chart 556: South Korean Fluoropolymers Market Analysis (2012-2022) by Fluoropolymer Type - PTFE, FEP, PVDF, ETFE, PFA, PCTFE and ECTFE in USD Million ................... 491 Chart 557: Glance at 2012, 2017 and 2022 South Korean Fluoropolymers Value Market Share (%) by Fluoropolymer Type - PTFE, FEP, PVDF, ETFE, PFA, PCTFE and ECTFE .... 491
3.4.4.2.2 South Korean High Performance Polyamides Market Overview by Polyamide Type .................... 492 Volume Analysis ..................................................... 492
Chart 558: South Korean High Performance Polyamides Market Analysis (2012-2022) by Polyamide Type – Polyamide 11 & 12, Polyphthalamide/Polyamide 6T, Polyamide 46, Polyamide 9T and Polyarylamide/Polyamide MXD6 in Metric Tons ..................................................... 492 Chart 559: Glance at 2012, 2017 and 2022 South Korean High Performance Polyamides Volume Market Share (%) by Polyamide Type – Polyamide 11 & 12, Polyphthalamide/Polyamide 6T, Polyamide 46, Polyamide 9T and Polyarylamide/Polyamide MXD6 ....................... 492
Value Analysis ........................................................ 493 Chart 560: South Korean High Performance Polyamides Market Analysis (2012-2022) by Polyamide Type – Polyamide 11 & 12, Polyphthalamide/Polyamide 6T, Polyamide 46, Polyamide 9T and Polyarylamide/Polyamide MXD6 in USD Million ..................................................... 493 Chart 561: Glance at 2012, 2017 and 2022 South Korean High Performance Polyamides Value Market Share (%) by Polyamide Type – Polyamide 11 & 12, Polyphthalamide/Polyamide 6T, Polyamide 46, Polyamide 9T and Polyarylamide/Polyamide MXD6 ....................... 493
3.4.4.2.3 South Korean Sulfone Polymers Market Overview by Polymer Type .................................... 494 Volume Analysis ..................................................... 494
Chart 562: South Korean Sulfone Polymers Market Analysis (2012-2022) by Polymer Type – Polysulfone (PSU), Polyphenylsulfone (PPSU) and Polyethersulfone (PESU) in Metric Tons ................................................................... 494 Chart 563: Glance at 2012, 2017 and 2022 South Korean Sulfone Polymers Volume Market Share (%) by Polymer Type – Polysulfone (PSU), Polyphenylsulfone (PPSU) and Polyethersulfone (PESU) ................................................ 494
Value Analysis ........................................................ 495 Chart 564: South Korean Sulfone Polymers Market Analysis (2012-2022) by Polymer Type – Polysulfone (PSU), Polyphenylsulfone (PPSU) and Polyethersulfone (PESU) in USD Million .................................................................................... 495 Chart 565: Glance at 2012, 2017 and 2022 South Korean Sulfone Polymers Value Market Share (%) by Polymer Type – Polysulfone (PSU), Polyphenylsulfone (PPSU) and Polyethersulfone (PESU) ................................................ 495
3.4.5 Rest of APAC .............................................. 496 Chart 566: Rest of APAC High Performance Plastics Market Analysis (2012-2022) in Volume (Metric Tons) and Value (USD Million) ................................................................. 496
3.4.5.1 Rest of APAC High Performance Plastics Market Overview by End-use Sector...................... 497 Volume Analysis ..................................................... 497
Chart 567: Rest of APAC High Performance Plastics Market Analysis (2012-2022) by End-use Sector - Automotive & Transportation, Building & Construction, Consumer Goods, Electrical & Electronics, Mechanical/Industrial and Other in Metric Tons ..................................................... 497 Chart 568: Glance at 2012, 2017 and 2022 Rest of APAC High Performance Plastics Volume Market Share (%) by End-use Sector - Automotive & Transportation, Building & Construction, Consumer Goods, Electrical & Electronics, Mechanical/Industrial and Other................................... 497
Value Analysis ........................................................ 498 Chart 569: Rest of APAC High Performance Plastics Market Analysis (2012-2022) by End-use Sector - Automotive & Transportation, Building & Construction, Consumer Goods, Electrical & Electronics, Mechanical/Industrial and Other in USD Million ..................................................... 498 Chart 570: Glance at 2012, 2017 and 2022 Rest of APAC High Performance Plastics Value Market Share (%) by End-use Sector - Automotive & Transportation, Building & Construction, Consumer Goods, Electrical & Electronics, Mechanical/Industrial and Other .................................. 498
3.4.5.2 Rest of APAC High Performance Plastics Market Overview by Plastic Type........................... 499 Volume Analysis..................................................... 499
Chart 571: Rest of APAC High Performance Plastics Market Analysis (2012-2022) by Plastic Type - Fluoropolymers, High Performance Polyamides, Sulfone Polymers, Polyphenylene Sulphide, Liquid Crystal Polymers, Polyetherimide and Polyetheretherketone in Metric Tons ............................... 499 Chart 572: Glance at 2012, 2017 and 2022 Rest of APAC High Performance Plastics Volume Market Share (%) by Plastic Type - Fluoropolymers, High Performance Polyamides, Sulfone Polymers, Polyphenylene Sulphide, Liquid Crystal Polymers, Polyetherimide and Polyetheretherketone ..... 499
Value Analysis ........................................................ 500 Chart 573: Rest of APAC High Performance Plastics Market Analysis (2012-2022) by Plastic Type - Fluoropolymers, High Performance Polyamides, Sulfone Polymers, Polyphenylene Sulphide, Liquid Crystal Polymers, Polyetherimide and Polyetheretherketone in USD Million ............................... 500 Chart 574: Glance at 2012, 2017 and 2022 Rest of APAC High Performance Plastics Value Market Share (%) by Plastic Type - Fluoropolymers, High Performance Polyamides, Sulfone Polymers, Polyphenylene Sulphide, Liquid Crystal Polymers, Polyetherimide and Polyetheretherketone ................................................... 500
3.4.5.2.1 Rest of Asia-Pacific Fluoropolymers Market Overview by Fluoropolymer Type .......................... 501 Volume Analysis..................................................... 501
Chart 575: Rest of Asia-Pacific Fluoropolymers Market Analysis (2012-2022) by Fluoropolymer Type - PTFE, FEP, PVDF, ETFE, PFA, PCTFE and ECTFE in Metric Tons ........ 501 Chart 576: Glance at 2012, 2017 and 2022 Rest of Asia-Pacific Fluoropolymers Volume Market Share (%) by Fluoropolymer Type - PTFE, FEP, PVDF, ETFE, PFA, PCTFE and ECTFE ..................................................................... 501
Value Analysis ........................................................ 502 Chart 577: Rest of Asia-Pacific Fluoropolymers Market Analysis (2012-2022) by Fluoropolymer Type - PTFE, FEP, PVDF, ETFE, PFA, PCTFE and ECTFE in USD Million ........ 502 Chart 578: Glance at 2012, 2017 and 2022 Rest of Asia-Pacific Fluoropolymers Value Market Share (%) by Fluoropolymer Type - PTFE, FEP, PVDF, ETFE, PFA, PCTFE and ECTFE ........... 502
3.4.5.2.2 Rest of Asia-Pacific High Performance Polyamides Market Overview by Polyamide Type . 503 Volume Analysis..................................................... 503
Chart 579: Rest of Asia-Pacific High Performance Polyamides Market Analysis (2012-2022) by Polyamide Type – Polyamide 11 & 12, Polyphthalamide/Polyamide 6T, Polyamide 46, Polyamide 9T and Polyarylamide/Polyamide MXD6 in Metric Tons ........... 503 Chart 580: Glance at 2012, 2017 and 2022 Rest of Asia-Pacific High Performance Polyamides Volume Market Share (%) by Polyamide Type – Polyamide 11 & 12, Polyphthalamide/Polyamide 6T, Polyamide 46, Polyamide 9T and Polyarylamide/Polyamide MXD6 ....................... 503
Value Analysis ........................................................ 504 Chart 581: Rest of Asia-Pacific High Performance Polyamides Market Analysis (2012-2022) by Polyamide Type – Polyamide 11 & 12, Polyphthalamide/Polyamide 6T, Polyamide 46, Polyamide 9T and Polyarylamide/Polyamide MXD6 in USD Million ........... 504 Chart 582: Glance at 2012, 2017 and 2022 Rest of Asia-Pacific High Performance Polyamides Value Market Share (%) by Polyamide Type – Polyamide 11 & 12, Polyphthalamide/Polyamide 6T, Polyamide 46, Polyamide 9T and Polyarylamide/Polyamide MXD6 ....................... 504
3.4.5.2.3 Rest of Asia-Pacific Sulfone Polymers Market Overview by Polymer Type .................................... 505 Volume Analysis .................................................... 505
Chart 583: Rest of Asia-Pacific Sulfone Polymers Market Analysis (2012-2022) by Polymer Type – Polysulfone (PSU), Polyphenylsulfone (PPSU) and Polyethersulfone (PESU) in Metric Tons .................................................................. 505 Chart 584: Glance at 2012, 2017 and 2022 Rest of Asia-Pacific Sulfone Polymers Volume Market Share (%) by Polymer Type – Polysulfone (PSU), Polyphenylsulfone (PPSU) and Polyethersulfone (PESU) ............................ 505
Value Analysis ........................................................ 506 Chart 585: Rest of Asia-Pacific Sulfone Polymers Market Analysis (2012-2022) by Polymer Type – Polysulfone (PSU), Polyphenylsulfone (PPSU) and Polyethersulfone (PESU) in USD Million ................................................................... 506 Chart 586: Glance at 2012, 2017 and 2022 Rest of Asia-Pacific Sulfone Polymers Value Market Share (%) by Polymer Type – Polysulfone (PSU), Polyphenylsulfone (PPSU) and Polyethersulfone (PESU) ............................ 506
4. REST OF WORLD .............................................. 507 Chart 587: Rest of World High Performance Plastics Market Analysis (2012-2022) in Volume (Metric Tons) and Value (USD Million) ...................................................... 507
4.1 Rest of World High Performance Plastics Market Overview by End-use Sector .................................. 508 Volume Analysis .................................................... 508
Chart 588: Rest of World High Performance Plastics Market Analysis (2012-2022) by End-use Sector - Automotive & Transportation, Building & Construction, Consumer Goods, Electrical & Electronics, Mechanical/Industrial and Other in Metric Tons .......... 508 Chart 589: Glance at 2012, 2017 and 2022 Rest of World High Performance Plastics Volume Market Share (%) by End-use Sector - Automotive & Transportation, Building & Construction, Consumer Goods, Electrical & Electronics, Mechanical/Industrial and Other .................................. 508
Value Analysis ........................................................ 509 Chart 590: Rest of World High Performance Plastics Market Analysis (2012-2022) by End-use Sector - Automotive & Transportation, Building & Construction, Consumer Goods, Electrical & Electronics, Mechanical/Industrial and Other in USD Million .......... 509 Chart 591: Glance at 2012, 2017 and 2022 Rest of World High Performance Plastics Value Market Share (%) by End-use Sector - Automotive & Transportation, Building & Construction, Consumer Goods, Electrical & Electronics, Mechanical/Industrial and Other .................................. 509
4.2 Rest of World High Performance Plastics Market Overview by Plastic Type ....................................... 510 Value Analysis ........................................................ 510
Chart 592: Rest of World High Performance Plastics Market Analysis (2012-2022) by Plastic Type - Fluoropolymers, High Performance Polyamides, Sulfone Polymers, Polyphenylene Sulphide, Liquid Crystal Polymers, Polyetherimide and Polyetheretherketone in Metric Tons .................................................................. 510 Chart 593: Glance at 2012, 2017 and 2022 Rest of World High Performance Plastics Volume Market Share (%) by Plastic Type - Fluoropolymers, High Performance Polyamides, Sulfone Polymers, Polyphenylene Sulphide, Liquid Crystal Polymers, Polyetherimide and Polyetheretherketone .................................................. 510
Value Analysis ........................................................ 511 Chart 594: Rest of World High Performance Plastics Market Analysis (2012-2022) by Plastic Type - Fluoropolymers, High Performance Polyamides, Sulfone Polymers, Polyphenylene Sulphide, Liquid Crystal Polymers, Polyetherimide and Polyetheretherketone in USD Million ................................................................... 511 Chart 595: Glance at 2012, 2017 and 2022 Rest of World High Performance Plastics Value Market Share (%) by Plastic Type - Fluoropolymers, High Performance Polyamides, Sulfone Polymers, Polyphenylene Sulphide, Liquid Crystal Polymers, Polyetherimide and Polyetheretherketone .................................................. 511
Page 19
High Performance Plastics – A Global Market Overview November 2016 |560 Pages | 642 Charts | Price $6300
Click here to buy the report
4.2.1 Fluoropolymers ............................................. 512 Chart 596: Rest of World Fluoropolymers Market Analysis (2012-2022) in Volume (Metric Tons) and Value (USD Million) ........... 512
4.2.1.1 Rest of World Fluoropolymers Market Overview by End-use Sector .................................. 513 Volume Analysis ..................................................... 513
Chart 597: Rest of World Fluoropolymers Market Analysis (2012-2022) by End-use Sector - Chemical Processing, Electrical & Electronics, Mechanical/Industrial, Automotive & Transportation, Building & Construction and Others in Metric Tons ............................................. 513 Chart 598: Glance at 2012, 2017 and 2022 Rest of World Fluoropolymers Volume Market Share (%) by End-use Sector - Chemical Processing, Electrical & Electronics, Mechanical/Industrial, Automotive & Transportation, Building & Construction and Others .............................. 513
Value Analysis ........................................................ 514 Chart 599: Rest of World Fluoropolymers Market Analysis (2012-2022) by End-use Sector - Chemical Processing, Electrical & Electronics, Mechanical/Industrial, Automotive & Transportation, Building & Construction and Others in USD Million ............................................. 514 Chart 600: Glance at 2012, 2017 and 2022 Rest of World Fluoropolymers Value Market Share (%) by End-use Sector - Chemical Processing, Electrical & Electronics, Mechanical/Industrial, Automotive & Transportation, Building & Construction and Others .............................. 514
4.2.1.2 Rest of World Fluoropolymers Market Overview by Fluoropolymer Type .......................... 515 Volume Analysis ..................................................... 515
Chart 601: Rest of World Fluoropolymers Market Analysis (2012-2022) by Fluoropolymer Type - PTFE, FEP, PVDF, ETFE and PFA in Metric Tons ......................................... 515 Chart 602: Glance at 2012, 2017 and 2022 Rest of World Fluoropolymers Volume Market Share (%) by Fluoropolymer Type - PTFE, FEP, PVDF, ETFE and PFA ... 515
Value Analysis ........................................................ 516 Chart 603: Rest of World Fluoropolymers Market Analysis (2012-2022) by Fluoropolymer Type - PTFE, FEP, PVDF, ETFE and PFA in USD Million .......................................... 516 Chart 604: Glance at 2012, 2017 and 2022 Rest of World Fluoropolymers Value Market Share (%) by Fluoropolymer Type - PTFE, FEP, PVDF, ETFE and PFA ........................... 516
4.2.2 High Performance Polyamides ...................... 517 Chart 605: Rest of World High Performance Polyamides Market Analysis (2012-2022) in Volume (Metric Tons) and Value (USD Million) ....................................................... 517
4.2.2.1 Rest of World High Performance Polyamides Market Overview by End-Use Sector ..................... 518 Volume Analysis ..................................................... 518
Chart 606: Rest of World High Performance Polyamides Market Analysis (2012-2022) by End-Use Sector – Automotive, Electrical & Electronics, Mechanical/Industrial and Other in Metric Tons ....... 518 Chart 607: Glance at 2012, 2017 and 2022 Rest of World High Performance Polyamides Volume Market Share (%) by End-Use Sector – Automotive, Electrical & Electronics, Mechanical/Industrial and Other................................... 518
Value Analysis ........................................................ 519 Chart 608: Rest of World High Performance Polyamides Market Analysis (2012-2022) by End-Use Sector – Automotive, Electrical & Electronics, Mechanical/Industrial and Other in USD Million ........... 519 Chart 609: Glance at 2012, 2017 and 2022 Rest of World High Performance Polyamides Value Market Share (%) by End-Use Sector – Automotive, Electrical & Electronics, Mechanical/Industrial and Other................................... 519
4.2.2.2 Rest of World High Performance Polyamides Market Overview by Polyamide Type .................... 520 Volume Analysis ..................................................... 520
Chart 610: Rest of World High Performance Polyamides Market Analysis (2012-2022) by Polyamide Type – Polyamide 11 & 12, Polyphthalamide/Polyamide 6T, Polyamide 46 and Polyarylamide/Polyamide MXD6 in Metric Tons ................... 520 Chart 611: Glance at 2012, 2017 and 2022 Rest of World High Performance Polyamides Volume Market Share (%) by Polyamide Type – Polyamide 11 & 12, Polyphthalamide/Polyamide 6T, Polyamide 46and Polyarylamide/Polyamide MXD6 ................... 520
Value Analysis ........................................................ 521 Chart 612: Rest of World High Performance Polyamides Market Analysis (2012-2022) by Polyamide Type – Polyamide 11 & 12, Polyphthalamide/Polyamide 6T, Polyamide 46 and Polyarylamide/Polyamide MXD6 in USD Million ................... 521 Chart 613: Glance at 2012, 2017 and 2022 Rest of World High Performance Polyamides Value Market Share (%) by Polyamide Type – Polyamide 11 & 12, Polyphthalamide/Polyamide 6T, Polyamide 46 and Polyarylamide/Polyamide MXD6................................... 521
4.2.3 Sulfone Polymers .......................................... 522 Chart 614: Rest of World Sulfone Polymers Market Analysis (2012-2022) in Volume (Metric Tons) and Value (USD Million) 522
4.2.3.1 Rest of World Sulfone Polymers Market Overview by End-Use Sector .................................. 523 Volume Analysis..................................................... 523
Chart 615: Rest of World Sulfone Polymers Market Analysis (2012-2022) by End-Use Sector – Automotive, Electrical & Electronics, Mechanical/Industrial, Medical & Healthcare and Others in Metric Tons .......................... 523 Chart 616: Glance at 2012, 2017 and 2022 Rest of World Sulfone Polymers Volume Market Share (%) by End-Use Sector – Automotive, Electrical & Electronics, Mechanical/Industrial, Medical & Healthcare and Others 523
Value Analysis ........................................................ 524 Chart 617: Rest of World Sulfone Polymers Market Analysis (2012-2022) by End-Use Sector – Automotive, Electrical & Electronics, Mechanical/Industrial, Medical & Healthcare and Others in USD Million ........................... 524 Chart 618: Glance at 2012, 2017 and 2022 Rest of World Sulfone Polymers Value Market Share (%) by End-Use Sector – Automotive, Electrical & Electronics, Mechanical/Industrial, Medical & Healthcare and Others ......................................... 524
4.2.3.2 Rest of World Sulfone Polymers Market Overview by Polymer Type .................................... 525 Volume Analysis..................................................... 525
Chart 619: Rest of World Sulfone Polymers Market Analysis (2012-2022) by Polymer Type – Polysulfone (PSU) and Polyethersulfone (PESU) in Metric Tons ................. 525 Chart 620: Glance at 2012, 2017 and 2022 Rest of World Sulfone Polymers Volume Market Share (%) by Polymer Type – Polysulfone (PSU) and Polyethersulfone (PESU) 525
Value Analysis ........................................................ 526 Chart 621: Rest of World Sulfone Polymers Market Analysis (2012-2022) by Polymer Type – Polysulfone (PSU) and Polyethersulfone (PESU) in USD Million ................. 526 Chart 622: Glance at 2012, 2017 and 2022 Rest of World Sulfone Polymers Value Market Share (%) by Polymer Type – Polysulfone (PSU) and Polyethersulfone (PESU) ......... 526
4.2.4 Polyphenylene Sulphide................................ 527 Chart 623: Rest of World Polyphenylene Sulphide (PPS) Market Analysis (2012-2022) in Volume (Metric Tons) and Value (USD Million) ....................................................... 527
4.2.4.1 Rest of World Polyphenylene Sulphide (PPS) Market Overview by End-use Sector ..................... 528 Volume Analysis..................................................... 528
Chart 624: Rest of World Polyphenylene Sulphide (PPS) Market Analysis (2012-2022) by End-use Sector - Automotive, Electrical & Electronics, Mechanical/Industrial and Other in Metric Tons ........... 528 Chart 625: Glance at 2012, 2017 and 2022 Rest of World Polyphenylene Sulphide (PPS) Volume Market Share (%) by End-use Sector - Automotive, Electrical & Electronics, Mechanical/Industrial and Other .................................. 528
Value Analysis ........................................................ 529 Chart 626: Rest of World Polyphenylene Sulphide (PPS) Market Analysis (2012-2022) by End-use Sector - Automotive, Electrical & Electronics, Mechanical/Industrial and Other in USD Million ........... 529 Chart 627: Glance at 2012, 2017 and 2022 Rest of World Polyphenylene Sulphide (PPS) Value Market Share (%) by End-use Sector - Automotive, Electrical & Electronics, Mechanical/Industrial and Other .................................. 529
4.2.5 Liquid Crystal Polymers ................................. 530 Chart 628: Rest of World Liquid Crystal Polymers (LCP) Market Analysis (2012-2022) in Volume (Metric Tons) and Value (USD Million) ....................................................... 530
4.2.5.1 Rest of World Liquid Crystal Polymers (LCP) Market Overview by End-use Sector ..................... 531 Volume Analysis .................................................... 531
Chart 629: Rest of World Liquid Crystal Polymers (LCP) Market Analysis (2012-2022) by End-use Sector – Electrical & Electronics, Industrial and Others in Metric Tons ...... 531 Chart 630: Glance at 2012, 2017 and 2022 Rest of World Liquid Crystal Polymers (LCP) Volume Market Share (%) by End-use Sector – Electrical & Electronics, Industrial and Others .......................................................................... 531
Value Analysis ........................................................ 532 Chart 631: Rest of World Liquid Crystal Polymers (LCP) Market Analysis (2012-2022) by End-use Sector – Electrical & Electronics, Industrial and Others in USD Million ...... 532 Chart 632: Glance at 2012, 2017 and 2022 Rest of World Liquid Crystal Polymers (LCP) Value Market Share (%) by End-use Sector – Electrical & Electronics, Industrial and Others .......................................................................... 532
4.2.6 Polyetherimide ............................................. 533 Chart 633: Rest of World Polyetherimide (PEI) Market Analysis (2012-2022) in Volume (Metric Tons) and Value (USD Million) ................................................................ 533
4.2.6.1 Rest of World Polyetherimide (PEI) Market Overview by End-use Sector .................................. 534 Volume Analysis .................................................... 534
Chart 634: Rest of World Polyetherimide (PEI) Market Analysis (2012-2022) by End-use Sector - Automotive, Electrical & Electronics, Mechanical/Industrial and Others in Metric Tons .............................................................. 534 Chart 635: Glance at 2012, 2017 and 2022 Rest of World Polyetherimide (PEI) Volume Market Share (%) by End-use Sector - Automotive, Electrical & Electronics, Mechanical/Industrial and Others ................................ 534
Value Analysis ........................................................ 535 Chart 636: Rest of World Polyetherimide (PEI) Market Analysis (2012-2022) by End-use Sector - Automotive, Electrical & Electronics, Mechanical/Industrial and Others in USD Million ............................................................... 535 Chart 637: Glance at 2012, 2017 and 2022 Rest of World Polyetherimide (PEI) Value Market Share (%) by End-use Sector - Automotive, Electrical & Electronics, Mechanical/Industrial and Others ................................ 535
4.2.7 Polyetheretherketone ................................... 536 Chart 638: Rest of World Polyetheretherketone (PEEK) Market Analysis (2012-2022) in Volume (Metric Tons) and Value (USD Million) ...................................................... 536
4.2.7.1 Rest of World Polyetheretherketone (PEEK) Market Overview by End-use Sector ..................... 537 Volume Analysis .................................................... 537
Chart 639: Rest of World Polyetheretherketone (PEEK) Market Analysis (2012-2022) by End-use Sector - Automotive, Electrical & Electronics, Mechanical/Industrial and Others in Metric Tons ......... 537 Chart 640: Glance at 2012, 2017 and 2022 Rest of World Polyetheretherketone (PEEK) Volume Market Share (%) by End-use Sector - Automotive, Electrical & Electronics, Mechanical/Industrial and Others ................................ 537
Value Analysis ........................................................ 538 Chart 641: Rest of World Polyetheretherketone (PEEK) Market Analysis (2012-2022) by End-use Sector - Automotive, Electrical & Electronics, Mechanical/Industrial and Others in USD Million ......... 538 Chart 642: Glance at 2012, 2017 and 2022 Rest of World Polyetheretherketone (PEEK) Value Market Share (%) by End-use Sector - Automotive, Electrical & Electronics, Mechanical/Industrial and Others ................................ 538
PART C: GUIDE TO THE INDUSTRY ............... 539 1. High Performance Plastics Producers ................ 539 2. Independent High Performance Plastics Compounders and Processers ............................... 544
PART D: ANNEXURE .................................... 557 1. RESEARCH METHODOLOGY ............................... 557 2. FEEDBACK .......................................................... 561
Page 20
High Performance Plastics – A Global Market Overview November 2016 |560 Pages | 642 Charts | Price $6300
Click here to buy the report
Browse Other Comprehensive Reports in the High Performance Plastics Series
Ø High Performance Polyamides – A Global Market Overview
Ø Sulfone Polymers (PSU, PPSU & PESU) – A Global Market Overview
Ø Liquid Crystal Polymers (LCP) – A Global Market Overview
Ø Polyphenylene Sulfide (PPS) – A Global Market Overview
Ø Global Fluoropolymers Market – Products, Technologies and Applications
Ø Polyvinylidene Fluoride (PVDF) – A Global Market Overview
Ø Fluorinated Ethylene Propylene (FEP) – A Global Market Overview
Ø Polytetrafluoroethylene (PTFE) – A Global Market Overview
About Industry Experts Industry Experts values the most updated and accurate market research and industry analysis to provide unique market research reports for a broad range of industry verticals including Automotive, Transportation, Healthcare, Pharmaceuticals, Food & Beverages, Chemicals, Plastics, Materials, Consumer Goods, Retail, Biotechnology, Construction, Manufacturing and Other industries. Our research reports help our clients to identify and resolve topical issues by providing a complete picture of the market in their respective industry sectors. The Company’s rich collection of market research reports enables the companies to explore market drivers; forecast the future market; and to formulate the right strategies at the right time.
Industry Experts’ leading edge publications makes the life easy for corporate strategists, investors, analysts and researchers, start ups, consultants, financial and banking executives, academicians and many more. The company also provides customized research reports to cater the needs of the industry.
More about Industry Experts
INDUSTRY EXPERTS 1-7-19/C, Street No. 8, Habsiguda
Hyderabad – 500007, India Phone: +91-40-4018-1314
Fax: +91-40-4027-2381
industry-experts.com