1 global epidemiology and control of tuberculosis · 1 global epidemiology and control of...
TRANSCRIPT
1Global Epidemiology and Control of TuberculosisChristopher Dye, Martien Borgdorff
1.1Introduction
The recent discoveries that Mycobacterium tuberculosis has probably been a humanpathogen for millions of years [1], and that cattle and other animals are likely to haveacquired mycobacteria from humans rather than the reverse [2,3], have profoundimplications for the epidemiology and control of human tuberculosis(TB). Epidemiological theory and data have shown that, for directly-transmittedpathogens to persist, host population size (or density) must exceed a threshold,because the size of the host population determines the rate of production ofsusceptible hosts [4]. If M. tuberculosis once survived and reproduced only in smallhumanpopulations, itmust have evolvedmechanisms for doing so. Partial immunityand latent infection are both devices that increase the chance of persistence, theformer by ensuring that the number of hosts available for infection does not becometoo small, and the latter by spreading the risk (to the pathogen) of infection overdecades.Whether or not these biological characteristics ofM. tuberculosis actually did evolve
to aid persistence, they are at the heart of two major, contemporary problems in TBcontrol – the difficulty of developing an effective vaccine, and the removal of the hugereservoir of latent infection. Without an efficacious vaccine, or an effective way ofremoving latent infection, the dominant method of TB control at present is throughthe treatment of active disease, standardized as the DOTS component (based onDirectly Observed Treatment and Short-course chemotherapy) of the World HealthOrganization�s (WHO)StopTBStrategy [5,6]. The treatment of active disease reducesthe burden of illness and death, and curtails transmission. However, while curativetreatment for TB is comparatively cost-effective among health interventions [7], theultimate goal must be the prevention of this life-threatening disease.The targets for global TB control are set within the framework of the United
Nations Millennium Development Goals (MDGs), and are reinforced by the addi-tional goals of the Stop TB Partnership (Table 1.1). The overarching MDG Goal 6,
Handbook of Tuberculosis: Clinics, Diagnostics, Therapy and Epidemiology. Edited by Stefan H.E. Kaufmann andPaul van HeldenCopyright � 2008 WILEY-VCH Verlag GmbH & Co. KGaA, WeinheimISBN: 978-3-527-31888-9
j1
Table 1.1 The Stop TB Strategy [5,6].
Vision: A world free of TBGoal: To dramatically reduce the global burden of TB by 2015 in line with the MillenniumDevelopment Goals and the Stop TB Partnership targets
Objectives:- Achieve universal access to high-quality diagnosis and patient-centered treatment- Reduce the human suffering and socioeconomic burden associated with TB- Protect poor and vulnerable populations from TB, TB/HIV and MDR-TB- Support development of new tools and enable their timely and effective use
Targets:MDG 6, Target 8: Halt and begin to reverse the incidence of TB by 2015Targets linked to the MDGs and endorsed by the Stop TB Partnership:By 2005: detect at least 70% of infectious TB cases and cure at least 85% of these casesBy 2015: reduce TB prevalence and deaths rates by 50% relative to 1990By 2050: eliminate TB as a public health problem (<1 case per million population)
Components of the strategy and implementation approaches1. Pursuing high-quality DOTS expansion and enhancementa. Political commitment with increased and sustained financingb. Case detection through quality-assured bacteriologyc. Standardized treatment with supervision and patient supportd. An effective drug supply and management systeme. Monitoring and evaluation system, and impact measurement
2. Addressing TB/HIV, MDR-TB and other challenges- Implement collaborative TB/HIV activities- Prevent and control MDR-TB- Address prisoners, refugees, other high-risk groups and special situations
3. Contributing to the strengthening of health systems- Actively participate in efforts to improve system-wide policy, human resources,financing, management, service delivery and information systems
- Share innovations that strengthen health systems, including the Practical Approach to LungHealth (PAL)- Adapt innovations from other fields
4. Engaging all care providers- Public–Public and Public–Private Mix (PPM) approaches- Implement International Standards for Tuberculosis Care
5. Empowering people with TB, and communities- Advocacy, communication and social mobilization- Community participation in TB care- Patients� Charter for Tuberculosis Care
6. Enabling and promoting research- Program-based operational research- Research to develop new diagnostics, drugs and vaccines
2j 1 Global Epidemiology and Control of Tuberculosis
Target 8 is �to have halted and begun to reverse incidence by 2015�, that is theincidence rate of all forms of TB should be falling by 2015 [8]. The Stop TBPartnership targets are to halve TBprevalence and death rates by 2015, in comparisonwith the rates estimated for 1990 [9]. These reductions in incidence, prevalence anddeaths are to be accomplished mainly by detecting (target �70%) and curing(target �85%) sputum smear-positive cases [10]. These levels of case detection andcure should have been achieved by 2005, and maintained thereafter. Going beyondMDG target year 2015, the Stop TB Partnership is also committed to eliminating TBas a public health problem (i.e. reducing incidence to<1 per million population) by2050, which would require new combinations of drugs, diagnostics and vaccines.Against that backdrop, Section 1.2 of this chapter describes the status of the TB
epidemic, globally and in different regions and countries of the world. Section 1.3reviews the progressmade in large-scale efforts to treat active TB, via theWHODOTSStrategy, as implemented up to the end of 2005. In Section 1.4 we examine whetherthe MDGs can be achieved via the Global Plan to Stop TB, the blueprint forimplementing the extended Stop TB Strategy (of which DOTS is a part) over thedecade 2006–2015 [11]. The biggest challenge of all is to eliminate TB during the 21stcentury. In this context, Section 1.5 assesses the potential impact of new technologyon TB control, especially drugs and vaccines that could shift the emphasis from cureto prevention. We draw together our conclusions in Section 1.6.
1.2Global and Regional Dynamics
Based on surveys of the prevalence of infection and disease, assessments of theperformanceof surveillancesystems, anddeath registrations, therewereanestimated8.8 million new cases of TB in 2005 [5,12–14]. An estimated 3.9 million new caseswere sputum-smear positive, the form of pulmonary TB that is most infectious, andwhich carries the highest case fatality rate if not treated. TheWHOAfrican regionhadthe highest estimated incidence rate (343 per 100 000 population), but themajority ofTB patients live in themost populous countries of Asia. Five countries – Bangladesh,China, India, Indonesia and Pakistan – had about half the world�s population (46%)and produced about half (49%) of all new TB cases arising worldwide in 2005. The 22highest-burden countries account for about 80% of all new cases each year.TB is mainly a disease of adults, and affects more men than women. It is an
important cause of death among young adults who are raising families and in theirmost productive working years. In regions where the transmission ofM. tuberculosishas been stable or increasing for many years, the incidence rate is relatively highamong infants and young adults, and most cases are due to recent infection orreinfection [15]. As transmission falls, the burden of illness shifts to older adults, anda higher proportion of cases arises from the reactivation of latent infection. There-fore, in the countries of Western Europe and North America that now have lowincidence rates, indigenous TB patients tend to be elderly, whereas patients who areimmigrants from high-incidence countries tend to be young adults.
1.2 Global and Regional Dynamics j3
Although there are difficulties in diagnosing childhood TB [16], estimationexercises indicate that there are fewer cases among 0–14-year-olds than amongadults, even in areas of high transmission (18%of all new cases inAfrica in 2005, and4% in the establishedmarket economies). In 2005, countries reported 1.4million TBcases amongmen, but only 775 000 among women. In some instances, women havepoorer access to diagnostic facilities, but the broader pattern also reflects realepidemiological differences between the sexes. Although there is some evidencethat young adult women (15–44 years) are more likely thanmen to develop active TBfollowing infection, this effect is typically outweighed by the higher exposure andinfection rates among adult men.TB incidence rates have been steady or falling for at least two decades in the
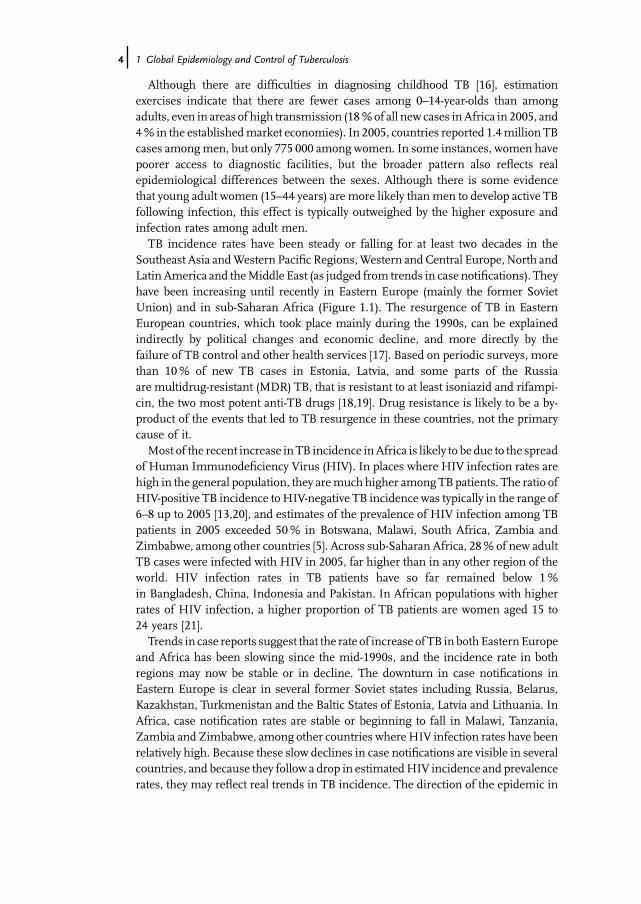
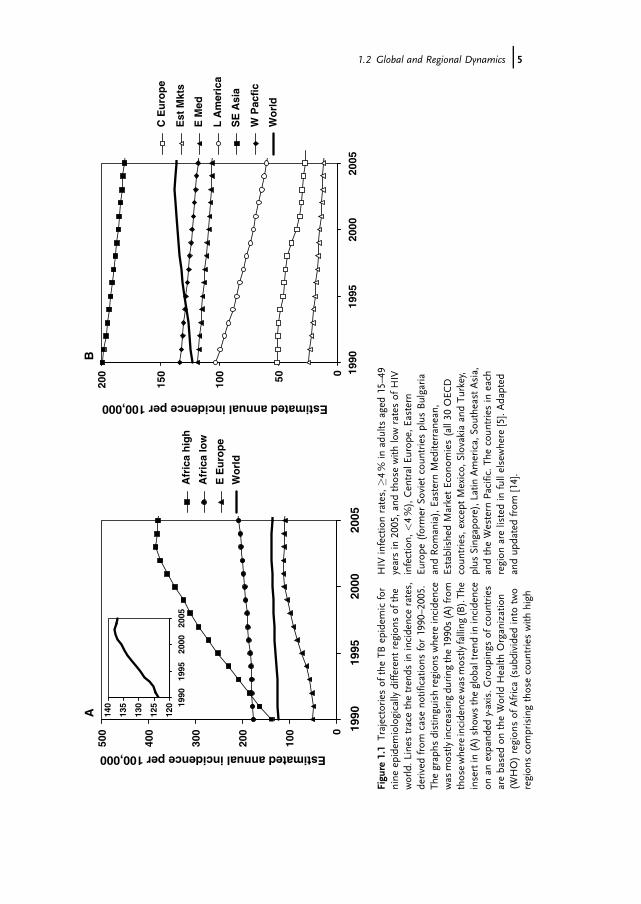
Southeast Asia andWestern Pacific Regions,Western andCentral Europe, North andLatin America and theMiddle East (as judged from trends in case notifications). Theyhave been increasing until recently in Eastern Europe (mainly the former SovietUnion) and in sub-Saharan Africa (Figure 1.1). The resurgence of TB in EasternEuropean countries, which took place mainly during the 1990s, can be explainedindirectly by political changes and economic decline, and more directly by thefailure of TB control and other health services [17]. Based on periodic surveys, morethan 10% of new TB cases in Estonia, Latvia, and some parts of the Russiaare multidrug-resistant (MDR) TB, that is resistant to at least isoniazid and rifampi-cin, the two most potent anti-TB drugs [18,19]. Drug resistance is likely to be a by-product of the events that led to TB resurgence in these countries, not the primarycause of it.Most of the recent increase inTB incidence inAfrica is likely to be due to the spread
of Human Immunodeficiency Virus (HIV). In places where HIV infection rates arehigh in the general population, they aremuch higher among TBpatients. The ratio ofHIV-positive TB incidence toHIV-negative TB incidence was typically in the range of6–8 up to 2005 [13,20], and estimates of the prevalence of HIV infection among TBpatients in 2005 exceeded 50% in Botswana, Malawi, South Africa, Zambia andZimbabwe, among other countries [5]. Across sub-Saharan Africa, 28% of new adultTB cases were infected with HIV in 2005, far higher than in any other region of theworld. HIV infection rates in TB patients have so far remained below 1%in Bangladesh, China, Indonesia and Pakistan. In African populations with higherrates of HIV infection, a higher proportion of TB patients are women aged 15 to24 years [21].Trends in case reports suggest that the rate of increase of TB inbothEasternEurope
and Africa has been slowing since the mid-1990s, and the incidence rate in bothregions may now be stable or in decline. The downturn in case notifications inEastern Europe is clear in several former Soviet states including Russia, Belarus,Kazakhstan, Turkmenistan and the Baltic States of Estonia, Latvia and Lithuania. InAfrica, case notification rates are stable or beginning to fall in Malawi, Tanzania,Zambia and Zimbabwe, among other countries whereHIV infection rates have beenrelatively high. Because these slow declines in case notifications are visible in severalcountries, and because they follow a drop in estimatedHIV incidence and prevalencerates, they may reflect real trends in TB incidence. The direction of the epidemic in
4j 1 Global Epidemiology and Control of Tuberculosis
0
100
200
300
400
500
2005
2000
1995
1990
Estimated annual incidence per 100,000
Afr
ica
hig
h
Afr
ica
low
E E
uro
pe
Wo
rld
A 120
125
130
135
140
2005
2000
1995
1990
050100
150
200
2005
2000
1995
1990
Estimated annual incidence per 100,000
C E
uro
pe
Est
Mkt
s
E M
ed
L A
mer
ica
SE
Asi
a
W P
acfi
c
Wo
rld
B
Figu
re1.1Trajectories
oftheTB
epidem
icfor
nine
epidem
iologically
differen
tregion
sof
the
world.L
ines
tracethetren
dsin
incidencerates,
derivedfrom
case
notifications
for1990–20
05.
Thegrap
hsdistingu
ishregion
swhere
incidence
was
mostly
increasing
during
the19
90s(A)from
thosewhereincidencewas
mostly
falling
(B).Th
einsertin
(A)show
stheglob
altren
din
incidence
onan
expa
nded
y-axis.G
roup
ings
ofcoun
tries
arebasedon
theWorld
Health
Organ
ization
(WHO)region
sof
Africa(sub
dividedinto
two
region
scomprisingthosecoun
trieswith
high
HIV
infectionrates,�4
%in
adults
aged
15–49
yearsin
2005,a
ndthosewith
lowratesof
HIV
infection,
<4%),Cen
tralEu
rope
,Eastern
Europe
(former
Soviet
coun
triesplus
Bulgaria
andRom
ania),EasternMedite
rran
ean,
EstablishedMarketEcon
omies(all30
OEC
Dcoun
tries,except
Mexico,
Slovakia
andTu
rkey,
plus
Sing
apore),L
atin
America,So
utheastAsia,
andtheWestern
Pacific.T
hecoun
triesin
each
region
arelistedin
fullelsewhere
[5].Adapted
andup
datedfrom
[14].
1.2 Global and Regional Dynamics j5
South Africa is unclear because the trend in case notifications (upwards) is domi-nated by recent improvements in case detection and reporting.Summing incident cases across the nine regions depicted in Figure 1.1 gives the
global trend. The incidence rate per capita was increasing most quickly at 1.5% peryear in 1995 but, because of the recent dynamics in Africa and Eastern Europe, hassince stabilized, and was probably falling by 2005 [5]. If the global TB incidence rateis now in decline, then Goal 6, Target 8 of the MDGs has been achieved.However, because population growth was faster in 2005 (1.2% per year) than thedecline in incidence, the total number of new TB cases arising each year was stillincreasing.Approximately 1.6 million people died of TB in 2005, including 195 000 patients
who were co-infected with HIV. Although these are usually reported as AIDS deathsunder the International Classification of Diseases-10 and by WHO [22], TB controlprograms need to know, for the purposes of case management, the total number ofTB deaths, whatever the underlying cause. Because few countries with high burdensof TB compile reliable statistics on the cause of death, the global and regional trendsin TB deaths are uncertain. However, recent assessments based on modelinghave suggested that the global TB mortality rate began to fall before 2000, that is,after prevalence but before incidence [5].
1.3Progress in the Implementation and Impact of TB Control
TB can be controlled, in principle, by three methods: preventing transmission andinfection (e.g. vaccination, isolation), stopping the progression from latent infectionto active TB (e.g. vaccination, drug treatment), and treating active disease (presently,with a combination of drugs).
1.3.1Vaccination
The current TB vaccine is used mainly to prevent severe disease (meningitis andmiliary TB) in children under 5 years of age. Roughly 100million infants (more than80% of the annual cohort) are vaccinated each year with BCG (Bacille Calmette-Guérin). Themost complete analysis of effectiveness to date suggests that BCGgivento children worldwide in 2002 will have prevented approximately 30 000 cases ofchildhood meningitis and about 11 500 cases of miliary TB during their first 5 years,or one case for every 3400 and 9300 vaccinations, respectively [23]. The protectiveefficacy against pulmonary TB in adults is highly variable, and often very low, andBCG is unlikely to have a major effect on the incidence of adult TB and transmissionanywhere in the world [24].
6j 1 Global Epidemiology and Control of Tuberculosis
1.3.2Preventive Therapy (Treatment of Latent TB Infection)
Individuals at high risk of TB who have a positive tuberculin skin test but not activedisease (e.g. anyone likely to have been infected within the past 2 years; associates ofactive cases, especially children; immigrants to low-incidence countries) can beoffered preventive therapy (also called treatment of latent TB infection), mostcommonly with the relatively safe and inexpensive drug, isoniazid (isoniazidpreventive therapy, IPT) [25]. Randomized, controlled, clinical trials have shownthat 12 months of daily isoniazid gives 25–92% protection (range of point estimatesfrom trials) against developing active TB (range of point estimates), but towards theupper end of this range when patients adhere fully to the treatment regimen [26].However, IPT has not been widely used, mainly because compliance with long-termdaily treatment tends to be poor among healthy people – a relatively high risk of TBamong people carrying latent infections is usually still a low risk in absolute terms. Itis also imperative to exclude patients with active TB, who have a low chance of curewith isoniazid treatment alone, and who risk developing isoniazid resistance. IPT isefficacious among people who are co-infected withM. tuberculosis and HIV [27], andthe exceptionally high risk of TB among HIV-positive individuals is one reason forencouraging its wider use, especially in Africa.
1.3.3Treatment of Active TB
Up to 2005, progress in TB control has been measured principally in terms of theimplementation of DOTS, the central component of the Stop TB Strategy. Datacollected by the end of 2006 have allowedWHO to assess whether the targets for 70%case detection and 85% treatment success were met by the end of 2005.
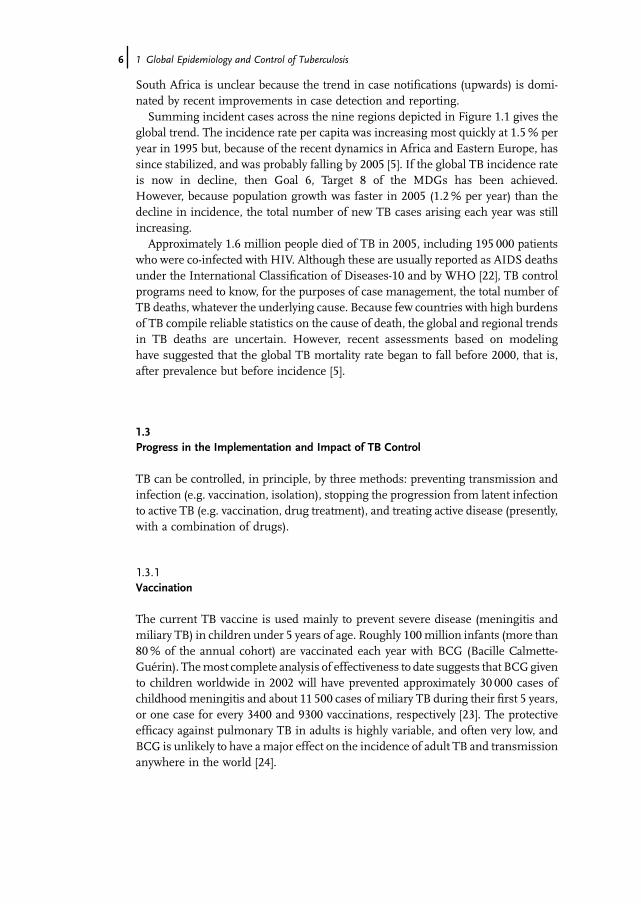
1.3.3.1 Case DetectionOver the 11 years between 1994 and 2005, a total of 26.5 million TB patients werediagnosed and reported under DOTS. In 2005, DOTS programs worldwide reported4.8 million new and relapsed cases, among which 2.3 million were smear-positive.The smear-positive case detection rate byDOTSprogramswas 60% (90%uncertaintylimits, 52–69%) of the 3.9 million new cases estimated (Figure 1.2A). The pointestimate of case detection was therefore below the 70% target. The estimated casedetection rate by DOTS programs increased almost linearly from 11% globally in1995 to 28% in 2000. Case detection has since accelerated, though the incrementfrom 2004 to 2005 was not as great as that from 2003 to 2004 (Figure 1.2A).The global acceleration in case detection has been driven principally by South-East
Asia (mostly India) since 2000, supported by the Western Pacific Region (mostlyChina) since 2002. However, only six of the 22 high-burden countries (includingChina), 66 countries in total, and one WHO region (Western Pacific), reached the70% target by 2005 (Figure 1.2B) [28,29].
1.3 Progress in the Implementation and Impact of TB Control j7
1.3.3.2 Treatment SuccessOf 2.1 million smear-positive patients registered for treatment under DOTS in 2004,1.8million (84%)were successfully treated by the end of 2005 (i.e. cured, as judgedbysputum smear conversion or completion of treatment), just short of the 85% target.
0
10
20
30
40
50
60
70
80
1995 1996 1997 1998 1999 2000 2001 2002 2003 2004 2005
Sm
ear-
po
siti
ve c
ase
det
ecti
on
(%
)
upper limit to 95th centilelower limit to 5th centile
target 70%
60%
52%
69%
A
0
10
20
30
40
50
60
70
80
90
1995 1996 1997 1998 1999 2000 2001 2002 2003 2004 2005
Sm
ear-
po
siti
ve c
ase
det
ecti
on
(%
)
W Pacific Africa AmericasE Med Europe SE AsiaWorld
B
Figure 1.2 (A) Case detection and (B) treatment success forsputum smear-positive patients under DOTS in 22 high-burdencountries. Treatment success is for the cohort of patientsregistered in 2004; case detection is for cases reportedduring 2005. The horizontal lines show the 70% (A) and 85% (B)targets [5,29].
8j 1 Global Epidemiology and Control of Tuberculosis
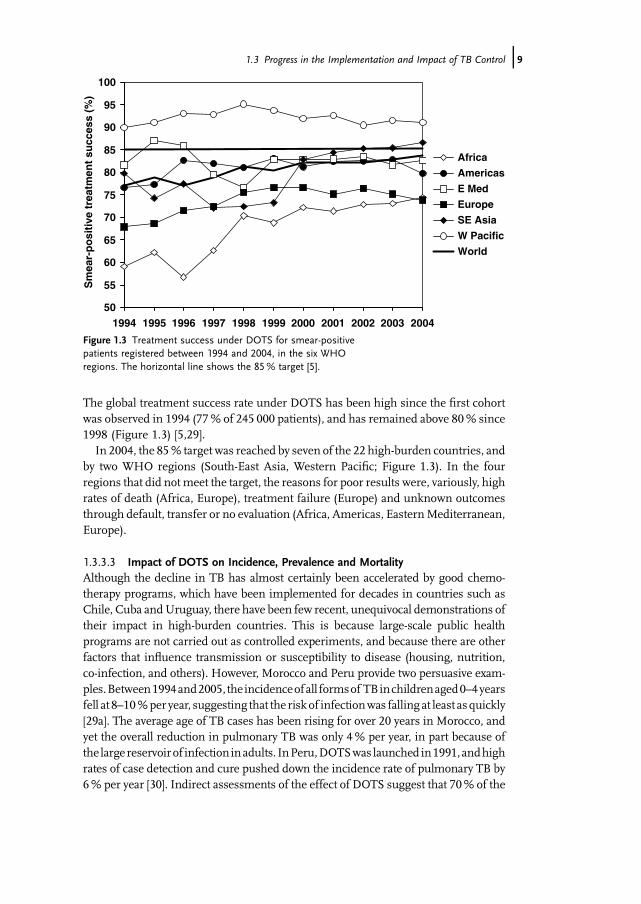
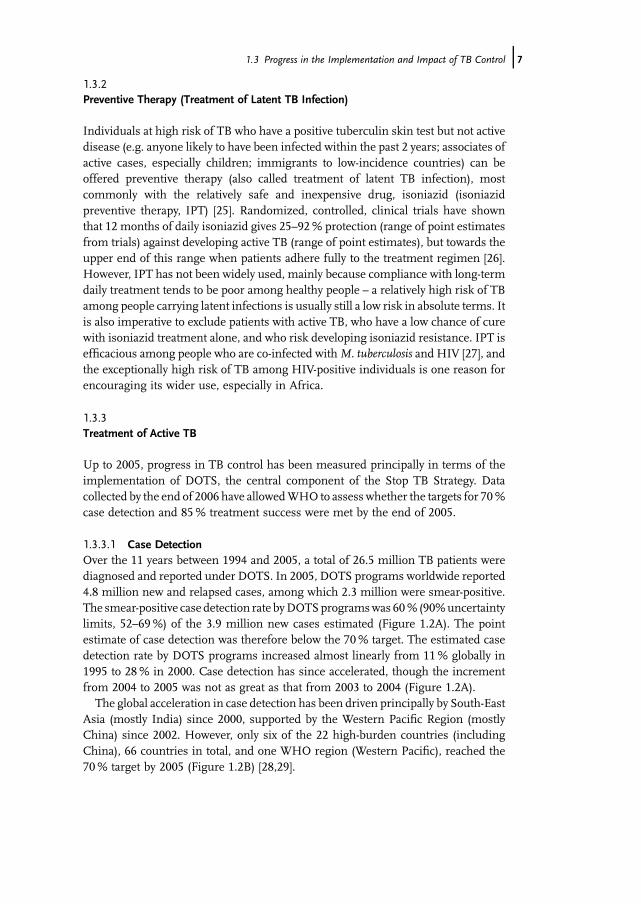
The global treatment success rate under DOTS has been high since the first cohortwas observed in 1994 (77% of 245 000 patients), and has remained above 80% since1998 (Figure 1.3) [5,29].In 2004, the 85% target was reached by seven of the 22 high-burden countries, and
by two WHO regions (South-East Asia, Western Pacific; Figure 1.3). In the fourregions that did notmeet the target, the reasons for poor results were, variously, highrates of death (Africa, Europe), treatment failure (Europe) and unknown outcomesthrough default, transfer or no evaluation (Africa, Americas, EasternMediterranean,Europe).
1.3.3.3 Impact of DOTS on Incidence, Prevalence and MortalityAlthough the decline in TB has almost certainly been accelerated by good chemo-therapy programs, which have been implemented for decades in countries such asChile, Cuba andUruguay, there have been few recent, unequivocal demonstrations oftheir impact in high-burden countries. This is because large-scale public healthprograms are not carried out as controlled experiments, and because there are otherfactors that influence transmission or susceptibility to disease (housing, nutrition,co-infection, and others). However, Morocco and Peru provide two persuasive exam-ples.Between1994and2005, theincidenceofall formsof TBinchildrenaged0–4yearsfell at 8–10%peryear, suggesting that the risk of infectionwas falling at least as quickly[29a]. The average age of TB cases has been rising for over 20 years in Morocco, andyet the overall reduction in pulmonary TB was only 4% per year, in part because ofthe large reservoirof infectioninadults. InPeru,DOTSwas launched in1991,andhighrates of case detection and cure pushed down the incidence rate of pulmonary TB by6% per year [30]. Indirect assessments of the effect of DOTS suggest that 70% of the
50
55
60
65
70
75
80
85
90
95
100
20042003200220012000199919981997199619951994
Sm
ear-
po
siti
ve t
reat
men
t su
cces
s (%
)
Africa
Americas
E Med
Europe
SE Asia
W Pacific
World
Figure 1.3 Treatment success under DOTS for smear-positivepatients registered between 1994 and 2004, in the six WHOregions. The horizontal line shows the 85% target [5].
1.3 Progress in the Implementation and Impact of TB Control j9
TB deaths expected in the absence of DOTS were averted in Peru between 1991 and2000.There have been few direct measures of the reduction in TB prevalence over time.
The Republic of Korea carried out seven surveys at 5-year intervals between 1965 and1995, during which time the prevalence of bacteriologically positive cases (smear-and/or culture-positive) of the disease fell from 940 per 100 000 to 219 per 100 000[31]. Two prevalence surveys carried out in China in 1990 and 2000 showed a 32%(95% confidence limits (CL) 5–68%) reduction in the prevalence per capita ofsmear-positive TB in DOTS areas, as compared with the negligible change inprevalence in other parts of the country [32]. A national survey in Indonesia in2004 found that the prevalence of smear-positive TB had fallen by a factor of 3 since aset of regional surveys were carried out between 1979 and 1982 [33,34]. But most ofthis reduction is not attributable to the DOTS program, which has expanded casedetection only since the beginning of this century [5].Some investigations into the impact of DOTS programs have shown that, after
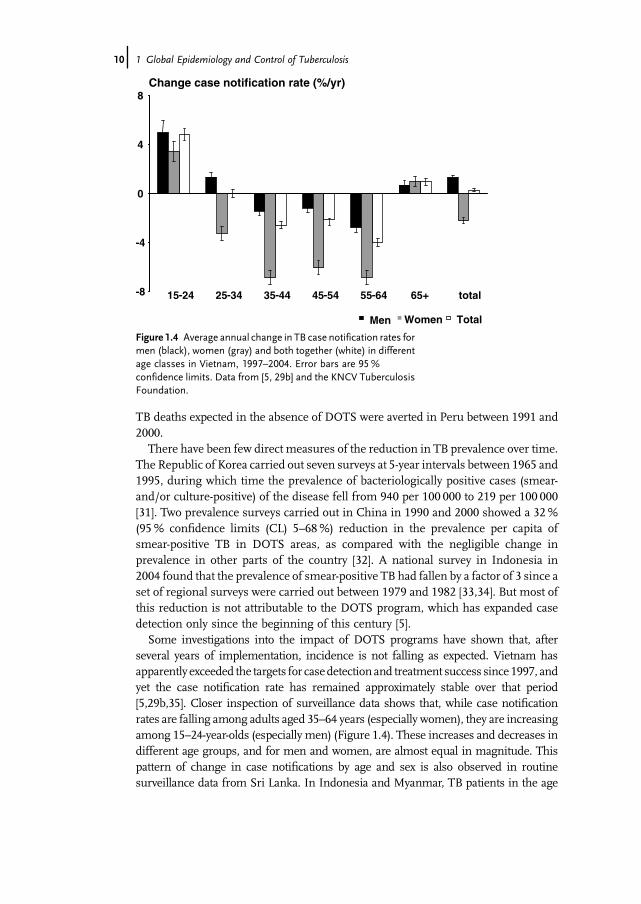
several years of implementation, incidence is not falling as expected. Vietnam hasapparently exceeded the targets for casedetection and treatment success since 1997, andyet the case notification rate has remained approximately stable over that period[5,29b,35]. Closer inspection of surveillance data shows that, while case notificationrates are falling among adults aged 35–64 years (especially women), they are increasingamong 15–24-year-olds (especially men) (Figure 1.4). These increases and decreases indifferent age groups, and for men and women, are almost equal in magnitude. Thispattern of change in case notifications by age and sex is also observed in routinesurveillance data from Sri Lanka. In Indonesia and Myanmar, TB patients in the age
-8
-4
0
4
8
15-24 25-34 35-44 45-54 55-64 65+ total
Change case notification rate (%/yr)
Men Women Total
Figure 1.4 Average annual change in TB case notification rates formen (black), women (gray) and both together (white) in differentage classes in Vietnam, 1997–2004. Error bars are 95%confidence limits. Data from [5, 29b] and the KNCV TuberculosisFoundation.
10j 1 Global Epidemiology and Control of Tuberculosis
group 15–54 years are becoming younger on average, and yet the average age should beincreasing if transmission and incidence are falling. The reasons for the rejuvenation ofthese epidemics are not fully understood, though HIV infection is bound to be acontributing factor.Some states of India have been implementing DOTS since 1998, and yet there was
no detectable decline in case notification rates at state level by 2006 (Revised NationalTuberculosis Control Program, personal communication). The case notification ratesin different states and in different years are closely correlated with the number ofsuspected TB patients examined. This suggests that the number of cases diagnosedand reported is determined by the performance of the public health service, as well asby the true incidence of TB. The southern states of Kerala and Tamil Nadu show anincrease in the average age of TB cases, which may reflect falling transmission. Thishas yet to be translated into a clear demonstration of falling incidence across a wholestate, though transmission and prevalence have been reduced on a smaller scale inthe Tiruvallur District of Tamil Nadu [36,37].Calculations carried out for theWHO 2007 report on Global Tuberculosis Control
suggest that, althoughprevalenceanddeathratesare fallingglobally, therateofdeclineis not fast enough to meet the MDGs by 2015 [5]. While the surveillance data fromcertain Asian countries show worryingly slow rates of decline, the biggest regionalchallenges in reducing TB burden are in sub-Saharan Africa and Eastern Europe.
1.4Achieving the Millennium Development Goals by 2015
Since the launch of theDOTS strategy during the 1990s, a series of specific, emergingproblems in TB epidemiology and control have demanded specific solutions. TheseincludeM. tuberculosis andHIVco-infection, drug resistance, the quality of treatmentin theprivate sector, and theneed to evaluate the epidemiological impact of TBcontrol(not simply the implementation of DOTS). For this reason, DOTS has been extendedas the Stop TB Strategy, with the additional elements listed in Table 1.1 [5,6]. Theblueprint for implementing the Stop TB Strategy over the next decade is the GlobalPlan to Stop TB (2006–2015) [11]. The plan imagines and compares three scenarios:
Scenario 1: No DOTS. This assumes that the strategy was neverintroduced in any region, so chemotherapy would continue as itwas pre-DOTS, with variable rates of case detection and typicallylower rates of cure. This gives a baseline against which tocompare gains that have already beenmade, and whichmight bemade in future.Scenario 2: Sustained DOTS. Case detection and treatmentsuccess increase until 2005, and then remain steady until 2015.Approximately 50million patients would be treated under DOTSbetween 2006 and 2015, as compared with around 25 million inthe previous decade, 1996–2005.Scenario 3: Enhanced DOTS. Case detection and treatmentsuccess continue to increase beyond 2005, up to 2015. As in
1.4 Achieving the Millennium Development Goals by 2015 j11
scenario 2, roughly 50million patients would be treated between2006 and 2015 (a higher proportion of patients treated soonermeans that as a result of reduced transmission, there are fewerpatients later). To reach high rates of case detection and curerequires various additions to the basic DOTS strategy, includingcommunity-based care, a syndromic approach to diagnosing andtreating TB among other respiratory conditions, and improvedcollaboration between public and private health sectors. Toimprove the management of drug-resistant disease, morepatients will be given drug sensitivity tests, and around 800 000MDR-TB patients will be treated with regimens includingsecond-line drugs. HIV testing and counseling will be providedto 29 million TB patients, and antiretroviral therapy (ART) andco-trimoxazole preventive therapy offered to 3.2 million.Approximately 200 million people infected with HIV will bescreened for TB, and 24 million will be offered IPT.
The potential impact of scenario 3, as compared with scenarios 1 and 2, has beenevaluatedwith amathematical transmissionmodel describing, as in previousmodels[38–41], how the planned interventions determine incidence, prevalence and deathrates through time. Model calculations show that scenarios 2 and 3 should bothsatisfyMDGtarget 8, to ensure that the incidence rate of TB is falling globally. In fact,the annual incidence of new cases is expected to be in decline well before 2015, evenunder scenario 2. Notwithstanding the observations on impact in Section 1.3.3.3,ambitious plans for the South East Asia and Western Pacific regions are expected togenerate relatively rapid declines in incidence rate of 7–9% per year by 2015.To halve prevalence and death rates between 1990 and 2015 will be more challeng-
ing. Projections suggest that these targets can be met globally with full implementa-tion of the enhanced DOTS strategy (scenario 3), but not in Africa or Eastern Europe(Figure 1.5). Based on the calculated rate of decline inmortality from 2006 to 2015 inthe African countries most affected by HIV (Africa – high HIV), the target death ratewould not be reached before 2025. If the rate of decline inmortality slows, as it has inEurope and North America, then the target will be reached even later than 2025.In Eastern Europe, but not in Africa, prevalence rates are also expected to remain
high compared with 1990 levels. In Eastern Europe, a relatively high proportion ofpatients have chronic TB, which is commonlymultidrug resistant. In Africa, patientsthat are infected with HIV do not suffer from TB for long; their illness typicallyprogresses quickly, and they are either cured or die [42]. This bleak outlook for TBcontrol inAfrica andEasternEurope arises in large part from the choice of 1990 as theMDG reference year. In that year, TB incidence rates in these two regions were closeto their lowest levels for at least half a century, andmost of the recent rise in incidenceoccurred during the 1990s.While not ignoring the epidemiology of the recent past, more relevant here is the
impact of interventions in the near future. The same projections also show that, overthe 10 years from 2006 to 2015, the impact of the enhancedDOTS strategy, assuming
12j 1 Global Epidemiology and Control of Tuberculosis
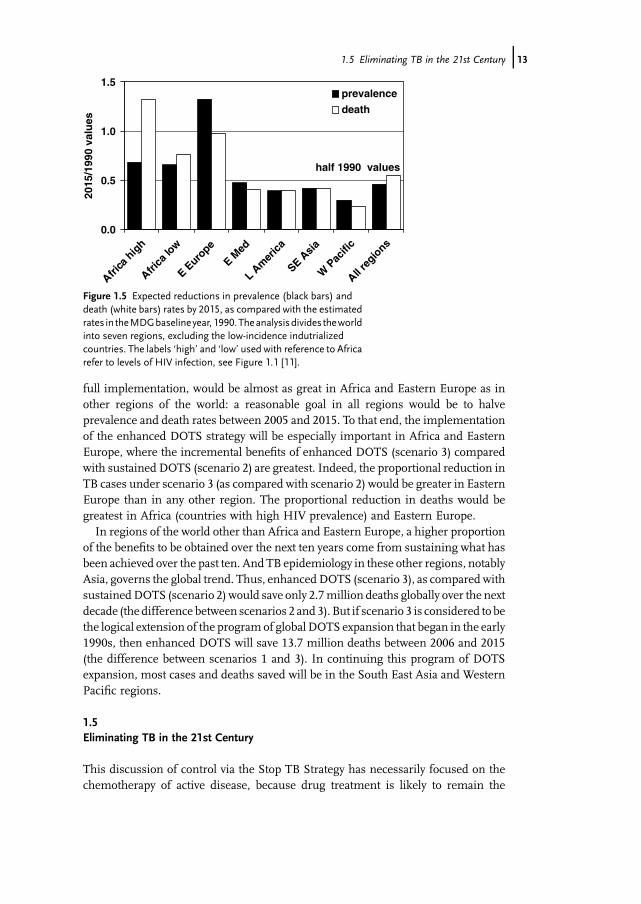
full implementation, would be almost as great in Africa and Eastern Europe as inother regions of the world: a reasonable goal in all regions would be to halveprevalence and death rates between 2005 and 2015. To that end, the implementationof the enhanced DOTS strategy will be especially important in Africa and EasternEurope, where the incremental benefits of enhanced DOTS (scenario 3) comparedwith sustained DOTS (scenario 2) are greatest. Indeed, the proportional reduction inTB cases under scenario 3 (as compared with scenario 2) would be greater in EasternEurope than in any other region. The proportional reduction in deaths would begreatest in Africa (countries with high HIV prevalence) and Eastern Europe.In regions of the world other than Africa and Eastern Europe, a higher proportion
of the benefits to be obtained over the next ten years come from sustaining what hasbeen achieved over the past ten. And TB epidemiology in these other regions, notablyAsia, governs the global trend. Thus, enhancedDOTS (scenario 3), as compared withsustainedDOTS (scenario 2) would save only 2.7million deaths globally over the nextdecade (the difference between scenarios 2 and 3). But if scenario 3 is considered to bethe logical extension of the program of global DOTS expansion that began in the early1990s, then enhanced DOTS will save 13.7 million deaths between 2006 and 2015(the difference between scenarios 1 and 3). In continuing this program of DOTSexpansion, most cases and deaths saved will be in the South East Asia and WesternPacific regions.
1.5Eliminating TB in the 21st Century
This discussion of control via the Stop TB Strategy has necessarily focused on thechemotherapy of active disease, because drug treatment is likely to remain the
0.0
0.5
1.0
1.5
Africa
hig
h
Africa
low
E Euro
pe
E Med
L Am
erica
SE Asia
W P
acifi
c
All reg
ions
2015
/199
0 va
lues
prevalence
death
half 1990 values
Figure 1.5 Expected reductions in prevalence (black bars) anddeath (white bars) rates by 2015, as compared with the estimatedrates in theMDGbaselineyear,1990.Theanalysisdivides theworldinto seven regions, excluding the low-incidence indutrializedcountries. The labels �high� and �low� used with reference to Africarefer to levels of HIV infection, see Figure 1.1 [11].
1.5 Eliminating TB in the 21st Century j13
principal option for combating TB over the next decade. In the longer term, TBelimination might be achieved through a combination of measures to preventinfection, to stop progression from infection to active disease, and to treat activedisease. An examination of the principles of TB elimination shows how we mayexploit, or even drive, the development of newdrugs, diagnostics and vaccines [43–45].Mathematical modeling shows that with the diagnosis and treatment of 70% of
new infectious cases arising each year and a cure rate of 85%, the incidence rate isexpected to fall from a steady state at around 4–5% annually for the first 10 years, andthen more slowly thereafter [46]. This is about the same as the additional rate ofdecline in TB incidence seen inWestern European countries after effective TB drugsbecame available during the 1950s. The net effect is to halve the incidence rate by2050. A reduction of this magnitude would be an important achievement for publichealth, but it leaves an incidence rate mid-century that is still far above theelimination threshold of one per million population (as does scenario 3 of theGlobal Plan to Stop TB; Section 1.4).To eliminate TB by 2050 (outside sub-Saharan Africa), the incidence rate must fall
at an average of 16% annually from 2007 onwards. This rate of decline might beachieved for a few years, but it is unlikely to be sustainable. The reason, as observed inSection 1.2, is that when transmission and incidence fall, a growing proportion ofcases arise from the slow reactivation of long-standing latent infections, rather thanfrom the rapid progression of recent infections. Thus, the initial rate of decline inincidence is controlled by primary progression and reinfection, but the long-termrateof decline is governed by reactivation.Combinations of interventions can, in principle, pushTB closer to elimination, but
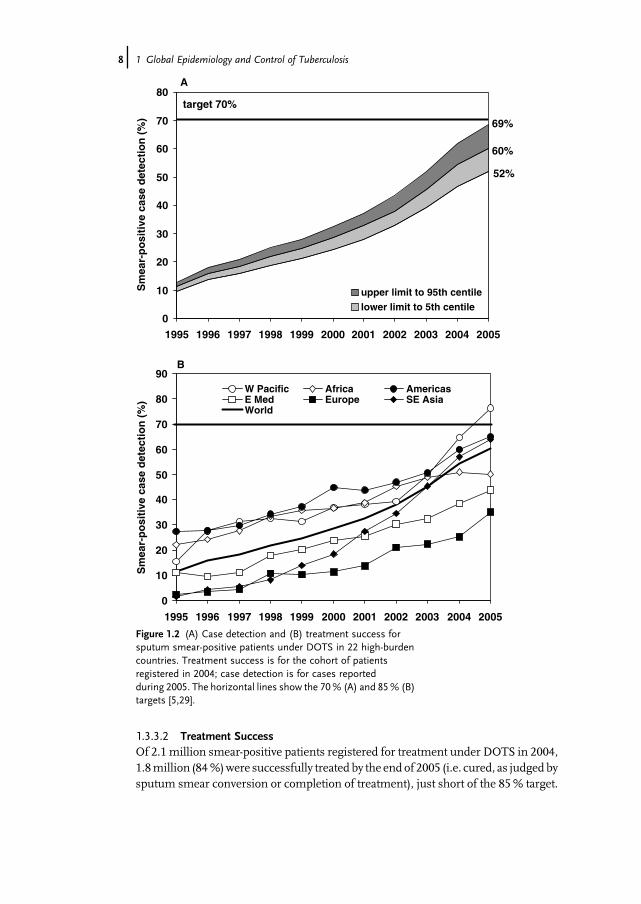
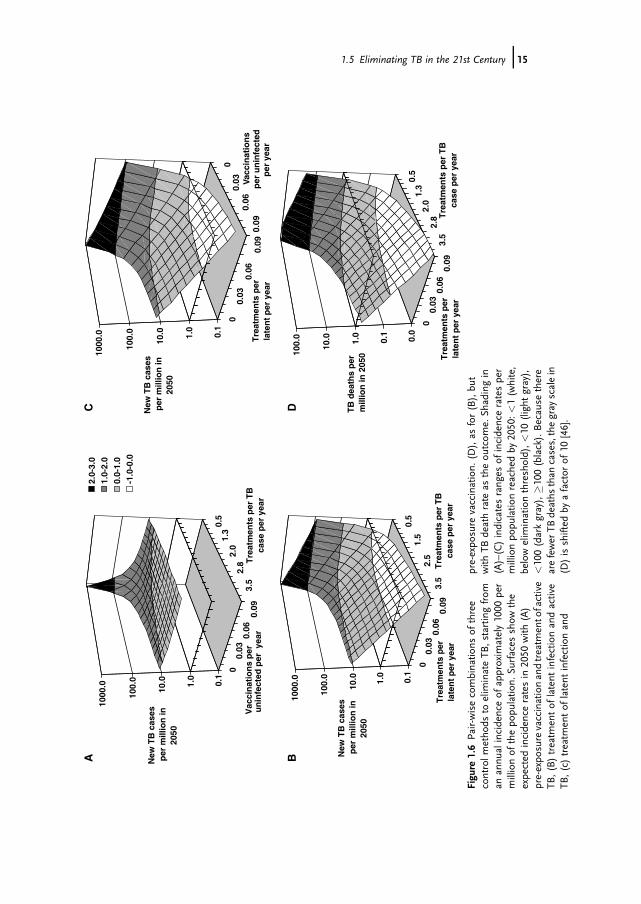
some combinations are more effective than others. Figure 1.6A shows the expectedincidence rate in 2050 when pre-exposure vaccination (to prevent infection) iscombined with the treatment of TB patients. The effects of the two approaches aresimilar when used alone, and intensifying either control method yields sharplydiminishing returns. The twomethods are somewhatmore effective in combination,but the additional impact is small. This is because drug treatment to stop transmis-sion at source has effects that are similar to vaccination, which protects thosewho areexposed to infection. One intervention partly substitutes for the other; they do not actindependently or synergistically. Therefore, a pre-exposure vaccine will be mostuseful in addition to treatment when the detection rate of active TB cases is low, andvice versa.The campaign to eliminate TB will be more effective if two interventions attack
different etiological pathways, that is, both the fast (transmission, infection andprogressive primary disease) and slow (reactivation of latent infection) routes todeveloping active TB. The treatment of latent TB, either by preventive drugtherapy or post-exposure vaccination, is relatively ineffective when used alone(Figure 1.6B and C), but powerful in combination with the treatment of active TB(Figure 1.6B and D) or with pre-exposure vaccination (Figure 1.6C). When thesecombined approaches are implemented intensively, the incidence of TB may bereduced to close to or below the elimination threshold by 2050. In the examplesshown in Figure 1.6B and C, incidence is reduced to 0.14 per million by 2050,
14j 1 Global Epidemiology and Control of Tuberculosis
0.5
1.3
2.0
2.8
3.5
00.
030.
060.
09
0.1
1.0
10.0
100.
0
1000
.0
New
TB
cas
es
per
mill
ion
in
2050
Tre
atm
ents
per
TB
ca
se p
er y
ear
Vac
cin
atio
ns
per
u
nin
fect
ed p
er y
ear
2.0-
3.0
1.0-
2.0
0.0-
1.0
-1.0
-0.0
A
00.
030.
060.
09
00.
030.
060.
09
0.1
1.0
10.0
100.
0
1000
.0
New
TB
cas
es
per
mill
ion
in
2050
Tre
atm
ents
per
la
ten
t p
er y
ear
Vacc
inat
ion
sp
er u
nin
fect
edp
er y
ear
C
0.5
1.5
2.5
3.5
00.
030.
060.
09
0.1
1.0
10.0
100.
0
1000
.0
New
TB
cas
es
per
mill
ion
in
2050
Tre
atm
ents
per
TB
ca
se p
er y
ear
Tre
atm
ents
per
la
ten
t p
er y
ear
B
0.5
1.3
2.0
2.8
3.5
00.
030.
060.
09
0.0
0.1
1.0
10.0
100.
0
TB
dea
ths
per
m
illio
n in
205
0
Tre
atm
ents
per
TB
case
per
yea
rT
reat
men
ts p
er
late
nt
per
yea
r
D
Figu
re1.6Pa
ir-wisecombina
tions
ofthree
controlm
etho
dsto
elim
inateTB
,startingfrom
anan
nualincidenceof
approxim
ately1000
per
millionof
thepo
pulatio
n.Su
rfaces
show
the
expe
cted
incidenceratesin
2050
with
(A)
pre-expo
surevaccinationan
dtreatm
ento
factive
TB,(B)treatm
entof
latent
infectionan
dactive
TB,(c)
treatm
entof
latent
infectionan
d
pre-expo
sure
vaccination.
(D),as
for(B),bu
twith
TBdeathrate
astheou
tcom
e.Sh
adingin
(A)–(C)indicatesrang
esof
incidenceratespe
rmillionpo
pulatio
nreachedby
2050
:<1(w
hite,
belowelim
inationthreshold),<
10(light
gray),
<10
0(darkgray),�1
00(black).Because
there
arefewer
TBdeaths
than
cases,thegray
scalein
(D)isshifted
byafactor
of10
[46].
1.5 Eliminating TB in the 21st Century j15
about 7 times lower than expected if the effects were independent. The proportionaleffect on the TB death rate is still greater (cf. Figure 1.6B and D).
1.6Conclusions
The countries of sub-Saharan Africa and Eastern Europe (mainly the former SovietUnion) suffered large increases in TB during the 1990s, but there are indications thatthe incidence rates in these two regions are now stable or falling. If the TB epidemicsin these two regions are indeed on the decline, then the global incidence rate is almostcertainly declining too, along with prevalence and mortality. This means that MDGTarget 8, as related to TB, has already been satisfied, 10 years in advance of the 2015deadline.But there are two important caveats. First, the decline in incidence per capita was
slower than the increase in human population in 2005; consequently, the totalnumber of new cases was still rising each year. And second, prevalence andmortalityrates are not being reduced quickly enough to meet the MDGs by 2015. These aresharp reminders that, despite having treated more than 26 million patients between1994 and 2005, DOTS has so far had limited epidemiological impact.It is clear, too, that the fall in case load in some countries is only partially due to the
impact ofDOTS. In sub-SaharanAfrica, the incidence ofHIV infectionwas probably atitshighestduringthe1990s,andthefall inHIVincidencehasweakenedthemaindrivingforce behind the TB epidemic. In Eastern European countries, many components ofthe TB control system (diagnostic services, drug supplies, etc.) have been restored afterthe collapse of the Soviet Union. But this is unlikely to be the full explanation for thestabilization incasenotifications inEasternEurope,becausetheinitial resurgencecouldalso have been due to changes in susceptibility among people whoweremalnourished,stressed and prove to other biological and social risk factors. Inmany countries of LatinAmerica, the Eastern Mediterranean region and Asia, TB (all forms) case notificationrates were falling well before the implementation of DOTS programs.The epidemiological impact of DOTS has been discernible in a few countries (e.g.
Peru, China), but remains a matter of conjecture in most. There will always beanalytical difficulties in distinguishing the impact of a public health interventionoutside a randomized controlled trial. Nonetheless, surveillance in India, Indonesia,Myanmar, Sri Lanka andVietnam raises doubts aboutwhether the fall in incidence inAsia will be as great as expected from the post-war experience in Europe [47], or asanticipated by mathematical models [48,49]. The causes of, for example, risingincidence rates among young adults, are not yet clear. HIV infection plays a part, butis unlikely to provide the full explanation. There is a strong case for re-examiningsome basic assumptions about TB epidemiology, such as the magnitude of reactiva-tion and re-infection rates in relation to risk factors including indoor air pollution,drug resistance, malnutrition, diabetes and tobacco smoking [50–58].None of these observations are reasons for abandoning DOTS or the Stop TB
Strategy. Rather, the strategy must be reinforced as the only feasible mechanism for
16j 1 Global Epidemiology and Control of Tuberculosis
achieving the MDGs by 2015. In evaluating progress towards those goals, it will bevital to measure epidemiological impact through a combination of survey methodsand surveillance. Periodic population-based surveys of the prevalence of activedisease and infection can reveal trends, which could be attributable to specificinterventions. TB deaths need to be counted inmore countries, andmore accurately,either as a component of general cause-of-death surveys or through systems ofroutine death registration [58]. The evidence from surveys of prevalence and deathsshould be supplemented by fuller analyses of the huge body of surveillance data thatis routinely collected by national control programs (following the example of Peru).Beyond the Stop TBStrategy, theGlobal Plan and theMDGs, TB elimination in the
21st century will require a new armory of diagnostics, drugs and vaccines. TB cannotbe eliminated by 2050 solely by cutting transmission, no matter how well currentprograms of drug treatment are implemented. To eliminate TB on this time-scale itwill be essential to stop the progression from latent infection to active disease, inaddition to preventing new infections.This is unlikely to be possible on a large scale unless existing procedures to carry
out preventive therapy can be greatly simplified, or replaced. That will require, first, adiagnostic test for latent infection that is more sensitive and specific than the currenttuberculin skin test but easy to administer and read. That need might be satisfied, inpart, by interferon-g release assays, though these need further evaluation [60,60a].Preventive therapy also requires a course of treatment that is shorter than 9 months.In this context, a 3-month treatment regimen now appears feasible with combina-tions of drugs such as isoniazid with rifapentine [60]. A major step forward inpreventive therapy would be a test to identify which infected people are at relativelyhigh risk of progressing to active disease (from factor other than HIV co-infection).TB control by immunization certainly requires a vaccine that is superior to the
widely-used BCG (Bacille Calmette-Guérin), for which efficacy is variable and oftennegligible in preventing pulmonary disease in adults. Vaccines that prevent eithernew infections (pre-exposure), or the reactivation of latent infections (post-exposure),each have their advantages and disadvantages. Pre-exposure vaccines have a greaterimpact than post-exposure vaccines when used alone, but have the same effect astreating active TB.Therefore a pre-exposure vaccinewill bemost useful as an additionto treating patients when the detection rate of active TB cases is low, and vice versa.Post-exposure vaccines have a relatively small impact when used alone but, like IPT,act in synergy with the treatment of active TB [45,46].
References
1 Gutierrez, M.C., Brisse, S., Brosch, R.,Fabre, M., Omaïs, B., Marmiesse, M.,Supply, P. and Vincent, V. (2005)Ancient origin and genemosaicism of theprogenitorofMycobacteriumtuberculosis.PLoS Pathogens, 1, p. e-Pub Aug 19.
2 Brosch,R.,Gordon, S.V.,Marmiesse,M.,Brodin, P., Buchrieser, C., Eiglmeier, K.,Garnier, T., Gutierrez, C., Hewinson, G.,Kremer, K., Parsons, L.M., Pym, A.S.,Samper, S., van Soolingen, D. and Cole,S.T. (2002) A new evolutionary scenario
References j17
for the Mycobacterium tuberculosiscomplex. Proceedings of the NationalAcademy of Sciences of the United States ofAmerica, 99, pp. 3684–3689.
3 Mostowy, S., Cousins, D., Brinkman, J.,Aranaz, A. and Behr, M.A. (2002)Genomic deletions suggest a phylogenyfor the Mycobacterium tuberculosiscomplex. Journal of Infectious Disease,186, 74–80.
4 Anderson, R.M. and May, R.M. (1991)Infectious Diseases of Humans: Dynamicsand Control, Oxford University Press,Oxford.
5 World Health Organization. (2007)Global tuberculosis control: Surveillance,Planning, Financing, World HealthOrganization, Geneva.
6 Raviglione, M.C. and Uplekar, M.W.(2006) WHO�s new stop TB strategy.Lancet, 367, 952–955.
7 Dye, C. and Floyd, K. (2006)Tuberculosis, in Disease ControlPriorities: Priorities in DevelopingCountries, (eds D.T. Jamison, G.A.OAlleyne, J.G. Breman, M. Claeson, D.B.Evans, P. Jha, A.R. Measham andA. Mills), Oxford University Press,Washington DC. pp. 289–309.
8 United Nations Statistics Division.Millennium Indicators Database. 2004[cited 2007; Available from: mdgs.un.org/unsd/mdg/Default.aspx].
9 Dye, C., Maher, D., Weil, D., Espinal, M.and Raviglione, M. (2006) Targets forglobal tuberculosis control. InternationalJournal of Tuberculosis and Lung Disease,10, 460–462.
10 World Health Organization. (1991)Forty-fourth World Health Assembly,Resolutions and Decisions. ResolutionWHA 44.8, World Health Organization,Geneva.
11 Stop TB Partnership and World HealthOrganization. (2006) The Global Plan toStop TB, 2006–2015, Stop TBPartnership, Geneva.
12 Dye,C.,Scheele,S.,Dolin,P.,Pathania,V.and Raviglione, M.C. (1999) Global
burden of tuberculosis: estimatedincidence, prevalence, and mortality bycountry. Journal of the American MedicalAssociation, 282, 677–686.
13 Corbett, E.L., Watt, C.J., Walker, N.,Maher, D., Williams, B.G., Raviglione,M.C. and Dye, C. (2003) The growingburden of tuberculosis: global trends andinteractions with the HIV epidemic.Archives of Internal Medicine, 163,1009–1021.
14 Dye,C.,Watt, C.J., Bleed,D.M.Hosseini,S.M. and Raviglione, M.C. (2005)Evolution of tuberculosis control andprospects for reducing tuberculosisincidence, prevalence, anddeaths globally. Journal of theAmerican Medical Association, 293,2767–2775.
14a Dye, C., Bassili, A., Bierrenbach, A.L.,Broekmans, J.F., Chadha, V.K., Glaziou,P., Gopi, P.G., Hosseini, M., Kim, S.J.,Manissero, D., Onozaki, I., Rieder, H.L.,Scheele, S., vanLeth, F., vanderWerf,M.and Williams, B.G. Measuringtuberculosis burden, trends and theimpact of control programmes.LancetInfectious Diseases In press.
15 Chiang, C.Y. and Riley, L.W. (2005)Exogenous reinfection in tuberculosis.Lancet Infectious Diseases, 5, 629–636.
16 Stop TB Partnership Childhood TBSubgroup. (2006) Chapter 1:Introduction and diagnosis oftuberculosis in children. InternationalJournal of Tuberculosis and Lung Disease,10, 1091–1097.
17 Shilova, M.V. and Dye, C. (2001) Theresurgence of tuberculosis in Russia.Philosophical transactions of the RoyalSociety of London. Series B, BiologicalSciences, 356, 1069–1075.
18 World Health Organization andInternational Union AgainstTuberculosis And Lung Disease, Anti-Tuberculosis Drug Resistance in theWorld: Third Global Report. WHO/IUATLD Global Project on Anti-Tuberculosis Drug Resistance
18j 1 Global Epidemiology and Control of Tuberculosis

Surveillance. 2004, World HealthOrganization: Geneva. p. 299.
19 Zignol, M., Hosseini, M.S., Wright, A.,vanWeezenbeek,C.L., Nunn, P.,Watt, C.J., Williams, B.G. and Dye, C. (2006)Global incidence of multidrug-resistanttuberculosis. Journal of InfectiousDiseases, 194, 479–485.
20 WorldHealthOrganization (2005) WorldHealth Organization, Global tuberculosiscontrol: surveillance, planning, financing.WHO report 2005, (eds C. Dye, L. Blancand K. Floyd),Vol. WHO/TB/2005.349.World Health Organization, Geneva.
21 World Health Organization, GlobalTuberculosis Control: Surveillance,Planning, Financing.WHOReport 2005.2005, World Health Organization:Geneva.
22 World Health Organization.International Classification of Diseases.2007 [cited 2007]; ICD-10: [Availablefrom: www.who.int/classifications/icd/en/. 1978].
23 Bourdin Trunz, B., Fine, P. and Dye, C.(2006) Effect of BCG vaccination onchildhood tuberculous meningitisand miliary tuberculosis worldwide: ameta-analysis and assessment ofcost-effectiveness. Lancet, 367,1173–1180.
24 Fine, P.E.M. (2001) BCG vaccines andvaccination, in Tuberculosis: aComprehensive International Approach,(eds L.B. Reichman and E.S.Hershfield),Marcel Dekker, New York.
25 O�Brien, R.J. (2003) Treatment of latenttuberculosis infection, in ClinicalTuberculosis, (eds P.D.O.Davies), Arnold,London, pp. 307–322.
26 Cohn D.L. and El-Sadr, W.M. (2000)Treatment of latent tuberculosisinfection, in Tuberculosis: AComprehensive International Approach,(eds R. L. B. and E.S. Hershfield), MarcelDekker, New York.
27 Woldehanna, S. and Volmink, J. (2004)Treatment of latent tuberculosisinfection in HIV infected persons.
CochraneDatabase Systematic Reviews (1),CD000171.
28 World Health Organization. (2007)Global Tuberculosis Control: Surveillance,Planning, Financing, World HealthOrganization, Geneva.
29 Dye, C.,Hosseini,M. andWatt, C. (2007)Did we meet the 2005 targets fortuberculosis control?Bulletin of theWorldHealth Organization, in press.
29a Dye, C., Ottmani, S., Laasri, L.and Bencheikh, N. (2007) The declineof tuberculosis epidemics underchemotherapy: a case study in Morocco.International Journal of Tuberculosis andLung Disease, 11, 1225–1231.
29b Vree, M., Duong, B.D., Sy, D.N., Co, N.V., Borgdorff, M.W. and Cobelens, F.G.J.(2007) Tuberculosis trends, Vietnam.Emerging Infections Diseases, 13, 332–333.
30 Suarez, P.G., Watt, C.J., Alarcon, E.,Portocarrero, J., Zavala, D., Canales, R.,Luelmo, F., Espinal, M.A. and Dye, C.(2001) The dynamics of tuberculosis inresponse to 10 years of intensive controleffort in Peru. Journal of InfectiousDiseases, 184, 473–478.
31 Hong, Y.P., Kim, S.J., Lew,W.J., Lee, E.K.and Han, Y.C. (1998) The seventhnationwide tuberculosis prevalencesurvey in Korea, 199. InternationalJournal of Tuberculosis and Lung Disease,2, 27–36.
32 China Tuberculosis ControlCollaboration. (2004). The effect oftuberculosis control in China. Lancet,364, 417–422.
33 Aditama, T.Y. (1991) Prevalence oftuberculosis in Indonesia, Singapore,Brunei Darussalam and the Philippines.Tubercle, 72, 255–260.
34 Soemantri, S., Senewe, F.P., Tjandrarini,D.H., Day, R., Basri, C., Manissero, D.,Mehta, F. and Dye, C. (2007) Threefoldreduction in the prevalence ofpulmonary tuberculosis over 25 years inIndonesia. International Journal ofTuberculosis and Lung Disease, 11,398–404.
References j19
35 Huong, N.T., Duong, B.D., Co, N.V.,Quy, H.T., Tung, L.B., Broekmans, J.F.,Bosman, M.C., Verhage, C., Kalisvaart,N., Borgdorff, M.W. and Cobelenst, F.G.(2006) Tuberculosis epidemiology in sixprovinces of Vietnam after theintroduction of the DOTS strategy.International Journal of Tuberculosis andLung Disease, 10, 963–969.
36 Gopi, P.G., Subramani, R. andNarayanan, P.R. (2006) Trend in theprevalenceofTB infectionandARTIafterimplementation of a DOTS program insouth India. International Journal ofTuberculosis and Lung Disease, 10,346–348.
37 Subramani, R., Santha, T., Frieden, T.R.,Radhakrishna, S., Gopi, P.G.,Selvakumar, N., Sadacharam, K. andNarayanan, P.R. (2006) Activecommunity surveillance of the impact ofdifferent tuberculosis control measures,Tiruvallur, South India, 1968–2001.International Journal of Epidemiology, 36,387–393.
38 Blower, S.M., McLean, A.R., Porco, T.C.,Small, P.M., Hopewell, P.C., Sanchez,M.A. andMoss, A.R. (1995) The intrinsictransmission dynamics of tuberculosisepidemics. Nature Medicine, 1, 815–821.
39 Dye, C., Garnett, G.P., Sleeman, K. andWilliams, B.G. (1998) Prospects forworldwide tuberculosis control underthe WHO DOTS strategy. Lancet, 352,1886–1891.
40 Dye, C. and Williams, B.G. (2000)Criteria for the control of drug-resistanttuberculosis. Proceedings of theNational Academy of Sciences USA, 97,8180–8185.
41 Dye, C. and Espinal, M.A. (2001) Willtuberculosis become resistant to allantibiotics? Proceedings of the RoyalSociety of London. Series B, BiologicalSciences, 268, 45–52.
42 Corbett, E.L., Charalambous, S., Moloi,V.M., Fielding, K., Grant, A.D., Dye, C.,De Cock, K.M., Hayes, R.J., Williams, B.G. and Churchyard, G.J. (2004) Human
Immunodeficiency Virus and theprevalence of undiagnosed tuberculosisin African goldminers.American Journalof Respiratory and Critical Care Medicine,170, 673–679.
43 Salomon, J.A., Lloyd-Smith, J.O., Getz,W.M., Resch, S., Sanchez,M.S., Porco, T.C. and Borgdorff, M.W. (2006) Prospectsfor advancing tuberculosis controlefforts through novel therapies. PLoSMedicine, 3, e273.
44 Keeler, E., Perkins, M.D., Small, P.,Hanson, C., Reed, S., Cunningham, J.,Aledort, J.E., Hillborne, L., Rafael, M.E.,Girosi, F. and Dye, C. (2007) Reducingthe global burden of tuberculosis: thecontribution of improved diagnosis.Nature, 444, 49–57.
45 Young, D.B. and Dye, C. (2006) Thedevelopment and impact of tuberculosisvaccines. Cell, 124, 683–687.
46 Dye, C. and Williams, B.G. Eliminatinghuman tuberculosis in the 21st century.PLoS Biology, submitted.
47 Styblo, K. (1991) Epidemiology ofTuberculosis, 2nd edn KNCVTuberculosis Foundation, TheHague, 1–136.
48 Borgdorff, M.W., Floyd, K. andBroekmans, J.F. (2002) Interventions toreduce tuberculosis mortality andtransmission in low- andmiddle-incomecountries. Bulletin of the World HealthOrganization, 80 (3), 217–227.
49 Gajalakshmi, V., Peto, R., Kanaka, T.S.and Jha, P. (2003) Smoking andmortalityfrom tuberculosis and other diseases inIndia: retrospective study of 43000 adultmale deaths and 35000 controls. Lancet,362, 507–515.
50 Ponce-De-Leon, A., Garcia-GarciaMd Mde, L., Garcia-Sancho, M.C.,Gomez-Perez, F.J., Valdespino-Gomez,J.L., Olaiz-Fernandez, G., Rojas, R.,Ferreyra-Reyes, L., Cano-Arellano, B.,Bobadilla, M. and Small, P.M.(2004) Tuberculosis and diabetes insouthern Mexico. Diabetes Care, 27,1584–1590.
20j 1 Global Epidemiology and Control of Tuberculosis
51 Coker, R., McKee, M., Atun, R.,Dimitrova, B., Dodonova, E., Kuznetsov,S. and Drobniewski, F. (2006) Riskfactors for pulmonary tuberculosis inRussia: case–control study. BritishMedical Journal, 332, 85–87.
52 Kim, S.J., Hong, Y.P., Lew, W.J., Yang, S.C. and Lee, E.G. (1995) Incidence ofpulmonary tuberculosis amongdiabetics. Tubercle and Lung Disease, 76,529–533.
53 Jick, S.S., Lieberman E.S., Rahman, M.U. and Choi, H.K. (2006) Glucocorticoiduse, other associated factors, and the riskof tuberculosis. Arthritis andRheumatology, 55, 19–26.
54 Verver, S., Warren, R.M., Beyers, N.,Richardson, M., van der Spuy, G.D.,Borgdorff, M.W., Enarson, D.A., Behr,M.A. and vanHelden, P.D. (2005)Rate ofreinfection tuberculosis after successfultreatment is higher than rate of newtuberculosis. American Journal ofRespiratory and Critical Care Medicine,171 (12), 1430–1435.
55 Stevenson, C.R., Forouhi, N.G., Roglic,G., Williams, B.G., Lauer, J.A., Dye, C.and Unwin, N.C. (2007) Diabetesand tuberculosis : the impact of thediabetes epidemic on tuberculosisincidence, BMC Public Health, 7, 234.
56 Lin, H.H., Ezzati, M. and Murray, M.(2007) Tobacco smoke, indoor airpollution and tuberculosis: A systematicreview andmeta-analysis.PLoSMedicine,4, e20.
57 Bates, M.N., Khalakdina, A., Pai, M.,Chang, L., Lessa, F. and Smith, K.R.(2007) Risk of tuberculosis fromexposure to tobacco smoke: a systematicreview and meta-analysis. Archives ofInternal Medicine, 167, 335–342.
58 Whiting, D.R., Setel, P.W.,Chandramohan, D., Wolfson, L.J.,Hemed, Y. and Lopez, A.D. (2006)Estimating cause-specific mortality fromcommunity- and facility-based sources inthe United Republic of Tanzania:options and implications for mortalityburden estimates. Bulletin of the WorldHealth Organization, 84, 940–948.
59 Pai,M., Kalantri, S. andDheda, K. (2006)New tools and emerging technologies forthe diagnosis of tuberculosis: Part I.Latent tuberculosis. Expert Review ofMolecular Diagnostics, 6, 413–422.
59a Menzies, D., Pai, M. and Comstock, G.(2007) Meta-analysis: new tests for thediagnosis of latent tuberculosisinfection: areas of uncertainty andrecommendations for research.Annals of Internal Medicine, 146,340–354.
60 Schechter, M., Zajdenverg, R., Falco, G.,Barnes, G.L., Faulhaber, J.C., Coberly, J.S., Moore, R.D. and Chaisson, R.E.(2006) Weekly rifapentine/isoniazidor daily rifampin/pyrazinamide forlatent tuberculosis in householdcontacts. American Journal ofRespiratory and Critical Care Medicine,173, 922–926.
References j21
