1 geostrophic balance in the northern hemisphere with the wind straight at your back: –the...
TRANSCRIPT

1
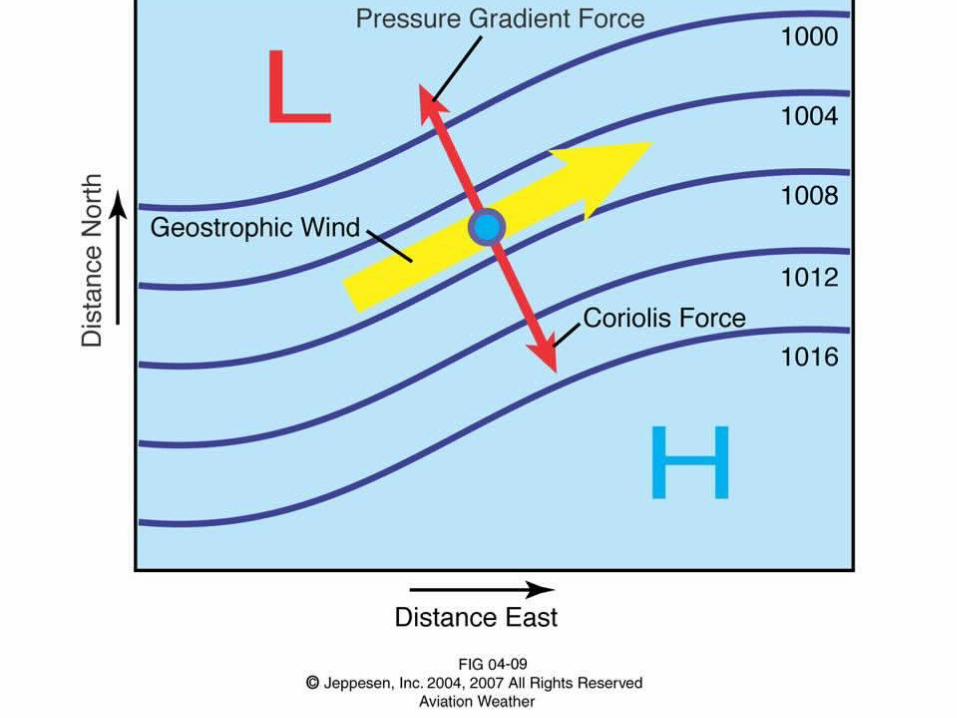
Geostrophic Balance• In the Northern Hemisphere with the wind
straight at your back:– the coriolis force acts from your left to right. – The Pressure gradient force acts from your rt. to left– 1. Low Pressure is at your left– 2. The closer the isobars the stronger the Pressure
Gradient Force and wind– 3. In Northern Hemisphere winds around a Low
blow CCW and blow CW around a High– 4. Geostrophic balance does not occur in small
scale circulations: Tornadoes, Thunderstorms, sea breezes etc.
Ch 4
Sec E
2
Geostrophic Balance
Ch 4
Sec E
3
Estimating Winds from Isobars and Contours
• Geostrophic balance is best observed on a 500mb analysis chart because friction effects with the surface of the Earth are reduced.
• Lines on a constant pressure chart are contours of equal altitude.
• The difference between Pressure Altitude and True Altitude is called “D”.
D=TA-PA.
Ch 4
Sec E
4
Estimating Winds from Isobars and Contours
• The difference between Pressure Altitude and True Altitude is called “D”. D=TA-PA.
• Remember PA=Elevation+(29.92-AS)*1000• Where AS is the Altimeter Setting• So D=TA –(29.92-AS)*1000ft – elevation• If you’re on the ground D= (AS-29.92)*1000ft• The bigger the |D| the bigger the wind• If D is negative you're near a LOW(Bad Wx)• Simply: if AS is less than 29.92 your in a LOW
Ch 4
Sec E

5
Friction Effects on Wind
• Surface friction has greatest effect on the first 2000 AGL. This is called the boundary layer.
• AGL Above Ground Level.• Anemometer Level is usually 10m AGL
• (Book says 30ft really closer to 33ft)• At this level the wind blows more toward the
low.• The angle between the wind and the isobars
can range from 10o to 45o
• At 2000ft wind is more parallel to isobars
Ch 4
Sec F

6
Friction Effects on Wind
Ch 4
Sec F

7
Charateristics of Wind
• 1. Wind increases with altitude• 2. Wind is more aligned with isobars
with higher altitude.• 3. In higher winds, winds are more turbulent as you
get closer to the ground in the boundary layer.• 4. The Boundary is layer is deeper in the day and in
the warmer months of the year.• 5. In a strong wind the boundary layer is thicker over
rough terrain.• Cyclones are CCW spirals in the Northern Hemi.• Storms may mask all of the above generalizations.
Ch 4
Sec F
8
Other Effects on Wind
• Wind follows the contour of the land• Near Mountains the wind goes up and
down up and over the mountain.• A Microburst is a sudden very intense
downpour of rain. It may produce intense downward wind. Famous L1011 DFW Fl191 crash in 1985
• Tornadic Winds: Tornadoes and Dust Devils
Ch 4
Sec F
9
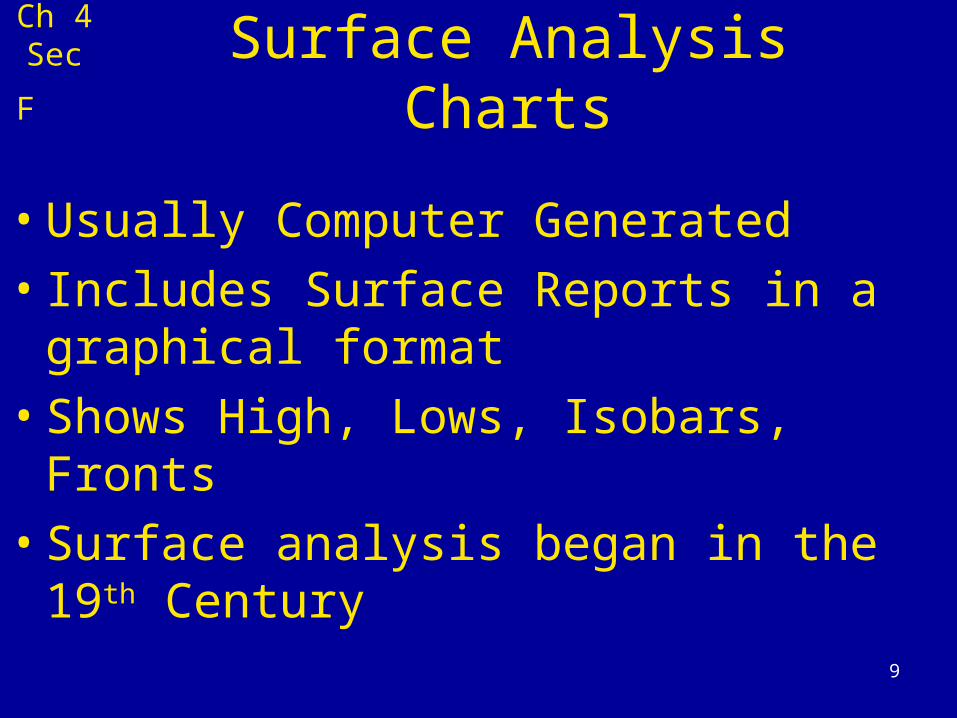
Surface Analysis Charts
• Usually Computer Generated
• Includes Surface Reports in a graphical format
• Shows High, Lows, Isobars, Fronts
• Surface analysis began in the 19th Century
Ch 4
Sec F
10
Surface Analysis Charts
• Usually Computer Generated
• Includes Surface Reports in a graphical format
• Shows High, Lows, Isobars, Fronts
• Surface analysis began in the 19th Century
Ch 4
Sec F

11
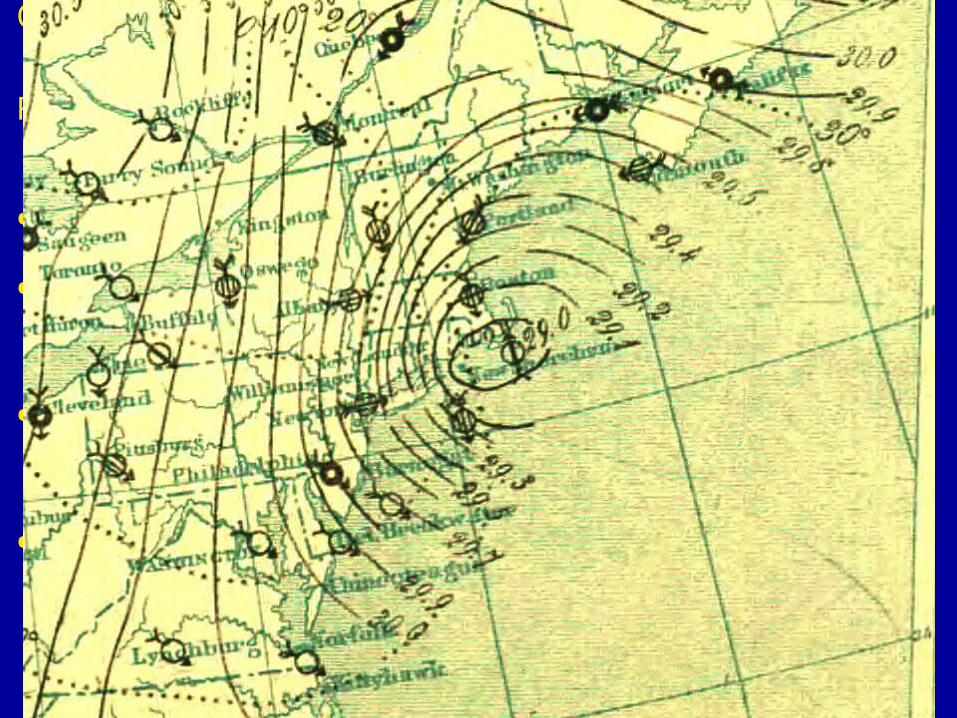
Surface Analysis Charts
• Usually Computer Generated
• Includes Surface Reports in a graphical format
• Shows High, Lows, Isobars, Fronts
Ch 4
Sec F

12
Surface Analysis ChartsCh 4
Sec F

13
Winds are named by where they blow from.
Ch 4
Sec F N 360.0 degrees
NNE 22.5 degreesNE 45.0 degreesENE 67.5 degreesE 90.0 degreesESE 112.5 degreesSE 135.0 degreesSSE 157.5 degreesS 180.0 degreesSSW 202.5 degreesSW 225.0 degreesWSW 247.5 degreesW 270.0 degreesWNW 292.5 degreesNW 315.0 degreesNNW 337.5 degrees
NENW
SW
NN
E
N
S
EW
SE
14
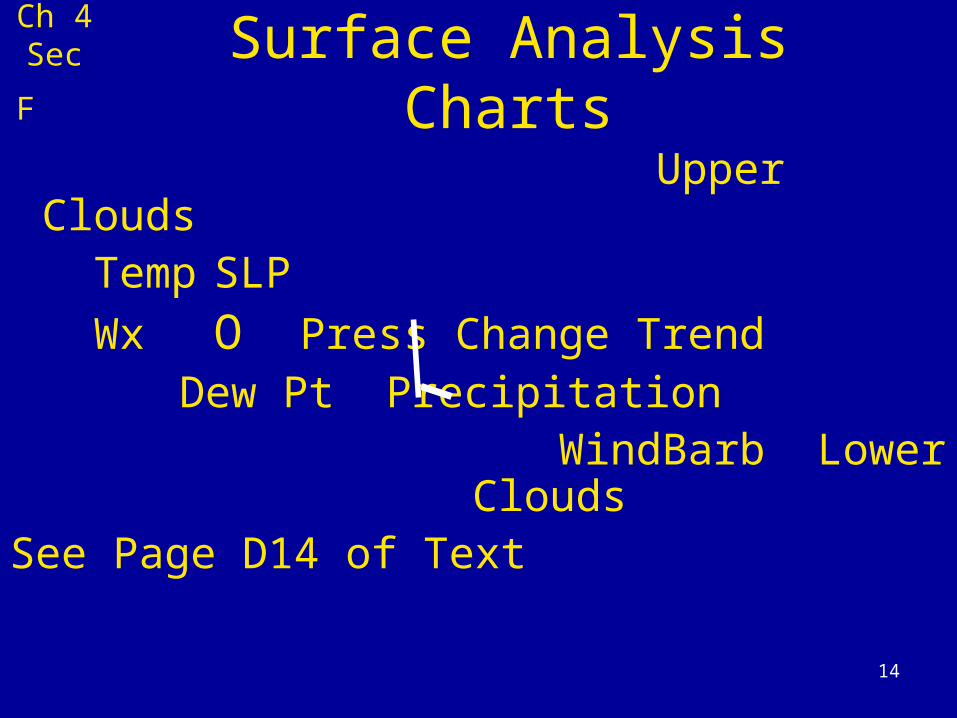
Surface Analysis Charts
Upper Clouds Temp SLP
WxO Press Change Trend Dew Pt Precipitation WindBarb
Lower Clouds
See Page D14 of Text
Ch 4
Sec F
15
Surface Analysis ChartsCh 4
Sec F
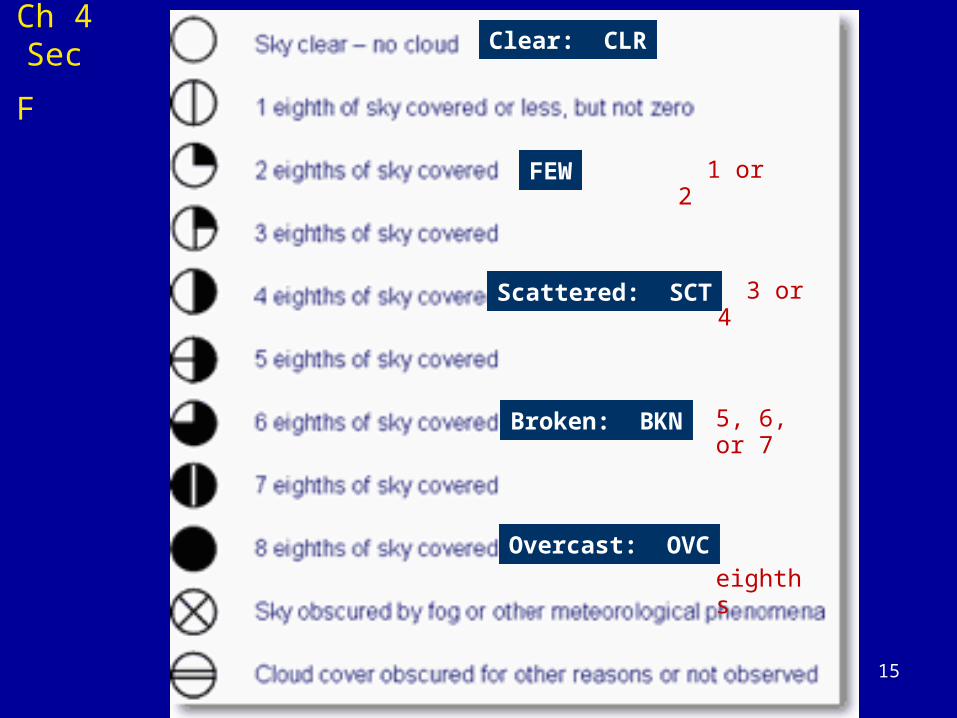
FEW
Scattered: SCT
Broken: BKN
Overcast: OVC
Clear: CLR
3 or 4
1 or 2
5, 6, or 7 eighths

16
Surface Analysis WeatherCh 4
Sec F
17
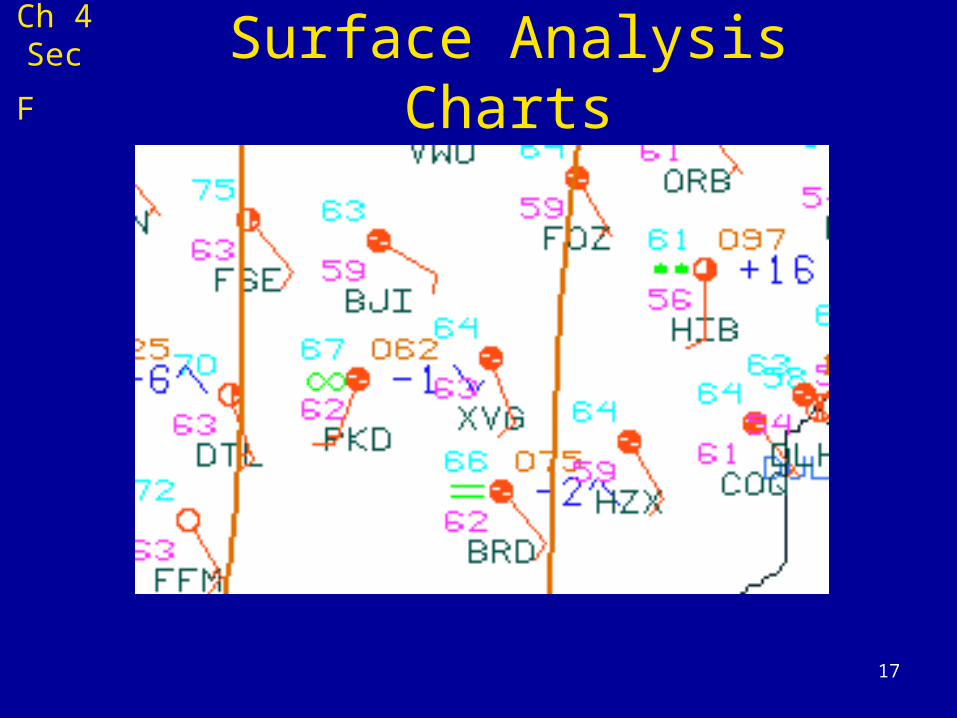
Surface Analysis ChartsCh 4
Sec F