1 cornerstones of managerial accounting, 2e copyright © 2008 thomson south-western, a part of the...
TRANSCRIPT

1
Cornerstones of Managerial Accounting, 2e
Cornerstones of Managerial Accounting, 2e
Copyright © 2008 Thomson South-Western, a part of the Thomson Corporation. Thomson, the Star logo, and South-Western are trademarks used herein under
license.
Mowen/Hansen
Cost BehaviorChapter Three

2
Cost Behavior
The way costs change as the related activity changes
Fixed Cost A cost that does not change in total as output changes
---

3
Cost Behavior
The way costs change as the related activity changes
Variable Cost Increases in total with an increase in output and decreases in total with a decrease in output
---

4
Measures of Output
“What causes the cost of this particular activity to go up (or down)?”
To determine if a cost is fixed or variable, we must first determine the underlying business activity and ask ourselves….
In other words, we are trying to identify its driver.

5
Relevant Range
The range of output over which the assumed cost relationship is valid for the normal
operations of a firm.
Let’s take a closer look at fixed, variable and mixed
costs in light of the relevant range.
• Avoids extremely high levels of activity• Avoids extremely low levels of activity

6
Fixed Costs
Costs that in total are constant within the relevant range as the level of output increases or decreases.

7
Example
• It process up to 50,000 computers per year. • The production-line manager (supervisor) is paid
$32,000 per year.• The company was established 5 years ago.• Currently the factory produces 40,000 – 50,000
computers per year. • Production has never fallen below 20,000
computers in a year.
Colley Computers Inc. wants to look at the cost relationship between supervision cost and the number of computers processed.
Let’s look at the cost of supervision at several
production levels.

8
# of Computers Produced
20,000
30,000
40,000
50,000
Total Cost of Supervision
$32,000
$32,000
$32,000
$32,000We know the total cost of supervision, but what about per computer?
Unit Cost
Example

9
# of Computers Produced
20,000
30,000
40,000
50,000
Total Cost of Supervision
$32,000
$32,000
$32,000
$32,000
Unit Cost
Example
$1.60
1.07
0.80
0.64Unit cost changes! As production increases, the per
unit amount of a fixed cost decreases.

10
Discretionary Fixed Costs
Fixed costs that can be changed relatively easily at management
discretion

11
Committed Fixed Costs
A fixed cost that cannot be easily changed. Often these involve a long-
term contract

12
Variable Costs
Costs that in total vary in direct proportion to changes in output within
the relevant range
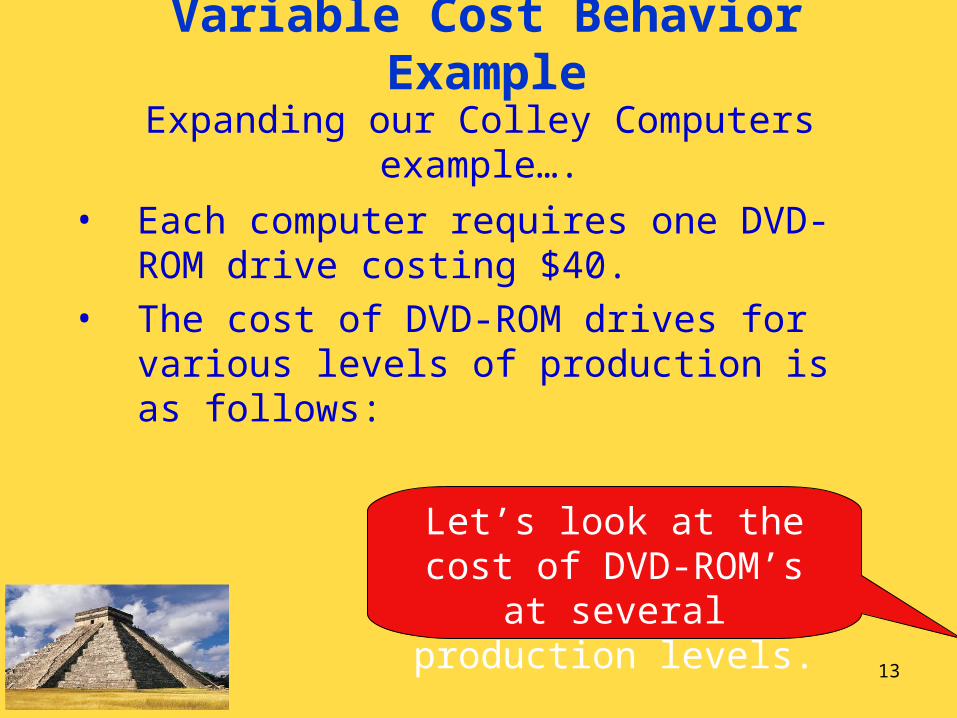
13
Variable Cost Behavior Example
• Each computer requires one DVD-ROM drive costing $40.
• The cost of DVD-ROM drives for various levels of production is as follows:
Expanding our Colley Computers example….
Let’s look at the cost of DVD-ROM’s at several
production levels.

14
# of Computers Produced
20,000
30,000
40,000
50,000
Total Cost of DVD-ROM Drives
$800,000
$1,200,000
$1,600,000
$2,000,000
Unit Cost
We know the total cost increases as production
increases. But what about the cost per computer?
Variable Cost Behavior Example

15
# of Computers Produced
20,000
30,000
40,000
50,000
Total Cost of DVD-ROM Drives
$800,000
$1,200,000
$1,600,000
$2,000,000
Unit Cost
Example:
$40
40
40
40Unit Cost stays the same! The per unit variable cost of DVD-ROM drives is always
$40 per computer.

16
Total Variable Cost
Variable Rate
x Amount of Output=
Variable Cost Relationship
Let’s look at the DVD-ROM costs for 50,000 computers.

17
Total Variable Cost
Variable Rate
x Amount of Output=
50,000 computers
$40 per computer x=$2,000,000
Variable Cost Relationship

18
Mixed Costs
Costs that have both a fixed and a variable component.
Formula:
Total Cost =Total Fixed
Cost+
Total Variable Cost
Let’s look at an example from the Colley Computers

19
Example:
Colley Computers has 10 sales representatives.
Let’s plug this into our mixed cost formula.
• Each earns a salary of $30,000 per year.• And a commission of $25 per computer sold.• Each sales rep sells up to 50,000 computers
per year.
20
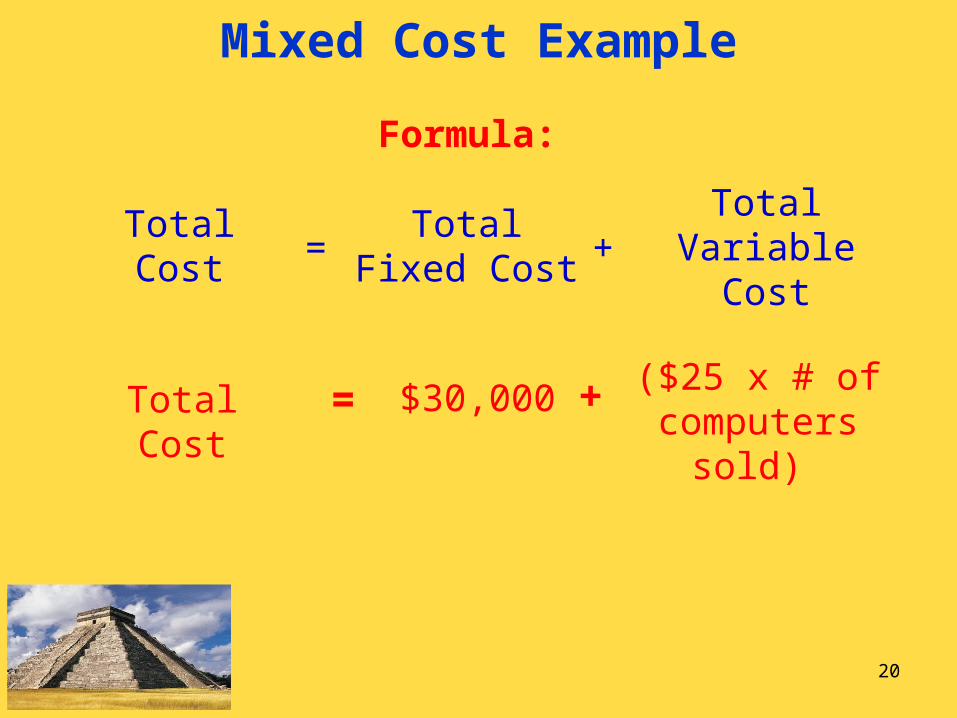
Mixed Cost Example
Formula:
Total Cost =Total Fixed
Cost+
Total Variable Cost
($25 x # of computers sold)
$30,000 +=Total Cost

21
Step Costs
Displays a constant level of cost for a range of output and then jumps to a
higher level of cost at some point, where it remains for a similar range of output

22
Separating Costs
Accounting records typically show only the total cost and the associated amount of
activity of a mixed cost item.
Therefore, it is necessary to separate the total cost into its fixed and variable
components.
How do we separate the costs?

23
1.High-Low method
2.Scattergraph method
3.Method of Least Squares
Separating Costs
Three methods:

24
Dependent Variable in the Cost Formula
Total Cost
= Total Fixed Cost
+ Total Variable Cost
Variable Rate x OutputTotal Cost
= Total Fixed Cost
+ Variable Rate
x Output
Dependent Variable

25
Dependent Variable
A variable whose value depends on the value of another variable

26
Independent Variable in the Cost Formula
Total Cost
= Total Fixed Cost
+ Total Variable Cost
Total Cost
= Total Fixed Cost
+ Variable Rate
x Output
Independent Variable

27
Independent Variable
A variable that measures output and explains changes in the cost

28
Intercept
Graphically, the intercept is the point at which the cost line intercepts the cost
(vertical) axis
Intercept

29
Intercept in the Cost Formula
Total Cost
= Total Fixed Cost
+ Total Variable Cost
Total Cost
= Total Fixed Cost
+ Variable Rate
x Output
Intercept
30
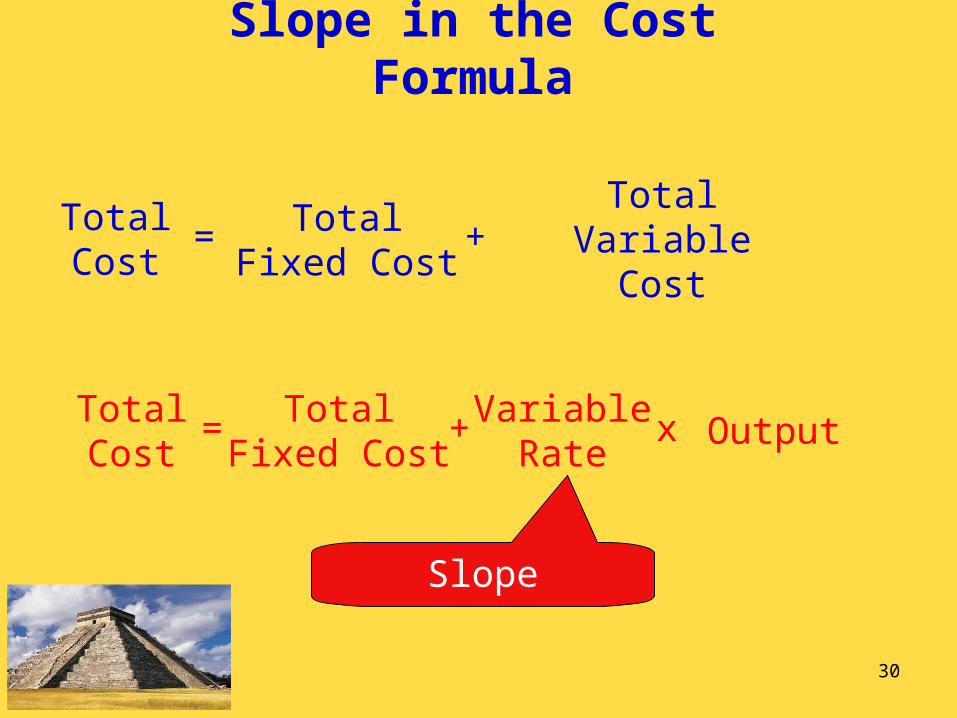
Slope in the Cost Formula
Total Cost
= Total Fixed Cost
+ Total Variable Cost
Total Cost
= Total Fixed Cost
+ Variable Rate
x Output
Slope

31
Slope
Corresponds to the variable rate (the variable cost per unit of output). It is
the slope of the cost line.
Let’s work through an example.

32
High-Low Method
A method of separating mixed costs into fixed and variable components by using just the high and low data points
Step #1 Find the high point and low point.

33
High-Low Method
Step #2 Using the high and low points, calculate the variable rate.
Variable rate =High point cost – Low point cost
High point output – Low point output
34
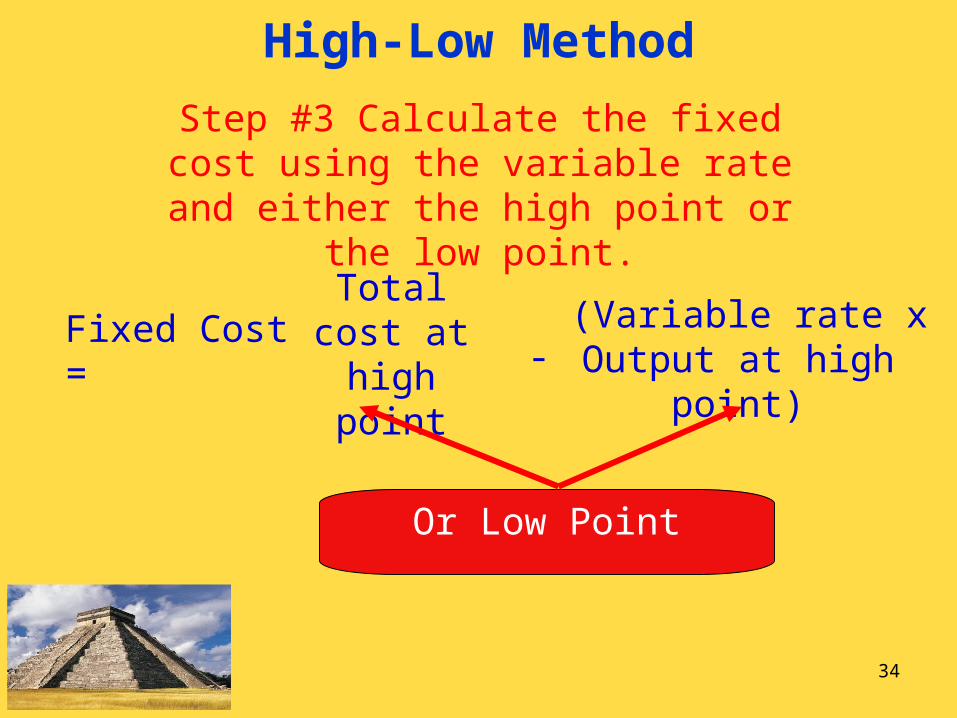
High-Low Method
Step #3 Calculate the fixed cost using the variable rate and either the high point or
the low point.
Fixed Cost = Total cost at high point
(Variable rate x Output at high point)
-
Or Low Point

35
High-Low Method
Step #4 Form the cost formula based on the high-low method.
Cornerstone 3-2 will walk us through an example of the
High-Low Method

36
Scattergraph Method
Purpose of this method:• To see whether or not a straight line
reasonably describes the cost relationship
• To reveal one or more points that do not seem to fit the general pattern of behavior
37
Scattergraph Method
Applying the method:• Draw a graph with units on the x-axis
and cost on the y-axis• Plot the data points on the graph• Visually fit a line to the data points on
the graph.• The intercept is the fixed cost.• Use the high-low method to determine
the variable rate.

38
Scattergraph Method
Disadvantage:
Lack of any objective criterion for choosing the best-fitting line.
We need a method that is objective and produces the
best-fitting line.

39
Method of Least Squares
A statistical way to find the best-fitting line through a set of data points.
What does best-fitting mean?
The line is one in which the data points are closer to the line than to any other line.

40
Method of Least Squares
▪▪▪
▪▪
▪ ▪▪
Measure distance from points to line.
Then square the differences. Add up
all the squared differences.

41
Method of Least Squares
Spreadsheet programs have packages to calculate the best-fitting line (called
regression line).
42
Managerial Judgment
Instead of the three methods previously discussed, many managers simply use their experience and past observation of cost relationships to
determine fixed and variable costs.
The appeal of this method is its simplicity.

43
Managerial Judgment with Estimation
Managers may use experience and judgment to refine statistical estimation
results.
Statistical techniques are highly accurate in depicting
the past, but they cannot foresee the future.