1 cocomo ii integrated with crystal ball ® risk analysis software clate stansbury mcr, llc...
TRANSCRIPT

1
COCOMO II Integrated withCrystal Ball® Risk Analysis Software
Clate StansburyMCR, LLC
[email protected](703) 506-4600
Prepared for
19th International Forum on COCOMO Software Cost ModelingUniversity of Southern California
Los Angeles CA27 October 2004

2
Contents
• Purpose: Describing Uncertainty• Representing Uncertain Inputs• Simulating Costs• Correlating Inputs and Costs• Summary
3
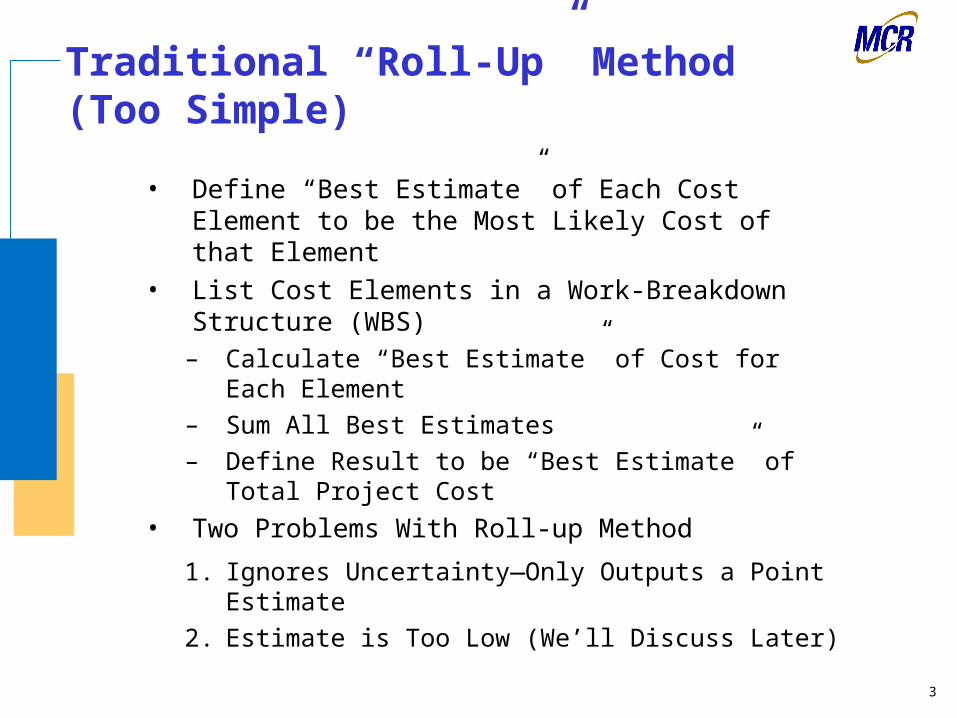
Traditional “Roll-Up” Method (Too Simple)
• Define “Best Estimate” of Each Cost Element to be the Most Likely Cost of that Element
• List Cost Elements in a Work-Breakdown Structure (WBS)
– Calculate “Best Estimate” of Cost for Each Element– Sum All Best Estimates– Define Result to be “Best Estimate” of Total Project
Cost
• Two Problems With Roll-up Method
1. Ignores Uncertainty—Only Outputs a Point Estimate
2. Estimate is Too Low (We’ll Discuss Later)

4
Estimators Must Describe Uncertainty
• Report Cost As a Statistical Quantity, Not a Point– Cost of Any Incomplete Program Is Uncertain
– Estimator Must Report That Uncertainty as Part of His or Her Delivered Estimate
• Cost-risk Analysis Allows Estimator to Report Cost As a Probability Distribution, So Decision-maker Is Made Aware of
– Expected Cost (Mean)
– 50th Percentile Cost (Median)
– 80th Percentile Cost
– Overrun Probability of Project Budget

5
What a Cost Estimate Should Look Like
“S-Curve”
“Density Curve”
Frequency Chart
.000
.005
.010
.015
.020
0
49.25
98.5
147.7
197
462.43 537.16 611.89 686.62 761.35
10,000 Trials 71 Outliers
Forecast: A8
Cumulativ e Chart
.000
.250
.500
.750
1.000
0
10000
462.43 537.16 611.89 686.62 761.35
10,000 Trials 71 Outliers
Forecast: A8
(Crystal Ball Outputs)

6
Representing Uncertain Inputs Using Triangular Distributions

7
Triangular Distribution of Element Cost, Reflecting Uncertainty in “Best” Estimate
OptimisticCost
Best-Estimate Cost (Mode = Most Likely)
Cost Implication of Technical, Programmatic Assessment
DE
NS
ITY
L M H$

8
COCOMO Cost Drivers as Triangular Distributions
Why triangular distribution?
• Triangular Distribution is Simple and Malleable
• Parameters (Optimistic, Most Likely, Pessimistic) Are Easy to Define and Explain
• Could Have User Provide Parameters for Normal, Lognormal, Exponential, Uniform, or Beta Distributions, for Example, if More is known about the distributions
• Good Topic for Further Research….

9
COCOMO Cost Drivers as Triangular Distributions
• For Each COCOMO II Input …– Input Request Interpreted as a Triangular Distribution– User Estimates Optimistic, Most Likely, and Pessimistic Values
(which may not always be all different from each other)
Optimistic Pessimistic
Most Likely (mode)
Prob
ability
Cost
User provides three values for each COCOMO II input, as though there were three separate projects.
Range of Realistic Input Values

10
COCOMO Cost Drivers as Triangular Distributions
0.90 1.14
11
Processing Uncertainty Using Simulations

12
How to Process Triangular Distributions?
• Taking the Product of Effort Multipliers When Each EM is a Triangular Distribution?
• How to Sum Code Counts for All CSCIs?
• How to Compute Rest of COCOMO II Algorithm?

13
Process Optimistic, ML, Pessimistic as 3 Separate Projects (Too Simple)
• Perform “Roll-up” Method Three Times– Input Optimistic Values into COCOMO II
– Input Most Likely Values into COCOMO II
– Input Pessimistic Values into COCOMO II
• Obtain Total Project Effort as a Triangular Distribution

14
Why “Roll-up” Doesn’t Work
MERGE INPUT DISTRIBUTIONS INTO TOTAL-COST DISTRIBUTION
ROLL-UP TO MOST LIKELYTOTAL COST
REAL MOST LIKELYTOTAL COST
$
WBS-ELEMENT TRIANGULAR INPUT DISTRIBUTIONS
.
.
.
$
$
$MostLikely
MostLikely
MostLikely

15
Use Monte Carlo Simulation to Process the Input Triangular Distributions
Trial 2Trial 10,000Trial 1
=SUM($G$4:$G$8)
Assumption Cell G5
Total Cost
Forecast

16
Crystal Ball Risk- Analysis Software• Commercially Available Third-Party Software Add-on to
Excel, Marketed by Decisioneering, Inc., 2530 S. Parker Road, Suite 220, Aurora, CO 80014, (800) 289-2550
• Inputs– Parameters Defining WBS-Element Distributions– Rank Correlations Among WBS-Element Cost Distributions
• Mathematics– Monte-Carlo (Random) or Latin Hypercube (Stratified)
Statistical Sampling– Virtually All Probability Distributions That Have Names Can Be
Used– Suggests Adjustments to Inconsistent Input Correlation Matrix
• Outputs– Percentiles and Other Statistics of Program Cost– Cost Probability Density and Cumulative Distribution Graphics

17
Representing Correlations Among Risks
18
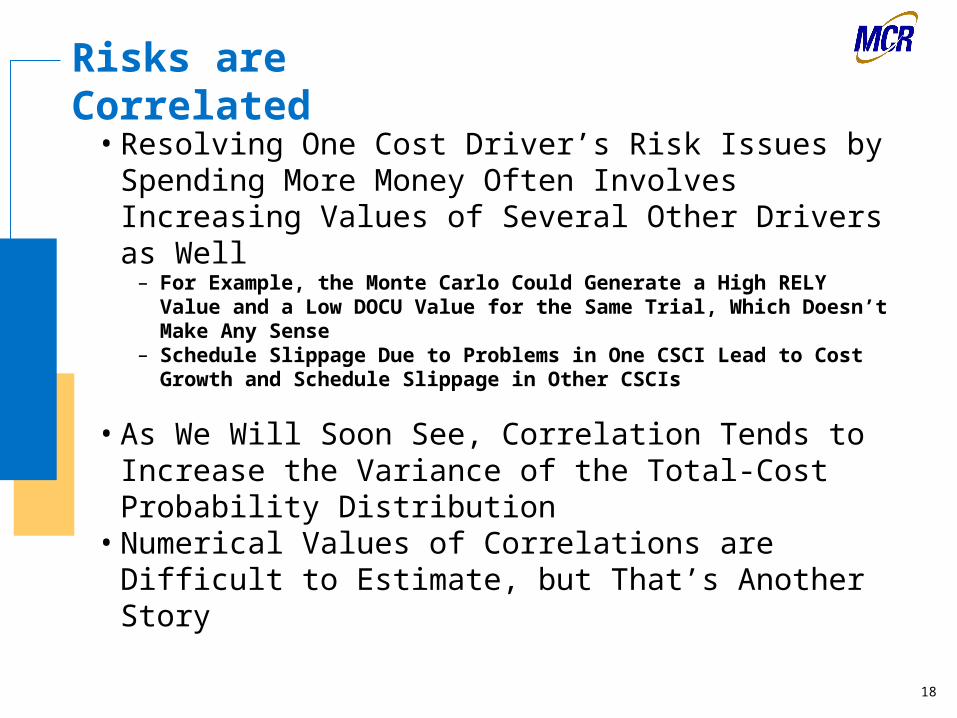
Risks are Correlated
• Resolving One Cost Driver’s Risk Issues by Spending More Money Often Involves Increasing Values of Several Other Drivers as Well
– For Example, the Monte Carlo Could Generate a High RELY Value and a Low DOCU Value for the Same Trial, Which Doesn’t Make Any Sense
– Schedule Slippage Due to Problems in One CSCI Lead to Cost Growth and Schedule Slippage in Other CSCIs
• As We Will Soon See, Correlation Tends to Increase the Variance of the Total-Cost Probability Distribution
• Numerical Values of Correlations are Difficult to Estimate, but That’s Another Story

19
Maximum Possible Underestimation of Total-Cost Sigma
• Percent Underestimated σ When Correlation Assumed to be 0 Instead of (n=# of Input Values)
0
20
40
60
80
100
0 0.1 0.2 0.3 0.4 0.5 0.6 0.7 0.8 0.9 1
Actual Correlation
Perc
ent U
ndere
stim
ate
d
n = 10
n = 30
n = 100n = 1000
0
20
40
60
80
100
0 0.1 0.2 0.3 0.4 0.5 0.6 0.7 0.8 0.9 1
Actual Correlation
Perc
ent U
ndere
stim
ate
d
n = 10
n = 30
n = 100n = 1000

20
Determining Correlations Among COCOMO II Cost Drivers
• Default Correlations to 0.2
• More Detailed Default Correlations?– Higher Correlation Between RELY and DOCU?
– COCOMO II Security Extension Cost Driver Related to Existing Cost Drivers

21
Summary
• Estimator Must Model Uncertainty• Describe Uncertainty by Representing COCOMO
Inputs as Triangular Distributions• Calculate Implications of Uncertainty by Using
Monte Carlo or Latin Hypercube Simulations to Perform COCOMO II Algorithm
• Consider Correlation Among CSCI Risks and Costs
• Professional Software, e.g., Crystal Ball, is Available to do Computations
22
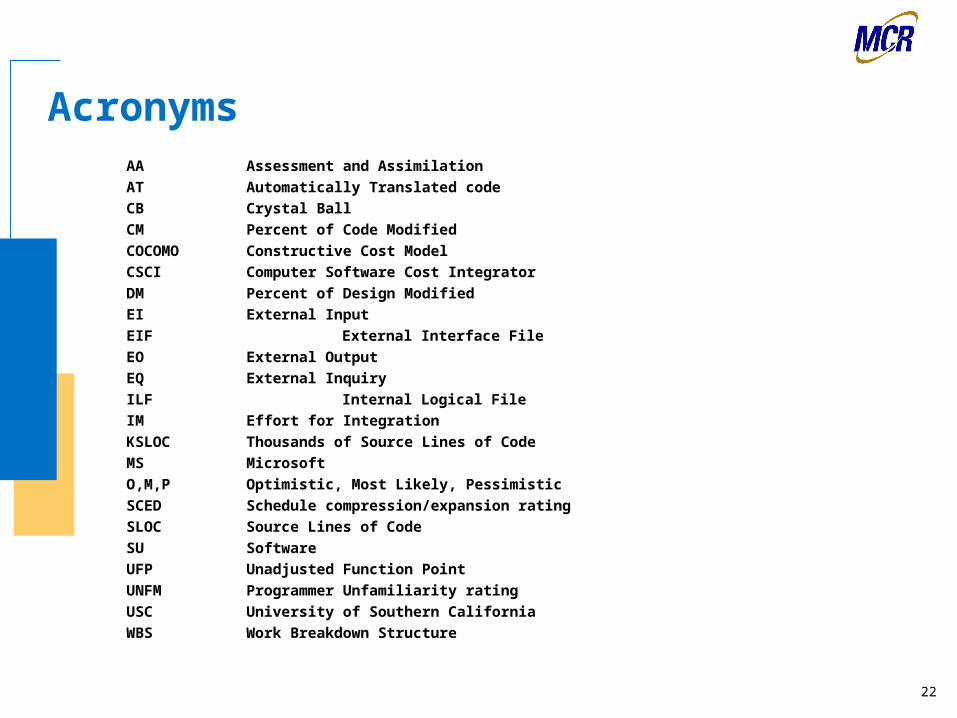
AcronymsAA Assessment and Assimilation
AT Automatically Translated code
CB Crystal Ball
CM Percent of Code Modified
COCOMO Constructive Cost Model
CSCI Computer Software Cost Integrator
DM Percent of Design Modified
EI External Input
EIF External Interface File
EO External Output
EQ External Inquiry
ILF Internal Logical File
IM Effort for Integration
KSLOC Thousands of Source Lines of Code
MS Microsoft
O,M,P Optimistic, Most Likely, Pessimistic
SCED Schedule compression/expansion rating
SLOC Source Lines of Code
SU Software
UFP Unadjusted Function Point
UNFM Programmer Unfamiliarity rating
USC University of Southern California
WBS Work Breakdown Structure

23
Backup Slides
24
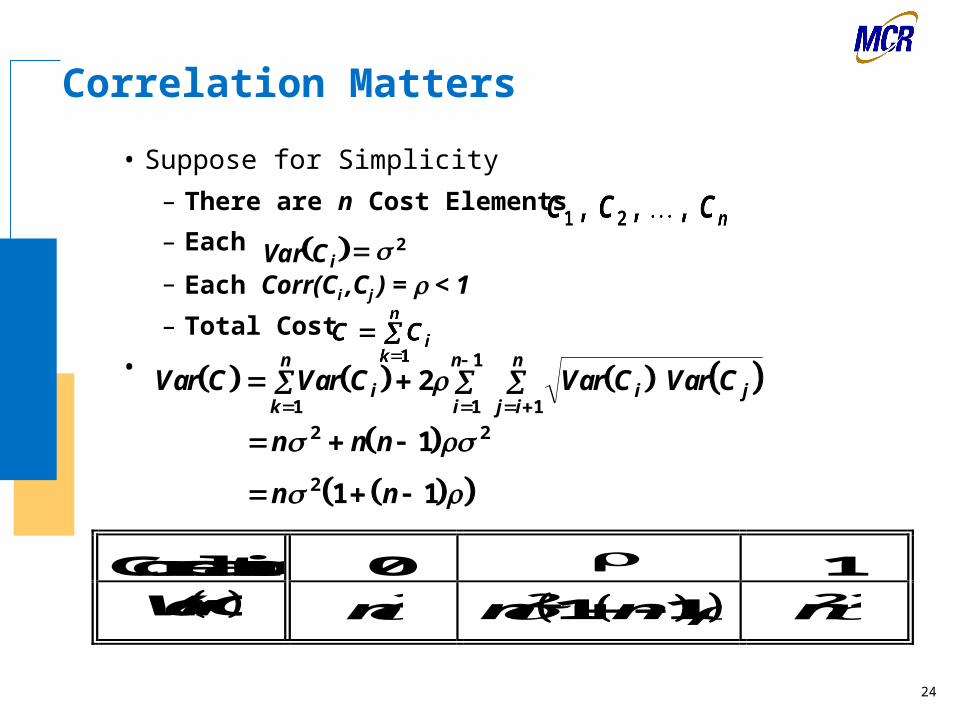
Correlation Matters
• Suppose for Simplicity
– There are n Cost Elements
– Each
– Each Corr(Ci ,Cj ) = < 1
– Total Cost
•
Var C i 2
Var C Var C Var C Var Cik
n
i
n
j i
n
i j
1 1
1
12
n n n 2 21
n n 2 1 1
Correlation 0 1
VarC n2 n n 21 1 n22

25
Correlation Matrices Allow User to Adjust Correlations
• One Matrix for Each CSCI Allows Estimator to Set Correlations Among Cost Drivers for that CSCI
How to Record Inter-CSCI Information?
• One Matrix for All Inputs in All CSCI’sDifficult for User (and Developer!) to Manipulate
• One Matrix for Project with which the Estimator Sets Correlations Among the Efforts of the CSCI’s
But CSCI Costs are Not Inputs (aka Assumptions). Only Inputs Can Be Correlated

26
Selection of Correlation Values• “Ignoring” Correlation Issue is Equivalent to
Assuming that Risks are Uncorrelated, i.e., that All Correlations are Zero
• Square of Correlation (namely, R2) Represents Percentage of Variation in one WBS Element’s Cost that is Attributable to Influence of Another’s
• Reasonable Choice of Nonzero Values Brings You Closer to Truth
• Most Elements are, in Fact, Pairwise Correlated• 0.2 is at “Knee” of Curve on Previous Charts, thereby
Providing Most of the Benefits at Least Commitment
Correlation % Influenced
0.00 0%0.10 1%0.32 10%0.50 25%0.71 50%

27
Cost-Risk Analysis Works by Simulating System Cost
• In Engineering Work, Computer Simulation of System Performance is Standard Practice, with Key Performance Characteristics Modeled by Monte Carlo Analysis as Random Variables, e.g.
– Data Throughput– Time to Lock– Time Between Data Receipt and Delivery– Atmospheric Conditions
• Cost-Risk Analysis Enables the Cost Analyst to Conduct a Computer Simulation of System Cost
– WBS-element Costs Are Modeled As Random Variables– Total System Cost Distribution is Determined by Monte
Carlo Simulation– Cost is Treated as a Performance Criterion

28
Traditional “Roll-Up” Method (Too Simple)
• Define “Best Estimate” of Each Cost Element to be the Most Likely Cost of that Element
• List Cost Elements in a Work-Breakdown Structure (WBS)
– Calculate “Best Estimate” of Cost for Each Element
– Sum All Best Estimates– Define Result to be “Best Estimate” of Total
Project Cost
• Unfortunately, It Turns Out That Things are Not as Simple as They Seem – There are a Lot of Problems with This Approach