1 clg handout problem #1 (examining interaction plots)
TRANSCRIPT

1
CLG Handout
Problem #1
(Examining interaction plots)
2
Interpreting interaction plots
Be aware that you will never get “perfect” results from looking at a plot. In most cases we are identifying what we think is the case and certainly we need to follow up what we think we see with some hard numbers to verify it. So as we interpret the next 6 graphs, although we can comment on what we think we see, ultimately the F tests will tell us significance or not.


4
(A)
Interaction None. Lines are parallel.
Drug effect None.
Gender effect Yes, probably—looks like it would be significant. (Men higher than
women)
General interpretation Only a Gender difference!


6
(B)
Interaction None. Lines are parallel.
Drug effect Yes, response goes down with Drug level 1. F test would
determine if its significant.
Gender effect No. Men and women are nearly the same.
General interpretation Only a Drug effect!


8
(C)
Interaction Yes. Lines are NOT parallel.
Drug effect Not sure (probably though). Either way it’s tied to the interaction
anyway.
Gender effect Yes, probably, but also tied to the interaction.
General interpretation “Typical” interaction. Drug seems to work for the only the women
but not for the men. Can’t discuss main effects by themselves.

10
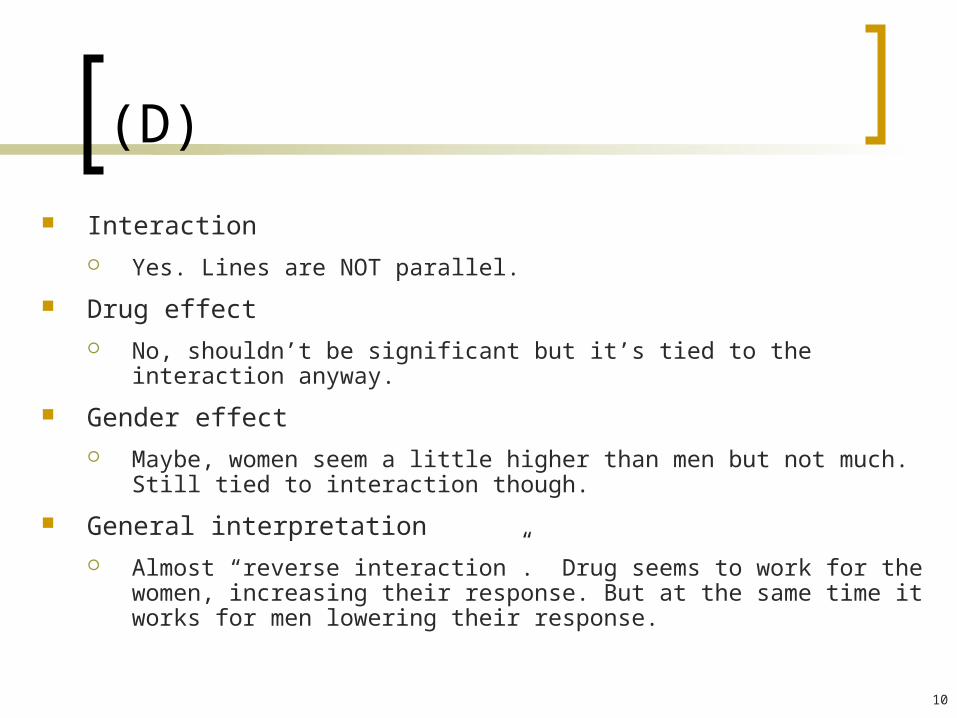
(D)
Interaction Yes. Lines are NOT parallel.
Drug effect No, shouldn’t be significant but it’s tied to the interaction anyway.
Gender effect Maybe, women seem a little higher than men but not much. Still tied to
interaction though.
General interpretation Almost “reverse interaction”. Drug seems to work for the women,
increasing their response. But at the same time it works for men lowering their response.

12
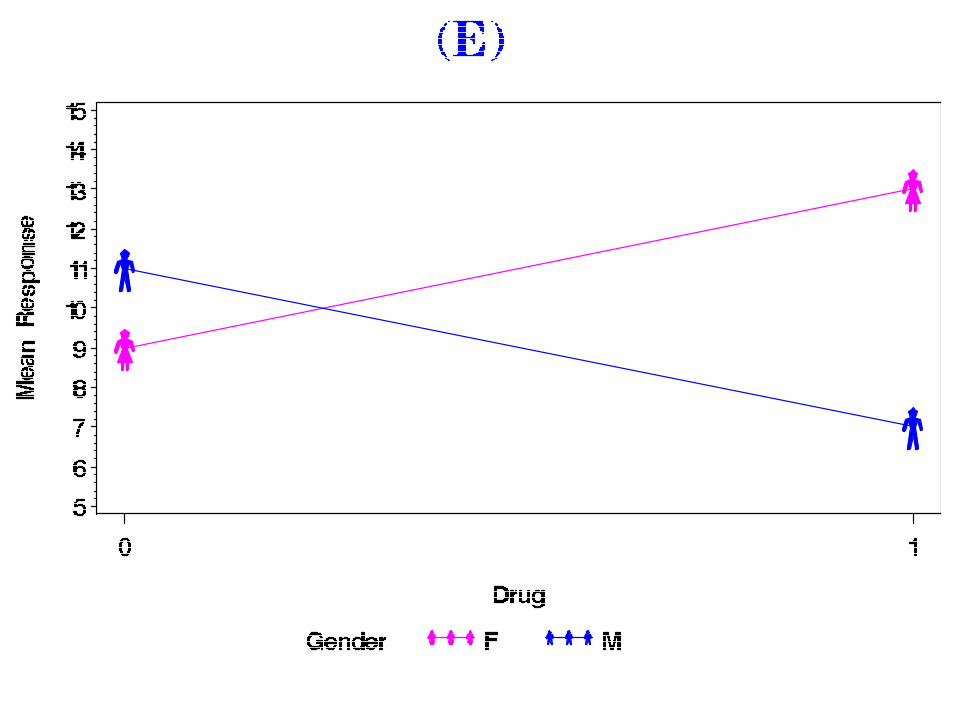
(E)
Interaction Yes. Lines are NOT parallel.
Drug effect No, shouldn’t be significant but it’s tied to the interaction anyway.
Gender effect No, shouldn’t be significant but it’s tied to the interaction anyway.
General interpretation “Reverse interaction”. Drug seems to work for the women, increasing their
response. But at the same time it works for men lowering their response. Additionally, Men started higher but are lower after taking the drug, women start lower but are higher after taking the drug. Hence the reverse!


14
(F)
Interaction None. Very mild, probably not significant.
Drug effect None.
Gender effect Probably not, men seem slightly higher than women but probably not
significant so.
General interpretation Nothing here at all. There are slight effects for all 3 terms but they are all
mild enough that it probably is due to just randomness. We can’t expect all groups to be exactly the same so while we see mild differences, we want significant differences!

15
Problem #2
Exploring the relationships

16
ANOVA Table
SOURCE DF SS MS F
State 1 486 486 194.4
Location 2 826 413 165.2
State*Loc 2 48 24 9.6
Error 594 1485 2.5
Total 599 2845
17
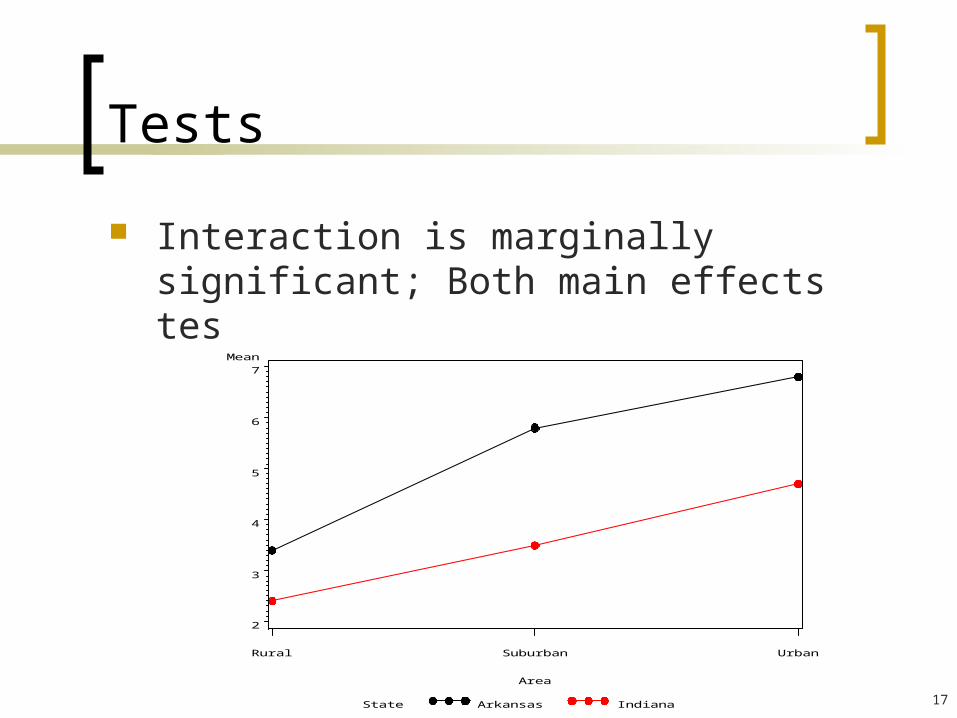
Tests
Interaction is marginally significant; Both main effects test quite significant.
St at e Ar kansas I ndi ana
Mean
2
3
4
5
6
7
Ar ea
Rur al Subur ban Ur ban

18
Effect Sizes
State Effect: (3.4+5.8+6.8)/3 – (2.4+3.5+4.7)/3 = 1.80
Rural vs. Suburb: (3.4+2.4)/2 – (5.8+3.5)/2 = -1.75
Rural vs. Urban: (3.4+2.4)/2 – (6.8+4.7)/2 = -2.85
Suburb vs. Urban: (5.8+3.5)/2 – (6.8+4.7)/2 = -1.10
Rural Suburb Urban
Arkansas 3.4 5.8 6.8
Indiana 2.4 3.5 4.7
19
Effect Sizes (2)
Arkansas has longer wait times than Indiana
Urban > Suburban > Rural wait times
Interaction? Very marginal. Description from plot:
State effect size is slightly less for Rural areas than it is for Urban or Suburban areas.

20
Question #3
A SAS Example

21
Part (a) – Design Chart
Age Visual Budget Feature18-25 xx xx xx26-35 xx xx xx36-45 xx xx xx46+ xx xx xx
Type of Ad

22
Part (b)
Assumptions are ok (you expect to see this type of QQ plot) since there are numerous identical responses
- 2 - 1 0 1 2
- 2
- 1
0
1
2
resid
Nor mal Quant i l es

23
Part (b)
Ad is clearly the most important effect
Age and the Ad*Age interaction are marginally significant (small sample size so there’s a good chance they are important)
Interaction plot tells some of the story

24
Interaction Plot
Age 1825 2635 3645 46+
aver age
3
4
5
6
7
8
9
10
Ad
Budget Feat ur e Vi sual

25
Interpreting the interactions
Feature ads don’t appear to be effective. (Dump them entirely – we can draw this conclusion based on the picture and the fact that the main effect for ad is so significant).
Visual ads may be more effective for older people; Budget ads almost surely the most effective for the younger age groups.

26
Tukey Groupings
response LSMEAN Age Ad LSMEAN Number GROUP 46+ Visual 9.50000000 12 A 2635 Budget 9.50000000 4 A 46+ Budget 9.00000000 10 A B 3645 Visual 8.50000000 9 A B 3645 Budget 8.50000000 7 A B 1825 Budget 7.50000000 1 A B C 2635 Visual 6.50000000 6 A B C 2635 Feature 6.00000000 5 A B C 1825 Visual 5.50000000 3 A B C 1825 Feature 4.50000000 2 B C 46+ Feature 4.50000000 11 B C 3645 Feature 3.00000000 8 C

27
Questions?