1 1- d motion kinematics “motion in a straight line!”
TRANSCRIPT

1
1- D Motion Kinematics“Motion in a
Straight Line!”

2
KINEMATICS•- the process of motion is integral to the description of matter characteristics!
•- all matter is moving - therefore a method must be formulated for accuracy!

3
Describe motion in a straight line
Which car has the greatest velocity? BLUE
Which car has a constant velocity? RED
Which 2 cars have the same average velocity?
RED and GREEN
4
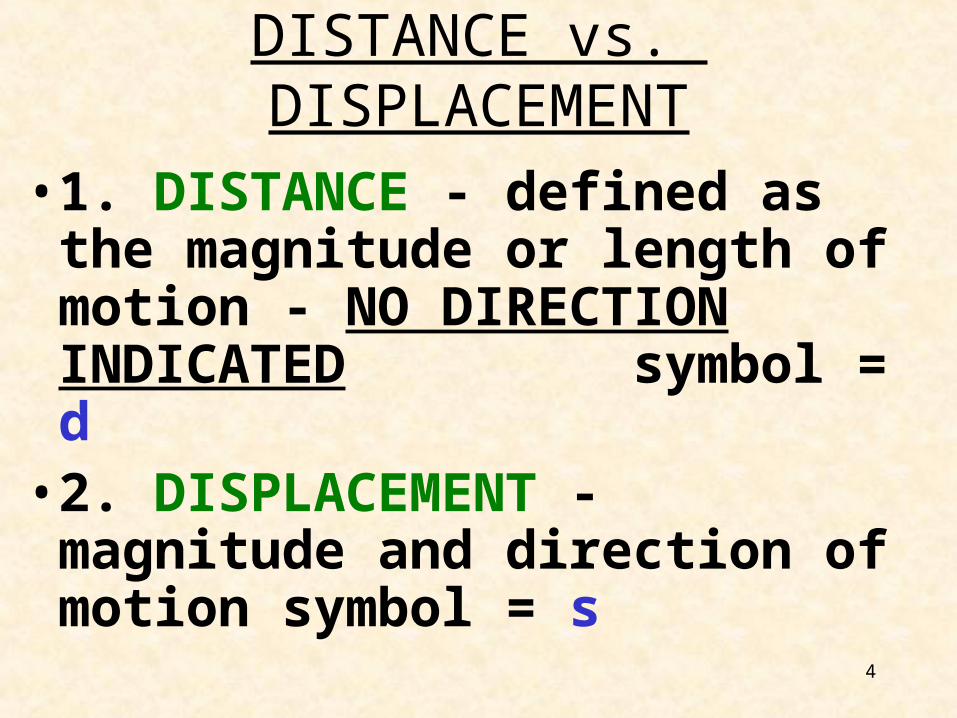
DISTANCE vs. DISPLACEMENT
•1. DISTANCE - defined as the magnitude or length of motion - NO DIRECTION INDICATED symbol = d
•2. DISPLACEMENT - magnitude and direction of motion symbol = s
5
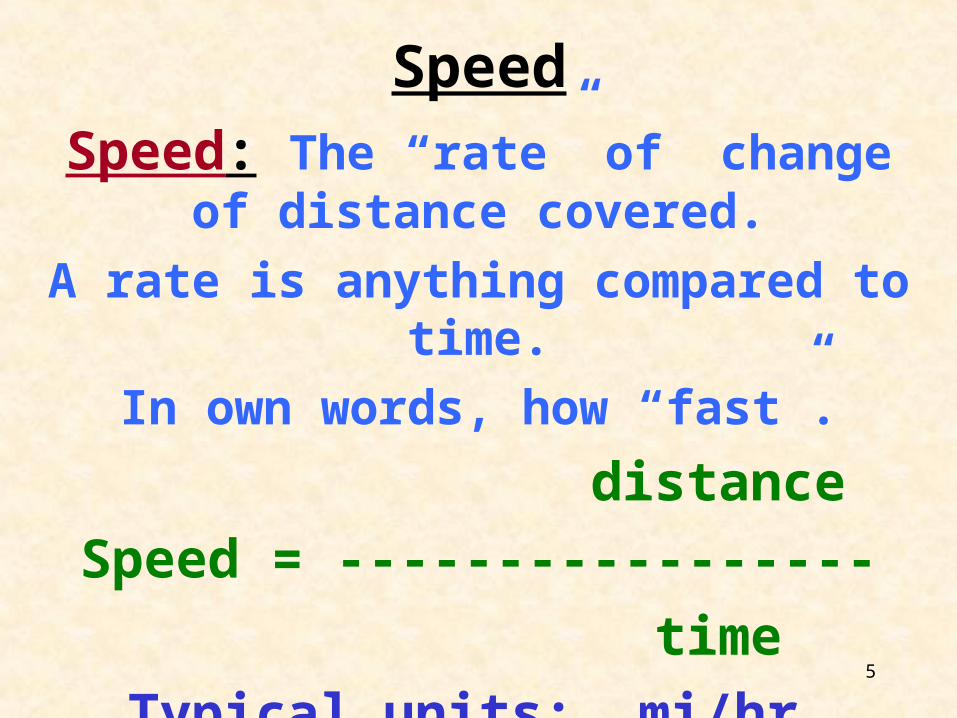
Speed
Speed: The “rate” of change of distance covered.
A rate is anything compared to time.
In own words, how “fast”.
distance
Speed = -----------------
time
Typical units: mi/hr, km/hr, m/s...

6
Average Speed
Total distance covered
Average speed = --------------------------
total time
SPEED
d
t
7
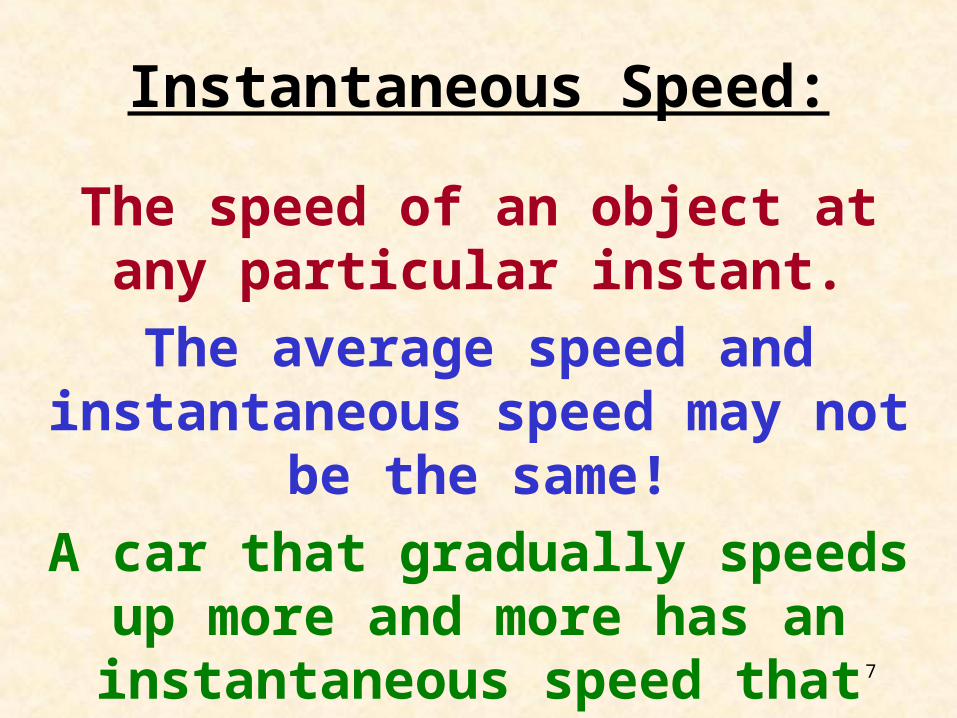
Instantaneous Speed:
The speed of an object at any particular instant.
The average speed and instantaneous speed may not be the same!
A car that gradually speeds up more and more has an instantaneous speed
that always changes..
8
Constant Speed
An object could be moving at a steady rate.
Thus, its average and instantaneous speed would be the same!
GBS Physics - speed vs. velocity

9
SOME EXAMPLES
• 1. A motocross rider travels a total distance of 300 km during a race. It takes the rider 2.5 hours to travel this distance. What is the average speed of the rider?
SOLUTION: AVE SPEED = Total Distance / time
speed = 300 km / 2.5 hrs = 120 km/hr
v
d
t

10
SOME EXAMPLES
speed = 454 km / 7200s = 454000m / 7200s
= 63 m/s
v
d
t
• A high speed train travels 454 km in 7200 seconds. What is the train’s average speed?
• Formula : v (speed) = d/t
d
t

11
Velocity
Velocity and speed are often used interchangeably. They are not the
same term though!
Speed is a scalar quantity. It has a number value only. No direction.
Velocity is a vector quantity. It has a size and direction.
12
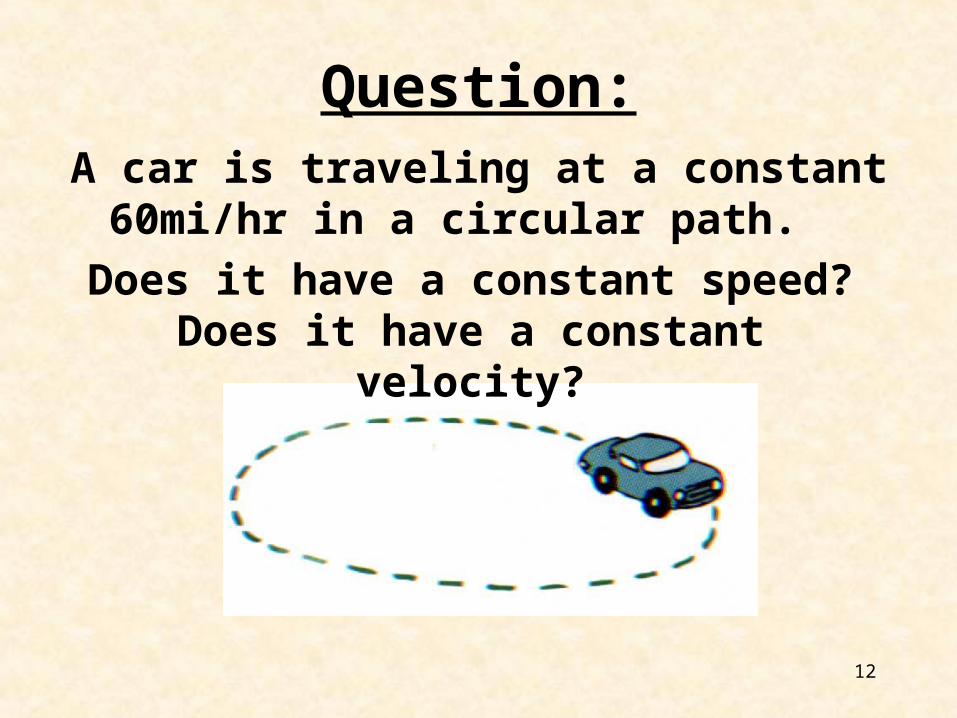
Question:A car is traveling at a constant 60mi/hr in a
circular path.
Does it have a constant speed?Does it have a constant velocity?

13
AccelerationAcceleration: The rate of change in speed
and/or direction (or velocity)How fast something speeds up, slows down, or
turns.

14
If an object has a constant velocity, then its acceleration would be zero.
If an object is slowing down, it is decelerating:

15
change in velocity
acceleration = ------------------------
time interval Δv
a = ----------- Δt
Δ, Greek letter delta = change in
GBS Physics - Acceleration

16
Change in Speed/Velocity
Acceleration = --------------------------
total time
Acc
v
t
Eq: a = ∆v or a = vf – vi ∆t tf - ti
Units m , km, mi, ft, s2 h.s h.s s2
Always a distance unit divided by two units of
time. Why?

17
Ex: A particular car goes from rest to 90km/hr in 10 sec, what is its acceleration?
Δv = 90 km/hr Δt = 10 sec a = Δv/ Δt
= 90 km/hr/10 sec=9 km/hr / secnotice units...
This means its velocity is changing by 9km/hr every second it accelerates at that rate.
18
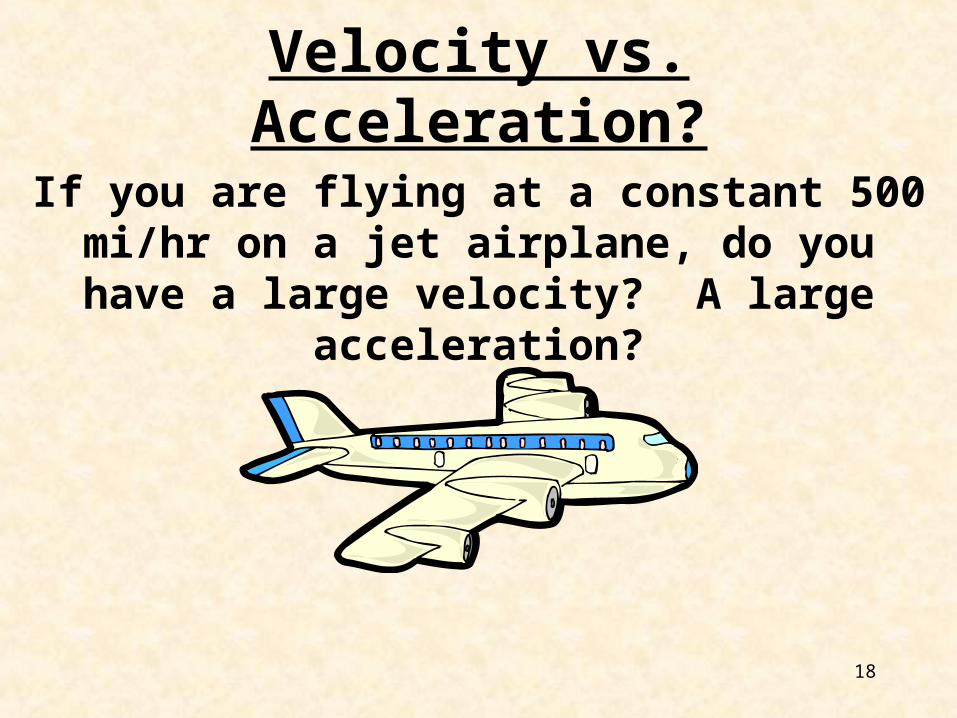
Velocity vs. Acceleration?
If you are flying at a constant 500 mi/hr on a jet airplane, do you have a large velocity? A large
acceleration?

19
• 2. The stealth fighter accelerates from 700 mph to 1200 mph in 10 seconds. What is the acceleration of the aircraft?
Acceleration = change in velocity / time
(1200 mph - 700 mph) / 10 s
50 mph/s
(500 mph) / 10 s =
Acc
v
t

20
• 3. A toy car accelerates from rest to a speed of 100 m/s in 5 seconds. What is the acceleration?
Acceleration = change in velocity / time
(100 m/s - 0 m/s) / 5 s
20 m/s/s or 20 m/s2

40m-20m
4 s-2 s= 20m / 2s = 10 m/s

22
GRAPHICAL REPRESENTATION OF VELOCITY
•slope - the slope of a displacement vs. time curve would be the velocity
• Time is always the independent or x-axis.• Plot points and draw a line of best fit. • Remember! Label axis with units, and title graph.
• DO NOT CONNECT DOTS!GBS Physics - position vs. time
23
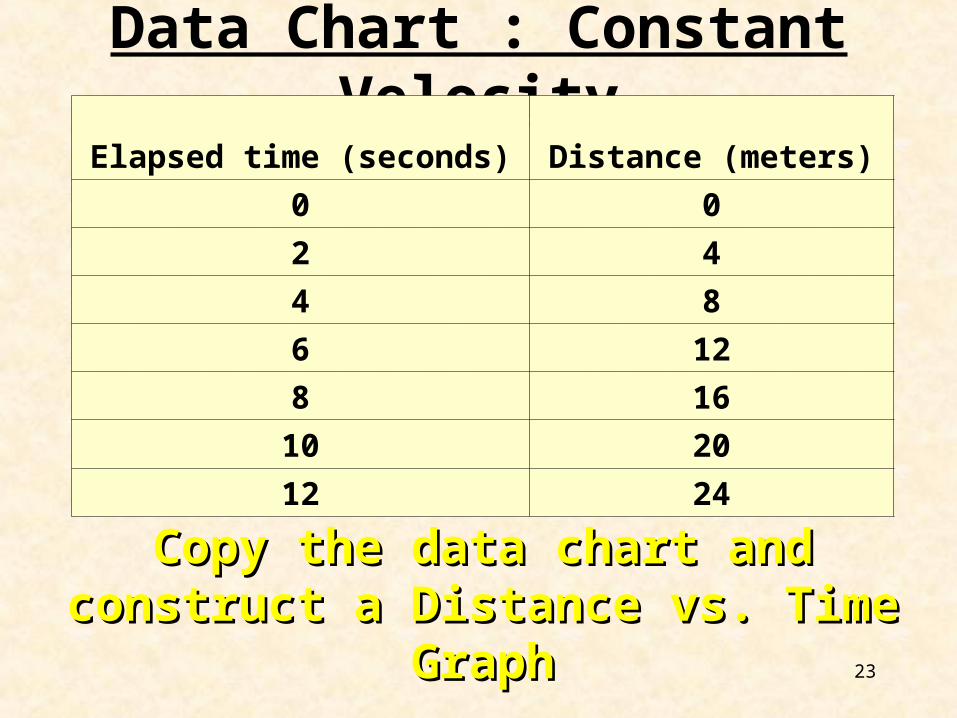
Data Chart : Constant Velocity
Elapsed time (seconds) Distance (meters)
0 0
2 4
4 8
6 12
8 16
10 20
12 24
Copy the data chart and construct Copy the data chart and construct a Distance vs. Time Grapha Distance vs. Time Graph
Answer on the next SLIDEAnswer on the next SLIDE

24
Graph: Constant VelocityDistance vs. Time
0
2
4
6
8
10
12
14
0 5 10 15 20 25 30
Time
Dis
tan
ce

25

26
Data Chart
Constant Acceleration!What type of motion?
Elapsed time
(seconds)Distance (meters)
0.0 0
4.0 8
8.0 32
12.0 72
16.0 128
20.0 200
24.0 288

27
Graph of Data: Constant Acceleration
Constant Acceleration
0
50
100
150
200
250
300
350
0.0 5.0 10.0 15.0 20.0 25.0 30.0
time
Dis
tan
ce

28
29
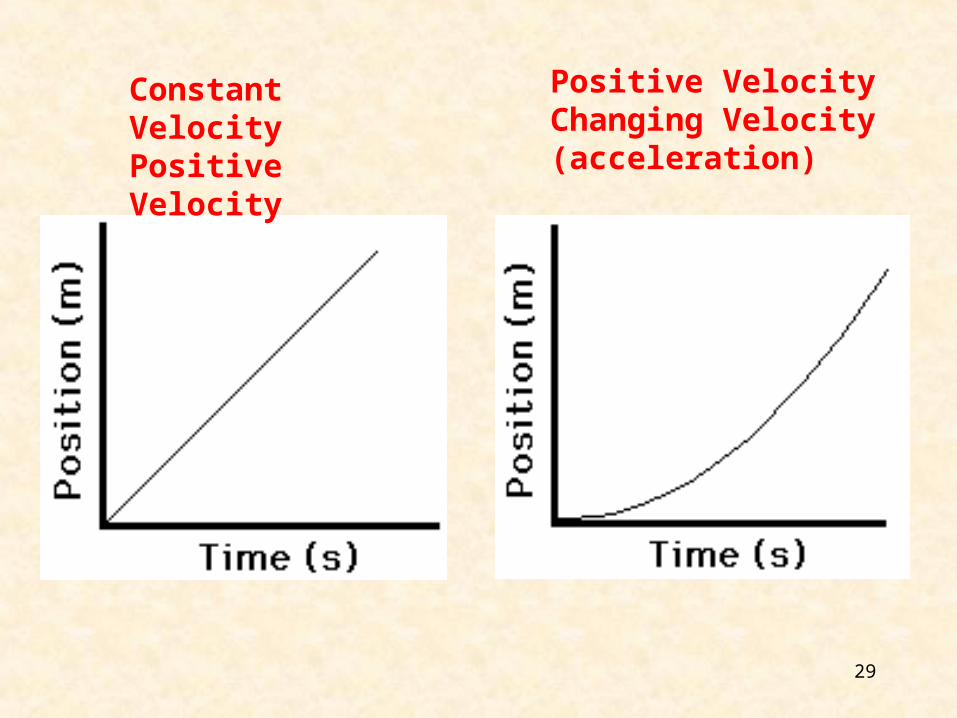
Constant VelocityPositive Velocity
Positive VelocityChanging Velocity (acceleration)

30
Fast, Rightward (+)
Constant Velocity
http://www.physicsclassroom.com/mmedia/kinema/cpv.html
Fast, Leftward (-)
Constant Velocity

31
GRAPHICAL REPRESENTATION OF ACCELERATION
•slope - the slope of a velocity vs. time curve would be the acceleration
GBS Physics - velocity vs time

32
Velocity Time GraphElapsed
time (seconds)
Distance (meters)
Velocity (m/s)
0 0.0 0.0
2 4.0 2.0
4 8.0 2.0
6 12.0 2.0
8 16.0 2.0
10 20.0 2.0
12 24.0 2.0
Velocity vs Time
0
0.5
1
1.5
2
2.5
0 5 10 15
Time
Vel
ocity
Copy the data chart and construct a VELOCITY vs. Copy the data chart and construct a VELOCITY vs. TIME GraphTIME Graph

33
34
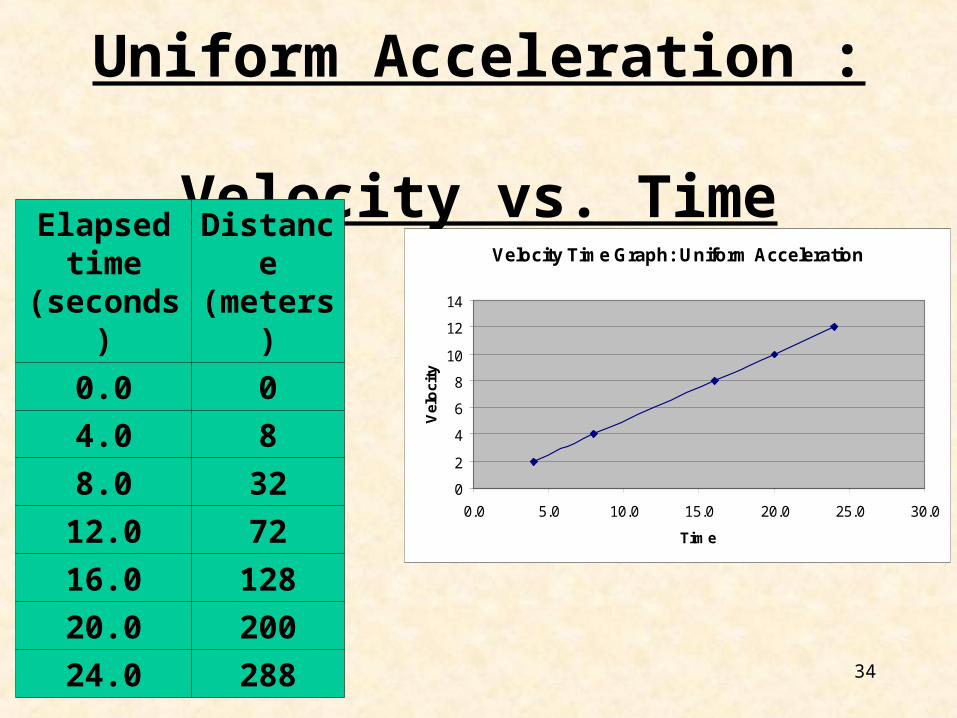
Uniform Acceleration : Velocity vs. Time
Velocity Time Graph: Uniform Acceleration
0
2
4
6
8
10
12
14
0.0 5.0 10.0 15.0 20.0 25.0 30.0
Time
Vel
oci
ty
Elapsed time
(seconds)Distance (meters)
0.0 0
4.0 8
8.0 32
12.0 72
16.0 128
20.0 200
24.0 288

35

36
Positive VelocityPositive Acceleration
Positive VelocityZero Acceleration

37