1 – 1 course name: operations management course code: mgt 411 reference books: operations...
TRANSCRIPT

1 – 1
Course Name: Operations Management
Course code: MGT 411
Reference books: 1. Operations Management, bOperations Management, by y
Krajewski/Ritzman/Malhotra Krajewski/Ritzman/Malhotra 2. Production and Operations Management by2. Production and Operations Management by
S.Anil kumar and S. SureshS.Anil kumar and S. Suresh
Copyright © 2010 Pearson Education, Inc. Publishing as Prentice Hall.

1 – 2Copyright © 2010 Pearson Education, Inc. Publishing as Prentice Hall.
CCOMPETINGOMPETING WITHWITH OOPERATIONSPERATIONS
For For Operations Management, bOperations Management, by y Krajewski/Ritzman/Malhotra Krajewski/Ritzman/Malhotra © 2010 Pearson Education© 2010 Pearson Education

1 – 3Copyright © 2010 Pearson Education, Inc. Publishing as Prentice Hall.
Operations ManagementOperations Management
According to Krajewski / Ritzman / Malhotra:According to Krajewski / Ritzman / Malhotra:
Operations Management the direction and control of the process that transform inputs into products and services.
The systematic design, direction, and control of processes that transform inputs into services and products for internals, as well as external, customers
Processes can be linked together to form a supply chain – interrelated processes within a firms and across different firms that produce a service or product to the satisfaction of the customers

1 – 4
According to S. Anil Kumar and N. Suresh:
Operations management is the process, which combines and transforms various resources used in the operations subsystem of the organization into value added product/services in a controlled manner as per the policies of the organization.
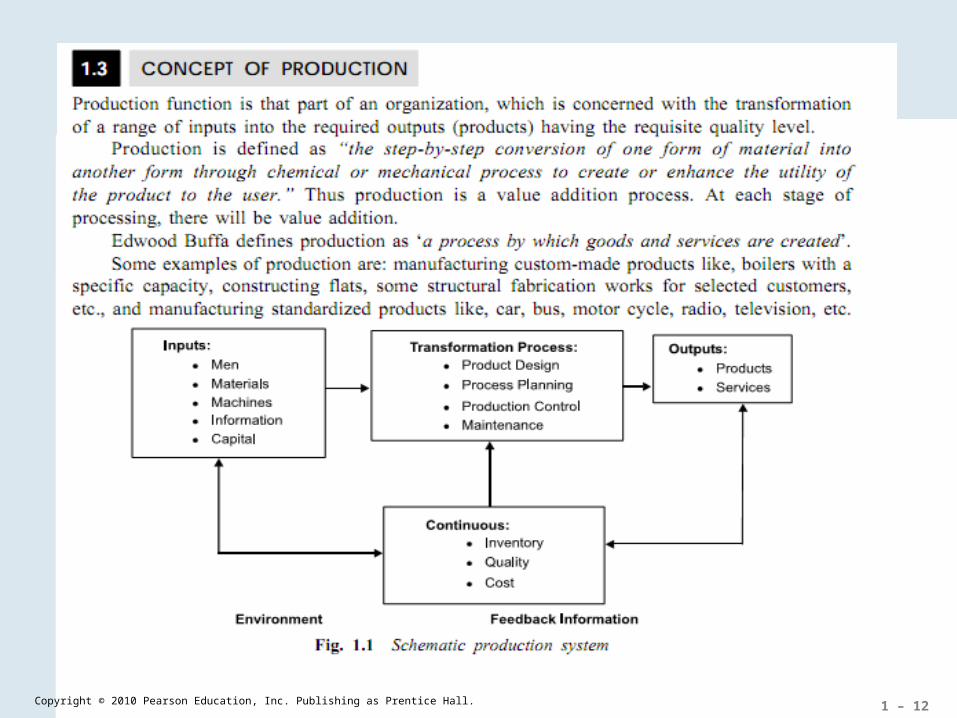
Therefore, it is that part of an organization, which is concerned with the transformation of a range of inputs into the required (products/services) having the requisite quality level.
Copyright © 2010 Pearson Education, Inc. Publishing as Prentice Hall.

1 – 5Copyright © 2010 Pearson Education, Inc. Publishing as Prentice Hall.

1 – 6
Process:
Any activity or group of activities that takes one or more inputs, transforms and adds value to them, and provides one or more outputs for its customers.
Copyright © 2010 Pearson Education, Inc. Publishing as Prentice Hall.

1 – 7Copyright © 2010 Pearson Education, Inc. Publishing as Prentice Hall.
Across the OrganizationAcross the Organization
Material & Service Inputs
Sales Revenue
Product & Service Outputs
Finance
Acquires financial resources and capital
for inputs
Marketing
Generates sales of outputs
Operations
Translates materials and service into
outputs
Support Functions
• Accounting• Information Systems• Human Resources• Engineering
Figure 1.1

1 – 8Copyright © 2010 Pearson Education, Inc. Publishing as Prentice Hall.
A Process ViewA Process View
External environment
Information on performance
Internal and external customers
Processes and operations
1
2
3
4
5
Inputs• Workers• Managers• Equipment• Facilities• Materials• Land• Energy
Outputs• Goods• Services
Figure 1.2

1 – 9Copyright © 2010 Pearson Education, Inc. Publishing as Prentice Hall.
A Process ViewA Process View
• Physical, durable output• Output can be inventoried• Low customer contact• Long response time• Capital intensive• Quality easily measured
• Intangible, perishable output• Output cannot be inventoried• High customer contact• Short response time• Labor intensive• Quality not easily measured
More like a manufacturing
process
More like a service process
Figure 1.3
Continuum of characteristics of manufacturing and service organizations

1 – 10Copyright © 2010 Pearson Education, Inc. Publishing as Prentice Hall.
The Supply Chain ViewThe Supply Chain View
Support Processes
Ext
ern
al s
up
pli
ers
Exte
rnal cu
stom
ers
Supplier relationship process
New service/ product development
Order fulfillment process
Customer relationship management
Figure 1.4

1 – 11Copyright © 2010 Pearson Education, Inc. Publishing as Prentice Hall.
The Supply Chain ViewThe Supply Chain View
Core processes are sets of activities that deliver value to external customers
1. Supplier relationship process
2. New service/product development process
3. Order fulfillment process
4. Customer relationship process
Support processes provide vital resources and inputs to the core processes
1 – 12Copyright © 2010 Pearson Education, Inc. Publishing as Prentice Hall.

1 – 13Copyright © 2010 Pearson Education, Inc. Publishing as Prentice Hall.

1 – 14Copyright © 2010 Pearson Education, Inc. Publishing as Prentice Hall.

1 – 15
Job shops productionJob shops production
Copyright © 2010 Pearson Education, Inc. Publishing as Prentice Hall.
Job shops are typically small manufacturing systems that handle job production, that is, custom/bespoke or semi-custom/bespoke manufacturing processes such as small to medium-size customer orders or batch jobs
-A typical example would be a machine shop, which may make parts for local industrial machinery, farm machinery and implements, boats and ships, or even batches of specialized components for the aircraft industry. continuous flow manufactures such as textile, steel, food manufacturing and manual labor.

1 – 16Copyright © 2010 Pearson Education, Inc. Publishing as Prentice Hall.

1 – 17Copyright © 2010 Pearson Education, Inc. Publishing as Prentice Hall.

1 – 18
Batch productionBatch production
Copyright © 2010 Pearson Education, Inc. Publishing as Prentice Hall.
Batch production occurs when many similar items are produced together. Each batch goes through one stage of the production process before moving onto next stage. Good examples include:
Cricket bat manufactureBaking / meal preparationClothing production

1 – 19Copyright © 2010 Pearson Education, Inc. Publishing as Prentice Hall.

1 – 20Copyright © 2010 Pearson Education, Inc. Publishing as Prentice Hall.

1 – 21Copyright © 2010 Pearson Education, Inc. Publishing as Prentice Hall.
1 – 22Copyright © 2010 Pearson Education, Inc. Publishing as Prentice Hall.

1 – 23Copyright © 2010 Pearson Education, Inc. Publishing as Prentice Hall.
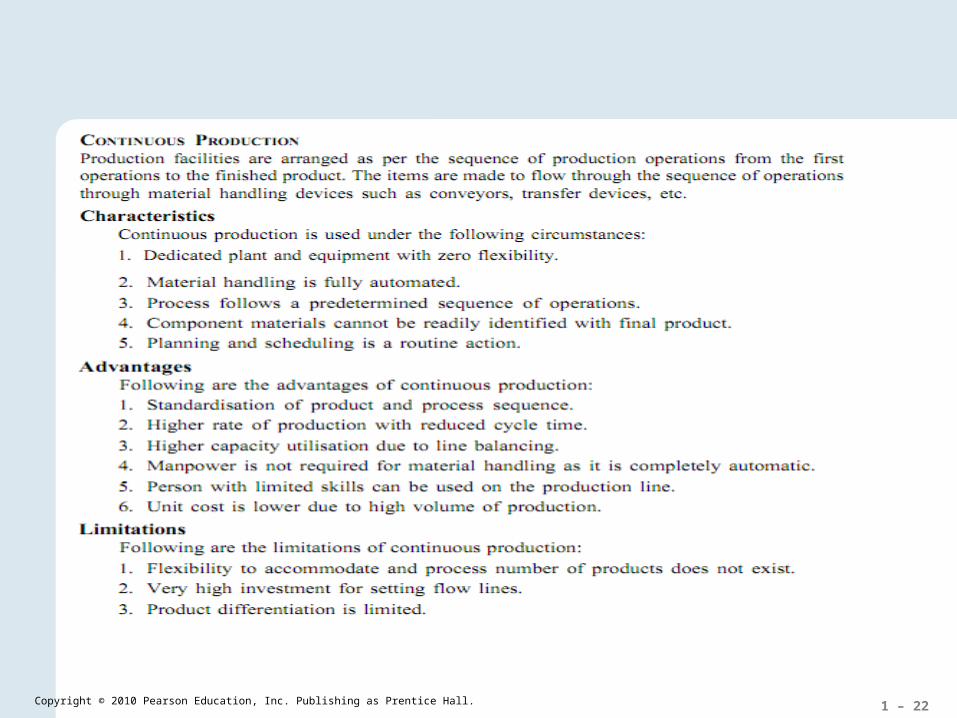
Some common continuous processes are the following:•Oil refining•Chemicals•Synthetic fibers•Fertilizers•Pulp and paper•Blast furnace (iron)•Metal smelting•Power stations•Natural gas processing•Sanitary waste water treatment•Continuous casting of steel•Rotary kilns for calcining lime or cement•Float glass

1 – 24Copyright © 2010 Pearson Education, Inc. Publishing as Prentice Hall.

1 – 25Copyright © 2010 Pearson Education, Inc. Publishing as Prentice Hall.

1 – 26Copyright © 2010 Pearson Education, Inc. Publishing as Prentice Hall.

1 – 27Copyright © 2010 Pearson Education, Inc. Publishing as Prentice Hall.

1 – 28Copyright © 2010 Pearson Education, Inc. Publishing as Prentice Hall.

1 – 29Copyright © 2010 Pearson Education, Inc. Publishing as Prentice Hall.

1 – 30
Scope of operations managementScope of operations management
Copyright © 2010 Pearson Education, Inc. Publishing as Prentice Hall.
1.Product design: product design and development provides link between marketing, customer needs and expectations and the activities required to manufacture the product.2.Process design: an overall process route for converting the raw materials in finished goods.3.Production planning and control: the process of planning the production in advance, setting the exact route of each item, fixing the starting and finishing dates for each item, to give production orders and follow up the progress of products according to orders.

1 – 31Copyright © 2010 Pearson Education, Inc. Publishing as Prentice Hall.
4.Planning: Planning is deciding in advance what to do, how to do it, when to do it and who is to do it.
5.Routing ( direction-finding): selection of path which each part of the product will follow, which being transformed from raw materials to finished products.
6.Scheduling: the fixation of time and date for each operation.7.Dispatching: release of orders and instruction for the starting of
production for any item in acceptance with the route sheet and schedule charts.
8.Quality control: a system that is used to maintain a desired level of quality in a product or service.
9.Materials management: 10.Maintenance management

1 – 32Copyright © 2010 Pearson Education, Inc. Publishing as Prentice Hall.
Productivity ImprovementProductivity Improvement
EXAMPLE 1.1
Calculate the productivity for the following operations:
a. Three employees process 600 insurance policies in a week. They work 8 hours per day, 5 days per week.
SOLUTION
a. Labor productivity = Policies processed
Employee hours
= = 5 policies/hour600 policies
(3 employees)(40 hours/employee)

1 – 33Copyright © 2010 Pearson Education, Inc. Publishing as Prentice Hall.
Productivity ImprovementProductivity Improvement
EXAMPLE 1.1
Calculate the productivity for the following operations:
b. A team of workers makes 400 units of a product, which is sold in the market for $10 each. The accounting department reports that for this job the actual costs are $400 for labor, $1,000 for materials, and $300 for overhead.
SOLUTION
a. Multifactor productivity = Value of output
Labor cost + Materials cost + Overhead cost
= = = 2.35(400 units)($10/unit)$400 + $1,000 + $300
$4,000$1,700

1 – 34Copyright © 2010 Pearson Education, Inc. Publishing as Prentice Hall.
ApplicationApplication
Calculate the year-to-date labor productivity:
Calculate the multifactor productivity:
This Year Last Year Year Before Last
Factory unit sales ($) 2,762,103 2,475,738 2,175,447
Employment (hrs) 112,000 113,000 115,00
Sales of manufactured products ($)
$49,363 $40,831 —
Total manufacturing cost of sales ($)
$39,000 $33,000 —
factory unit sales
employment
This Year
2,762,103= 24.66/hr
112,000
Last Year
2,475,738 =
21.91/hr113,000
Year Before Last
2,175,447= $18.91/hr
115,000
sales of mfg products
total mfg cost
This Year
$49,363= 1.27
$39,000
Last Year
$40,831= 1.24
$33,000

1 – 35Copyright © 2010 Pearson Education, Inc. Publishing as Prentice Hall.
Solved Problem 1Solved Problem 1
Student tuition at Boehring University is $150 per semester credit hour. The state supplements school revenue by $100 per semester credit hour. Average class size for a typical 3-credit course is 50 students. Labor costs are $4,000 per class, material costs are $20 per student per class, and overhead costs are $25,000 per class.
a. What is the multifactor productivity ratio for this course process?
b. If instructors work an average of 14 hours per week for 16 weeks for each 3-credit class of 50 students, what is the labor productivity ratio?

1 – 36Copyright © 2010 Pearson Education, Inc. Publishing as Prentice Hall.
Solved Problem 1Solved Problem 1
SOLUTION
a. Multifactor productivity is the ratio of the value of output to the value of input resources.
Value of output =50 student
class
$150 tuition +$100 state support
credit hour3 credit hours
student
Value of inputs = Labor + Materials + Overhead
Multifactor productivity = = = 1.25$37,500/class
$30,000/class
Output
Input
= $37,500/class
= $4,000 + ($20/student 50 students/class) + $25,000
= $30,000/class

1 – 37Copyright © 2010 Pearson Education, Inc. Publishing as Prentice Hall.
Solved Problem 1Solved Problem 1
SOLUTION
b. Labor productivity is the ratio of the value of output to labor hours. The value of output is the same as in part (a), or $45,000, so
Labor hours of input =14 hours
week16 weeks
class
Labor productivity = = $45,000/class
224 hours/class
Output
Input
= 224 hours/class
= $200.89/hour

1 – 38Copyright © 2010 Pearson Education, Inc. Publishing as Prentice Hall.
Solved Problem 2Solved Problem 2
Natalie Attire makes fashionable garments. During a particular week employees worked 360 hours to produce a batch of 132 garments, of which 52 were “seconds” (meaning that they were flawed(defective)). Seconds are sold for $90 each at Attire’s Factory Outlet Store. The remaining 80 garments are sold to retail distribution at $200 each. What is the labor productivity ratio of this manufacturing process?

1 – 39Copyright © 2010 Pearson Education, Inc. Publishing as Prentice Hall.
Solved Problem 2Solved Problem 2
SOLUTION
Labor productivity = = $20,680
360 hours
Output
Input
Labor hours of input = 360 hours
Value of output = (52 defective 90/defective) + (80 garments 200/garment)
= $20,680
= $57.44 in sales per hour