04 | building stellar data visualizations using power view
TRANSCRIPT

Click to edit Master subtitle style04 | Building Stellar Data
Visualizations Using Power View

What You Will Learn
• Introducing Power View
• Preparing the Data Model for Power View
• Creating Power View Reports
• Partner Opportunities
• Resources

Introducing Power View
• Power View is a SQL Server Reporting Services authoring experience now available in Excel 2013
• Power View in Excel 2013 requires a tabular data model, including a Power Pivot data model
• Report sheets can be added to the workbook and configure to produce interactive data exploration, visualization, and presentation experiences
- Highly visual design experience
- Rich meta-driven interactivity
- Presentation-ready at all times
• It can enable intuitive ad-hoc reporting for business users
• Available also in SharePoint 2013 with the Reporting Services add-in
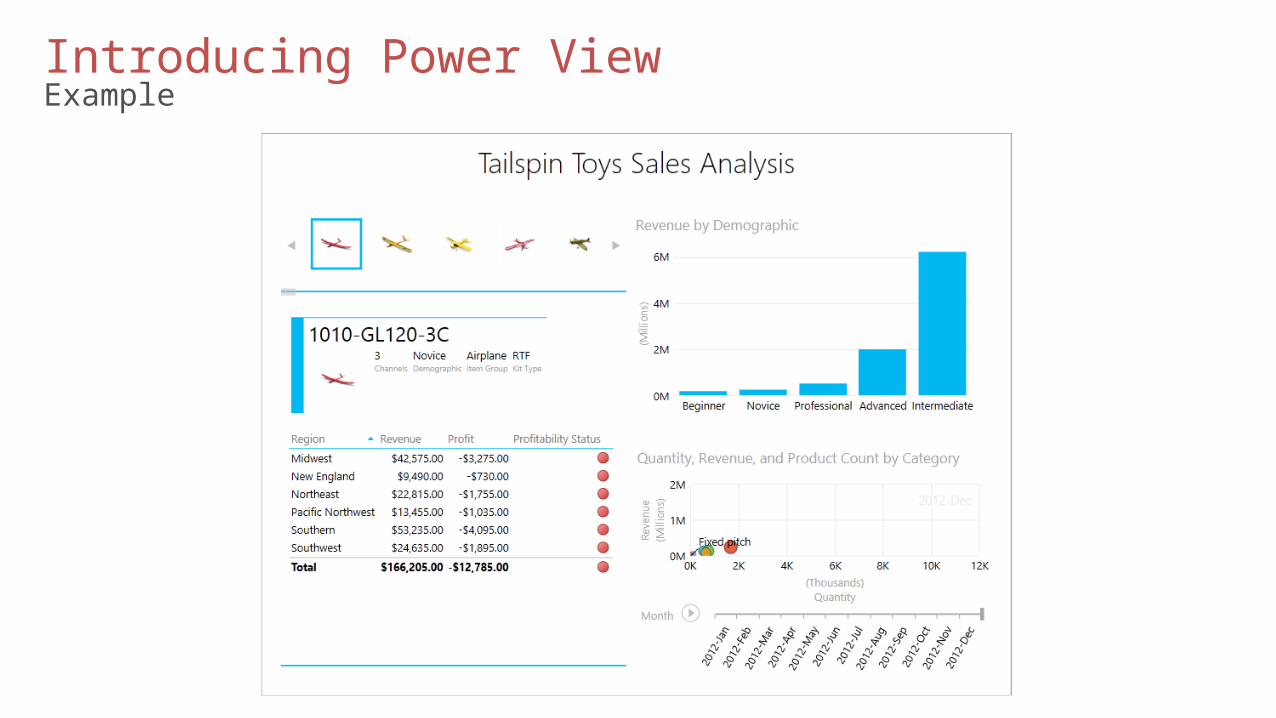
Introducing Power ViewExample
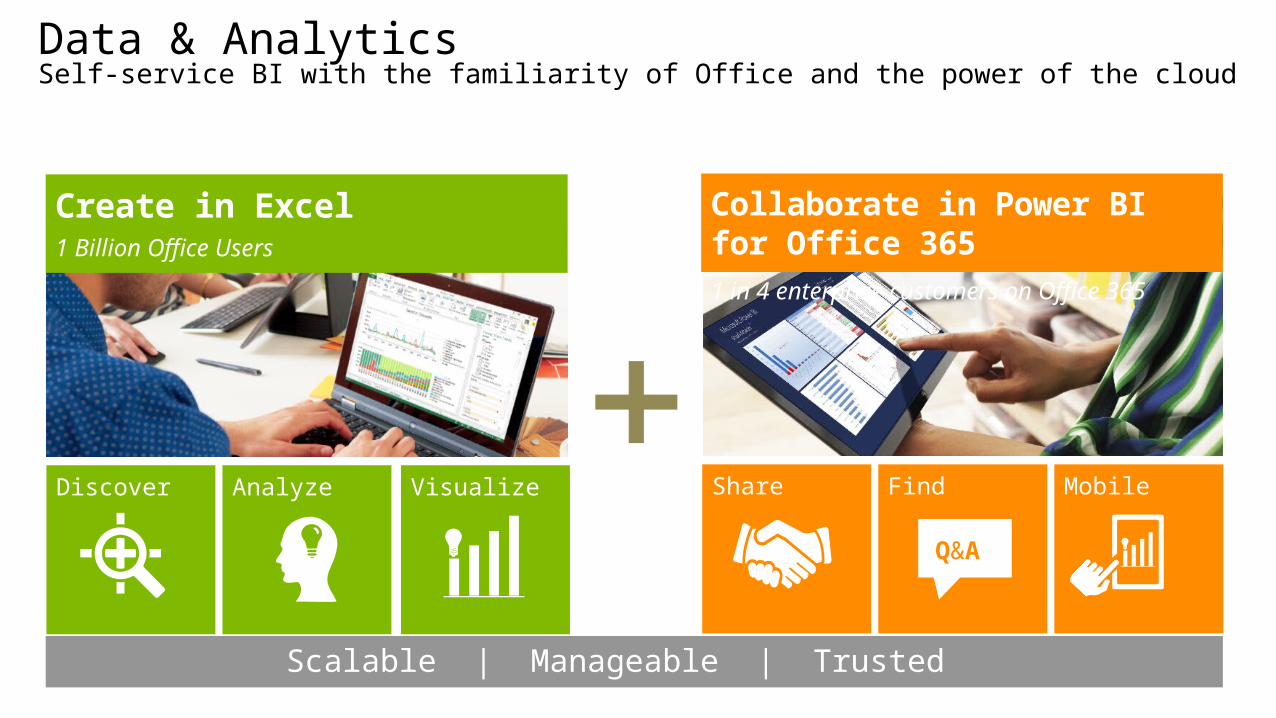
Collaborate in Power BI for Office 3651 in 4 enterprise customers on Office 365
Share Find
Q&A
Mobile
Create in Excel1 Billion Office Users
Analyze VisualizeDiscover
Scalable | Manageable | Trusted
Data & AnalyticsSelf-service BI with the familiarity of Office and the power of the cloud

Create in Excel1 Billion Office Users
Analyze VisualizeDiscover
Collaborate in Power BI for Office 3651 in 4 enterprise customers on Office 365
Share Find
Q&A
Mobile
Scalable | Manageable | Trusted
Data & AnalyticsSelf-service BI with the familiarity of Office and the power of the cloud

What is Power View?
interactive, data explorationvisualization and
presentation experience

Introducing Power ViewSystem Requirements
• Power View for Excel 2013 requires:- Office Professional Plus edition, or
- Office 365 Professional Plus edition
• Silverlight• The Map data visualization requires internet connectivity (Bing
Maps)
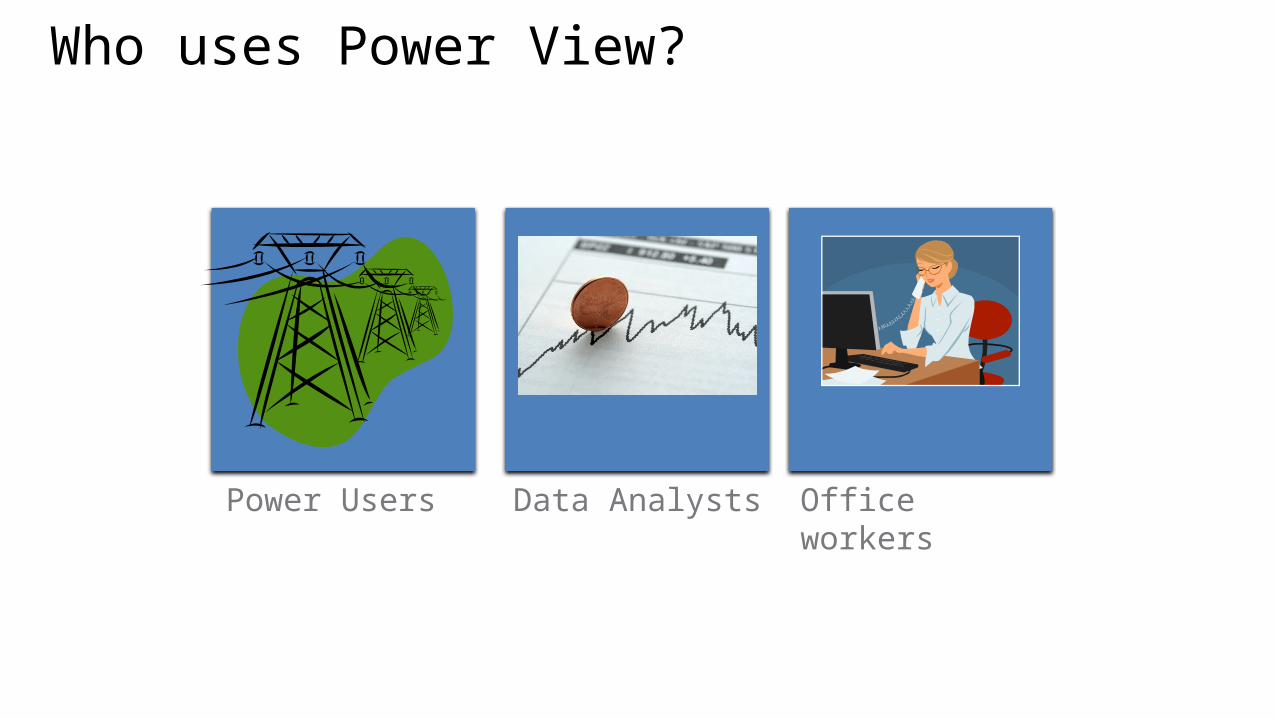
Who uses Power View?
Power Users Data Analysts Office workers

How to use Power View?
Excel 2013

Preparing the Data Model for Power View
• The data model can be prepared to fully exploit the Power View experience by:- Applying friendly names, descriptions and column and
calculated field data formats- Enabling images
• The Advanced ribbon tab allows:- Customizing “automatic” calculated field behavior
(Summarize By)- Configuring Report Properties

Preparing the Data Model for Power ViewFriendly Names, Descriptions and Data Formats
• Use friendly names for tables, columns and calculated fields- These names will be used as labels to describe Power View data
visualizations
- Embedded spaces are allowed
• Provide descriptions for tables, columns and calculated fields- These are surfaced as tooltips in the Power View Fields pane
• Set appropriate data formats for columns and calculated fields• Hide unnecessary tables, columns and calculated fields
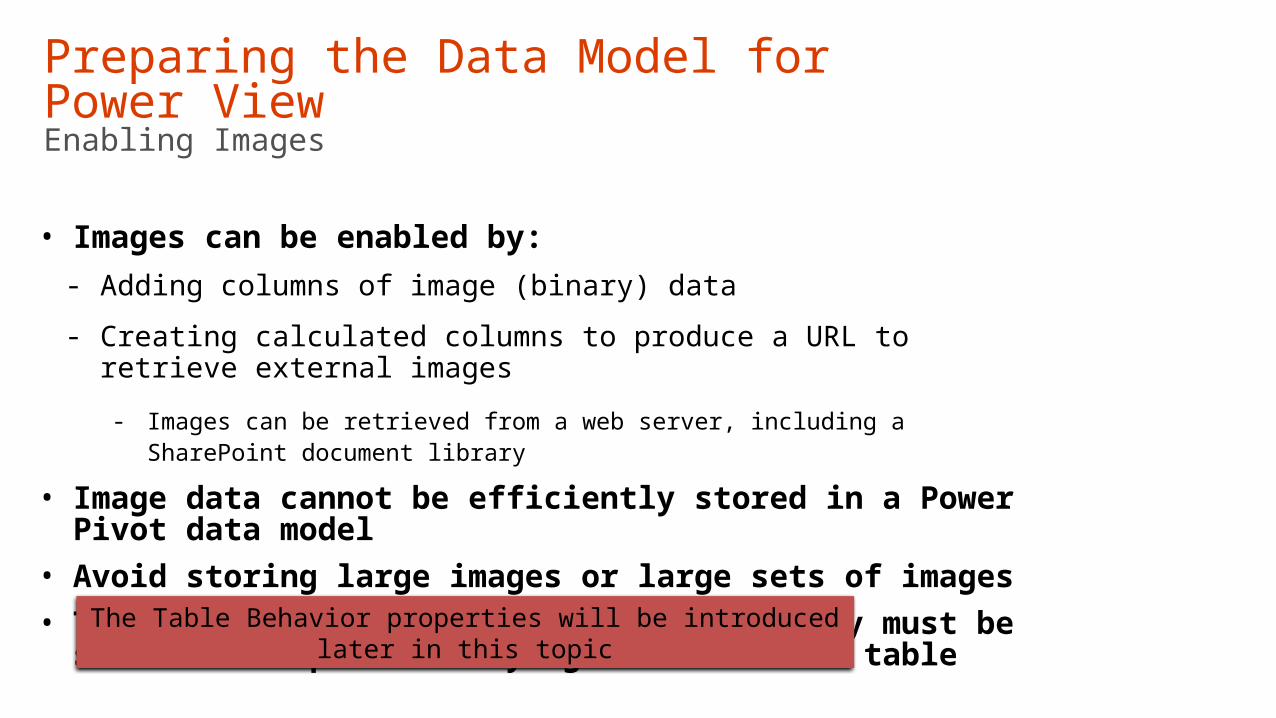
Preparing the Data Model for Power ViewEnabling Images
• Images can be enabled by:- Adding columns of image (binary) data
- Creating calculated columns to produce a URL to retrieve external images
- Images can be retrieved from a web server, including a SharePoint document library
• Image data cannot be efficiently stored in a Power Pivot data model• Avoid storing large images or large sets of images• The Table Behavior Row Identifier property must be set to a unique
identifying column of the table
The Table Behavior properties will be introduced later in this topic

Preparing the Data Model for Power View“Automatic” Calculated Fields
• There may not be the need to define explicit calculated fields• Visible numeric columns will be surfaced as “automatic” calculated
fields• These fields will only be available in the Power View Fields pane,
and will not be available in cube reporting tools (PivotTables, CUBE functions, etc.)
• Use the SummarizeBy property to determine the default aggregate function:- The default is to sum the column values
- The Power View report user can identify “automatic” calculated fields, and modify their aggregate function in the report layout

Preparing the Data Model for Power ViewReporting Properties
• Default Field Set:- Ordered set of columns and calculated fields that can be conveniently
added as a table to a Power View report, with a single click
• Table Behavior:- Row Identifier: Sets the unique identifier column for a table (like a
primary key), and it cannot be based on a calculated column
- Keep Unique Rows: Columns that relate directly to the row identifier and that should not be presented as nested groups
For example, State Code and State Name
- Default Label: Behaves as the friendly label for the table
- Default Image: Behaves as the image for the table

Preparing the Data Model for Power ViewReporting Properties (Continued)
• Categorize columns by type, especially relevant for:- Spatial data (longitude, latitude, country, state, etc.)
- Image URL
- Web URL
• By default, the Power Pivot settings will use automatic column categorization- This setting can be disabled
- Categorization settings can be changed

Creating Power View Reports
• A workbook can consist of multiple Power View reports• A Power View report is created by using the Insert ribbon tab
- If a range of data is selected when creating the report, the range will be automatically added to the workbook data model, and the report will display the data
- If no range is selected, and a workbook data model is created, the Power View Fields will display the data model fields
• All reports commence by creating a table, and this is achieved in the Power View Fields by selecting a table (if default field list was defined), or checking individual fields

Creating Power View Reports (continued)
• A table can be converted to the different data visualizations (charts or map) and its layout configured- It is possible to drag fields into the
layout zones
- Also, selecting a field reveals a down arrow, to select the placement zone
- Different visualization types have a different layouts
• To create a new table, click on a blank area of the report canvas
Layout AreaDrag to add fields to zones, or use the down arrow to configure
Switch VisualizationOn the Power View ribbon, convert the currently selected visualization to another type

Creating Power View ReportsData Visualization Types
• Table, Matrix and Card (single visualization per table record)- Table has fixed columns
- Matrix allows grouping on columns
• Charts:- Bar (stacked, 100%, clustered)
- Column (same as bar, but vertical)
- Other (line, scatter, other)
- The scatter chart can be animated across time
• Maps- The Map requires internet connectivity to communicate with Bing Maps

Creating Power View ReportsEnhancing Reports
• Reports can be enhanced with:- Themes (fixed styles of fore and background colors, and fonts)
- Images – free-standing and background
- Textbox labels
• Numeric table values can be formatted• Different data visualizations have different layout abilities
- Refer to the available commands on the Layout ribbon tab when configuring a data visualization

Creating Power View ReportsFiltering Reports
• Reports can be filtered in different ways:- Filter the entire report in the Filters pane
Drag and drop fields and set filter conditions
- Filter a single data visualization
Select the filter icon in the top right corner of the data visualization
- Add a slicer
Single-column table can be converted to a slicer to allow user interactive filtering
Multi-selection is possible by pressing the control key
- Select chart areas (pie segments, bars or lines)
This will filter the entire view, and can be reset by clicking a blank area of the chart

Creating Power View ReportsSorting Data
• Table columns can be sorted by clicking the column header- First click is ascending, the second click descending, etc.
• Sort can also be configured by clicking the options in the top right corner of the data visualization- Fields and sort order can be set
Result
Business owner is empowered to understand his data and make decisions based on his
interactive, data explorationvisualization and
presentation experiencewith Power View

©2013 Microsoft Corporation. All rights reserved. Microsoft, Windows, Office, Azure, System Center, Dynamics and other product names are or may be registered trademarks and/or trademarks in the U.S. and/or other countries. The information herein is for informational purposes only and represents the current view of Microsoft Corporation as of the date of this presentation. Because Microsoft must respond to changing market conditions, it should not be interpreted to be a commitment on the part of Microsoft, and Microsoft cannot guarantee the accuracy of any information provided after the date of this presentation. MICROSOFT MAKES NO WARRANTIES, EXPRESS, IMPLIED OR STATUTORY, AS TO THE INFORMATION IN THIS PRESENTATION.