037-2011: sas® business intelligence: using enterprise...
TRANSCRIPT
1
Paper 037-2011
SAS® Business Intelligence: Using Enterprise-Level Solutions to Meet Department-Level Goals
Keith Myers, SAS Institute, Cary, NC
ABSTRACT Even though enterprise business intelligence focuses on the enterprise, you are not required to use these tools at just the enterprise level. Information exists at all levels of an organization, and some of the most useful information often can be found at the departmental level.
This paper presents a case study of a reporting initiative that was implemented within a SAS Technical Support department. The department’s goal was to enable each employee to create in Microsoft Word a monthly status report that included individualized monthly metrics. The metrics were derived, incorporated, and presented by using several SAS Business Intelligence solutions: SAS® Information Map Studio, SAS® Web Report Studio, SAS® Stored Processes, and the SAS® Add-In for Microsoft Office. The custom report also featured a new solution for using a stored process to pass prompt values to multiple sections of a report in SAS Web Report Studio.
INTRODUCTION Meaningful metrics about your productivity can provide management with useful information related to tracking projects and performance. This paper discusses a case study of a project done in the SAS Technical Support Business Intelligence (BI) Clients department that used enterprise-level solutions to develop a monthly report of metrics for management.
SAS Technical Support analysts perform many additional activities beyond the primary responsibility of assisting customers. An analyst's measured activities include the following:
entering problem defects
working on solutions for customer tracks
documenting defects, samples, and usage information in SAS Notes.
handling incoming customer calls
These metrics are difficult to monitor. In this case study, the report that was developed contains daily metrics for individual analysts in the SAS Technical Support BI Clients department.
The core application for this project is a SAS Web Report Studio report that can be opened in both Microsoft Word and Outlook. Other SAS applications provided additional support:
SAS Stored Processes—used to save prompt values.
SAS Information Map Studio—used to organize the data
SAS Management Console—used to manage the data, maps, and report
Surprisingly, half of the work on this project did not involve the use of the SAS BI clients. The majority of the work involved preparing and extracting the data.
This paper is meant for SAS BI client users who want to create reports on a departmental scale rather than at the enterprise level. The paper chronicles the case study from design to the final production report.
DESIGNING THE REPORT The starting point for this project was a rough sketch of all of the required metrics, by month. Several existing reports contained useful year-to-date values, by month, so it was evident that the reporting facility should also include a dialog box that prompts for the year and month. It was also evident from the design sketch that the report should also focus on particular detail records, also by a prompted month value.
After the requirements were determined from the rough sketch, it was important to determine what reporting objects to use. SAS Web Report Studio was the application of choice for modeling and selecting those objects. Of the various objects, a crosstabulation report worked best for showing the year-to-date values by month, and a simple listing
Business Intelligence and AnalyticsSAS Global Forum 2011
2
object worked best for the monthly detail records. For indicating customer-call overflow, a bar chart object made the most sense.
This design phase also helped reveal the following additional requirements:
a summary metric for the crosstabulation year-to-date reports.
a time series (two years of data). Analysts and management like to compare performance and activity from one year to the next.
data sources (relational SAS tables).
other challenges that had to be addressed:
o how to show both yearly and monthly data simultaneously
o how to develop a single set of prompts that are passed to all report sections
PREPARING AND EXTRACTING THE DATA More than 50% of the time needed to develop this application was spent preparing and extracting the data. Although the design provided the metrics, locating the metrics was much more challenging. The required data resided in five different, secure data bases. Therefore, Read permission to the data had to be requested from the owners of the data. In one of the source tables that reside in an SQL server database, an SQL server client had to be installed on the reporting machine in order to extract the data. In most cases, existing extraction code was provided as a basis for a starting point. The existing code was challenging for the following reasons:
It contained difficult-to-understand complex joins of other tables.
The code referenced user-defined formats, and it was not evident where these formats were stored.
The code contained unfamiliar conditional statements.
The measures that were required for the new report were not easily recognizable.
The code included SAS macros, so it was not transparent as to what was happening in the underlying code.
Having the contact information of someone that understood the data was critical. The existing code had to be modified to match the report design specifications. Part of the modification involved keeping some user-ID data items and adding other items for personalized filtering so that a user sees only his or her individual metrics.
Each of the data sources was unique. In most cases, filtering by year was necessary in order to keep the size of the tables to a minimum. During this phase, SAS programming skills were integral because the data was extracted and stored locally as SAS tables. Using SAS tables made the report application easy to administer in SAS Management Console because only one Base SAS® library was required for all of the source tables. This method also eliminated the need for special database permissions in the launch credentials (with a user ID of sassrv) for the SAS Pooled Workspace Server. The last part of extracting the data involved verifying that the data was correct by using existing reports as a benchmark for most of the statistics that were to be used for quality assurance.
SCHEDULING THE CODE TO RUN DAILY The SAS code that was created in the data preparation and extraction phase must be refreshed on a daily basis so that the data remains current. In the Windows 7 operating environment, a common approach to refreshing your code is to create a .BAT file and then use the Windows Task Scheduler to run the file each day. The steps performed for scheduling the daily execution of the code are as follows:
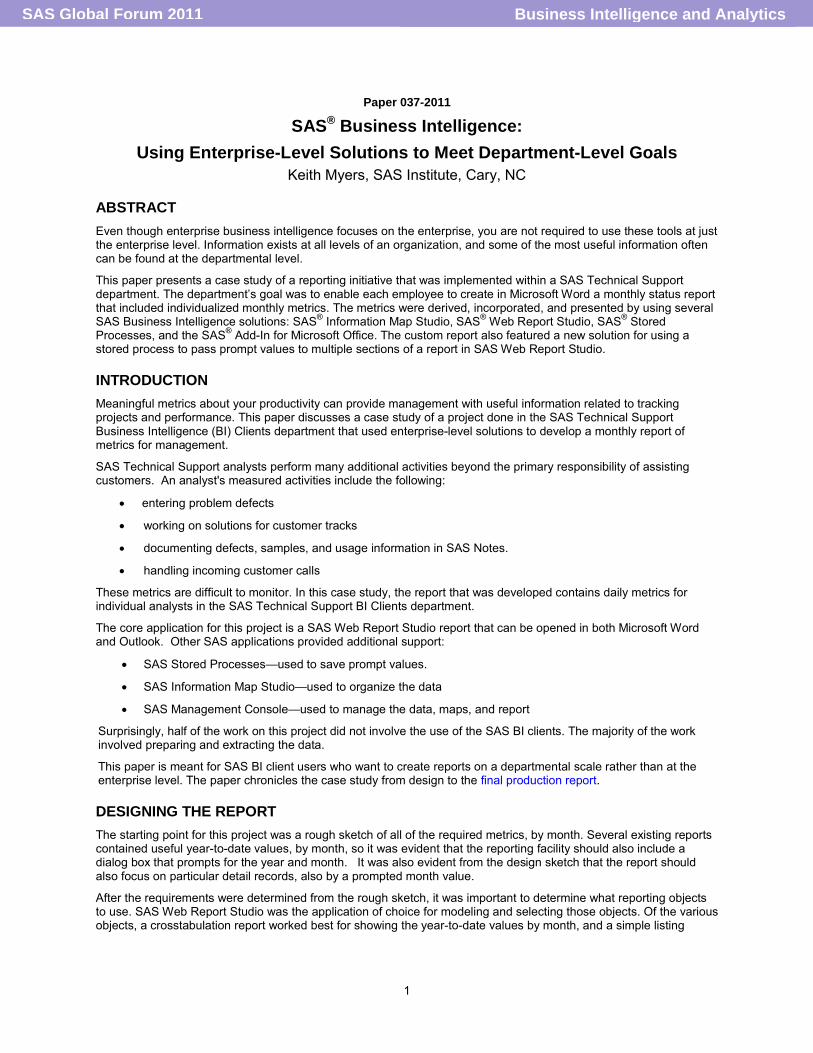
1. For easy administration, the code was combined into a single program called Run_All.sas.
Output 1.The Run_All.sas Program That Runs All Code for the Report Application
Business Intelligence and AnalyticsSAS Global Forum 2011
3
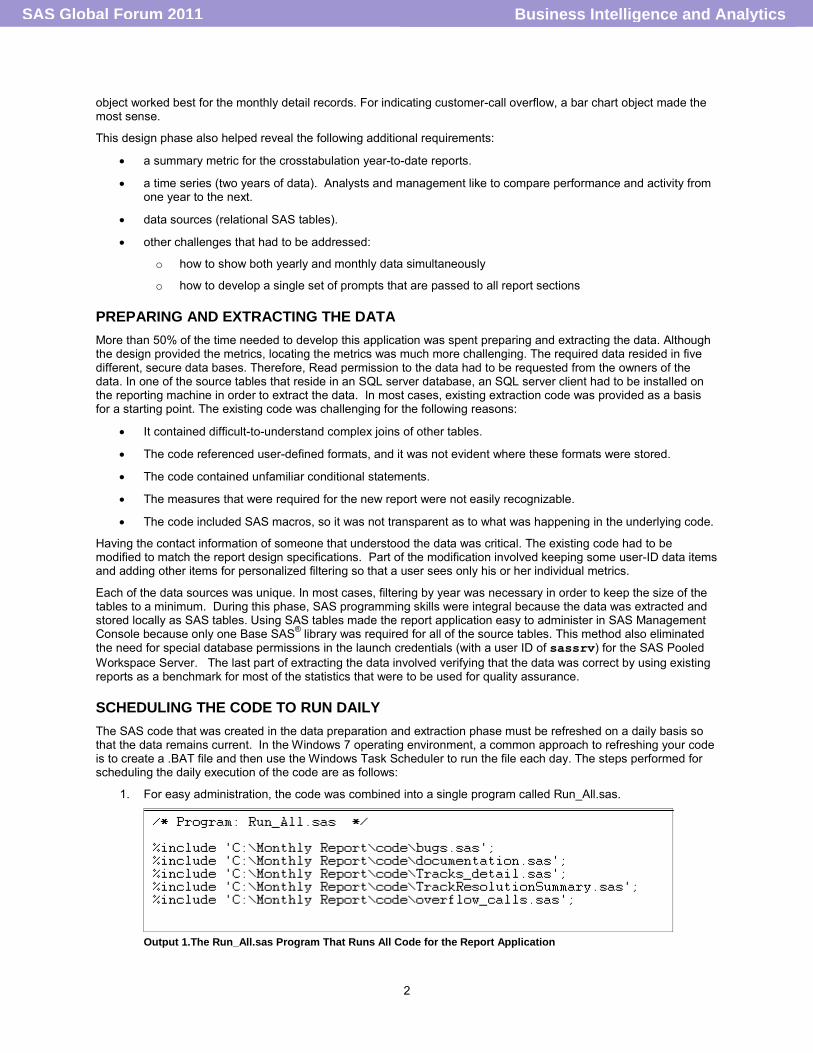
2. Next, a Windows .BAT file called MyStats.bat was created. As shown in the following display, the .BAT file calls SAS, includes the Run_All.sas program, and saves a log with a name including a timestamp extension.
Display 1. Scheduling in the Windows 7 Task Scheduler
The following output shows a part of the MyStats.bat file that is run by the Windows 7 Task Scheduler:
Output 2. A Portion of the MyStats.bat File
3. Finally, the native Windows 7 Task Scheduler was set up to run the MyStats.bat file, every morning at 6:00 a.m.
REPORTING USING THE BUSINESS INTELLIGENT CLIENTS After the preliminary steps were complete, the next phase of the project involved using various SAS BI clients to develop the report application. This phase included the following tasks:
creating the data sources that are to be used as input to the report. SAS Information Map Studio was chosen for this task.
selecting a report-creation tool. SAS Web Report Studio is the reporting tool of choice because it offers an easy-to-use interface for creating, managing, and administering reports.
Note: As an alternative reporting tool, you can use SAS Stored Processes.
determining the best method for making the report available to the broadest possible. Because most people use or have access to Microsoft Office, the SAS Add-In for Microsoft Office was selected as the method for making the report available. The add-In enables you to display the report in either Microsoft Word or Microsoft Outlook.
The following sections detail these tasks.
SAS® INFORMATION MAP STUDIO As input to the report, five information maps were created. Each information map presented similar challenges and common features.
Business Intelligence and AnalyticsSAS Global Forum 2011
4
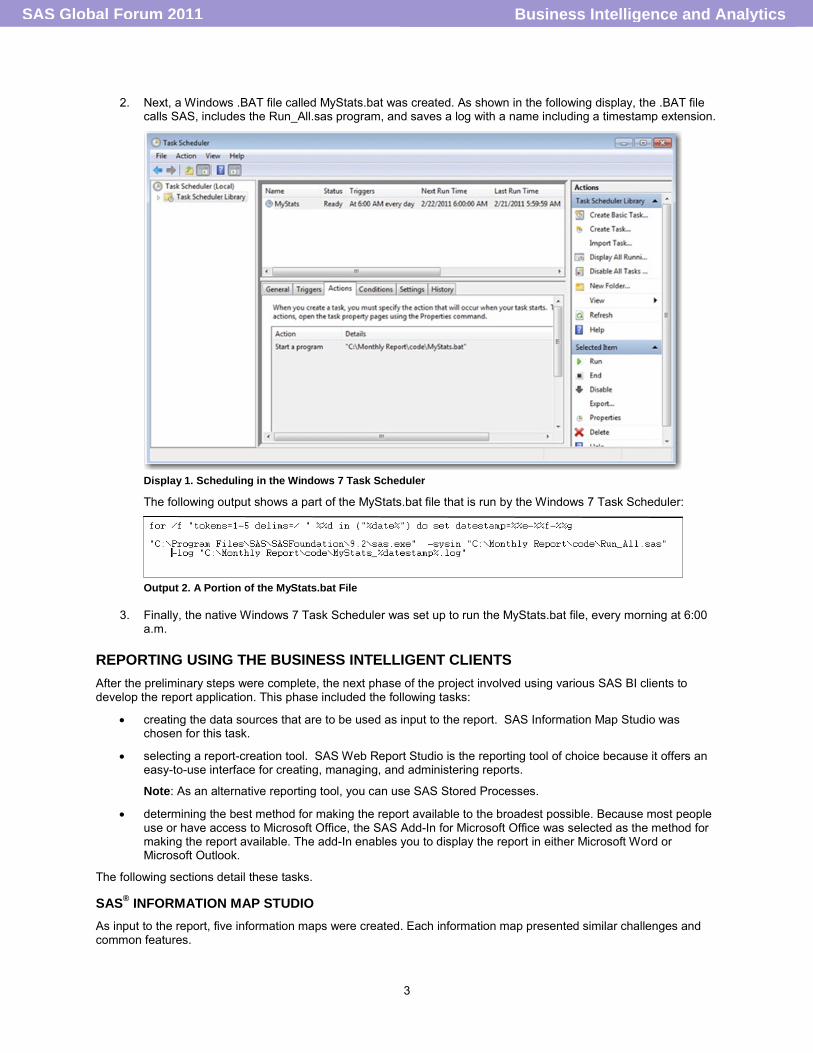
The six features shared by most of the information maps are identified in the following display:
Display 2. Common Features of the Five Information Maps
Include a Stored Process
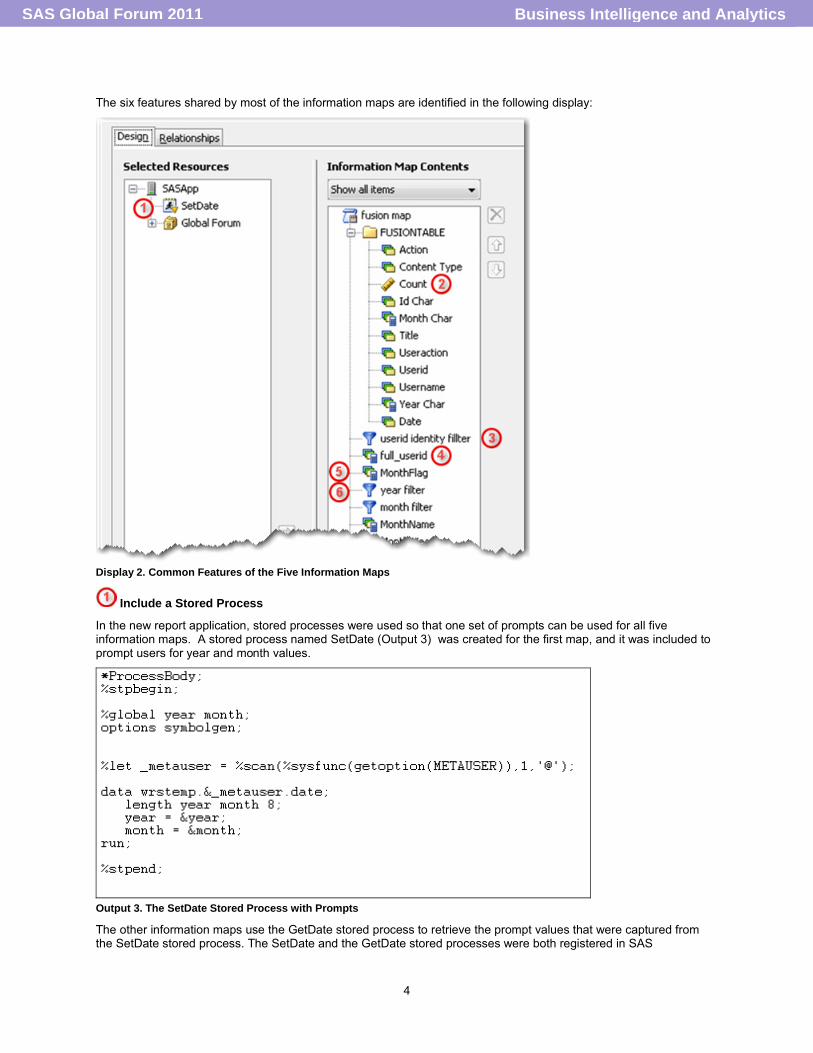
In the new report application, stored processes were used so that one set of prompts can be used for all five information maps. A stored process named SetDate (Output 3) was created for the first map, and it was included to prompt users for year and month values.
Output 3. The SetDate Stored Process with Prompts
The other information maps use the GetDate stored process to retrieve the prompt values that were captured from the SetDate stored process. The SetDate and the GetDate stored processes were both registered in SAS
Business Intelligence and AnalyticsSAS Global Forum 2011

5
Management Console. Part of the SetDate registration involves adding prompted parameters for the year and the month.
When the map is used, the stored process is executed and the results of the prompt values are stored in a temporary table in the WRSTEMP library. This table is unique for each person because it is based on individual user IDs.
Display 3. Temporary Table Holding Prompt Values
The GetDate stored process (not shown in the map in Display 2) was also used by other information maps that needed to fetch the year and month values that were already stored.
Output 4. The GetDate Stored Process
Note: For more information about these stored processes, see SAS Note 40758, "Using one set of prompt values to subset all sections in a SAS® Web Report Studio report." (SAS Institute Inc. 2010)
Extract the Count Data Item
You can summarize rows easily by setting the Count data item value to 1. For this application, the Count data item (the main measure for the report) was created originally in the information map. However, that item cannot be used as a measure in a crosstabulation table in SAS Web Report Studio. If you try to use Count in a crosstabulation table, the following message is displayed in the Assign Data window:
Count cannot be included in a crosstabulation table because the aggregation type(s) are not supported.
As a result, the Count values had to be created in the detail data.
A workaround is also available that enables you to set a data item to 1. In the SAS Information Map Studio Expression Editor, simply edit the expression by subtracting any data item from itself, and then add 1, as shown below:
Display 4. Writing an Expression That Sets a Data Item to a Value of 1
The resulting value is always equal to 1, and you can use it as a measure in a crosstabulation report in SAS Web Report Studio.
Business Intelligence and AnalyticsSAS Global Forum 2011

6
Create an Identity-Driven Filter That Displays Metrics for Individual Users
Users of the report application only need to see their own metrics. SAS Information Map Studio has a nice filter option that enables you to create identity-based filters. In SAS Information Map Studio, you create the filter as follows:
1. Select Insert ► New Filter to open the Edit Filter dialog box.
2. In the Edit Filter dialog box, select Derive identity values (for row-level permissions) in the Values(s) field, as shown in the following, partial display:
Display 5. Creating the userid identity filter
Create a New Data Item That Enables Proper Formatting of the User ID
The identity-driven filter is easy to create. However, in this case, the data was not in the proper form. As shown above in Display 5, the SAS.Userid property expects data in the form user-id@domain. However, the data for this project only contained the user ID. In order to resolve this issue, a new data item, full_userid, had to be created, as follows:
1. Select Insert ► New Data Item.
2. Click the Edit button that is below the Expression text box. This opens the Expression Editor dialog box, where the full_userid data item is created, as shown below. In this case, full_userid comprises the user ID and the domain.
Display 6. Creating the full_userid Data Item
Business Intelligence and AnalyticsSAS Global Forum 2011

7
Note: This step presents more of a challenge when users IDs have different domain names. In Display 6, the Expression Editor assumes that all users are in the same LOCALHOST domain. If user IDs are in different domains, you cannot manually code the domains into the expression. In this particular report, all of the users are members of the same domain.
Create the MonthFlag Data Item
The MonthFlag data item was required in order to filter out specific detail records in the SAS Web Report Studio Report. This data item is expressed by a case statement written in the SAS Information Map Studio Expression Editor. As shown in Display 7, this statement checks the month that a user enters in the prompt. Then the application sets the MonthFlag data item either to 1 or 0.
Display 7. Creating the MonthFlag Data Item
Add ID and Year Filters as General Prefilters
The finishing touch for the information map was to add the identity-driven filter and the year filter as general prefilters. To add these prefilters:
1. Select Edit ► Properties ► Information Map to open the Information Map Properties dialog box.
2. Click the General Prefilters tab. This step guarantees that the filters are always applied to the information map.
3. Drag the filters from the Available filters box to the Selected filters box, as shown in the following display:
Display 8. Setting Up the ID and Year Filters as Prefilters
This step guarantees that the filters are always applied to the information map because the filters are applied automatically in any application that uses the map
SAS® WEB REPORT STUDIO 4.3 SAS Web Report Studio 4.3 was chosen as the reporting application because reports that are created in SAS Web Report Studio 4.3 can be viewed from most of the SAS BI clients. To facilitate administration of the information, this project created one report in SAS Web Report Studio that presents results from all five of the data sources. The report contained five sections—one for each data source. The first section contains the information map with the SetDate stored process, which prompts for month and year. Each of the other four sections is based on the information maps that incorporate the GetDate stored process. These sections simply retrieve the prompt values that
Business Intelligence and AnalyticsSAS Global Forum 2011
8
are entered into the first section. Section data is displayed both by year-to-date and month parameters. For the monthly data, special filtering is applied, as discussed in the next section. The following sections discuss details about filtering Month data within a section and about saving the report.
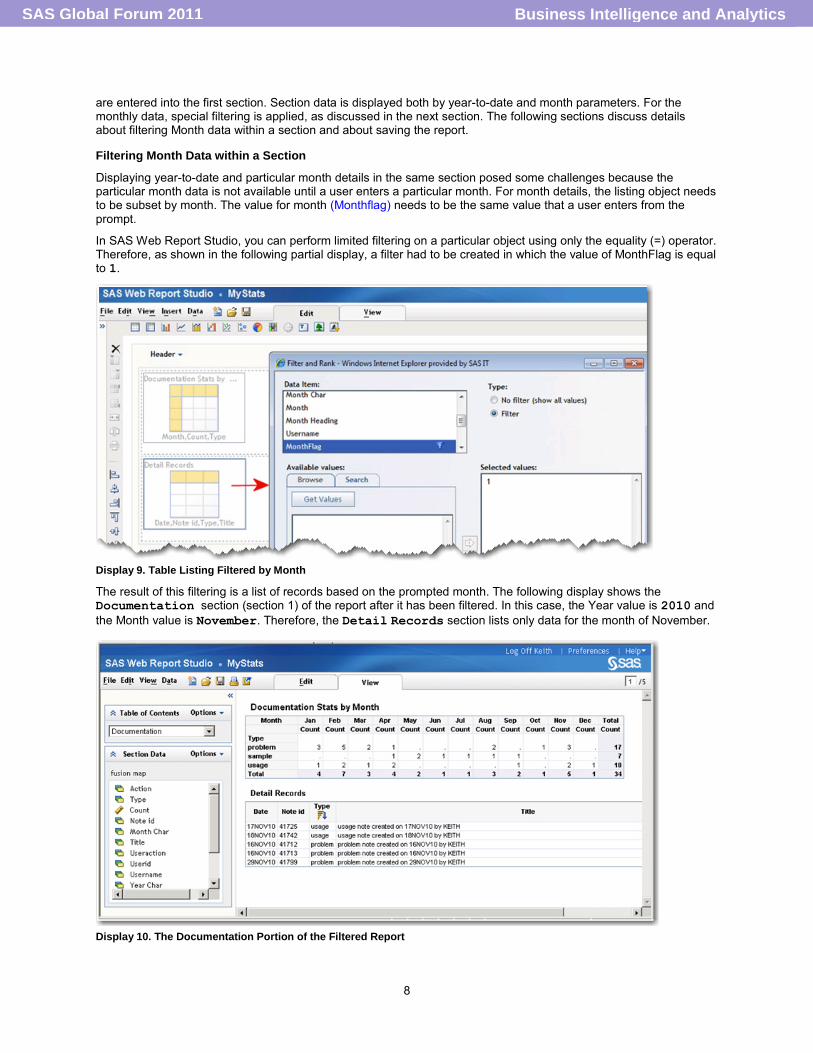
Filtering Month Data within a Section
Displaying year-to-date and particular month details in the same section posed some challenges because the particular month data is not available until a user enters a particular month. For month details, the listing object needs to be subset by month. The value for month (Monthflag) needs to be the same value that a user enters from the prompt.
In SAS Web Report Studio, you can perform limited filtering on a particular object using only the equality (=) operator. Therefore, as shown in the following partial display, a filter had to be created in which the value of MonthFlag is equal to 1.
Display 9. Table Listing Filtered by Month
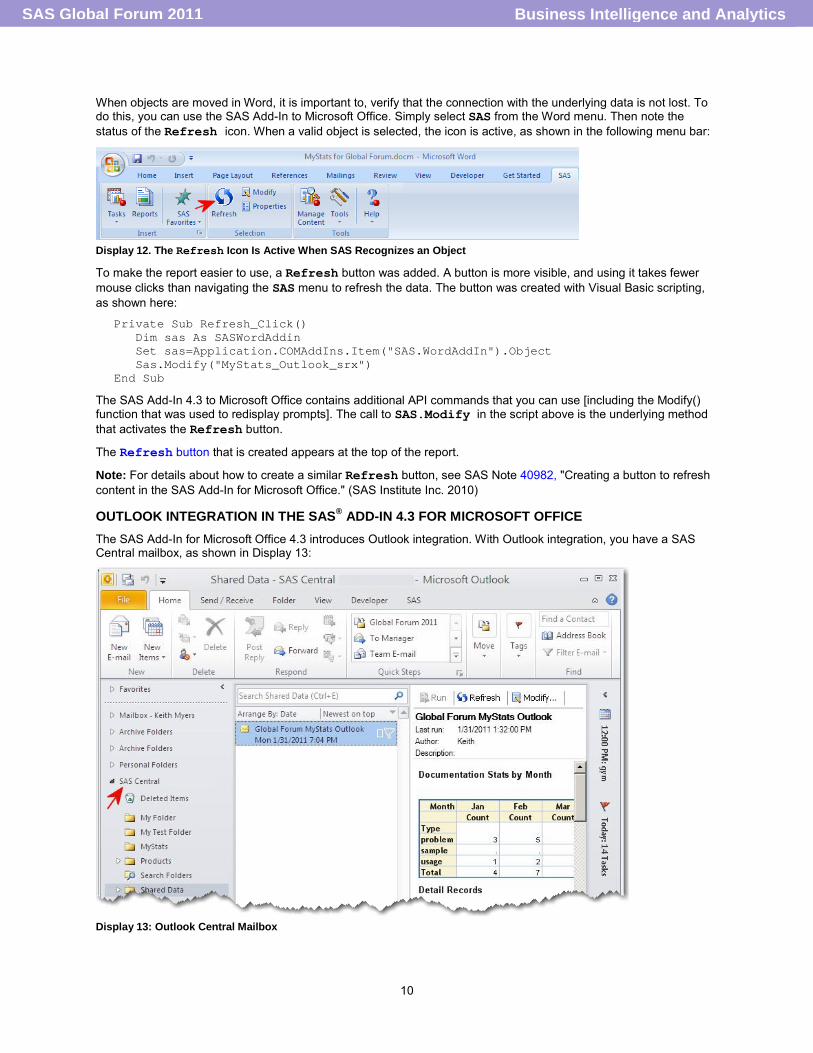
The result of this filtering is a list of records based on the prompted month. The following display shows the Documentation section (section 1) of the report after it has been filtered. In this case, the Year value is 2010 and the Month value is November. Therefore, the Detail Records section lists only data for the month of November.
Display 10. The Documentation Portion of the Filtered Report
Business Intelligence and AnalyticsSAS Global Forum 2011

9
Securing the Report
After a report is created, you want to make sure that it cannot be inadvertently changed by anyone, and you want to save it. In this case:
1. The application was secured by editing the permissions for the report on the Authorization tab in the properties dialog box. In this case study, WriteMetadata permission was set to Deny for all groups except the administrators group in SAS Management Console.
Display 11. Setting Authorization Permission for the Report
2. The report was saved and the metadata was backed up by exporting the reports and maps as a package file. Then, the secured report was copied and pasted near the root of the SAS Management Console folder structure for easy access by users.
SAS® ADD-IN 4.3 FOR MICROSOFT OFFICE The most exciting part of the project was inserting the final SAS Web Report Studio report into Microsoft Word. The advantage to using Word is that it is easy to document other work activities besides the reporting metrics. You can also easily attach a Word document to an e-mail message when you want to send the report to management.
One challenge to using Word was how to remove blank spaces that were present between report objects. Simply deleting spaces appeared to work, but when the report was refreshed, the blank spaces reappeared.
The key to removing the blank spaces permanently was to use the cut-and-paste features in Word. When you select, cut, and then paste an entire object in Word, the changes are maintained when you refresh the report. The easiest way to select an entire object is to highlight the object and then click the small square with the plus sign in the upper-left corner (as shown in the following output):
Output 5. Selecting an Entire Object
Business Intelligence and AnalyticsSAS Global Forum 2011
10
When objects are moved in Word, it is important to, verify that the connection with the underlying data is not lost. To do this, you can use the SAS Add-In to Microsoft Office. Simply select SAS from the Word menu. Then note the status of the Refresh icon. When a valid object is selected, the icon is active, as shown in the following menu bar:
Display 12. The Refresh Icon Is Active When SAS Recognizes an Object
To make the report easier to use, a Refresh button was added. A button is more visible, and using it takes fewer mouse clicks than navigating the SAS menu to refresh the data. The button was created with Visual Basic scripting, as shown here:
Private Sub Refresh_Click() Dim sas As SASWordAddin Set sas=Application.COMAddIns.Item("SAS.WordAddIn").Object Sas.Modify("MyStats_Outlook_srx") End Sub
The SAS Add-In 4.3 to Microsoft Office contains additional API commands that you can use [including the Modify() function that was used to redisplay prompts]. The call to SAS.Modify in the script above is the underlying method that activates the Refresh button.
The Refresh button that is created appears at the top of the report.
Note: For details about how to create a similar Refresh button, see SAS Note 40982, "Creating a button to refresh content in the SAS Add-In for Microsoft Office." (SAS Institute Inc. 2010)
OUTLOOK INTEGRATION IN THE SAS® ADD-IN 4.3 FOR MICROSOFT OFFICE The SAS Add-In for Microsoft Office 4.3 introduces Outlook integration. With Outlook integration, you have a SAS Central mailbox, as shown in Display 13:
Display 13: Outlook Central Mailbox
Business Intelligence and AnalyticsSAS Global Forum 2011
11
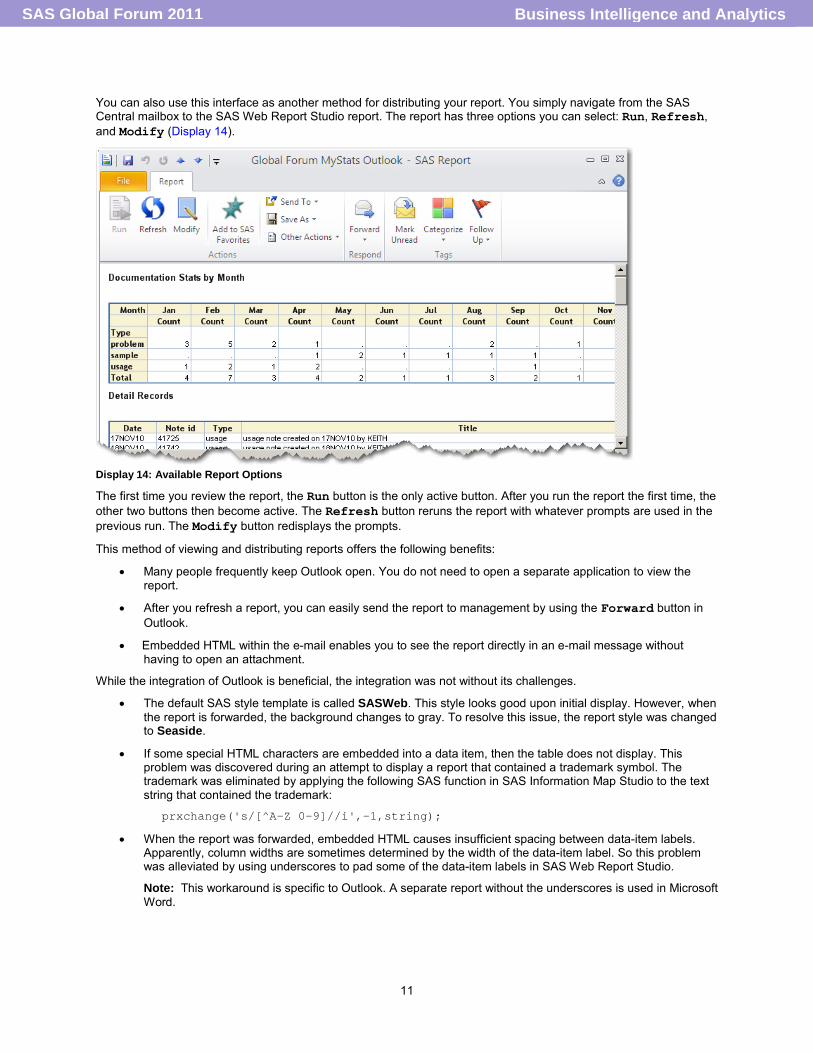
You can also use this interface as another method for distributing your report. You simply navigate from the SAS Central mailbox to the SAS Web Report Studio report. The report has three options you can select: Run, Refresh, and Modify (Display 14).
Display 14: Available Report Options
The first time you review the report, the Run button is the only active button. After you run the report the first time, the other two buttons then become active. The Refresh button reruns the report with whatever prompts are used in the previous run. The Modify button redisplays the prompts.
This method of viewing and distributing reports offers the following benefits:
Many people frequently keep Outlook open. You do not need to open a separate application to view the report.
After you refresh a report, you can easily send the report to management by using the Forward button in Outlook.
Embedded HTML within the e-mail enables you to see the report directly in an e-mail message without having to open an attachment.
While the integration of Outlook is beneficial, the integration was not without its challenges.
The default SAS style template is called SASWeb. This style looks good upon initial display. However, when the report is forwarded, the background changes to gray. To resolve this issue, the report style was changed to Seaside.
If some special HTML characters are embedded into a data item, then the table does not display. This problem was discovered during an attempt to display a report that contained a trademark symbol. The trademark was eliminated by applying the following SAS function in SAS Information Map Studio to the text string that contained the trademark:
prxchange('s/[^A-Z 0-9]//i',-1,string);
When the report was forwarded, embedded HTML causes insufficient spacing between data-item labels. Apparently, column widths are sometimes determined by the width of the data-item label. So this problem was alleviated by using underscores to pad some of the data-item labels in SAS Web Report Studio.
Note: This workaround is specific to Outlook. A separate report without the underscores is used in Microsoft Word.
Business Intelligence and AnalyticsSAS Global Forum 2011

12
CONCLUSION This paper illustrates how enterprise-level software solutions can be used to meet department-level needs. In this case, management in the SAS Technical Support BI Clients department needed a report for that highlighted information about staff members' projects and performance. The keys to creating a production-quality report of this type include:
a well-rounded understanding of the data
the knowledge that is required for extracting that data so it can be used in a report application
the selection of the right SAS BI client applications for the job
In the case study that is presented, the selected applications include SAS Stored Processes SAS Information Map Studio, SAS Web Report Studio, the Microsoft Windows Task Scheduler, and the SAS Add-In for Microsoft Office (with its new Outlook integration capabilities). The resulting application creates an identity-driven, monthly report that users can send via e-mail to management.
APPENDIX This appendix shows the various parts of the report application that was developed in the case study. The parts include the following:
a prompt dialog box that is displayed in Microsoft Word
the report tables
a bar chart for visualizing the data
THE PROMPT DIALOG BOX
Business Intelligence and AnalyticsSAS Global Forum 2011
13
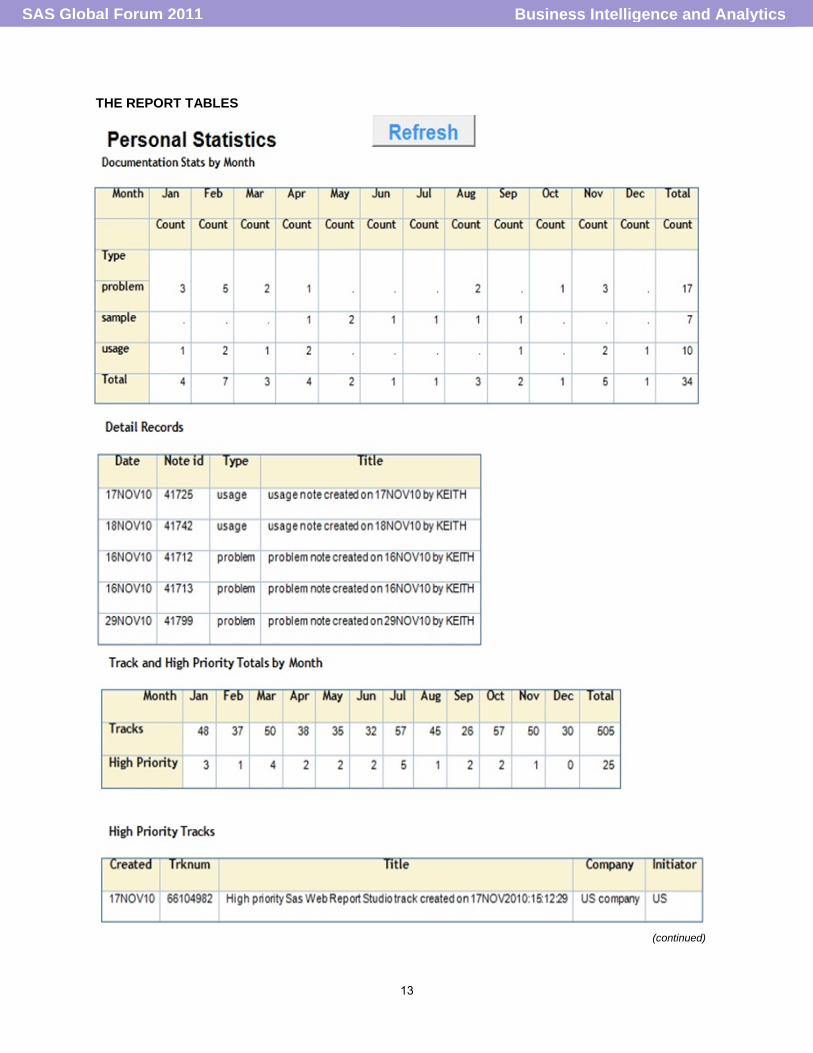
THE REPORT TABLES
(continued)
Business Intelligence and AnalyticsSAS Global Forum 2011

14
Business Intelligence and AnalyticsSAS Global Forum 2011

15
THE VISUAL BAR CHART
ACKNOWLEDGMENTS Special thanks to Susan Berry for editing and Madelyn Bythell for performing technical review.
REFERENCES SAS Institute Inc. 2010. SAS Note 40758, "Using one set of prompt values to subset all sections in a SAS® Web Report Studio report." Cary, NC: SAS Institute Inc. Available at support.sas.com/kb/40/758.html
SAS Institute Inc. 2010. SAS Note 40982, "Creating a button to refresh content in the SAS Add-In for Microsoft Office." Cary, NC: SAS Institute Inc. Available at support.sas.com/kb/40/982.html.
CONTACT INFORMATION Your comments and questions are valued and encouraged. Contact the author at:
Keith Myers SAS Technical Support SAS Campus Drive Cary, NC, 27513 E-mail: [email protected] Web: support.sas.com
SAS and all other SAS Institute Inc. product or service names are registered trademarks or trademarks of SAS Institute Inc. in the USA and other countries. ® indicates USA registration.
Other brand and product names are trademarks of their respective companies.
Business Intelligence and AnalyticsSAS Global Forum 2011