03 embedded generation customer demand management … · customer demand management we have...
TRANSCRIPT

Embedded Generation Behaviours & Customer Demand Management
Jeremy Caplin - Energy Forecasting Manager

22
What is Demand?
Large Power Station
Station Load
Embedded Generation
LV Transmission Losses
HV TransmissionLosses
Micro Generation
Pump Storage Demand
Interconnector Exports
Interconnector ImportsPump Storage Generation
Initial National Demand Outturn
Electricity Transmission System Demand
National Demand
Total Load Per Bidding Zone
33
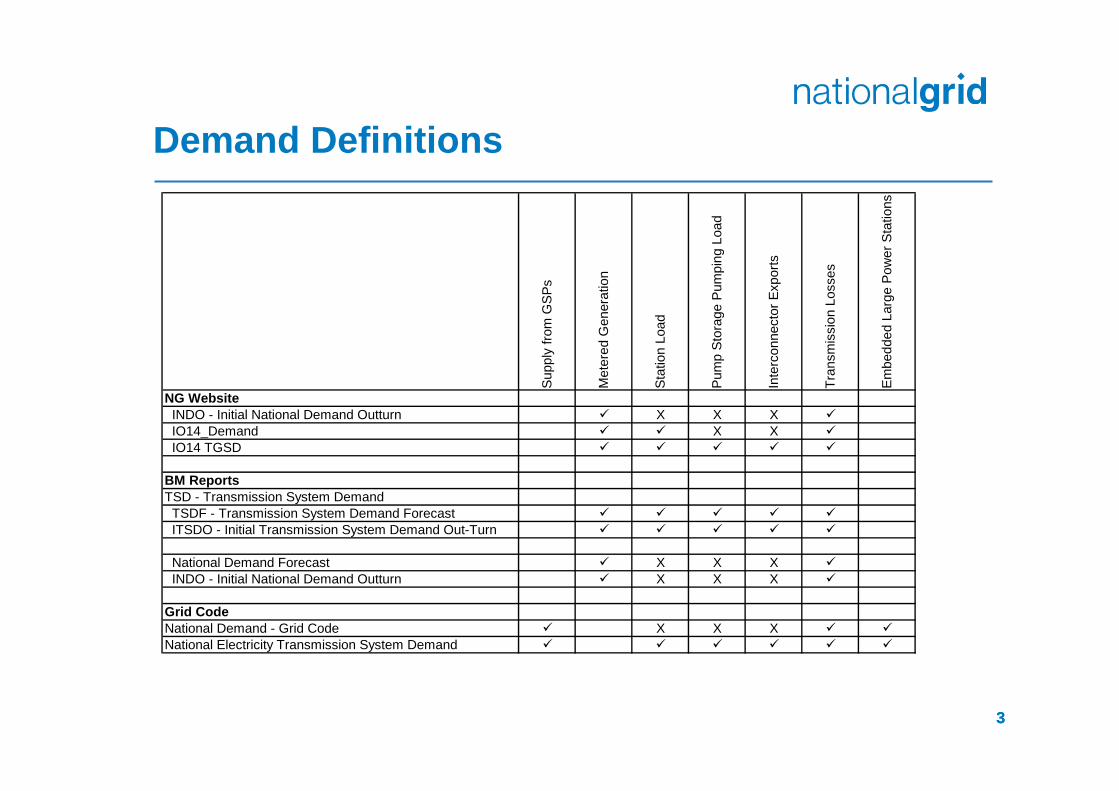
Demand Definitions
Supp
ly fr
om G
SPs
Met
ered
Gen
erat
ion
Stat
ion
Load
Pum
p St
orag
e Pu
mpi
ng L
oad
Inte
rcon
nect
or E
xpor
ts
Tran
smis
sion
Los
ses
Embe
dded
Lar
ge P
ower
Sta
tions
NG Website INDO - Initial National Demand Outturn X X X IO14_Demand X X IO14 TGSD
BM ReportsTSD - Transmission System Demand TSDF - Transmission System Demand Forecast ITSDO - Initial Transmission System Demand Out-Turn
National Demand Forecast X X X INDO - Initial National Demand Outturn X X X
Grid CodeNational Demand - Grid Code X X XNational Electricity Transmission System Demand

44
European Transparency Regulations
55
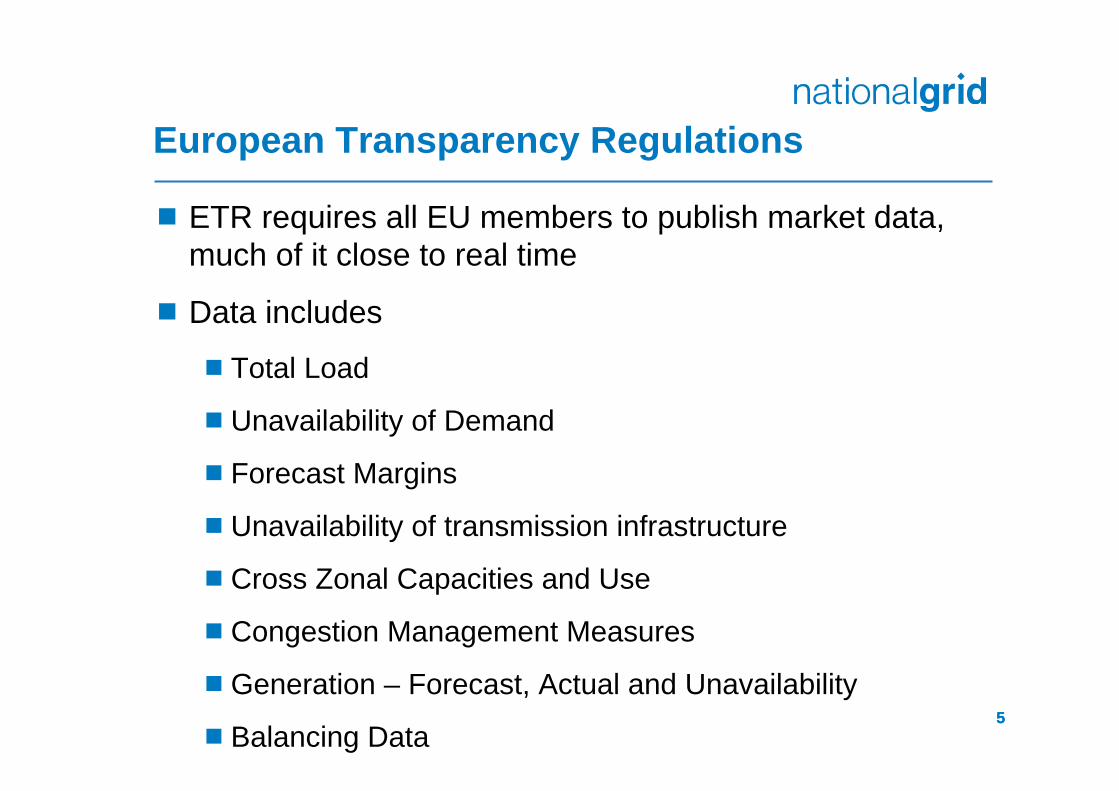
European Transparency Regulations
ETR requires all EU members to publish market data, much of it close to real time
Data includes
Total Load
Unavailability of Demand
Forecast Margins
Unavailability of transmission infrastructure
Cross Zonal Capacities and Use
Congestion Management Measures
Generation – Forecast, Actual and Unavailability
Balancing Data

66
European Transparency Regulations
Information National Grid is required to publish includes:
Outturn total load – one hour after end of each settlement period
Day-ahead forecast of total load per settlement period at 1200 on D-1, updated if forecast changes by more than 10%
Week-ahead forecast of daily maximum and minimum total load (Monday – Sunday) by 1400 on Friday. Updated if forecast changes by more than 10%
Month-ahead forecast of weekly maximum and minimum total load, one week before first day of month.
Year-ahead forecast of weekly maximum and minimum total load, by 15th of each month for following 12 months.

77
European Transparency Regulations
Total Load Per Bidding Zone is defined as “equal to the sum of power generated by plants on both TSO/DSO networks “
88
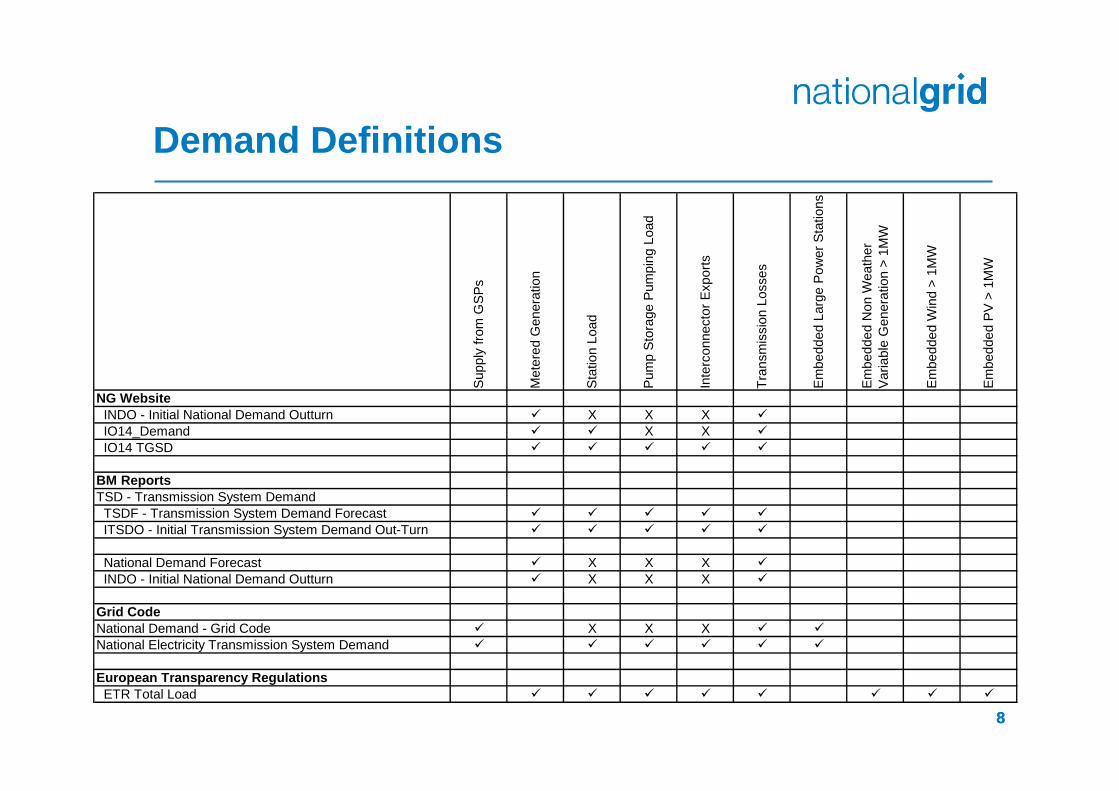
Demand Definitions
Supp
ly fr
om G
SPs
Met
ered
Gen
erat
ion
Stat
ion
Load
Pum
p St
orag
e Pu
mpi
ng L
oad
Inte
rcon
nect
or E
xpor
ts
Tran
smis
sion
Los
ses
Embe
dded
Lar
ge P
ower
Sta
tions
Embe
dded
Non
Wea
ther
Va
riabl
e G
ener
atio
n >
1MW
Embe
dded
Win
d >
1MW
Embe
dded
PV
> 1M
W
NG Website INDO - Initial National Demand Outturn X X X IO14_Demand X X IO14 TGSD
BM ReportsTSD - Transmission System Demand TSDF - Transmission System Demand Forecast ITSDO - Initial Transmission System Demand Out-Turn
National Demand Forecast X X X INDO - Initial National Demand Outturn X X X
Grid CodeNational Demand - Grid Code X X XNational Electricity Transmission System Demand
European Transparency Regulations ETR Total Load

99
Embedded Generation Behaviours
Until now, our models have implicitly assumed consistent behaviour of ‘conventional’ (non-weather variable) embedded generation
We are starting to see variations in the behaviour of this plant year on year
In order to comply with the European Transparency Regulations we have developed models of embedded generation
Non-weather variable embedded generation has increased in recent years
1010
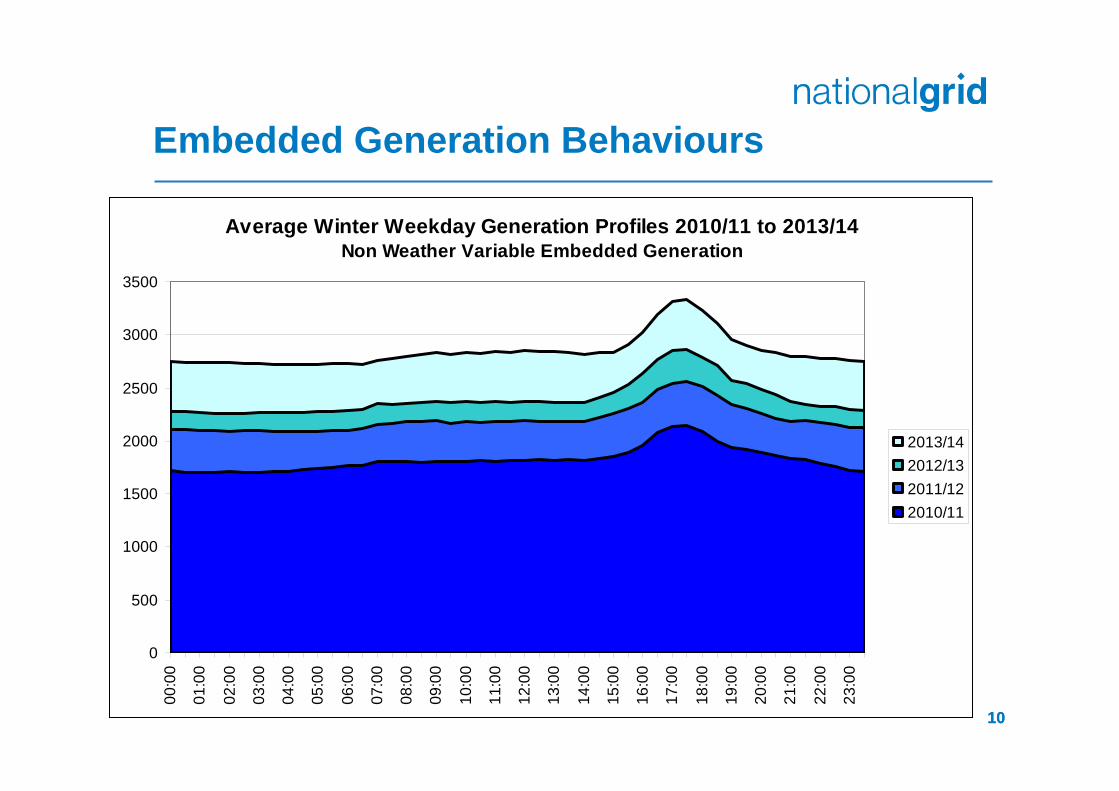
Embedded Generation Behaviours
Average Winter Weekday Generation Profiles 2010/11 to 2013/14Non Weather Variable Embedded Generation
0
500
1000
1500
2000
2500
3000
3500
00:0
0
01:0
0
02:0
0
03:0
0
04:0
0
05:0
0
06:0
0
07:0
0
08:0
0
09:0
0
10:0
0
11:0
0
12:0
0
13:0
0
14:0
0
15:0
0
16:0
0
17:0
0
18:0
0
19:0
0
20:0
0
21:0
0
22:0
0
23:0
0
2013/142012/132011/122010/11

1111
Embedded Generation Behaviours
Base generation has increased by 1 GW since 10/11
Peak generation has increased by 1.2 GW since 10/11
Ratio of Peak to Base much the same (about 1.25)
According to Digest of UK Energy Statistics (DUKES) embedded generation capacity increase by 147 MW between 2011 and 2014
It would appear that embedded generators are running at higher load factors
1212
Back to Demand Definitions

1313
Demand Definitions – Starting Point
GB Generation 11 Aug 2014
-5,000
0
5,000
10,000
15,000
20,000
25,000
30,000
35,000
00:0
0
01:0
002
:00
03:0
0
04:0
0
05:0
0
06:0
0
07:0
0
08:0
0
09:0
0
10:0
0
11:0
0
12:0
0
13:0
0
14:0
0
15:0
0
16:0
0
17:0
0
18:0
0
19:0
0
20:0
0
21:0
0
22:0
0
23:0
0
GB OtherGB HydroGB OilGB CCGTGB CoalGB WindGB NuclearGB Pump StorageTotal Interconnector
1414
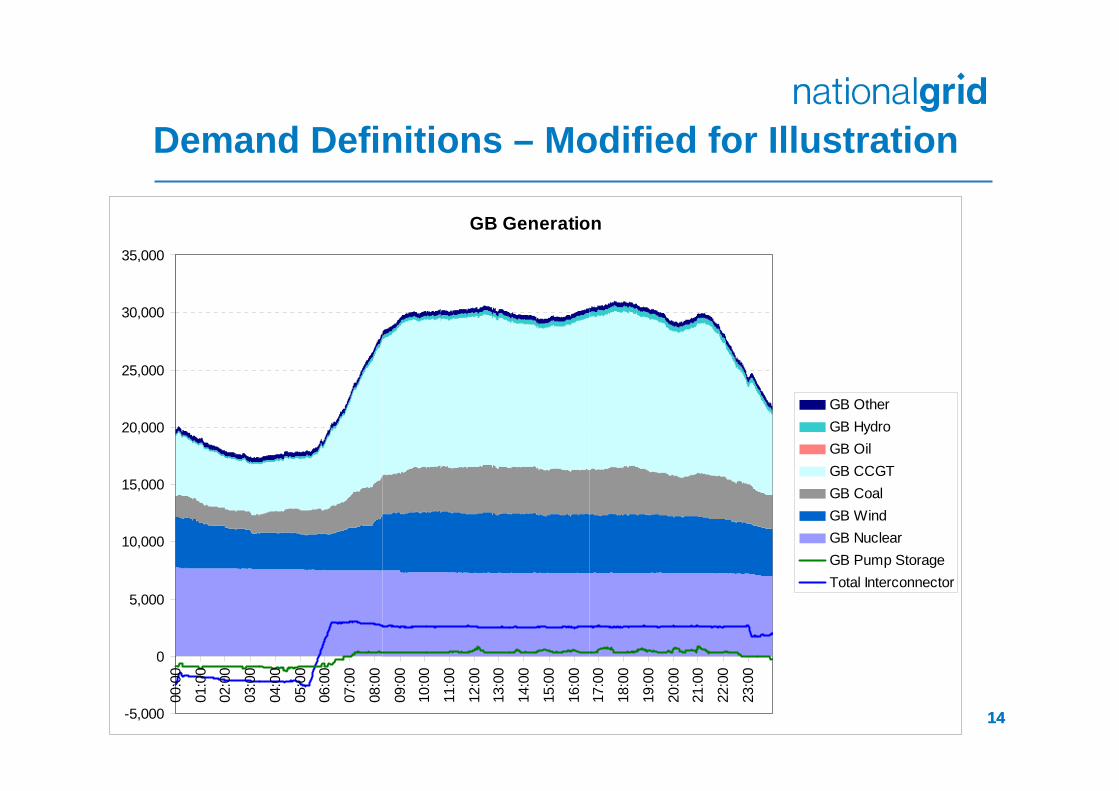
Demand Definitions – Modified for Illustration
GB Generation
-5,000
0
5,000
10,000
15,000
20,000
25,000
30,000
35,000
00:0
0
01:0
0
02:0
0
03:0
0
04:0
0
05:0
0
06:0
0
07:0
0
08:0
0
09:0
0
10:0
0
11:0
0
12:0
0
13:0
0
14:0
0
15:0
0
16:0
0
17:0
0
18:0
0
19:0
0
20:0
0
21:0
0
22:0
0
23:0
0
GB OtherGB HydroGB OilGB CCGTGB CoalGB WindGB NuclearGB Pump StorageTotal Interconnector

1515
Initial National Demand Outturn
INDO
-5,000
0
5,000
10,000
15,000
20,000
25,000
30,000
35,000
40,000
00:0
0
01:0
0
02:0
0
03:0
0
04:0
0
05:0
0
06:0
0
07:0
0
08:0
0
09:0
0
10:0
0
11:0
0
12:0
0
13:0
0
14:0
0
15:0
0
16:0
0
17:0
0
18:0
0
19:0
0
20:0
0
21:0
0
22:0
0
23:0
0
Pump Storage GenInterconnector ImportGB OtherGB HydroGB OilGB CCGTGB CoalGB WindGB NuclearINDOGB Pump StorageTotal Interconnector

1616
Electricity Transmission System Demand
Electricity Transmission System Demand
-5,000
0
5,000
10,000
15,000
20,000
25,000
30,000
35,000
40,000
00:0
0
01:0
0
02:0
0
03:0
0
04:0
0
05:0
0
06:0
0
07:0
0
08:0
0
09:0
0
10:0
0
11:0
0
12:0
0
13:0
0
14:0
0
15:0
0
16:0
0
17:0
0
18:0
0
19:0
0
20:0
0
21:0
0
22:0
0
23:0
0
Interconnector ExportsPump Storage LoadPump Storage GenInterconnector ImportGB OtherGB HydroGB OilGB CCGTGB CoalGB WindGB NuclearStation LoadTGSDGB Pump StorageTotal Interconnector
1717
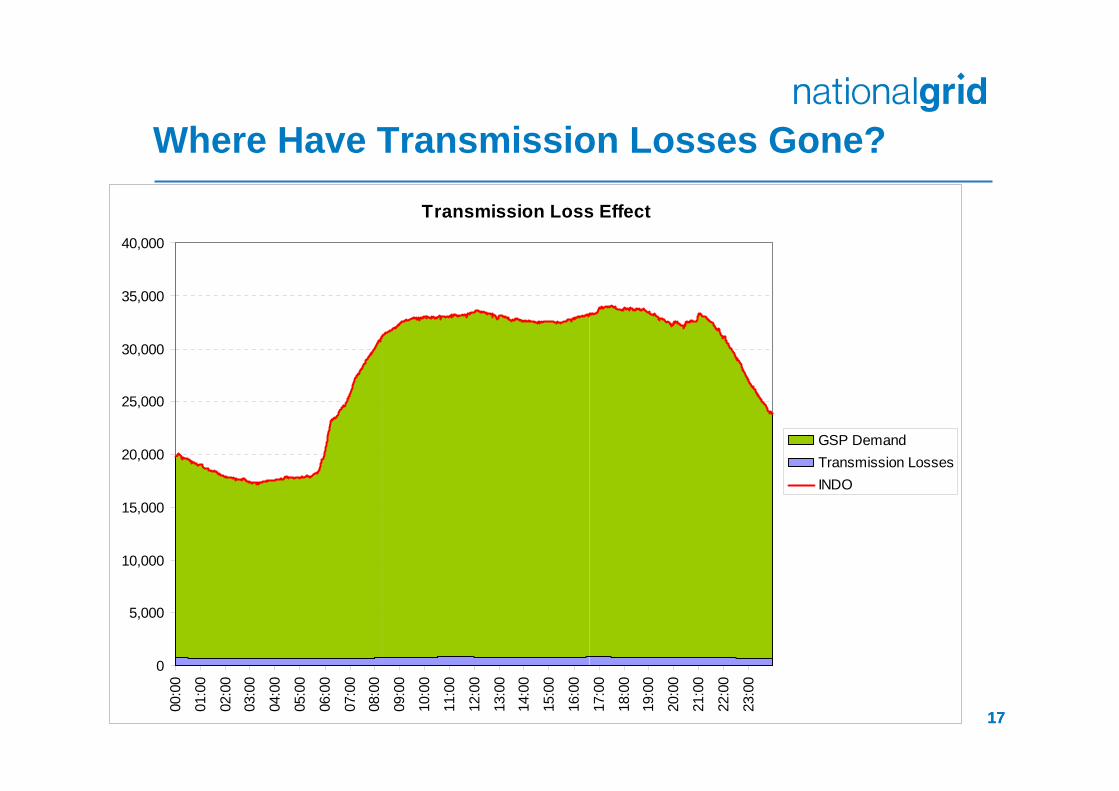
Where Have Transmission Losses Gone?
Transmission Loss Effect
0
5,000
10,000
15,000
20,000
25,000
30,000
35,000
40,000
00:0
0
01:0
0
02:0
0
03:0
0
04:0
0
05:0
0
06:0
0
07:0
0
08:0
0
09:0
0
10:0
0
11:0
0
12:0
0
13:0
0
14:0
0
15:0
0
16:0
0
17:0
0
18:0
0
19:0
0
20:0
0
21:0
0
22:0
0
23:0
0
GSP DemandTransmission LossesINDO

1818
ETR Total Load
European Transparency Regulation Total Load
-5,000
0
5,000
10,000
15,000
20,000
25,000
30,000
35,000
40,000
45,000
00:0
0
01:0
0
02:0
0
03:0
0
04:0
0
05:0
0
06:0
0
07:0
0
08:0
0
09:0
0
10:0
0
11:0
0
12:0
0
13:0
0
14:0
0
15:0
0
16:0
0
17:0
0
18:0
0
19:0
0
20:0
0
21:0
0
22:0
0
23:0
0
Emb Non-Weather VarPhoto-VoltaicEmbedded WindInterconnector ExportsPump Storage LoadPump Storage GenInterconnector ImportGB OtherGB HydroGB OilGB CCGTGB CoalGB WindGB NuclearStation LoadETR Total LoadGB Pump StorageTotal Interconnector

1919
Effect of Weather Variable Embedded Generation
Effect of Embedded Wind and PV
0
5,000
10,000
15,000
20,000
25,000
30,000
35,000
40,000
45,000
00:0
0
01:0
0
02:0
0
03:0
0
04:0
0
05:0
0
06:0
0
07:0
0
08:0
0
09:0
0
10:0
0
11:0
0
12:0
0
13:0
0
14:0
0
15:0
0
16:0
0
17:0
0
18:0
0
19:0
0
20:0
0
21:0
0
22:0
0
23:0
0
Emb Non-Weather VarPhoto-VoltaicEmbedded WindInterconnector ExportsPump Storage LoadPump Storage GenInterconnector ImportGB OtherGB HydroGB OilGB CCGTGB CoalGB WindGB NuclearStation LoadTGSDETR Total Load

2020
Effect of Weather Variable Embedded Generation
Effect of Embedded Wind and PV
0
5,000
10,000
15,000
20,000
25,000
30,000
35,000
40,000
45,000
00:0
0
01:0
0
02:0
0
03:0
0
04:0
0
05:0
0
06:0
0
07:0
0
08:0
0
09:0
0
10:0
0
11:0
0
12:0
0
13:0
0
14:0
0
15:0
0
16:0
0
17:0
0
18:0
0
19:0
0
20:0
0
21:0
0
22:0
0
23:0
0
Emb Non-Weather VarPhoto-VoltaicEmbedded WindInterconnector ExportsPump Storage LoadPump Storage GenInterconnector ImportGB OtherGB HydroGB OilGB CCGTGB CoalGB WindGB NuclearStation LoadTGSD No Wind or PVTGSDETR Total Load

2121
Customer Demand Management

2222
Customer Demand Management
Grid Code Defines Customer Demand Management as:

2323
Customer Demand Management
National Grid can not measure CDM
CDM can be estimated by looking at shape of demand curve at darkness peak – CDM gives flatter profile over peak

2424
Customer Demand Management
Comparison of Low and High CDM Days
25000
30000
35000
40000
45000
50000
55000
12:0
0 A
M
1:00
AM
2:00
AM
3:00
AM
4:00
AM
5:00
AM
6:00
AM
7:00
AM
8:00
AM
9:00
AM
10:0
0 A
M
11:0
0 A
M
12:0
0 P
M
1:00
PM
2:00
PM
3:00
PM
4:00
PM
5:00
PM
6:00
PM
7:00
PM
8:00
PM
9:00
PM
10:0
0 P
M
11:0
0 P
M
Thurs 23 Jan 14 - No CDMWed 29 Jan 14 - High CDM

2525
Customer Demand Management
CDM significantly increased last year
Number of Days With CDM
0
5
10
15
20
25
30
35
40
10/11 11/12 12/13 13/14
Number of days with CDM >= 1000 MW Total number of days with CDM

2626
Customer Demand Management
CDM significantly increased last year
Number of Days With CDM
0
5
10
15
20
25
30
35
40
10/11 11/12 12/13 13/14
Number of days with CDM >= 1000 MW Total number of days with CDM

2727
Customer Demand Management
CDM significantly increased last year
27 days with CDM estimated to be 1000 MW or more compared with 10 such days in previous three years combined.
Partially driven by Triad Avoidance
Last year was very hard to forecast Triads
Partially driven by changes in customer behaviour
We anticipate high levels of CDM this year

2828
Customer Demand Management
We have developed new model of CDM
This will NOT feed into our day ahead forecasts
All our forecasts at Day Ahead or longer timescales assume no CDM
If we include CDM in our forecasts then forecast demand is lower, and so less CDM will occur.
Within Day forecasts INCLUDE CDM – published data comes direct from systems used by Control Room and so reflect forecast actual demand
CDM Will be included in overnight forecasts by Control Room from 1930 on day ahead

2929
Help Us Forecast Better
Grid Code OC1 says OC1.5.5.2 Customer Demand Management
(a) Each Supplier will notify NGET of any Customer Demand Management proposed by itself which may result in a Demand change equal to or greater than the Customer Demand Management Notification Level averaged over any half hour on any Grid Supply Point which is planned to occur at any time in the Control Phase and of any changes to the planned Customer Demand Management already notified to NGET as soon as possible after the formulation of the new plans.
Customer Demand Management Notification Level
The level above which a Supplier has to notify NGET of its proposed or achieved use of Customer Demand Management which is 12 MW in England and Wales and 5 MW in Scotland.

3030
Help Us Forecast Better
Grid Code OC1 says OC 1.5.6 (b) Customer Demand Management
Each Supplier will supply MW profiles of the amount and duration of Demand reduction achieved by itself from the use of Customer Demand Management equal to or greater than the Customer Demand Management Notification Level (averaged over any half hour on any Grid Supply Point) on a half hourly and Grid Supply Point basis during the previous calendar day.

3131
Help Us Forecast Better
Some Suppliers still give us data
Some have fallen out of the habit
We are seeking to engage with Suppliers through several different routes to improve data flows to allow us to better forecast CDM

3232
Help Us Forecast Better
Grid Code requirements are out of date
We would like to know if you plan to do on-the-day discretionary despatch of demand and generation
At present we are not asking for the post event data, just a warning of plans for the next day
Please send CDM plans / forecasts to [email protected] by 1600 on day ahead
