01767 bids kpi document - auckland council · and analysis of benchmarks or key performance...
TRANSCRIPT

Manukau City Council
Measuring Progress
Improving BID performance using Key Performance Indicators
June 2005


1
CONTENTS 1 Introduction 2
Why measure performance? 2
What to measure? 3
How much to measure? 3
How to measure? 3
How to use KPIs? 3
2 Best Practice 4
International Evidence 4
The Local Context 5
3 Step by step guide to constructing Key Performance Indicators 7
4 Templates 11
5 Resources 13

2
WHY MEASURE PERFORMANCE?
The first section of this document provides a brief introduction to the main concepts of developing and designing Key Performance Indicators. The second section provides an overview of International Best Practice and the local context. The third section provides a set of step-by-step instructions for the design of a Performance Review System using KPIs. The fourth and final section provides a set of templates for you to use (electronic versions are available from Council).
This section provides a brief introduction to the major concepts underlying performance review and management using Key Performance Indicators.
Section content• Why measure performance?• What to measure?• How much to measure?• How to measure?• How to use KPIs?
Measurement and monitoring of performance is critical to the success of a Business Improvement District (BID). There are several good reasons for investing your energy into this process:
• By measuring results, you can tell success from failure. • By observing both successes and failures you can learn.• By identifying success you can reward and promote it.• By recognizing failure you can correct it.• By demonstrating results and dealing with failures you can win support.
The outcome of this process of performance measurement is improved decision making via the establishment, monitoring and analysis of benchmarks or key performance indicators (KPIs).
SECTION
1 Introduction

3
WHAT TO MEASURE?
HOW MUCH TO MEASURE?
HOW TO MEASURE?
HOW TO USE KPIs
Your strategic and business plans contain the long, medium and short term goals of your BID. Each goal must have at least one associated KPI and each of your KPIs must target at least one of the goals. In addition, KPIs should measure the overall success or failure of the Town Centre or Industrial Precinct. To put it more succinctly,
KPIs should measure two things • The performance of the BID Association
• The performance of the BID
A balance needs to be struck between gathering the essential data to make well-informed decisions and wasting time collecting too much information. The required number of KPIs depends on the nature and complexity of the project, but as a rough guide line, best practice evidence indicates that projects should have around 10 – 20 KPIs (The Circle Initiative, 2001).
Care must be taken in both the design and the interpretation of performance measures. For example, it is tempting to only measure those things that are easy to measure (e.g., occupancy rates, carpark usage, etc.). However, some measures that are not easily collected are nevertheless critically important (e.g., the attitudes and perceptions of a variety of stake holders toward the BID and its Association).
Similarly, it is tempting to conclude that changes in any of the measures over time (good or bad) are caused largely by the efforts of the BID programme. However, it is often almost always impossible to isolate the contribution of a programme from broader economic changes such as the business cycle, or a change in government policy on immigration, or the All Blacks winning or losing the rugby world cup. Consequently, professional care must be taken in the design and analysis stages of the process
Fortunately, the key lessons are simple:
• Design at least some of the measures so that they are closely linked to the performance of the BID Association; • Openly evaluate the extent to which each of the measures is under the control of the BID Association;• Employ professional help in designing the performance measures, or at least in checking their design before
implementing. Contact Council for relevant advice.
Each of the performance measures will become a benchmark (or key performance indicator; KPI). Together they will help you determine how the area changes over time and form a comprehensive record of BID and BID Association performance. This in turn will inform decision making and planning. Note that the usefulness of the KPIs is directly related to their quality, so the energy that you are putting into the design stage will come back to reward you!

4
THE INTERNATIONAL EVIDENCE
SECTION
2 Best PracticeThere is plenty of information available on performance measurement and management both in general (e.g., Baker 2002; Harbour, 1997) and more specifically with respect to BID initiatives. For example, Houston (2003) provides a very readable introduction to BID management (chap. 4), taking into account experiences from across the world. In addition, two UK-based organisations (The Circle Initiative and the Association of Town Centre Management) have published guidelines and templates around the construction and implementation of Key Performance Indicators for BIDs.
This section briefly reviews the main lessons from these and other sources and concludes by providing a brief summary of, and background to, the local context.
In general the core activities of BIDs around the world tend to revolve around the following categories:
• Cleaning and maintenance• Security• Marketing• Events• Transport and parking• Lobbying councils and other organizations
Some of the consequent performance measures monitor areas such as
• Local developments o population demographics, employment trends, number of businesses
• BID health o retail vacancy, retail performance, retail sales
• BID progress o number of visits to the area, public transport, crime statistics, safety and security, street maintenance and
cleanliness, tourism, evening economy

5
Here are some important established facts about KPIs and their use:
• Carefully developed and maintained performance measurement systems using KPIs provide significant advantages for BIDs.
• KPIs need to be constructed so that maximum information is collected with minimum effort and cost. The need to be SMART, i.e.,
o S pecific o M easureable o A chievable o R elevant o T imed
• Well-designed and tightly targeted opinion surveys provide good information on the effects of BID investment. BID Association performance is best measured by tracking changes in these attitudes and perceptions.
• Isolating BID Association contributions to changes in certain ‘hard’ indicators (e.g. office vacancy, crime rates, sales revenue, pedestrian traffic) is difficult and often impossible. In general, KPIs identify trends (what is happening). Careful analysis needs to establish the underlying reasons for these trends (why it is happening).
• Simply reporting on how much money is spent and what it is spent on is not informative or sufficient.
• Major performance reviews (evaluating the BIDs overall direction as well as the usefulness of existing KPIs) should occur at least every 5 years. These reviews should be supplemented by more frequent (e.g. annual) checks resulting in performance reports that can then be used for the next business plan and funding cycle.
• A range of KPI templates is available from The Circle Initiative’s (2001) website (see the resource section at the end of this document for the address).
Important local strategic information can be obtained from Tomorrow’s Manukau (2001; see resource section) a strategic document aimed at guiding the city’s development over the period 2001 – 2010. The seven strategic aims of Tomorrow’s Manukau are to develop• Educated and knowledgeable people• Vibrant and strong communities• Safe Communities• Accessible centres• Healthy People through healthy lifestyles and housing• Thriving Economy through developing the local economy and employment• Sustainable Environment and Heritage
THE LOCAL CONTEXT

6
Some of the local context for many of the individual town centres is provided by Manukau’s Town Centre Strategy (2004; see resource section for the web address). It provides a wealth of information for the city as a whole as well as for most of the individual town centres within the city. Although the document provides no specific information about the city’s industrial precincts it is a must-read document for all BID Associations. Based on this document the overall performance measures for Manukau’s Town Centres include
• Measures of delivery o Percent of actions completed within the planned timeframes o Actual vs budgeted CAPEX and OPEX expenditure on all actions
• Measures of effectiveness (combined into a Town Centre Vitality Index) o Retail turnover and occupancy rates o Pedestrian foot traffic counts o Business and user survey responses o Population density o Range of services o Local visitor numbers o Regional visitor numbers o Overseas visitor numbers o Business category turnover
• Measures of efficiency o Total expenditure measured against the Town Centre Vitality Index
Most importantly however, each BID Association needs to refer to its own strategic and business plans (which will already incorporate the above) prior to the development of appropriate KPIs.
7
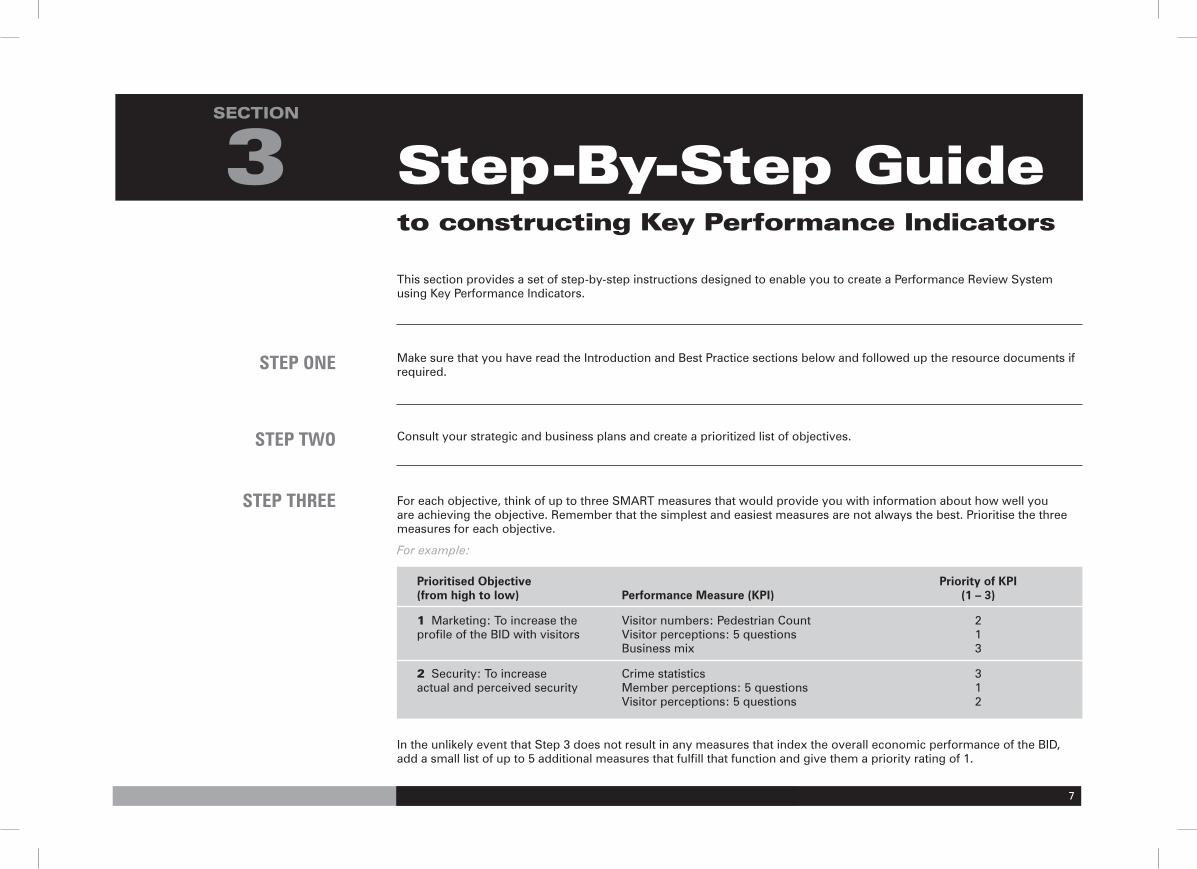
This section provides a set of step-by-step instructions designed to enable you to create a Performance Review System using Key Performance Indicators.
Make sure that you have read the Introduction and Best Practice sections below and followed up the resource documents if required.
Consult your strategic and business plans and create a prioritized list of objectives.
For each objective, think of up to three SMART measures that would provide you with information about how well you are achieving the objective. Remember that the simplest and easiest measures are not always the best. Prioritise the three measures for each objective.
For example:
Prioritised Objective Priority of KPI (from high to low) Performance Measure (KPI) (1 – 3)
1 Marketing: To increase the Visitor numbers: Pedestrian Count 2 profile of the BID with visitors Visitor perceptions: 5 questions 1 Business mix 3
2 Security: To increase Crime statistics 3 actual and perceived security Member perceptions: 5 questions 1 Visitor perceptions: 5 questions 2
In the unlikely event that Step 3 does not result in any measures that index the overall economic performance of the BID, add a small list of up to 5 additional measures that fulfill that function and give them a priority rating of 1.
STEP ONE
SECTION
3 Step-By-Step Guideto constructing Key Performance Indicators
STEP TWO
STEP THREE

8
For each KPI, provide an evaluation of the extent to which the KPI is likely to be directly affected by the performance of the BID Association. You can achieve this by providing a rating from 1 to 5, where 1 equals a very small impact and 5 indicates a very large impact.
For example, a satisfaction survey of visitors at an event you have marketed and organised might score a 5. A simple count of visitors at that event might score a 4 (some visitors may be here for reasons other than the event’s marketing, or they may indeed simply be passing through). By contrast, annual sales figures across the entire BID or business occupancy rates might score a 1, since these measures are dependent on many other factors aside from the performance of the BID Association.
Your highest priority measure for each objective should have an impact rating of at least 4. This rating will become important during the analysis of your KPIs.
For example (by adding a column to the table in Step 3),
Prioritised Objective Priority of KPI Impact Rating (from high to low) Performance Measure (KPI) (1- 3) of KPI (1-5)
1 Marketing: To increase the Visitor numbers: Pedestrian Count 2 2 profile of the BID with visitors Visitor perceptions: 5 questions 1 4 Business mix 3 2
2 Security: To increase actual Crime statistics 3 2 and perceived security Member perceptions: 5 questions 1 5 Visitor perceptions: 5 questions 2 3
You are now in the position where you can create up to three lists of prioritized measures so that all high priority measures (from Step 3) come first on each list, the medium priority measures come second, and the low priority measures come third. On completion, each list should consist of no more than 20 measures. Group the measures by method of data collection (e.g., mail survey, street survey, telephone interview, council or other government database, etc.) and provide a costing for each method.
STEP FOUR
STEP FIVE

9
Put into place an action plan for each collection method, nominating time lines (e.g., annual, every 2.5 years, every 5 years, etc), and responsible personnel and/or contractors.
Provided that the budget allows for this, at least one annual data collection for all KPIs is desirable. For some KPIs (e.g. crime statistics) more frequent data collection (e.g. monthly) might be indicated, especially if it can be accomplished cheaply. Otherwise follow these guidelines: Short term objectives must be measured at least annually (in some cases monthly or quarterly), medium term objectives must be measured at least every 2 – 3 years, long term measures must be measured at least every 5 years. Note that a baseline data collection is required in all cases to start the process.
For example
Collection Method Baseline Time frame and dates for Personnel/Contractor/ Observation subsequent observations Council Staff
Visitor (street) survey Within 3 mths Annual BID Manager / Research contractor
Member survey Within 3 mths Annual BID Manager / Research contractor
Pedestrian count Within 3 mths Quarterly BID Manager / Research contractor
Business Mix Within 3 mths Annual BID Manager
Crime Statistics Within 3 mths Monthly BID Manager / Police / Statistics NZ
... Within 3 mths ...
You are now ready to begin the detailed design of each KPI. You may need professional assistance with the design aspects of some of the KPIs (e.g., surveys of opinions, attitudes and perceptions), while others might be readily available (e.g. crime statistics). Please contact Council staff for relevant advice.
On the following pages you will find a number of templates you can use to begin the design process for your BID.
STEP SIX
STEP SEVEN

10
For example
KPI No. Prioritised KPIs (from high to low) Collection Method
1 All KPIs with a priority rating of 1 2 Marketing: Visitor perceptions of BID profile (5 questions) Visitor (street) survey3 Security: Member perceptions of security Member survey.. ... ..... All KPIs with a priority rating of 2 ... Marketing: Visitor numbers (pedestrian count). Pedestrian counts... Security: Visitor perceptions (5 questions) Visitor (street) survey... ... ...... All KPIs with a priority rating of 3 ... Marketing (business mix) Categorise range of businesses... Security (crime statistics) Police... ... ...20 ... ...
Costing:
Collection Method Design Check Design Administration Total
Visitor (street) survey Self $ 250.00 $ 500.00 $ 750.00
Member survey Self $ 250.00 Self $ 250.00
Pedestrian counts Self $ 250.00 $ 250.00 $ 250.00
Business Mix Self n/a Self 0.00
Crime Statistics Self n/a Self 0.00
... ... ... ... ...
Total $ 1,250.00

11
TEMPLATE 1: CREATING KPIs
Prioritised Objective Priority of KPI Impact Rating(from high to low) Performance Measure (KPI) (1–3) of KPI (1–5)
1 1 2 3 2 1 2 3 3 1 2 3 4 1 2 3 5 1 2 3 6 1 2 3 7 1 2 3 8 1 2 3 9 1 2 3 10 1 2 3
SECTION
4 Templates

12
TEMPLATE 2: DATA COLLECTION METHOD
KPI No. Prioritised KPIs (from high to low) Collection Method
1 234567891011121314151617181920
TEMPLATE 3: COSTING
Collection Method Design Check Design Administration Total
$
$
$
$
$
$
$
$
$
$
TOTAL $

13
TEMPLATE 4: ACTION PLANNING
Collection Method Baseline Observation Timeframe and dates for subsequent observations Personnel/Contractor/Council Staff
Within 3 mths
Within 3 mths
Within 3 mths
Within 3 mths
Within 3 mths
Within 3 mths
Within 3 mths
Within 3 mths
Within 3 mths
Within 3 mths
SECTION
5 ResourcesATCM. Key Performance Indicators. Available from http://www.atcm.org. Accessed in June 2005.
ATCM. Getting it right – A good practice guide to successful town centre management initiatives. Available from http://www.atcm.org. Accessed in June 2005.
Baker, T. (Ed.) (2002). Key performance indicators manual: A practical guide for the best practice development, implementation and use of KPIs. Crows Nest, NSW: Allen & Unwin.
Harbour, J. L. (1997). Basics of performance measurement. NY: Quality Resources.
Houstoun, L. O. (2003). Business Improvement Districts (2nd ed). Washington, DC: Urban Land Institute in cooperation with the International Downtown Association.
Manukau Town Centre Strategy (2004). Available from http://www.manukau.govt.nz/documents/MTC_strategy.pdf. Accessed June 2005.
The Circle Initiative (2005). Evidence based lessons from the Circle Initiative (1–16). http://www.londonbids.info/infoPoint/publications.asp. Accessed in June 2005.
The Circle Initiative (2001). Performance management & key performance indicators for business improvement districts: Guidance and templates. http://www.londonbids.info/Uploads/Circle/KPIs%20for%20BIDs.pdf. Accessed in June 2005.
Tomorrow’s Manukau (2001). Available from http://www.tomorrowsmanukau.co.nz/index.asp. Accessed in June 2005.

MANUKAU CITY COUNCIL31-33 Wiri Station Rd
Private Bag 76-917Manukau City
www.manukau.govt.nz