012411 informe final_ptrivelli
Post on 21-Oct-2014
972 views
DESCRIPTION
TRANSCRIPT
Urban Structure, Land Markets and Social Housing in Santiago, Chile.
Pablo Trivelli y Cía. Ltda.
January 2010
2
INDEX
1. General characteristics of Santiago and general trends of the urban land market. ..................3 2. Quantitative analysis of land prices in the expansion fronts of Santiago...............................10
2.1. Data on land prices and related variables.......................................................................10 2.2. Econometric Analysis of Land Prices ............................................................................18
a) Descriptive Analysis ......................................................................................................18 b) Regression Analysis .......................................................................................................20 c) Indexes ...........................................................................................................................23
2.3. Elaboration of indexes and multipliers of urban prices..................................................30 a) On the land conversion multiplier. .................................................................................30 b) On the land development multiplier...............................................................................37 c) On the property rights regime multiplier........................................................................43 d) On the land price to income multiplier...........................................................................47
3. Public policy, planning and the land market. .........................................................................49 a) PRIS of 1960 and DL 420 of 1979.................................................................................49 b) Rural land fractioning; Decree 3516 of the Ministry of Agriculture. ............................58 c) PRMS 1994, the reduction of the city limit. ..................................................................59 d) PRMS 1997, expansion to the north...............................................................................63 e) PRMS 2003, new policy directives and the creation of PDUC .....................................65 f) PRMS 2006, expansion to the south. .............................................................................66 g) PRMS 2010, a new attempt to expand the city limit......................................................66
4. Property taxing regulations, an open invitation to speculate with urban land. ......................75 a) Urban property tax. ........................................................................................................75 b) Special property tax on urban vacant land. ....................................................................77 c) Property tax and the expansion of the city limit.............................................................78 d) Taxing of urban land value increments. .........................................................................78
5. Housing policy and socio economic urban segregation .........................................................80 5.1. Housing policies. ............................................................................................................80
a) Early experiences in housing policies in the XX Century. ............................................80 b) Housing policy developments gain momentum in the mid XX Century. ......................82 c) Housing Policy reform, liberalism under a dictatorship. ..............................................83 d) Recent trends in housing policy. ....................................................................................87
5.2. Socio economic urban segregation.................................................................................95 6. Policy recommendations ......................................................................................................105
a) Location subsidy to buy land in more expensive areas of the city...............................109 b) Eliminate exclusionary land use planning regulations. ................................................111 c) Regulatory requirement of including social housing in new developments ................111 d) Incentive of higher densities against inclusionary quotas of social housing................112 e) Strategic application of article 55 of the L.G.U.C. ......................................................113 f) Recuperation of a fraction of land value increments....................................................114 g) Final remarks................................................................................................................116
3
Urban Structure, Land Markets and Social Housing in Santiago, Chile.
1. General characteristics of Santiago and general trends of the urban land market.
Santiago is city of six million people and concentrates 43% of the urban population of the country. The population growth rate has been steadily declining since the 60´s, reaching 2,67% between 1970 and 1982, 1,65% in the next decade and 1,21% between 1992 and 2002. This is due to a general decline in population growth and a reduction in inner migration. The net migratory balance at present is close to cero, which means that the population growth of Santiago is the same as that of the country, approximately 1% per year.
The most important demographic changes at present are the reduction of the family size and the consequent increasing rate of growth of the number of households, and the aging of the population.
The Metropolitan Region, where Santiago is located, contributes with 43% of GDP. The average household income has grown in real terms from 1.107 US$ in 1990 to 1965 UD$ in 2009. This has allowed for an important reduction of poverty in the Metropolitan Region, from 34,5% in 1990 to 10,6% in 2009, and of extreme poverty from 10,13% to 2,7% in the same period. However income distribution has not improved.
From the above figures some urban specialists conclude that the demand for land will be driven primarily by the increase of income rather than by the increase of population or households.
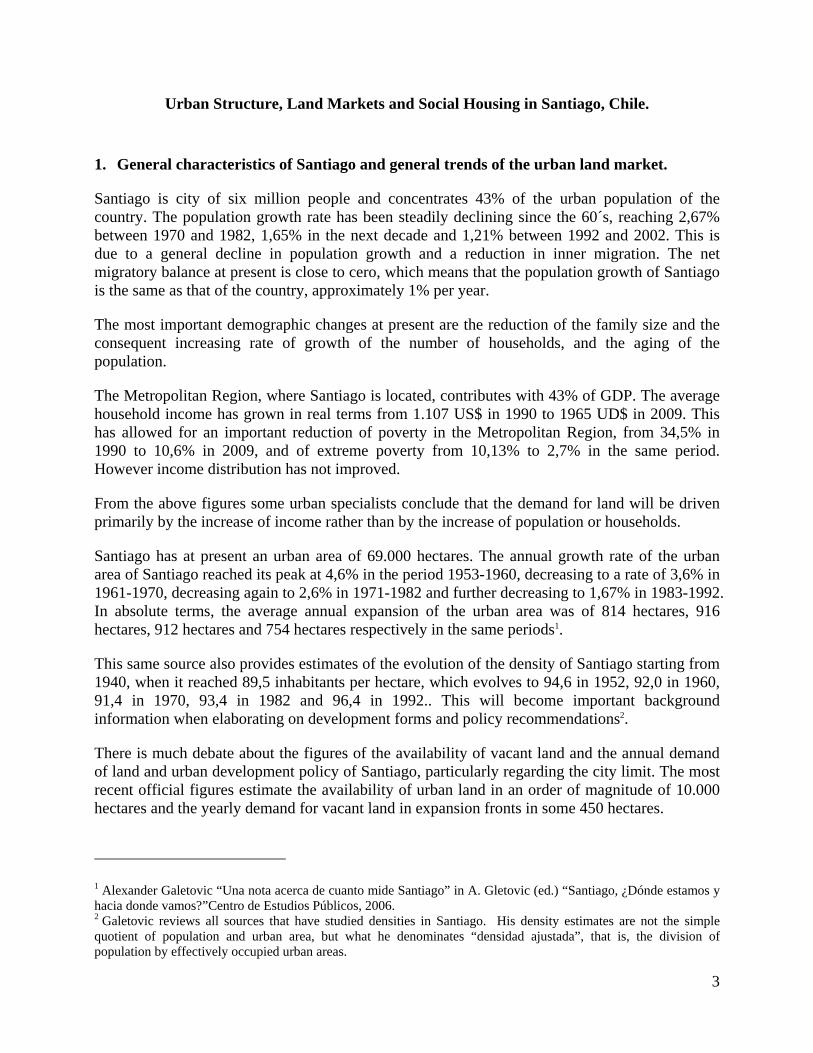
Santiago has at present an urban area of 69.000 hectares. The annual growth rate of the urban area of Santiago reached its peak at 4,6% in the period 1953-1960, decreasing to a rate of 3,6% in 1961-1970, decreasing again to 2,6% in 1971-1982 and further decreasing to 1,67% in 1983-1992. In absolute terms, the average annual expansion of the urban area was of 814 hectares, 916 hectares, 912 hectares and 754 hectares respectively in the same periods1.
This same source also provides estimates of the evolution of the density of Santiago starting from 1940, when it reached 89,5 inhabitants per hectare, which evolves to 94,6 in 1952, 92,0 in 1960, 91,4 in 1970, 93,4 in 1982 and 96,4 in 1992.. This will become important background information when elaborating on development forms and policy recommendations2.
There is much debate about the figures of the availability of vacant land and the annual demand of land and urban development policy of Santiago, particularly regarding the city limit. The most recent official figures estimate the availability of urban land in an order of magnitude of 10.000 hectares and the yearly demand for vacant land in expansion fronts in some 450 hectares.
1 Alexander Galetovic “Una nota acerca de cuanto mide Santiago” in A. Gletovic (ed.) “Santiago, ¿Dónde estamos y hacia donde vamos?”Centro de Estudios Públicos, 2006. 2 Galetovic reviews all sources that have studied densities in Santiago. His density estimates are not the simple quotient of population and urban area, but what he denominates “densidad ajustada”, that is, the division of population by effectively occupied urban areas.
4
The coverage of basic services (water, sewerage, electricity) in urban areas reaches almost 100%, and the same with road pavement. Education and health services have a complete coverage, although with marked differences in quality. There are differences in municipal income and investment capacity varies largely among municipalities within the city as can be seen in the following figures.
Santiago occupies top places in Latin American city rankings, and high places in world rankings. High positions are based on variables such as low crime rate, low perception of corruption, ease for doing business, legal and political framework, financial flow and flow of people and commodities, knowledge creation and flow of information, coverage of services, etc. On the less attractive side is the high level of air pollution, the scarce availability of green space, bad distribution of income and inequality, limited cultural activity, etc.
5
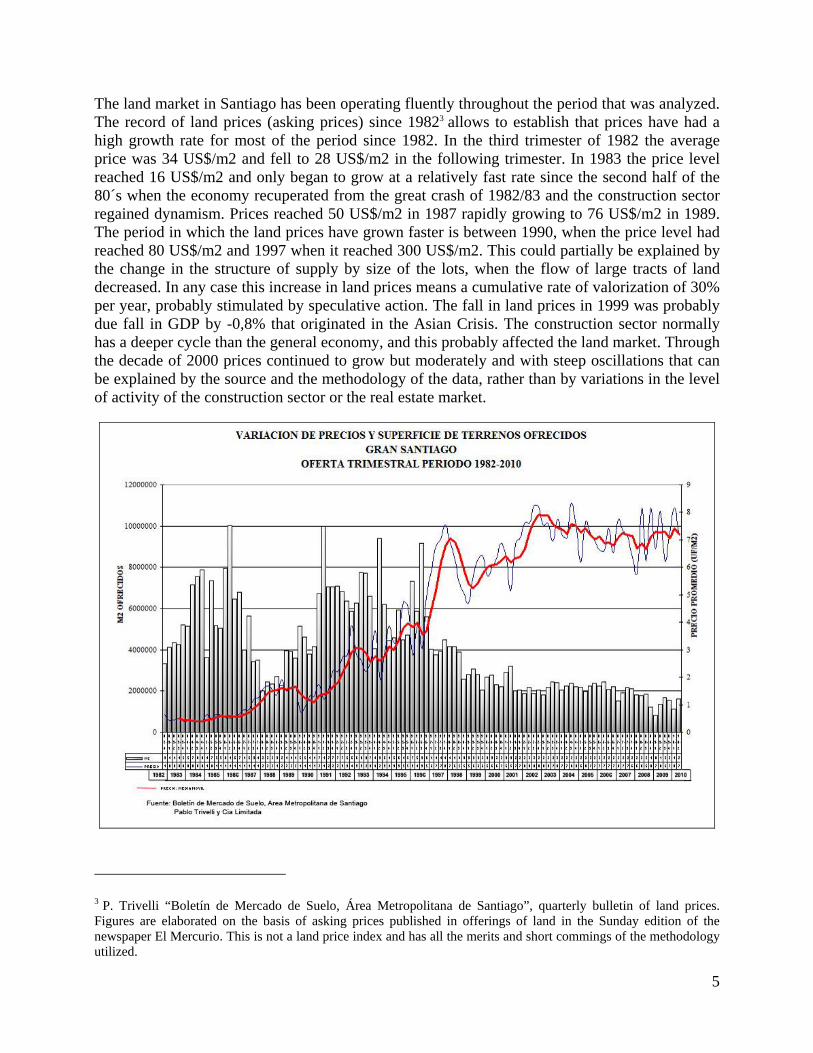
The land market in Santiago has been operating fluently throughout the period that was analyzed. The record of land prices (asking prices) since 19823 allows to establish that prices have had a high growth rate for most of the period since 1982. In the third trimester of 1982 the average price was 34 US$/m2 and fell to 28 US$/m2 in the following trimester. In 1983 the price level reached 16 US$/m2 and only began to grow at a relatively fast rate since the second half of the 80´s when the economy recuperated from the great crash of 1982/83 and the construction sector regained dynamism. Prices reached 50 US$/m2 in 1987 rapidly growing to 76 US$/m2 in 1989. The period in which the land prices have grown faster is between 1990, when the price level had reached 80 US$/m2 and 1997 when it reached 300 US$/m2. This could partially be explained by the change in the structure of supply by size of the lots, when the flow of large tracts of land decreased. In any case this increase in land prices means a cumulative rate of valorization of 30% per year, probably stimulated by speculative action. The fall in land prices in 1999 was probably due fall in GDP by -0,8% that originated in the Asian Crisis. The construction sector normally has a deeper cycle than the general economy, and this probably affected the land market. Through the decade of 2000 prices continued to grow but moderately and with steep oscillations that can be explained by the source and the methodology of the data, rather than by variations in the level of activity of the construction sector or the real estate market.
3 P. Trivelli “Boletín de Mercado de Suelo, Área Metropolitana de Santiago”, quarterly bulletin of land prices. Figures are elaborated on the basis of asking prices published in offerings of land in the Sunday edition of the newspaper El Mercurio. This is not a land price index and has all the merits and short commings of the methodology utilized.
6
VARIACION DE PRECIOS Y SUPERFICIE DE TERRENOS OFRECIDOS ENTRE 10.001 Y 50.000 M2 GRAN SANTIAGO OFERTA TRIMESTRAL PERIODO 1982-2010
0
500000
1000000
1500000
2000000
250000082
-4
83-1
83-2
83-3
83-4
84-1
84-2
84-3
84-4
85-1
85-2
85-3
85-4
86-1
86-2
86-3
86-4
87-1
87-2
87-3
87-4
88-1
88-2
88-3
88-4
89-1
89-2
89-3
89-4
90-1
90-2
90-3
90-4
91-1
91-2
91-3
91-4
92-1
92-2
92-3
92-4
93-1
93-2
93-3
93-4
94-1
94-2
94-3
94-4
95-1
95-2
95-3
95-4
96-1
96-2
96-3
96-4
97-1
97-2
97-3
97-4
98-1
98-2
98-3
98-4
99-1
99-2
99-3
99-4
00-1
00-2
00-3
00-4
01-1
01-2
01-3
01-4
02-1
02-2
02-3
02-4
03-1
03-2
03-3
03-4
04-1
04-2
04-3
04-4
05-1
05-2
05-3
05-4
06-1
06-2
06-3
06-4
07-1
07-2
07-3
07-4
08-1
08-2
08-3
08-4
09-1
09-2
09-3
09-4
10-1
10-2
M2
OFR
EC
IDO
S
0
1
2
3
4
5
6
7
8
PRE
CIO
PR
OM
ED
IO (U
F/M
2)
PRECIO : MEDIA MOVIL
VARIACION DE PRECIOS Y SUPERFICIE DE TERRENOS OFRECIDOS CON MAS DE 50.000 M2 GRAN SANTIAGO
OFERTA TRIMESTRAL PERIODO 1982-2010
0
1000000
2000000
3000000
4000000
5000000
6000000
7000000
82-4
83-1
83-2
83-3
83-4
84-1
84-2
84-3
84-4
85-1
85-2
85-3
85-4
86-1
86-2
86-3
86-4
87-1
87-2
87-3
87-4
88-1
88-2
88-3
88-4
89-1
89-2
89-3
89-4
90-1
90-2
90-3
90-4
91-1
91-2
91-3
91-4
92-1
92-2
92-3
92-4
93-1
93-2
93-3
93-4
94-1
94-2
94-3
94-4
95-1
95-2
95-3
95-4
96-1
96-2
96-3
96-4
97-1
97-2
97-3
97-4
98-1
98-2
98-3
98-4
99-1
99-2
99-3
99-4
00-1
00-2
00-3
00-4
01-1
01-2
01-3
01-4
02-1
02-2
02-3
02-4
03-1
03-2
03-3
03-4
04-1
04-2
04-3
04-4
05-1
05-2
05-3
05-4
06-1
06-2
06-3
06-4
07-1
07-2
07-3
07-4
08-1
08-2
08-3
08-4
09-1
09-2
09-3
09-4
10-1
10-2
M2
OFR
EC
IDO
S
0
1
2
3
4
5
6
PRE
CIO
PR
OM
ED
IO (U
F/M
2)
PRECIO : MEDIA MOVIL
7
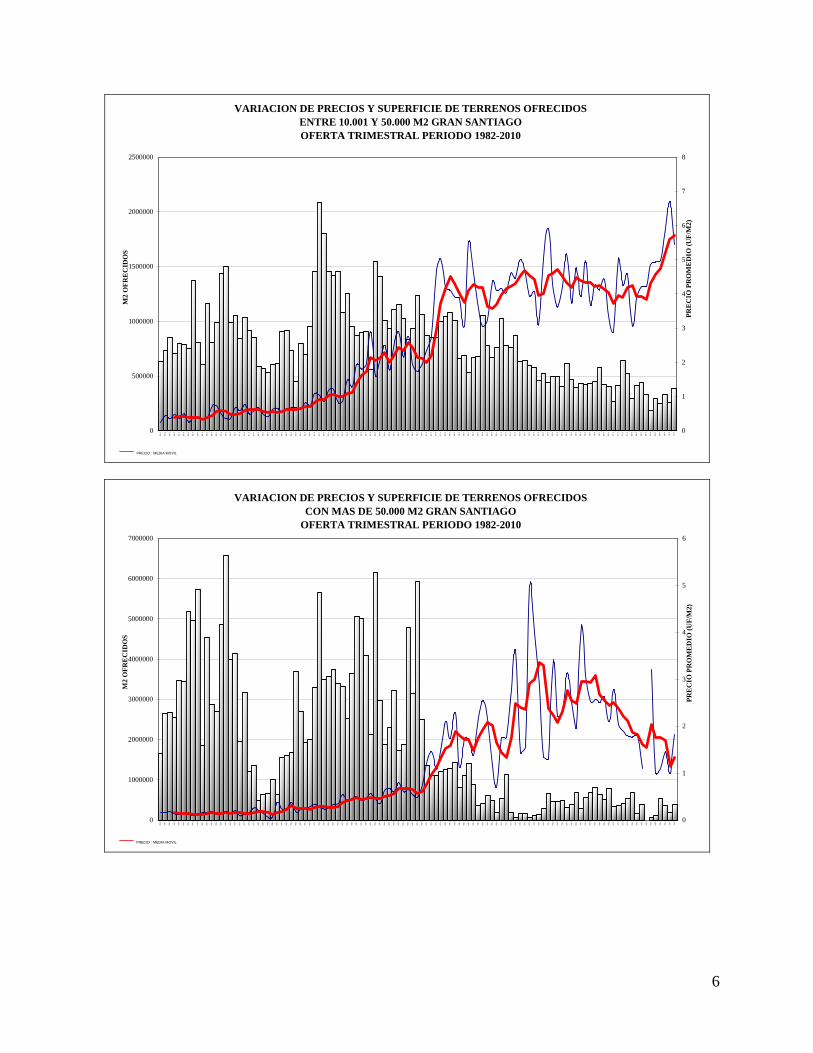
The trend and the oscillations of the average price of land is greatly conditioned by the oscillations in the supply of large tracts of land. The following figures allow to back up some general comments.
Parcels of more than 5 hectares did constitute more than 50% of the supply in Santiago until the 90´s. Later on it decreased notably, oscillating on a downward trend to become a sporadic fact in recent years. Land prices in this submarket reach 6 US$/m2 in 1982 and start growing in 1987 from 10 US$/m2 when the economy and the construction sector gain dynamism, reaching a price of 30 US$/m2 in 1996. From that year onwards the trend in the increase of land prices accelerates, reaching 100 US$/m2 in 2000.
Lots with an area between 1 and 5 hectares have a less oscillating performance in the flow of supply, with peak figures in the late 80´s and a gradual decreasing trend reaching at present a supply of in the order of 40 to 50 hectares per trimester. Land prices of these lots start at 10 US$/m2 in 1982, growing up to 25 US$/m2 in 1989, duplicating its price by 1993 and reaching 80 US$/m2 in 1996. Prices have reached 100 US$/m2 in an oscillating path up to now.
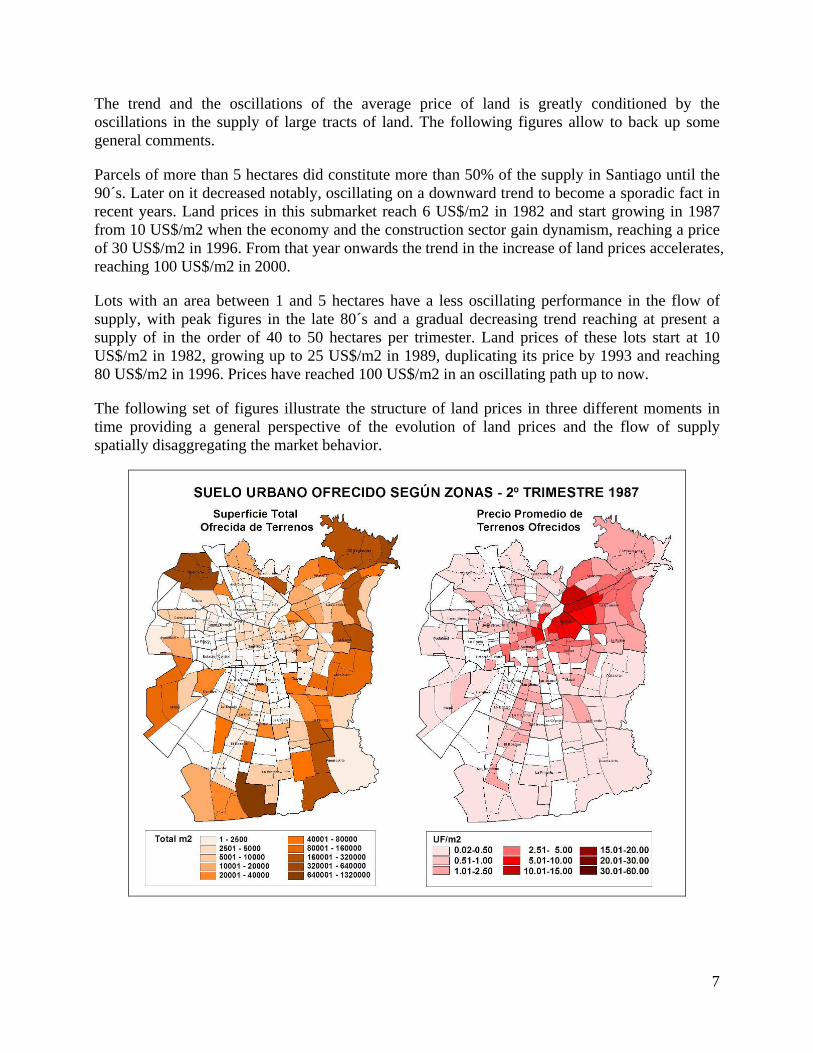
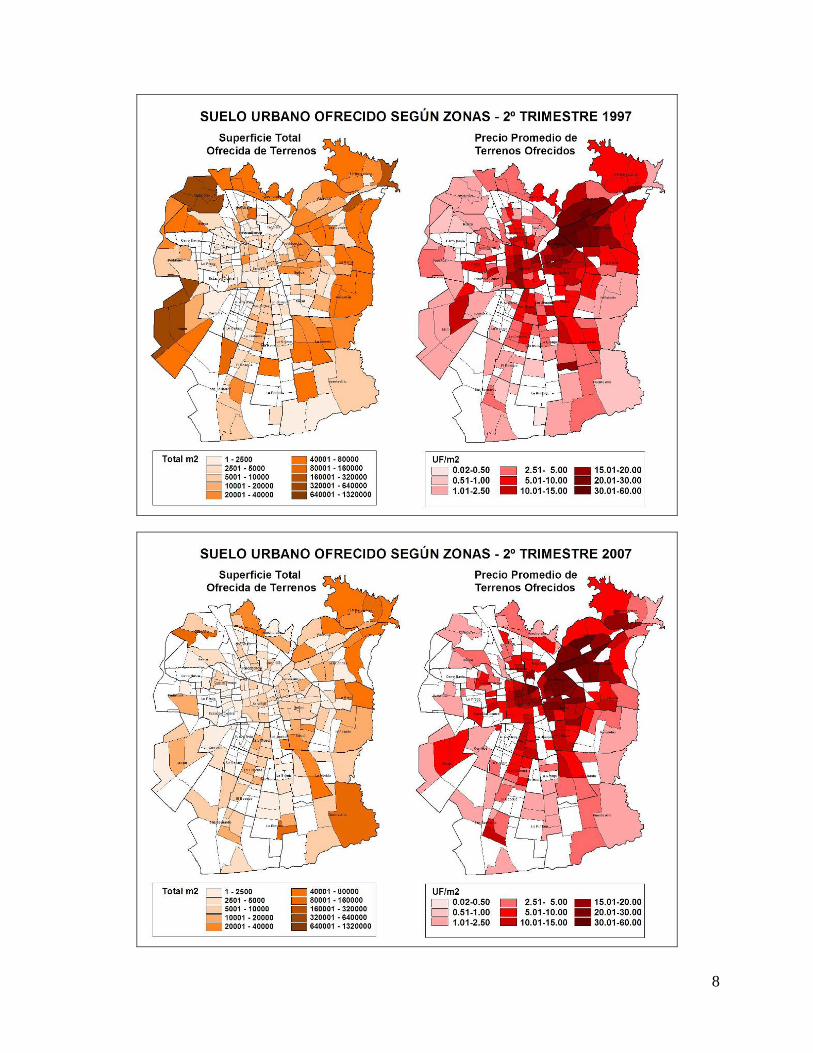
The following set of figures illustrate the structure of land prices in three different moments in time providing a general perspective of the evolution of land prices and the flow of supply spatially disaggregating the market behavior.
8
9
Let it only be said that the greatest increments in absolute terms take place in the northeast of Santiago where the higher income households predominantly locate, particularly in the inner parts of the municipalities of Las Condes and Vitacura, and in Providencia, but also in the outskirts to the northeast. Not surprisingly, also in the city center and other subcentral areas where densification processes have been taking place. This is an important phenomenon considering that at present 75% of new housing is apartments and only 25% is houses.
The highest increases in land prices in relative terms or percentages, take place on the city borders, particularly in areas that have historically concentrated the development of social housing but that later on have been developing housing for households with higher level of income. This is particularly the case in areas of the municipalities of the southern border of the city, San Bernardo and Puente Alto, but also in the north, in areas of Huechuraba and Quilicura.
The changes in the structure of land prices will be partially explained later on in what regards to the central questions of this research project.
The flow of supply of land to the market has exceeded by far the needs of the market, particularly in the period going from 1982 until the mid 90´s. In the second half of the 90´s the flow of supply of land decreased gradually, stabilizing in the order of 200 hectares per trimester through most part of the decade of 2000. In later part of the decade the flow of supply has decreased to figures in the order of 150 to 200 hectares per trimester. This is greatly conditioned by the decrease in the flow of large tracts of land to the market.
10
2. Quantitative analysis of land prices in the expansion fronts of Santiago.
This chapter of the report can be clearly divided into three sections. First, a brief report on the sources and the collection of data on land prices. Second, regression analysis. Third, on the estimation of ratios and multipliers.
2.1. Data on land prices and related variables
To comply with research requirements as stated in Annex 1 of the call for research proposals to provide information on rural land prices and urban land with different levels of development (legal and irregular), an exhaustive review of effective land transactions and lands for sale in the study area, corresponding to the northern, western and southern front of development of Santiago, was carried out for an 8 month period (October 2009 to May 2010). The land transactions were collected from the Official Property Registry (Conservador de Bienes Raices), that officially keep the property deeds and transactions of property in Chile. The second source of data corresponds to lands offered for sale published on the main newspaper in Chile, El Mercurio, which have been systematically collected in Boletín del Mercado de Suelo del Gran Santiago4.
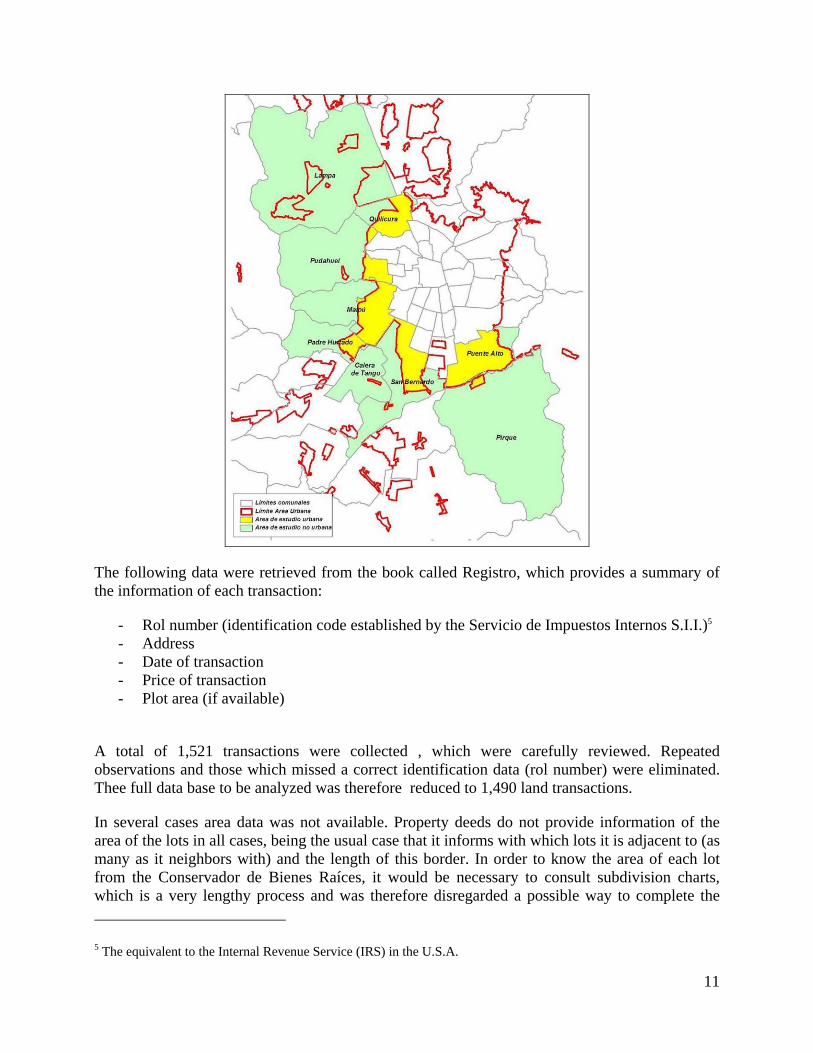
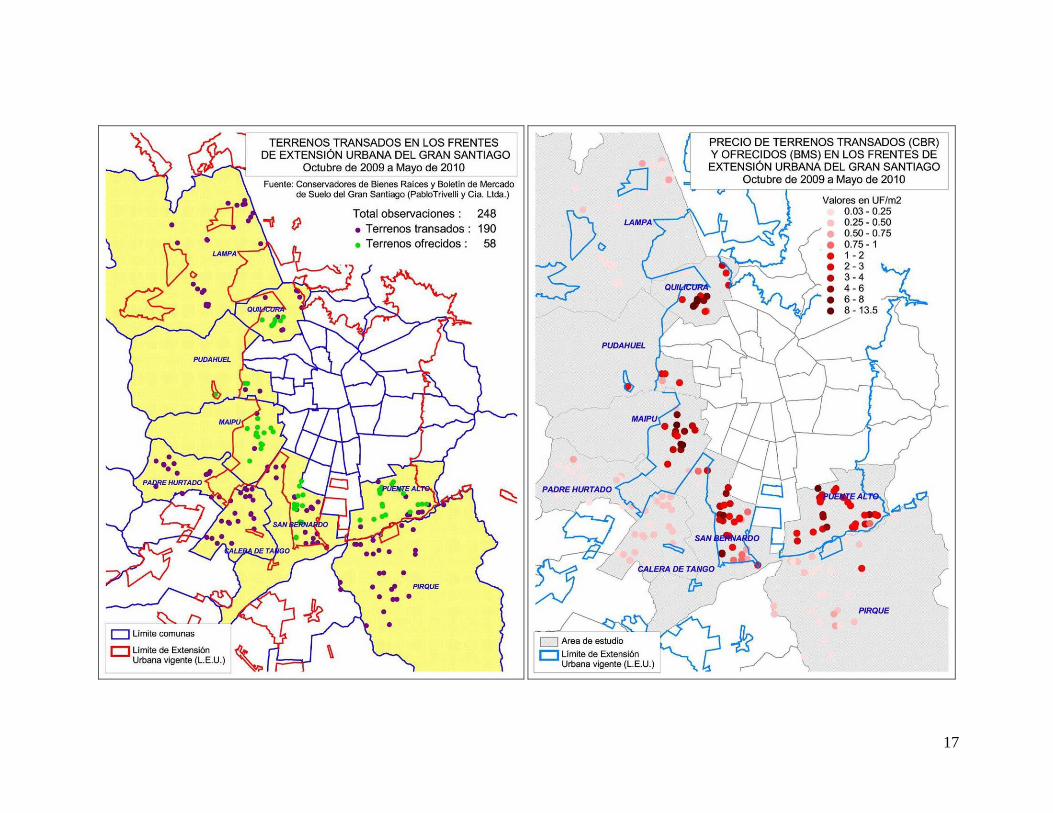
The study area covers 9 municipalities, corresponding to 5 expansion fronts of Santiago at the northwest, west and south of the metropolitan area, as can be seen in the following figure. At the northeast and east of the city the urban development is limited by mountains.
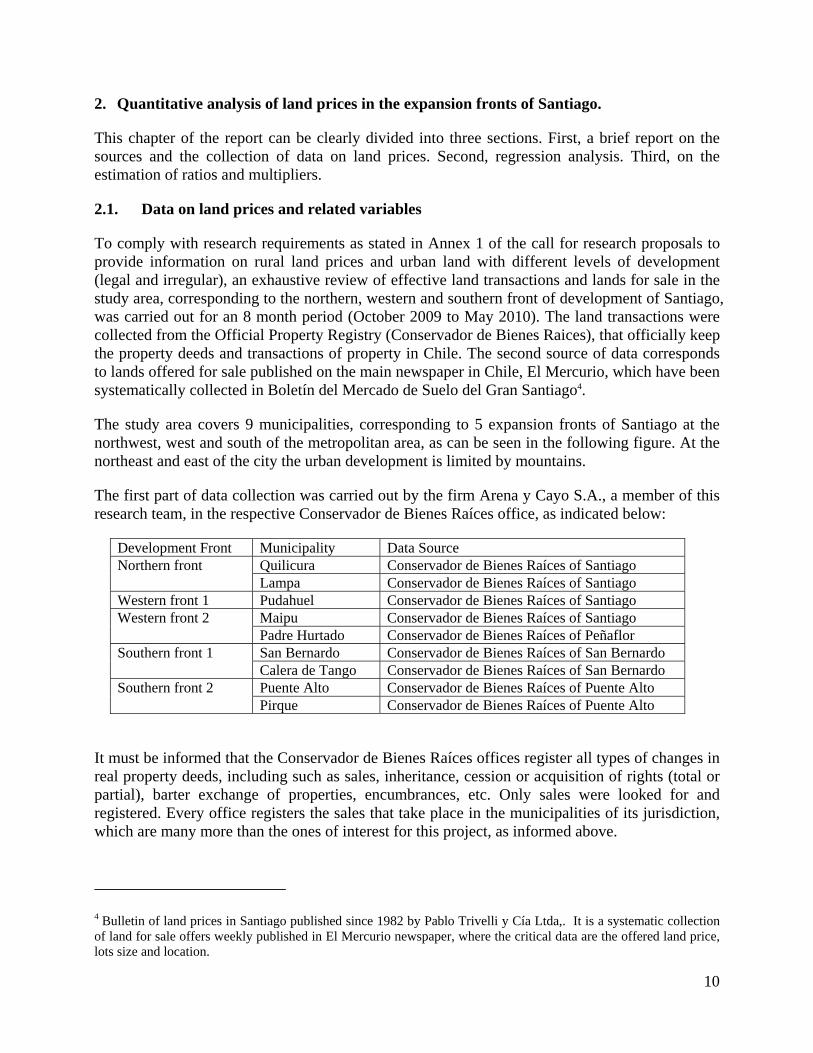
The first part of data collection was carried out by the firm Arena y Cayo S.A., a member of this research team, in the respective Conservador de Bienes Raíces office, as indicated below:
Development Front Municipality Data Source Quilicura Conservador de Bienes Raíces of Santiago Northern front Lampa Conservador de Bienes Raíces of Santiago
Western front 1 Pudahuel Conservador de Bienes Raíces of Santiago Maipu Conservador de Bienes Raíces of Santiago Western front 2 Padre Hurtado Conservador de Bienes Raíces of Peñaflor San Bernardo Conservador de Bienes Raíces of San Bernardo Southern front 1 Calera de Tango Conservador de Bienes Raíces of San Bernardo Puente Alto Conservador de Bienes Raíces of Puente Alto Southern front 2 Pirque Conservador de Bienes Raíces of Puente Alto
It must be informed that the Conservador de Bienes Raíces offices register all types of changes in real property deeds, including such as sales, inheritance, cession or acquisition of rights (total or partial), barter exchange of properties, encumbrances, etc. Only sales were looked for and registered. Every office registers the sales that take place in the municipalities of its jurisdiction, which are many more than the ones of interest for this project, as informed above.
4 Bulletin of land prices in Santiago published since 1982 by Pablo Trivelli y Cía Ltda,. It is a systematic collection of land for sale offers weekly published in El Mercurio newspaper, where the critical data are the offered land price, lots size and location.
11
The following data were retrieved from the book called Registro, which provides a summary of the information of each transaction:
- Rol number (identification code established by the Servicio de Impuestos Internos S.I.I.)5 - Address - Date of transaction - Price of transaction - Plot area (if available)
A total of 1,521 transactions were collected , which were carefully reviewed. Repeated observations and those which missed a correct identification data (rol number) were eliminated. Thee full data base to be analyzed was therefore reduced to 1,490 land transactions.
In several cases area data was not available. Property deeds do not provide information of the area of the lots in all cases, being the usual case that it informs with which lots it is adjacent to (as many as it neighbors with) and the length of this border. In order to know the area of each lot from the Conservador de Bienes Raíces, it would be necessary to consult subdivision charts, which is a very lengthy process and was therefore disregarded a possible way to complete the 5 The equivalent to the Internal Revenue Service (IRS) in the U.S.A.
12
missing information. . An alternative to obtain the missing data on area of each plot and other useful information such as land use and existence of buildings, the data base of transactions was linked to the property data base of the Servicio de Impuestos Internos (SII) by the Rol number. For rural areas, also was consulted a property data base of the Ministry of Agriculture (CIREN)6 . Observations that did not match correctly were eliminated (188 cases), reducing the data base to 1.302 observations
The next step was to localize each observation in a GIS map, which contained the following geographical information obtained from the indicated sources:
- Roads (MINVU) - Hydrography (MINVU) - Contour lines (MINVU) - Metropolitan Urban Extension Area limits from PRMS 7 (MINVU) - Metropolitan Area Zoning from PRMS (MINVU) - Communal and Census Districts limits (INE)
Each point location was verified with the Google Earth image, verifying also the existence of constructed elements. The location is exact in most cases and an approximation in the case of some rural areas. Cases with ambiguous address or location reference were left to be corroborated on field work.
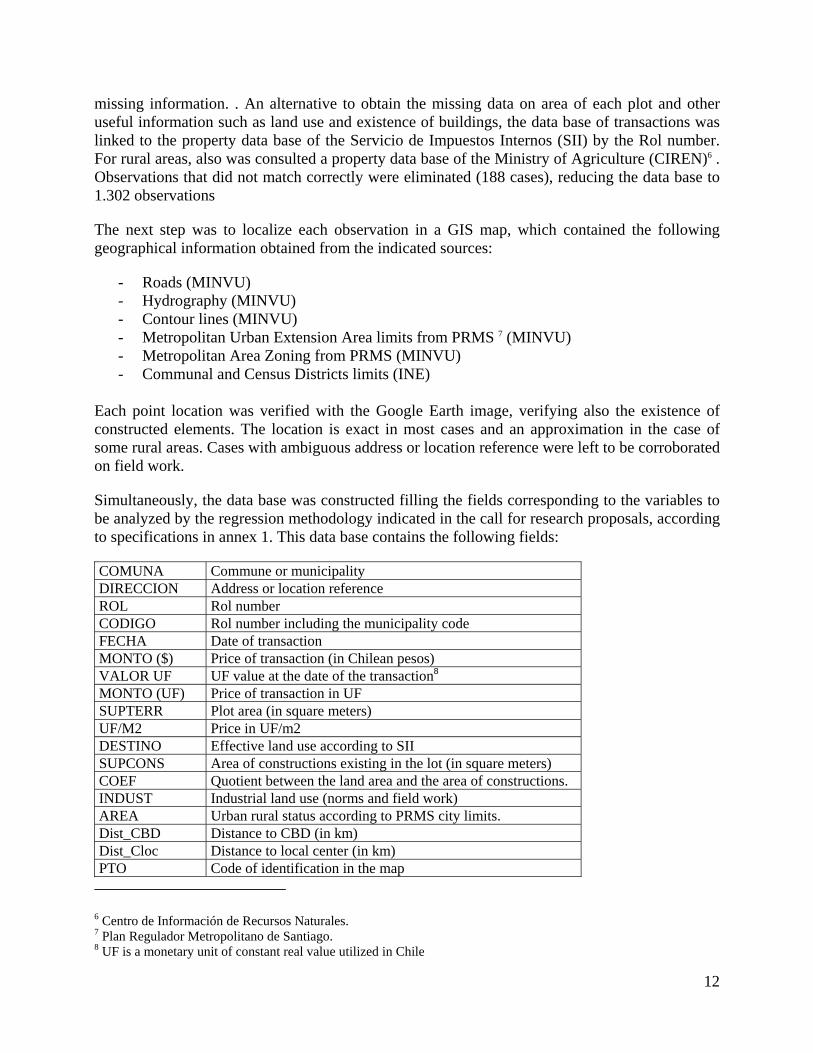
Simultaneously, the data base was constructed filling the fields corresponding to the variables to be analyzed by the regression methodology indicated in the call for research proposals, according to specifications in annex 1. This data base contains the following fields:
COMUNA Commune or municipality DIRECCION Address or location reference ROL Rol number CODIGO Rol number including the municipality code FECHA Date of transaction MONTO ($) Price of transaction (in Chilean pesos) VALOR UF UF value at the date of the transaction8 MONTO (UF) Price of transaction in UF SUPTERR Plot area (in square meters) UF/M2 Price in UF/m2 DESTINO Effective land use according to SII SUPCONS Area of constructions existing in the lot (in square meters) COEF Quotient between the land area and the area of constructions. INDUST Industrial land use (norms and field work) AREA Urban rural status according to PRMS city limits. Dist_CBD Distance to CBD (in km) Dist_Cloc Distance to local center (in km) PTO Code of identification in the map
6 Centro de Información de Recursos Naturales. 7 Plan Regulador Metropolitano de Santiago. 8 UF is a monetary unit of constant real value utilized in Chile
13
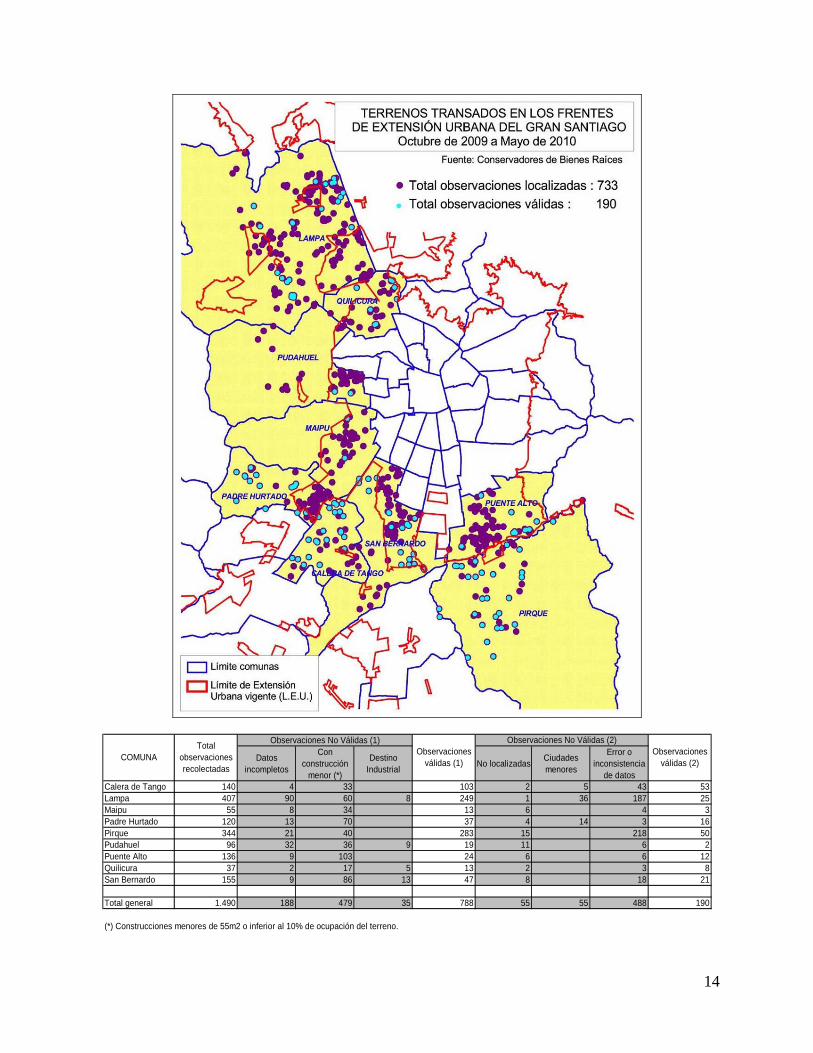
Basic selection criteria were defined in order to obtain the definite valid observations.
Cases with existing constructions according to the SII property base were eliminated, except for those that do not affect the land price (constructed area of less than 55m2 or equivalent to less than 10% of the plot area). A total of 479 were eliminated for this reason. Also those observations corresponding to industrial land use were eliminated (35 cases), obtaining a total of 788 valid observations at a first stage.
At a second stage of analysis other specific criteria was applied. Cases that could not be localized were definitely eliminated. Transactions in urban area of small cities in mostly rural municipalities were also eliminated (55 cases), considering that they are not comparable with urban cases inside the Great Santiago area and its land price behavior pattern. The data base was reduced to 733 observations. Field work was done visiting each and every one observation.
Other cases presented evident data inconsistency or errors, most of them corresponding to transactions in rural areas, where the plot area data is apparently incorrect (in cases that was obtained from other sources, such as SII or CIREN), or the transacted price is not a “real” price (transactions of many individual small parcels from a property legally subdivided but not executed). All of these cases were verified at field.
For each observation the following specific data were collected at field work.
CONSOL Urban consolidation or development level ELECTRIC Electricity availability RED AGUA Urban pipe water availability APR Rural potable water availability ALCANT Public sewerage availability FOSA SEPT Septic drain availability PAVIMENTO Paved road availability TRANS PUB Public transport at less than 500 meter distance
Finally, the number of valid observations was reduced to 190 cases. The following table and figure shows the result of the full process.
14
Datos incompletos
Con construcción
menor (*)
Destino Industrial No localizadas Ciudades
menores
Error o inconsistencia
de datosCalera de Tango 140 4 33 103 2 5 43 53Lampa 407 90 60 8 249 1 36 187 25Maipu 55 8 34 13 6 4 3Padre Hurtado 120 13 70 37 4 14 3 16Pirque 344 21 40 283 15 218 50Pudahuel 96 32 36 9 19 11 6 2Puente Alto 136 9 103 24 6 6 12Quilicura 37 2 17 5 13 2 3 8San Bernardo 155 9 86 13 47 8 18 21
Total general 1.490 188 479 35 788 55 55 488 190
(*) Construcciones menores de 55m2 o inferior al 10% de ocupación del terreno.
COMUNA
Observaciones No Válidas (2)Observaciones No Válidas (1)Observaciones
válidas (2)
Total observaciones recolectadas
Observaciones válidas (1)
15
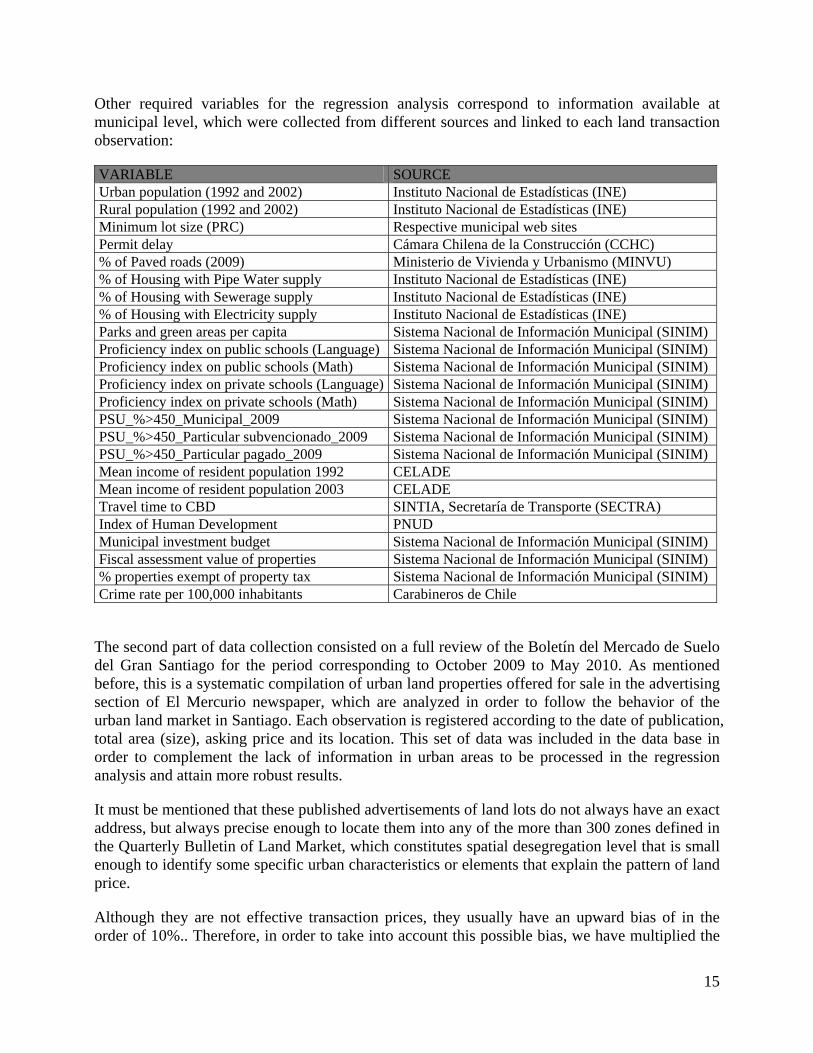
Other required variables for the regression analysis correspond to information available at municipal level, which were collected from different sources and linked to each land transaction observation:
VARIABLE SOURCE Urban population (1992 and 2002) Instituto Nacional de Estadísticas (INE) Rural population (1992 and 2002) Instituto Nacional de Estadísticas (INE) Minimum lot size (PRC) Respective municipal web sites Permit delay Cámara Chilena de la Construcción (CCHC) % of Paved roads (2009) Ministerio de Vivienda y Urbanismo (MINVU) % of Housing with Pipe Water supply Instituto Nacional de Estadísticas (INE) % of Housing with Sewerage supply Instituto Nacional de Estadísticas (INE) % of Housing with Electricity supply Instituto Nacional de Estadísticas (INE) Parks and green areas per capita Sistema Nacional de Información Municipal (SINIM) Proficiency index on public schools (Language) Sistema Nacional de Información Municipal (SINIM) Proficiency index on public schools (Math) Sistema Nacional de Información Municipal (SINIM) Proficiency index on private schools (Language) Sistema Nacional de Información Municipal (SINIM) Proficiency index on private schools (Math) Sistema Nacional de Información Municipal (SINIM) PSU_%>450_Municipal_2009 Sistema Nacional de Información Municipal (SINIM) PSU_%>450_Particular subvencionado_2009 Sistema Nacional de Información Municipal (SINIM) PSU_%>450_Particular pagado_2009 Sistema Nacional de Información Municipal (SINIM) Mean income of resident population 1992 CELADE Mean income of resident population 2003 CELADE Travel time to CBD SINTIA, Secretaría de Transporte (SECTRA) Index of Human Development PNUD Municipal investment budget Sistema Nacional de Información Municipal (SINIM) Fiscal assessment value of properties Sistema Nacional de Información Municipal (SINIM) % properties exempt of property tax Sistema Nacional de Información Municipal (SINIM) Crime rate per 100,000 inhabitants Carabineros de Chile
The second part of data collection consisted on a full review of the Boletín del Mercado de Suelo del Gran Santiago for the period corresponding to October 2009 to May 2010. As mentioned before, this is a systematic compilation of urban land properties offered for sale in the advertising section of El Mercurio newspaper, which are analyzed in order to follow the behavior of the urban land market in Santiago. Each observation is registered according to the date of publication, total area (size), asking price and its location. This set of data was included in the data base in order to complement the lack of information in urban areas to be processed in the regression analysis and attain more robust results.
It must be mentioned that these published advertisements of land lots do not always have an exact address, but always precise enough to locate them into any of the more than 300 zones defined in the Quarterly Bulletin of Land Market, which constitutes spatial desegregation level that is small enough to identify some specific urban characteristics or elements that explain the pattern of land price.
Although they are not effective transaction prices, they usually have an upward bias of in the order of 10%.. Therefore, in order to take into account this possible bias, we have multiplied the
16
asking price by a factor 0.9, since it is usual that the final transaction price is more or less the 90% of the original offered price. This fact wouldn’t be so important because we know that if we have measurement error in the dependent variable it does not bias the estimated parameters.
As very specific data are necessary for the task required here, as exact location or availability of urban infrastructure so they can be compared with transaction data from CBR’s, only observations with certainty information was considered for this purpose. The same data base structure with variables applied to land transactions was elaborated for these new data. In this case, 58 observations were considered valid data.
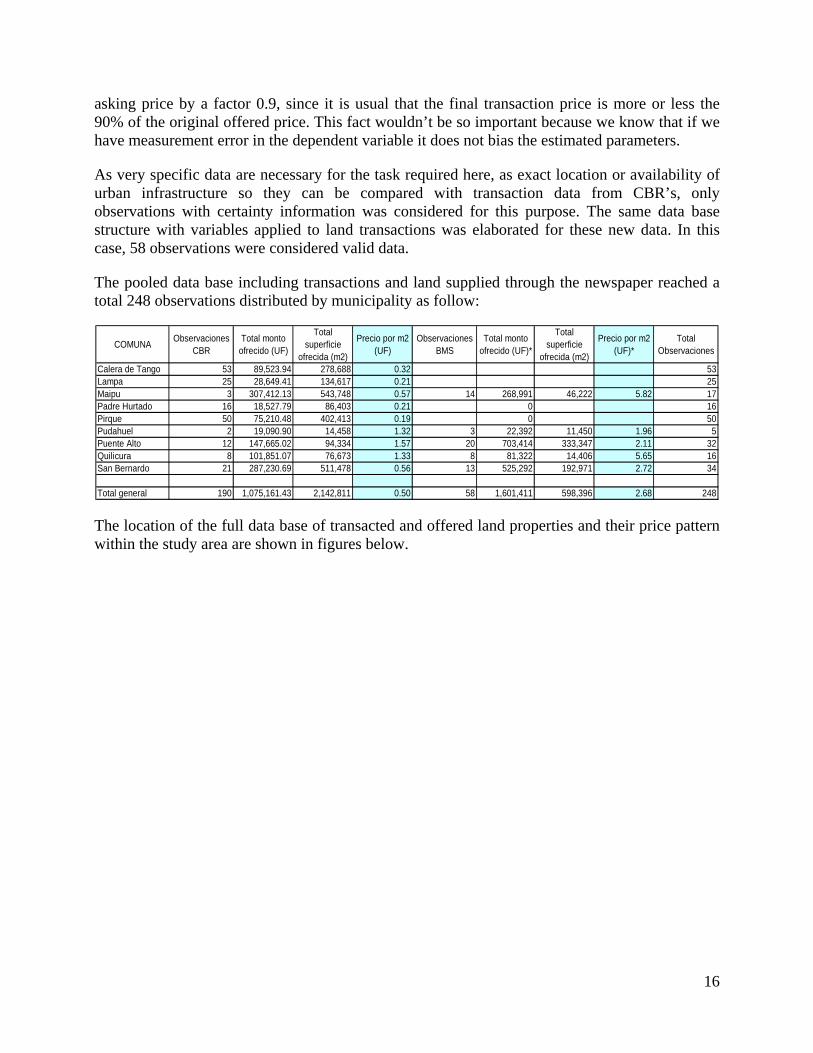
The pooled data base including transactions and land supplied through the newspaper reached a total 248 observations distributed by municipality as follow:
COMUNA Observaciones CBR
Total monto ofrecido (UF)
Total superficie
ofrecida (m2)
Precio por m2 (UF)
Observaciones BMS
Total monto ofrecido (UF)*
Total superficie
ofrecida (m2)
Precio por m2 (UF)*
Total Observaciones
Calera de Tango 53 89,523.94 278,688 0.32 53Lampa 25 28,649.41 134,617 0.21 25Maipu 3 307,412.13 543,748 0.57 14 268,991 46,222 5.82 17Padre Hurtado 16 18,527.79 86,403 0.21 0 16Pirque 50 75,210.48 402,413 0.19 0 50Pudahuel 2 19,090.90 14,458 1.32 3 22,392 11,450 1.96 5Puente Alto 12 147,665.02 94,334 1.57 20 703,414 333,347 2.11 32Quilicura 8 101,851.07 76,673 1.33 8 81,322 14,406 5.65 16San Bernardo 21 287,230.69 511,478 0.56 13 525,292 192,971 2.72 34
Total general 190 1,075,161.43 2,142,811 0.50 58 1,601,411 598,396 2.68 248
The location of the full data base of transacted and offered land properties and their price pattern within the study area are shown in figures below.
17

18
2.2. Econometric Analysis of Land Prices
In this section we elaborate an econometric analysis that tries to answer the questions related to measures of land market outcomes (This part follow the methodology proposed by IDB). Furthermore another important objective of this part is to explain what are the principal factors explaining land prices and considering these conclusion elaborate on policy measures and their implementation. For carrying out this goal, the research study will divide the work in two sections. In the first one, we carry out regressions to try to find the most important variables explaining land prices strictly following the methodological guidelines provided by IDB. In the second section we take the results from regressions and create indexes of regulatory regime, infrastructure development and social and economic development to run regression with these and find the parameters.
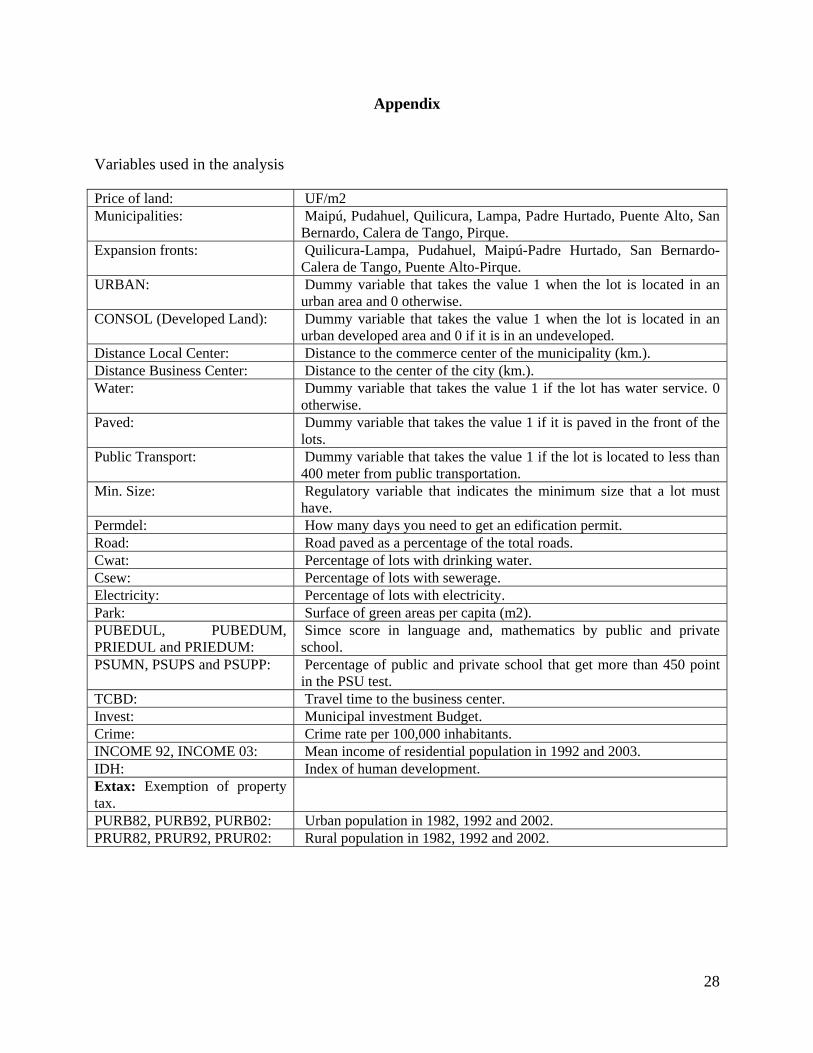
a) Descriptive Analysis The data used in this research can be divided into four groups. The first one is about regulatory regime and contains the following variables: minimum lot size and permits delay. The second one regards infrastructure development and include paved roads as a percentage of total roads, coverage of water, sewerage, electricity, parks and green areas, SIMCE9 score in mathematics, numbers of crime each 100,000 inhabitants and the municipal investment per capita. The third group has the following social and development variables: average income in 2003, human development index and the percentage of lots exempt of property tax. The last variables are controls for our regressions, these are: the area where the lot is located (urban or rural), if the lot is a service land (developed land) area or raw urban area (undeveloped), availability of potable water service, availability of public transport less than 400 meters away, a variable that indicates if in the front of the lot the street is paved and the growth of urban population between 2002 and 1992.
The complete list of variables computed is listed as an appendix. Those that appear in that list and are not mentioned above were discarded because of problems of multicollinearity.
Before working with regressions some data characteristics will be presented. It is a very important starting point, because it gives a first look about the main characteristic of the variables.
In the next graph (figure 1) the kernel density of the land price (UF for m2)10 is shown. This variable will be the variable that we will try to explain in the regressions.
We can observe that it does not seem to be a normal distribution. In this context, we can notice that there are outliers in the sample and possibly they are responsible for this behavior.
To better understand the data we present in the next table (table 1) one of the principal descriptive statistic for the data.
9 SIMSE scores measures proficiency in basic education. 10 UF or Unidad de Fomento is a constant value monetary unit commonly utilized in Chile. 1 UF = US$42,15

19
Figure 1. Kernel density of land price.
Table 1. Main descriptive statistic. Land Price
UF/M2Road Water Sewer. Elect. Park
Distance Business Center
Distance Local
CenterUrban Developed
Land Paved Public Trans.
Mean 1.4 87.7 91.1 89.6 98.7 3.7 21.8 7.4 40% 80% 79% 68% Median 0.4 92.7 87.6 85.4 98.5 2.5 21.7 7.2 Max. 13.5 98.7 99.8 99.3 99.7 10.2 35.0 19.8 Min. 0.0 64.4 79.5 70.1 97.1 0.7 9.6 0.2 Std. Dev. 2.2 12.1 7.9 8.9 0.8 3.4 6.0 4.8
These are some of the key variables that describe our sample. Analyzing the table, we can see that the land price average is close to 1.4 UF/M2 with a maximum of 13.5 UF/M2. This fact implies a big standard deviation and reinforces the behavior found in the Kernel. Another important point to comprehend the base, is to get the percentages of some characteristic in the data. In the four last columns (this variables only shows the first row because these are dummies that take the value 1 if the lot has the characteristic and 0 otherwise) we see that 40% of the sample is located in an urban area (the other possibility is rural), the percentage of lots inside urban city limit that belong to a developed area land is 80% (variable Developed Land), 79% of the streets in front of lots are paved (variable Paved) and 68% has public transport less than 400 meters away (variable Public Trans).
We can observe in the table that a big proportion of lots have water (variable Water) and sewerage (variable Sewer.), almost all have electricity (variable Elect.) and the major part of the observations the road is paved (variable Road). We can observe that in average these lots are far from the center of the city (variable Distance Business Center) and some are not so close to the local center (variable Distance Local Center), that is, the distance to the commerce municipality center.
These last issues are on, one side, very auspicious regarding the minimum conditions for people living in these zones, but on other side, don’t make it possible to make a strict comparison between municipalities because the values that adopt the variables are so similar between them.
20
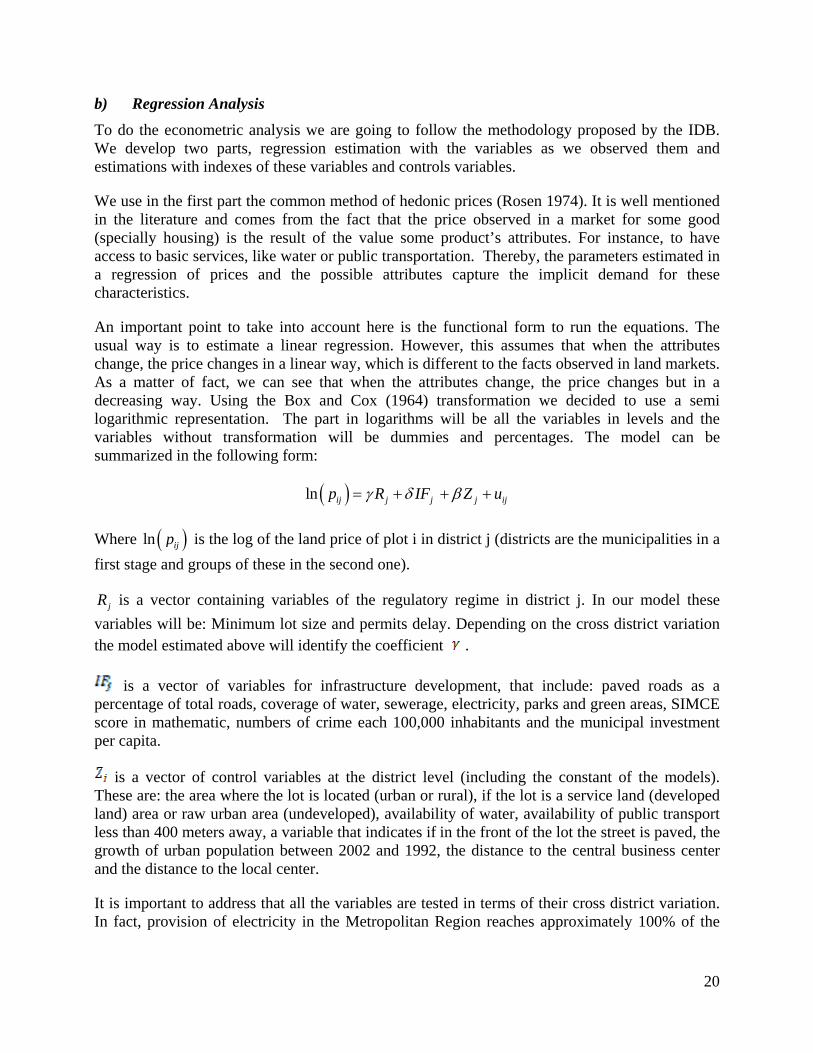
b) Regression Analysis To do the econometric analysis we are going to follow the methodology proposed by the IDB. We develop two parts, regression estimation with the variables as we observed them and estimations with indexes of these variables and controls variables.
We use in the first part the common method of hedonic prices (Rosen 1974). It is well mentioned in the literature and comes from the fact that the price observed in a market for some good (specially housing) is the result of the value some product’s attributes. For instance, to have access to basic services, like water or public transportation. Thereby, the parameters estimated in a regression of prices and the possible attributes capture the implicit demand for these characteristics.
An important point to take into account here is the functional form to run the equations. The usual way is to estimate a linear regression. However, this assumes that when the attributes change, the price changes in a linear way, which is different to the facts observed in land markets. As a matter of fact, we can see that when the attributes change, the price changes but in a decreasing way. Using the Box and Cox (1964) transformation we decided to use a semi logarithmic representation. The part in logarithms will be all the variables in levels and the variables without transformation will be dummies and percentages. The model can be summarized in the following form:
( )ln ij j j j ijp R IF Z uγ δ β= + + +
Where ( )ln ijp is the log of the land price of plot i in district j (districts are the municipalities in a first stage and groups of these in the second one).
jR is a vector containing variables of the regulatory regime in district j. In our model these variables will be: Minimum lot size and permits delay. Depending on the cross district variation the model estimated above will identify the coefficient .
is a vector of variables for infrastructure development, that include: paved roads as a percentage of total roads, coverage of water, sewerage, electricity, parks and green areas, SIMCE score in mathematic, numbers of crime each 100,000 inhabitants and the municipal investment per capita.
is a vector of control variables at the district level (including the constant of the models). These are: the area where the lot is located (urban or rural), if the lot is a service land (developed land) area or raw urban area (undeveloped), availability of water, availability of public transport less than 400 meters away, a variable that indicates if in the front of the lot the street is paved, the growth of urban population between 2002 and 1992, the distance to the central business center and the distance to the local center.
It is important to address that all the variables are tested in terms of their cross district variation. In fact, provision of electricity in the Metropolitan Region reaches approximately 100% of the
21
household within the Region. This is clearly a variable that will not be taken into account when explaining price variation between plots in the sample.
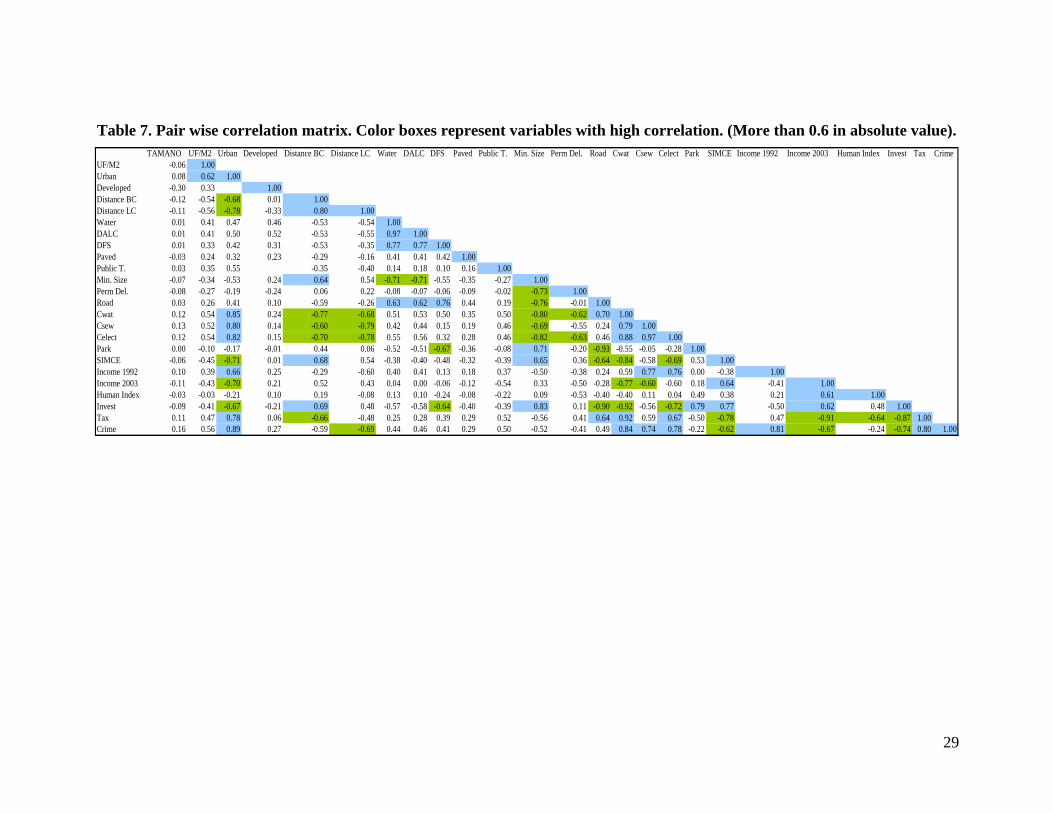
Before presenting the estimations it is important to explain another problem we have faced, which is the big correlation between some variables (The matrix correlation is presented in the annex, table 7). For example, there is a very high correlation between area (urban or rural) and sewerage and maybe both explain similar things. The principal problem here is the incapacity of the programs to estimate with these variables together in the same regression (almost perfect multicollinearity). One strategy here is to estimate regressions for groups of variables and controls but not for all of them (dropping the other off) and another strategy to avoid this complication is to construct indexes with groups of variables in each category and estimate an equation with them and controls. This second strategy (second part) will be done in the last part of this report and for this we will develop the regulatory regime index, the infrastructure index and a third index that we will call social and economic development index. This last index is built with the following variables: the average income of household in 2003, an index of human development and the percentage of lots exempt from property taxes.
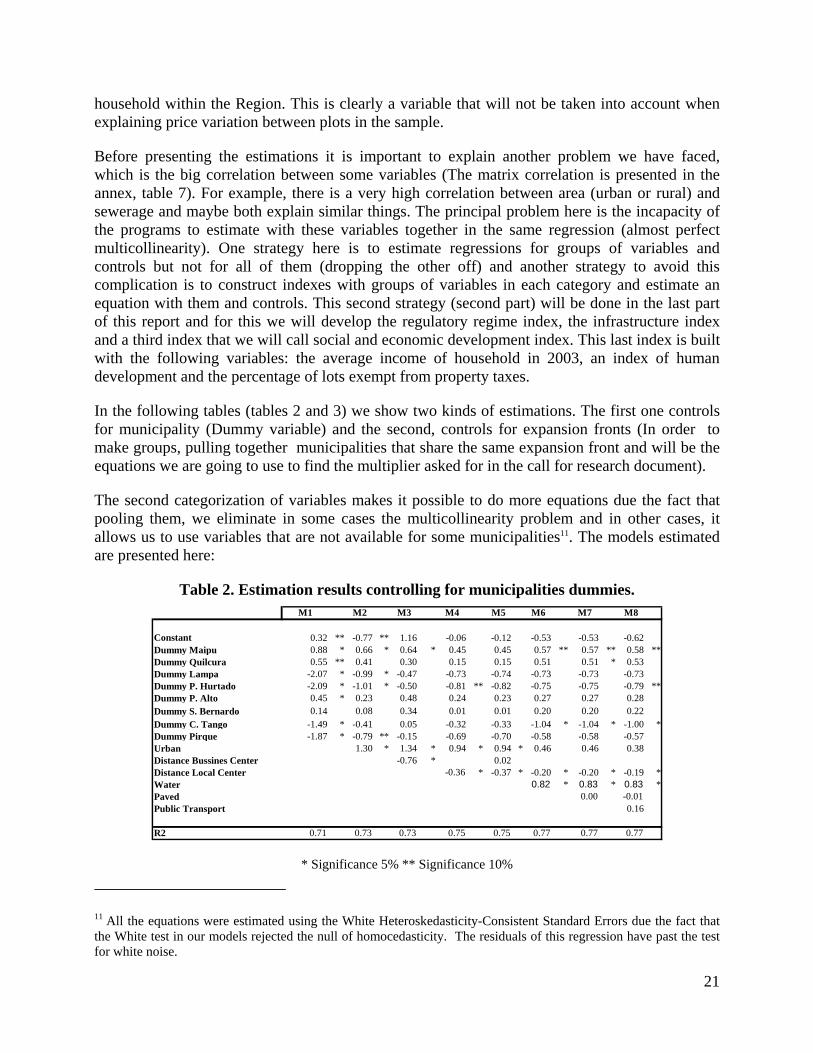
In the following tables (tables 2 and 3) we show two kinds of estimations. The first one controls for municipality (Dummy variable) and the second, controls for expansion fronts (In order to make groups, pulling together municipalities that share the same expansion front and will be the equations we are going to use to find the multiplier asked for in the call for research document).
The second categorization of variables makes it possible to do more equations due the fact that pooling them, we eliminate in some cases the multicollinearity problem and in other cases, it allows us to use variables that are not available for some municipalities11. The models estimated are presented here:
Table 2. Estimation results controlling for municipalities dummies. M1 M2 M3 M4 M5 M6 M7 M8
Constant 0.32 ** -0.77 ** 1.16 -0.06 -0.12 -0.53 -0.53 -0.62Dummy Maipu 0.88 * 0.66 * 0.64 * 0.45 0.45 0.57 ** 0.57 ** 0.58 **Dummy Quilcura 0.55 ** 0.41 0.30 0.15 0.15 0.51 0.51 * 0.53Dummy Lampa -2.07 * -0.99 * -0.47 -0.73 -0.74 -0.73 -0.73 -0.73Dummy P. Hurtado -2.09 * -1.01 * -0.50 -0.81 ** -0.82 -0.75 -0.75 -0.79 **Dummy P. Alto 0.45 * 0.23 0.48 0.24 0.23 0.27 0.27 0.28Dummy S. Bernardo 0.14 0.08 0.34 0.01 0.01 0.20 0.20 0.22Dummy C. Tango -1.49 * -0.41 0.05 -0.32 -0.33 -1.04 * -1.04 * -1.00 *Dummy Pirque -1.87 * -0.79 ** -0.15 -0.69 -0.70 -0.58 -0.58 -0.57Urban 1.30 * 1.34 * 0.94 * 0.94 * 0.46 0.46 0.38Distance Bussines Center -0.76 * 0.02Distance Local Center -0.36 * -0.37 * -0.20 * -0.20 * -0.19 *Water 0.82 * 0.83 * 0.83 *Paved 0.00 -0.01Public Transport 0.16
R2 0.71 0.73 0.73 0.75 0.75 0.77 0.77 0.77
* Significance 5% ** Significance 10%
11 All the equations were estimated using the White Heteroskedasticity-Consistent Standard Errors due the fact that the White test in our models rejected the null of homocedasticity. The residuals of this regression have past the test for white noise.
22
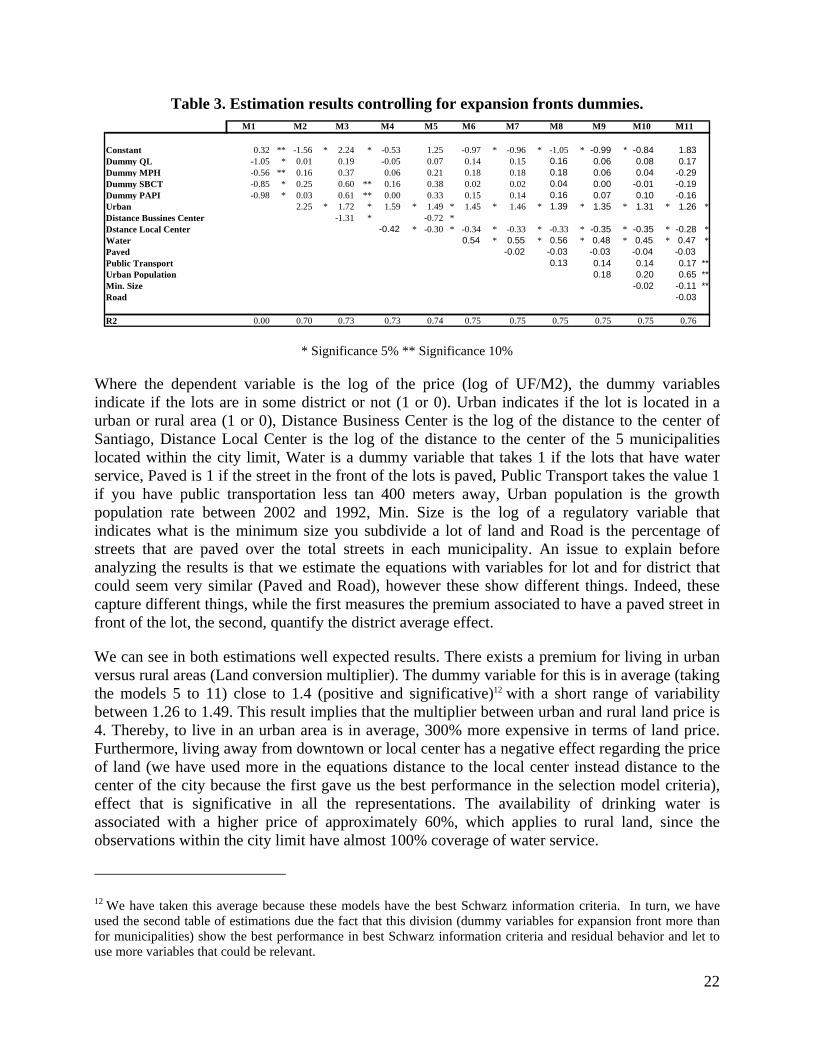
Table 3. Estimation results controlling for expansion fronts dummies. M1 M2 M3 M4 M5 M6 M7 M8 M9 M10 M11
Constant 0.32 ** -1.56 * 2.24 * -0.53 1.25 -0.97 * -0.96 * -1.05 * -0.99 * -0.84 1.83Dummy QL -1.05 * 0.01 0.19 -0.05 0.07 0.14 0.15 0.16 0.06 0.08 0.17Dummy MPH -0.56 ** 0.16 0.37 0.06 0.21 0.18 0.18 0.18 0.06 0.04 -0.29Dummy SBCT -0.85 * 0.25 0.60 ** 0.16 0.38 0.02 0.02 0.04 0.00 -0.01 -0.19Dummy PAPI -0.98 * 0.03 0.61 ** 0.00 0.33 0.15 0.14 0.16 0.07 0.10 -0.16Urban 2.25 * 1.72 * 1.59 * 1.49 * 1.45 * 1.46 * 1.39 * 1.35 * 1.31 * 1.26 *Distance Bussines Center -1.31 * -0.72 *Dstance Local Center -0.42 * -0.30 * -0.34 * -0.33 * -0.33 * -0.35 * -0.35 * -0.28 *Water 0.54 * 0.55 * 0.56 * 0.48 * 0.45 * 0.47 *Paved -0.02 -0.03 -0.03 -0.04 -0.03Public Transport 0.13 0.14 0.14 0.17 **Urban Population 0.18 0.20 0.65 **Min. Size -0.02 -0.11 **Road -0.03
R2 0.00 0.70 0.73 0.73 0.74 0.75 0.75 0.75 0.75 0.75 0.76
* Significance 5% ** Significance 10%
Where the dependent variable is the log of the price (log of UF/M2), the dummy variables indicate if the lots are in some district or not (1 or 0). Urban indicates if the lot is located in a urban or rural area (1 or 0), Distance Business Center is the log of the distance to the center of Santiago, Distance Local Center is the log of the distance to the center of the 5 municipalities located within the city limit, Water is a dummy variable that takes 1 if the lots that have water service, Paved is 1 if the street in the front of the lots is paved, Public Transport takes the value 1 if you have public transportation less tan 400 meters away, Urban population is the growth population rate between 2002 and 1992, Min. Size is the log of a regulatory variable that indicates what is the minimum size you subdivide a lot of land and Road is the percentage of streets that are paved over the total streets in each municipality. An issue to explain before analyzing the results is that we estimate the equations with variables for lot and for district that could seem very similar (Paved and Road), however these show different things. Indeed, these capture different things, while the first measures the premium associated to have a paved street in front of the lot, the second, quantify the district average effect.
We can see in both estimations well expected results. There exists a premium for living in urban versus rural areas (Land conversion multiplier). The dummy variable for this is in average (taking the models 5 to 11) close to 1.4 (positive and significative)12 with a short range of variability between 1.26 to 1.49. This result implies that the multiplier between urban and rural land price is 4. Thereby, to live in an urban area is in average, 300% more expensive in terms of land price. Furthermore, living away from downtown or local center has a negative effect regarding the price of land (we have used more in the equations distance to the local center instead distance to the center of the city because the first gave us the best performance in the selection model criteria), effect that is significative in all the representations. The availability of drinking water is associated with a higher price of approximately 60%, which applies to rural land, since the observations within the city limit have almost 100% coverage of water service.
12 We have taken this average because these models have the best Schwarz information criteria. In turn, we have used the second table of estimations due the fact that this division (dummy variables for expansion front more than for municipalities) show the best performance in best Schwarz information criteria and residual behavior and let to use more variables that could be relevant.
23
Moreover, from the estimations we can extract an amazing point. The variables Paved, Public Transport and Road are not meaningful explaining the land price. It is something difficult to understand because they are a really important characteristic in a place. However, it could be an issue that comes from the sample and is the fact that in these municipalities almost all the lots have those conditions. This implies that those variables don’t have the necessary variance to explain price differences. Another hypothesis could be that in these models we have omitted relevant variables and the estimated parameters are biased. This could be supported in the fact that in our last model (M11) public transport is positive and significative (as we had expected), urban population is positive and significative, indicating that the increase in demand has a positive impact on he price land and that minimum allowable size of land subdivision is negative and significative.
We now must answer an important question that is not possible to see in the above estimations, ¿What is the premium between developed land (serviced land) price and undeveloped land (raw urban land) price? (Land development multiplier). To answer this, we create a new equation with the variable consol (1 for developed land and 0 otherwise). This variable will measure the premium associated for living in a serviced land area. An important point here is that for this estimation we use only the sample of urban lots and for this reason we do not utilize the variable urban (This estimation is only for urban land). We find the following results (we use the following model because this shows the best performance considering Schwarz information criteria and the reason to work with few variables is due that multicollinearity problem):
Table 4. Estimation results including serviced land. Constant -2.01Developed Land 0.49 *Dstance Local Center -0.28 *Water 0.46 *Paved 0.22Min. Size 0.41
R2 0.38
* Significance 5% ** Significance 10%
As we can see (transforming the estimated parameter to get the multiplier) the ratio is approximately 1.6 (as before we have used this model because it has the best information criteria). In our sample it implies that in average the extra price charge for developing urban areas is US$ 33 m2.
c) Indexes In this section we work with the second methodology to estimate the equations, it is run the regressions with indexes for the variables used before and some controls (the dependent variable will be the log of the price). This strategy could be summarized in the following equation:
( )ln ij j j j j ijp R IF SED Z uγ δ α β= + + + +
24
jR is the regulatory regime index for district j. jIF is the infrastructure development index,
jSED is the social and economic development index and jZ is a vector of control variables at the district level (including the constant of the models). These controls are: the area where the lot is located (urban or rural), the availability of water service, the availability of public transport less than 400 meters away, a variable that indicates if in the front of the lot the street is paved and the log of the distance to the local center.
To run these regressions we need to create the indexes using the results from estimated equations. The specific method use here is to estimate an equation and after this, take the parameters and use these to weight the average characteristic (Paredes 2008, Izquierdo 2004) from each expansion front (we have normalized the indexes to 100).
The variables used to create each index are: For regulatory regime, the log of minimum size (we have doped off the variable permit delay because multicollinearity). For infrastructure we used paved roads as a percentage of total roads, coverage of water, sewerage, electricity, parks and green areas, SIMCE score in mathematic, numbers of crime each 100,000 inhabitants and the municipal investment per capita. For the social and economic development index we utilized the average income of household in 2003, an index of human development and the percentage of lots exempt of property taxes (For the creation of all the indexes we used the same controls that were mentioned above). The estimation is in the semi-log representation with log of all the variables except dummies and percentages.
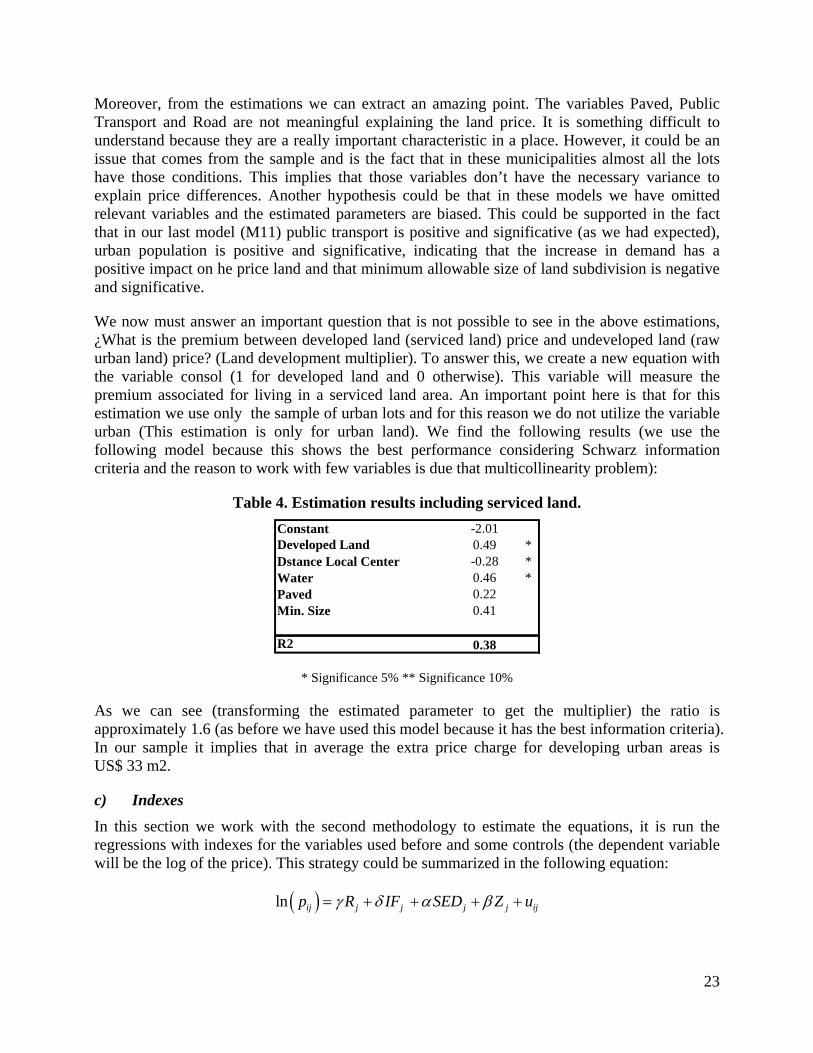
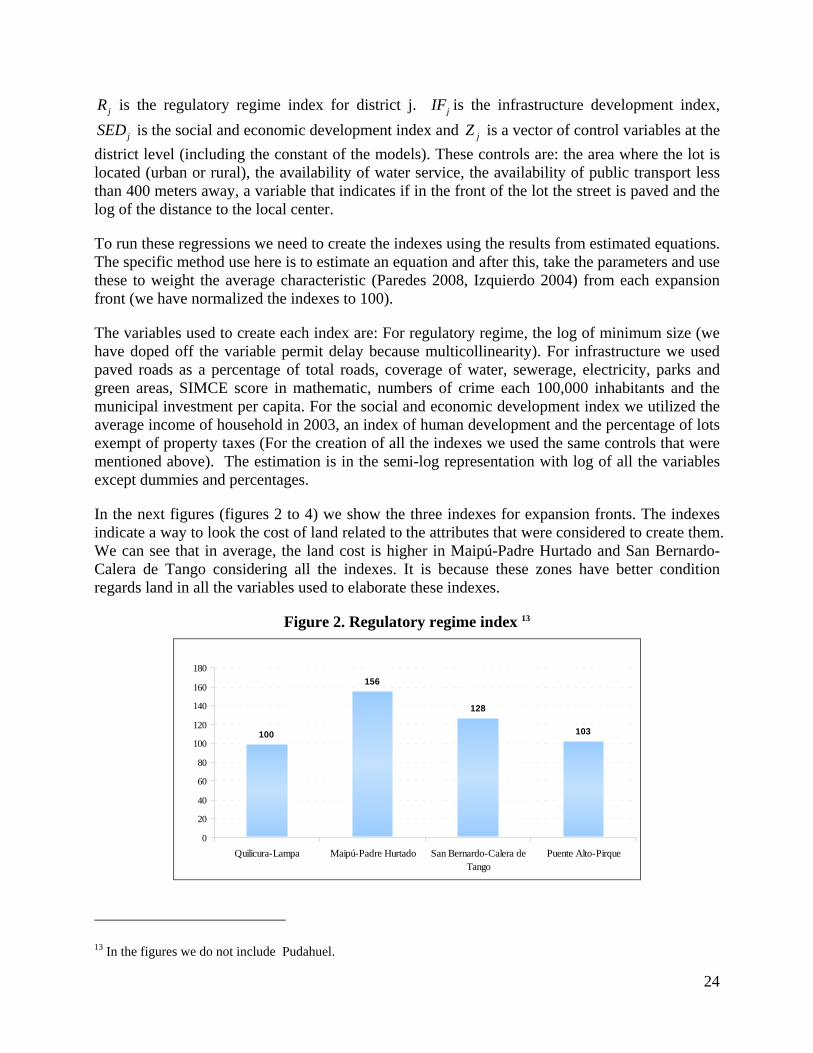
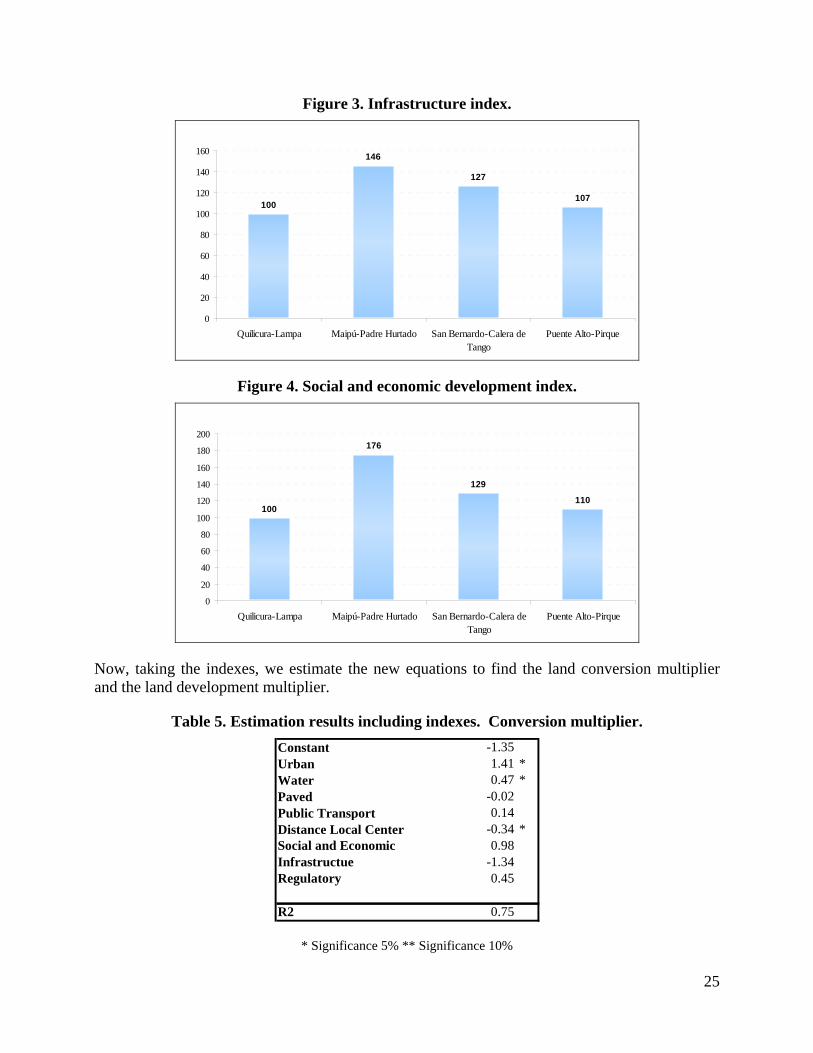
In the next figures (figures 2 to 4) we show the three indexes for expansion fronts. The indexes indicate a way to look the cost of land related to the attributes that were considered to create them. We can see that in average, the land cost is higher in Maipú-Padre Hurtado and San Bernardo-Calera de Tango considering all the indexes. It is because these zones have better condition regards land in all the variables used to elaborate these indexes.
Figure 2. Regulatory regime index 13
100
156
128
103
0
20
40
60
80
100
120
140
160
180
Quilicura-Lampa Maipú-Padre Hurtado San Bernardo-Calera deTango
Puente Alto-Pirque
13 In the figures we do not include Pudahuel.
25
Figure 3. Infrastructure index.
100
146
127
107
0
20
40
60
80
100
120
140
160
Quilicura-Lampa Maipú-Padre Hurtado San Bernardo-Calera deTango
Puente Alto-Pirque
Figure 4. Social and economic development index.
100
176
129
110
0
20
40
60
80
100
120
140
160
180
200
Quilicura-Lampa Maipú-Padre Hurtado San Bernardo-Calera deTango
Puente Alto-Pirque
Now, taking the indexes, we estimate the new equations to find the land conversion multiplier and the land development multiplier.
Table 5. Estimation results including indexes. Conversion multiplier. Constant -1.35Urban 1.41 *Water 0.47 *Paved -0.02Public Transport 0.14Distance Local Center -0.34 *Social and Economic 0.98Infrastructue -1.34Regulatory 0.45
R2 0.75
* Significance 5% ** Significance 10%
26
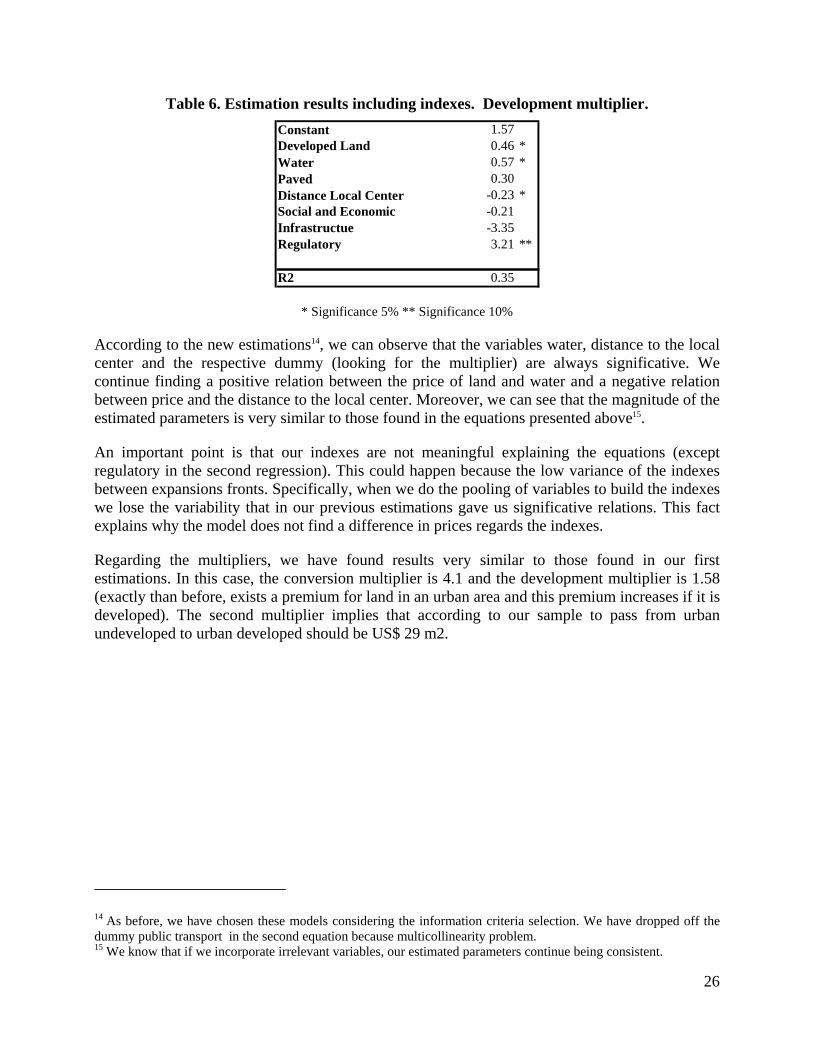
Table 6. Estimation results including indexes. Development multiplier. Constant 1.57Developed Land 0.46 *Water 0.57 *Paved 0.30Distance Local Center -0.23 *Social and Economic -0.21Infrastructue -3.35Regulatory 3.21 **
R2 0.35
* Significance 5% ** Significance 10%
According to the new estimations14, we can observe that the variables water, distance to the local center and the respective dummy (looking for the multiplier) are always significative. We continue finding a positive relation between the price of land and water and a negative relation between price and the distance to the local center. Moreover, we can see that the magnitude of the estimated parameters is very similar to those found in the equations presented above15.
An important point is that our indexes are not meaningful explaining the equations (except regulatory in the second regression). This could happen because the low variance of the indexes between expansions fronts. Specifically, when we do the pooling of variables to build the indexes we lose the variability that in our previous estimations gave us significative relations. This fact explains why the model does not find a difference in prices regards the indexes.
Regarding the multipliers, we have found results very similar to those found in our first estimations. In this case, the conversion multiplier is 4.1 and the development multiplier is 1.58 (exactly than before, exists a premium for land in an urban area and this premium increases if it is developed). The second multiplier implies that according to our sample to pass from urban undeveloped to urban developed should be US$ 29 m2.
14 As before, we have chosen these models considering the information criteria selection. We have dropped off the dummy public transport in the second equation because multicollinearity problem. 15 We know that if we incorporate irrelevant variables, our estimated parameters continue being consistent.

27
References
Angel, S. (2000). “Housing Policy Matters: A Global Analysis”. New York: Oxford University Press.
Aroca, P. y D. Paredes (2008). “Metodología para Estimar un Indice Regional de Costo de Vivienda en Chile”. Cuadernos de Economía, Vol. 45 (Mayo), pp. 129-143.
Box, G.E.P. and D.R. Cox; (1964). "An analysis of Transformations". Journal of the Royal Statistical Society, Series B, 26: 211-252.
De los Llanos, M. y M. Izquierdo (2004). “Índices de Precios Hedónicos para Ordenadores Personales en España”. Investigaciones Económicas, volumen 28, número 2, pp. 377-396.
Desormeaux, D. y F. Piguillem (2003). “Precios Hedónicos e Índices de Precios de Vivienda”. Cámara Chilena de la Construcción.
Glaeser, E. and J. Gyourko (2003). “The Impact of Building Restrictions on Housing Affordability”. FRBNY Economic Policy Review.
Lall, S.V., H.G. Wang, and D.D. Mata. (2006). “Do Urban Land Regulations Influence Slum Formation? Evidence from Brazilian Cities”. Paper prepared for the World Bank for the program grant “Dynamics of Slum Formation and Strategies to Improve Lives of Slums Dwellers”.
Rosen, Sherwin. (1974) “Hedonic Prices and Implicit Market: Product Differentiation in Pure Competition”. Journal of Political Economy, Vol. 82, Issue 1, pp 35-55
Quigley, J. and L. Rosenthal (2005). “The Effects of Land Use Regulation on the Price of Housing: What Do We Know? What Can We Learn?” Journal of Policy Development and Research, Volume 8, Number 1.
Quigley, J. S. Raphael and L. Rosenthal (2009). “Measuring Land-Use Regulations and Their Effects In The Housing Market”. Program on Housing and Urban Policy Working Paper Series. N°. W08-004.
28
Appendix
Variables used in the analysis
Price of land: UF/m2 Municipalities: Maipú, Pudahuel, Quilicura, Lampa, Padre Hurtado, Puente Alto, San
Bernardo, Calera de Tango, Pirque. Expansion fronts: Quilicura-Lampa, Pudahuel, Maipú-Padre Hurtado, San Bernardo-
Calera de Tango, Puente Alto-Pirque. URBAN: Dummy variable that takes the value 1 when the lot is located in an
urban area and 0 otherwise. CONSOL (Developed Land): Dummy variable that takes the value 1 when the lot is located in an
urban developed area and 0 if it is in an undeveloped. Distance Local Center: Distance to the commerce center of the municipality (km.). Distance Business Center: Distance to the center of the city (km.). Water: Dummy variable that takes the value 1 if the lot has water service. 0
otherwise. Paved: Dummy variable that takes the value 1 if it is paved in the front of the
lots. Public Transport: Dummy variable that takes the value 1 if the lot is located to less than
400 meter from public transportation. Min. Size: Regulatory variable that indicates the minimum size that a lot must
have. Permdel: How many days you need to get an edification permit. Road: Road paved as a percentage of the total roads. Cwat: Percentage of lots with drinking water. Csew: Percentage of lots with sewerage. Electricity: Percentage of lots with electricity. Park: Surface of green areas per capita (m2). PUBEDUL, PUBEDUM, PRIEDUL and PRIEDUM:
Simce score in language and, mathematics by public and private school.
PSUMN, PSUPS and PSUPP: Percentage of public and private school that get more than 450 point in the PSU test.
TCBD: Travel time to the business center. Invest: Municipal investment Budget. Crime: Crime rate per 100,000 inhabitants. INCOME 92, INCOME 03: Mean income of residential population in 1992 and 2003. IDH: Index of human development. Extax: Exemption of property tax.
PURB82, PURB92, PURB02: Urban population in 1982, 1992 and 2002. PRUR82, PRUR92, PRUR02: Rural population in 1982, 1992 and 2002.
29
Table 7. Pair wise correlation matrix. Color boxes represent variables with high correlation. (More than 0.6 in absolute value).
TAMANO UF/M2 Urban Developed Distance BC Distance LC Water DALC DFS Paved Public T. Min. Size Perm Del. Road Cwat Csew Celect Park SIMCE Income 1992 Income 2003 Human Index Invest Tax CrimeUF/M2 -0.06 1.00Urban 0.08 0.62 1.00Developed -0.30 0.33 1.00Distance BC -0.12 -0.54 -0.68 0.01 1.00Distance LC -0.11 -0.56 -0.78 -0.33 0.80 1.00Water 0.01 0.41 0.47 0.46 -0.53 -0.54 1.00DALC 0.01 0.41 0.50 0.52 -0.53 -0.55 0.97 1.00DFS 0.01 0.33 0.42 0.31 -0.53 -0.35 0.77 0.77 1.00Paved -0.03 0.24 0.32 0.23 -0.29 -0.16 0.41 0.41 0.42 1.00Public T. 0.03 0.35 0.55 -0.35 -0.40 0.14 0.18 0.10 0.16 1.00Min. Size -0.07 -0.34 -0.53 0.24 0.64 0.54 -0.71 -0.71 -0.55 -0.35 -0.27 1.00Perm Del. -0.08 -0.27 -0.19 -0.24 0.06 0.22 -0.08 -0.07 -0.06 -0.09 -0.02 -0.73 1.00Road 0.03 0.26 0.41 0.10 -0.59 -0.26 0.63 0.62 0.76 0.44 0.19 -0.76 -0.01 1.00Cwat 0.12 0.54 0.85 0.24 -0.77 -0.68 0.51 0.53 0.50 0.35 0.50 -0.80 -0.62 0.70 1.00Csew 0.13 0.52 0.80 0.14 -0.60 -0.79 0.42 0.44 0.15 0.19 0.46 -0.69 -0.55 0.24 0.79 1.00Celect 0.12 0.54 0.82 0.15 -0.70 -0.78 0.55 0.56 0.32 0.28 0.46 -0.82 -0.63 0.46 0.88 0.97 1.00Park 0.00 -0.10 -0.17 -0.01 0.44 0.06 -0.52 -0.51 -0.67 -0.36 -0.08 0.71 -0.20 -0.93 -0.55 -0.05 -0.28 1.00SIMCE -0.06 -0.45 -0.71 0.01 0.68 0.54 -0.38 -0.40 -0.48 -0.32 -0.39 0.65 0.36 -0.64 -0.84 -0.58 -0.69 0.53 1.00Income 1992 0.10 0.39 0.66 0.25 -0.29 -0.60 0.40 0.41 0.13 0.18 0.37 -0.50 -0.38 0.24 0.59 0.77 0.76 0.00 -0.38 1.00Income 2003 -0.11 -0.43 -0.70 0.21 0.52 0.43 0.04 0.00 -0.06 -0.12 -0.54 0.33 -0.50 -0.28 -0.77 -0.60 -0.60 0.18 0.64 -0.41 1.00Human Index -0.03 -0.03 -0.21 0.10 0.19 -0.08 0.13 0.10 -0.24 -0.08 -0.22 0.09 -0.53 -0.40 -0.40 0.11 0.04 0.49 0.38 0.21 0.61 1.00Invest -0.09 -0.41 -0.67 -0.21 0.69 0.48 -0.57 -0.58 -0.64 -0.40 -0.39 0.83 0.11 -0.90 -0.92 -0.56 -0.72 0.79 0.77 -0.50 0.62 0.48 1.00Tax 0.11 0.47 0.78 0.06 -0.66 -0.48 0.25 0.28 0.39 0.29 0.52 -0.56 0.41 0.64 0.92 0.59 0.67 -0.50 -0.78 0.47 -0.91 -0.64 -0.87 1.00Crime 0.16 0.56 0.89 0.27 -0.59 -0.69 0.44 0.46 0.41 0.29 0.50 -0.52 -0.41 0.49 0.84 0.74 0.78 -0.22 -0.62 0.81 -0.67 -0.24 -0.74 0.80 1.00
30
2.3. Elaboration of indexes and multipliers of urban prices
Following methodological guidelines provide in the TOR of this research project by the IDB, multipliers were estimated for land conversion and land development, and the ratio of land price to income was estimated. The context of Santiago does not make it relevant to estimate the property rights regime conversion index.
a) On the land conversion multiplier. The data collected for this research project indicate that the land conversion multiplier is 300%. This figure is corroborated by the regression analysis.
Land prices in the rural fringe are not agricultural values but speculative land values for suburban development. These land prices can be considered to be speculative considering that all the central valley of Santiago has been legally subdivided into plots with a minimum lot size of 5.000m216. It constitutes a potential supply of land that is far beyond the demand for it in many decades. A potential supply because most of these subdivisions have been formally approved but have not been subdivided in practice. In other words, they have acquired the right to subdivide into lots of 5.000m2, but in many cases continue to be large land plots with agricultural exploitation of land
The maximum price of land that an agricultural exploitation can pay for land in the central valley around Santiago is of US$ 29.000 per hectare. Land prices observed in the market are far above that figure. In the immediate outer side of the city limit land prices of “parcelas de agrado” or leisure plots, that have a minimum lot size of 5.000 m2, reach levels that go from US$ 6,2/m2 in the case of raw land with no improvements or services in locations that area not the best. The prevailing price in the case of those that are well located and have water and electricity, sometimes with a main paved road is US$ 16,5/m2 . In the northern front, which is not part of this research project, where higher income households have been locating, leisure lots of 5.000 m2 have additional services such as entrance guards, sewerage and processing plants, security, club house, sports facilities, etc. and prices can go up to US$ 45,3/m2 or even higher in some cases.
Prices of leisure parcels have been rising ever since the promulgation of Decree Nº 3516 (1980) of the Ministry of Agriculture, when the minimum subdivision size for agricultural land was decreased from 8 hectares to 5.000 m2. It is very likely that prices will continue to rise as several conditioning factor enter into full impact. First, the development of a regional highway system that has notably improved the connectivity of Santiago with its regional hinterland and also with the rest of the country. Second, the increase in income of the population in Santiago, that was doubled in the period 1990 to 2006, and could double again in less than two decades, allowing for an increase in demand for land and the possibility of an increase in the number of trips, their length and velocity, allowing for residential locations at greater distances. Third, a rapid increase 16 The owners of rural land rushed to approve of these subdivisions before normative changes took place which increased the minimum size of agricultural parcels from half an hectare to 4 hectares and regulated constructibility. This took place in 1994 in the case of the municipalities of Pirque, Calera de Tango and San José de Maipo; before the modification of the PRMS in 1997 in the case of the province of Chacabuco, and before the modification of the PRMS in 2006, that included the rest of the Metropolitan Region.
31
in car ownership. Chile has a relatively low car ownership according to its income level17. This has been changing in recent years, with a growth rate in motorization rate of 4% per year in the period 2000-2006; Fourth, gradual development of leisure plots has evolved from a weekend home to a permanent residence, concentrating in some areas enough demand to support the improvement or the development of services like supermarkets, schools, and in some cases medical services, thus improving the quality of life. The municipality of Colina, located immediately to the north of Santiago, the choice of higher income households (typically of middle higher income, but not the highest income level) for some of the ZODUC located in that municipality, seems to be reaching a critical mass of residents and a tipping point in the provision of higher hierarchy services, which could unchain a higher flow of demand. Fifth, the location alternatives for middle and higher middle income households are at present in the periphery of the city, where lower income groups predominate.
It can therefore be expected that land prices in the outer fringe of the city limit will continue to rise.
In the inner fringe of the city limit land prices have reached a level in the order of 62 USD/m2. A close follow up of supply adds in the newspaper allows to establish that there are occasional asking prices below 62 USD/m2 , but never below 41 USD/m2. The lowest values are in the order of 62 USD/m2 to 82 USD/m2.
The same contextual variables that affect the demand for the land in the outer fringe also apply to the inner fringe and could stimulate a continuation of the increase of land prices in the future.
The above information means a land conversion index in the range of 3 to 4. This figure is confirmed by the regression analysis, that established a conversion multiplier of 300%.
The land conversion multiplier could decrease because of an increase in the land prices of the fringe outside the city limit, but not because of a decrease in land values in the inner fringe.
Authorities are contemplating the expansion of the city limit to allow for the development of social housing through regulatory means and not through the market.
The most likely outcome of an expansion of the city limit would be an increase in land prices of the newly incorporated land. First, because of the historic experience in expanding the city limit of Santiago has shown that a greater availability of legally defined urban land does not bring about a decrease in land prices. In 1979 the city limit was expanded to increase the urban area from 39.000 hectares to 100.000 hectares and land prices increased. In 1994 the city limit was reduced by 15.000 hectares and in 1997 new territories adding up to 15.000 hectares in the adjacent northern province of Chacabuco were incorporated having had no noticeable effect on land prices, as the city had enough land to support its growth trend of some 750 hectares per year for at least two decades. The PRMS modification of 2006 added some land around existing towns in the hinterland of the Metropolitan Region with no substantial change for Santiago.
17 M. Echenique, “El crecimiento y el desarrollo de las ciudades” en A. Galetovic ed. “Santiago, donde estamos y a donde vamos “. Centro de Estudio Públicos, 2006, pags 75-96.
32
As has been informed in another part of this document, Santiago has enough land to respond to its demand for several decades. If these figures are correct, then an increase in the availability of land would not change market operating conditions, except for the stimulation of a speculative land market in the urban fringe18.
Second, if land prices are determined by their highest and best use the trend of suburbanization by middle income families throughout al the periphery under study were to continue, then the highest and best use of the newly incorporated land would be that of housing for this income group and not that of social housing. The typical product is a detached house, sometimes in a gated community, with an average value of US$ 90.000 (typically a lot size of 140m2 and house of 70m2) with prices ranging between US$ 60.000 and US$ 120.000 depending on the specific location and the income group to which it is targeted. These developments can pay up to US$ 80 m2.
It can therefore be expected that land prices would rise up to such values.
What is difficult to determine is the time in which such developments would take place, because considering the availability of land and the demand for land in Santiago, it might take a relatively long period for the newly incorporated land to be developed.
Third, land owners would have very low holding costs. Fiscal assessment values will continue to be that of “agricultural” land, which means it would be in the order of 1% or less of the fiscal assessment value of neighboring urban land. The property tax rate would be of 1% and could be deduced of next year’s income tax if it continues to have an agricultural exploitation. They would not be affected by the 100% surcharge of property tax on vacant land. But most important, if owned by a natural person (in contrast to a legal person), land value increments would not constitute rent for tax purposes.
Land incorporated into the city limit could therefore remain vacant for an indefinite length of time.
All the above allows to conclude that the land conversion index would not change as a consequence of an expansion of the city limit of Santiago.
18 The principal advisor to the Ministry of Housing in the elaboration of the proposal to expand the city limit of the PRMS in 2010 states in an article first published in 2000: “…several real estate developers utilize an artificial way of production for the valorization of urban land, based upon mega projects, the viability of which depends on the modification of existing territorial norms and of location trends of the metropolitan real estate market of Santiago. Given their magnitude, these mega projects en up justifying the modification of the Plan Metropolitano de Santiago, considering that it is possible to interpret them as a “new urban territory” and not as the sum of several private projects. In this way emerge what can be called “planes reguladores inmobiliarios”, that include mega projects in their propositions, transforming them into new zones with defined land use. In this way the speculative drive becomes much more complex. It is now part of an official instrument of spatial ordering, in which the state becomes the main strategic partner in this new speculative business, in which the Plan Regulador Metropolitano becomes in an excellent mechanism to stimulate this new form of speculation”. …,”In this way, a public policy that is presented essentially as being motivated by objectives of equity becomes an effective instrument to stimulate speculation with urban land”. I.Poduje and G. Yañez ”Planificando la ciudad virtual: megaproyectos urbanos estatales y privados” in A. Rodríguez and P. Rodríguez. “Santiago, una ciudad neoliberal”. OLACCHI, Quito, Ecuador 2009, pp. 277 -299.
33
Addenda to this section: The impact on land prices as a consequence of the expansion of the city limit from 40.000 hectares to 100.000 hectares in 1979 in Santiago.
By special request of the IDB project team, an effort was made to measure the impact on land prices of the expansion of the city limit from 40.000 hectares to 100.000 hectares in 1997. The economy was growing rapidly and the real estate sector was too. The city limit set in 1975 in 40.000 hectares constituted a problematic restraint as the city area reached some 36.000 hectares and grew at some 900 hectares per year.
In the context of a radical poly change regarding land policy, public authorities blamed most urban problems on the arbitrary intervention of public bureaucrats that generated distortions in the market, particularly in the land market that stimulated an artificial restriction in the supply of land making it increasingly difficult to develop social housing. The policy decision to expand the city limit expected to attain a increase in the supply of land and consequently a reduction of land prices. In order to measure the impact, data of land supply adds were of the first Sunday of October of the years 1977 to 1982 were collected, attaining 815 observations.
The following table reports the evolution of the average of land prices in the years of our sample. In a simple view we notice that the prices increase after 1979, exactly after the limit expansion. In fact, the average price in 1980 is 40% above the average price in 1979, and the one in 1981 73% higher. It is not surprising that prices dropped in 1982 as the economy entered into deep crisis.
Table 1. Mean of land prices by year.
Year Mean Price
1977 0.931978 0.681979 0.801980 1.121981 1.351982 1.19
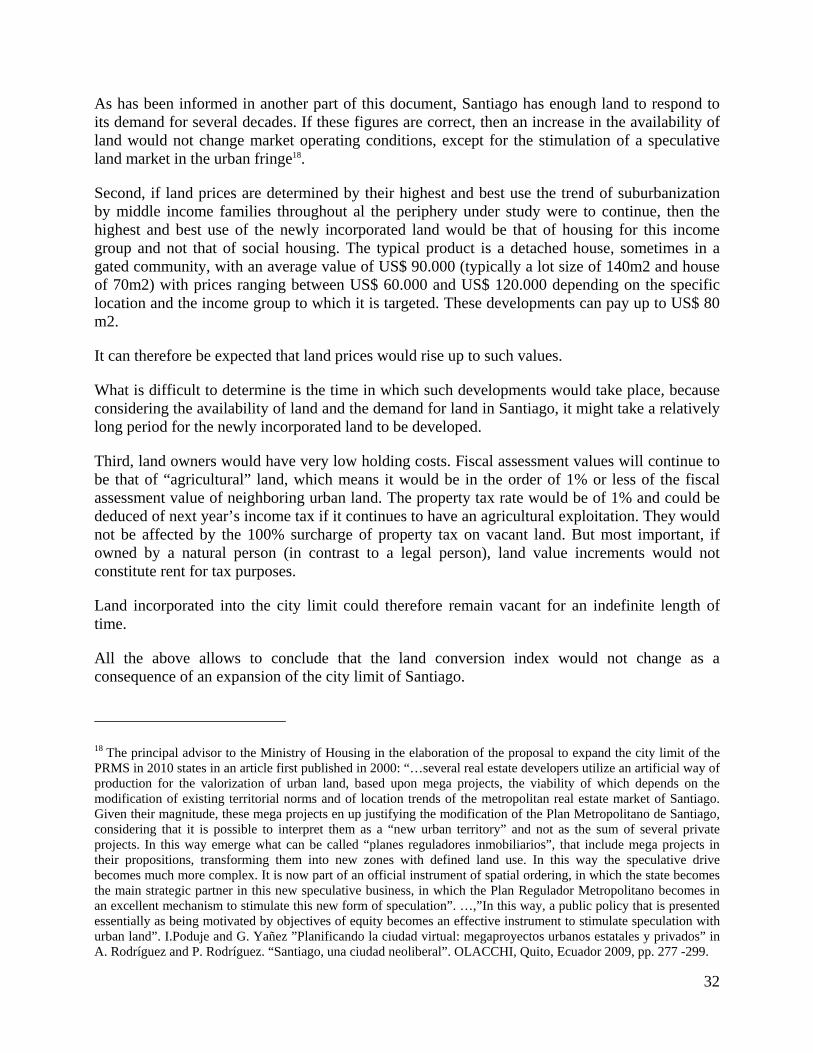
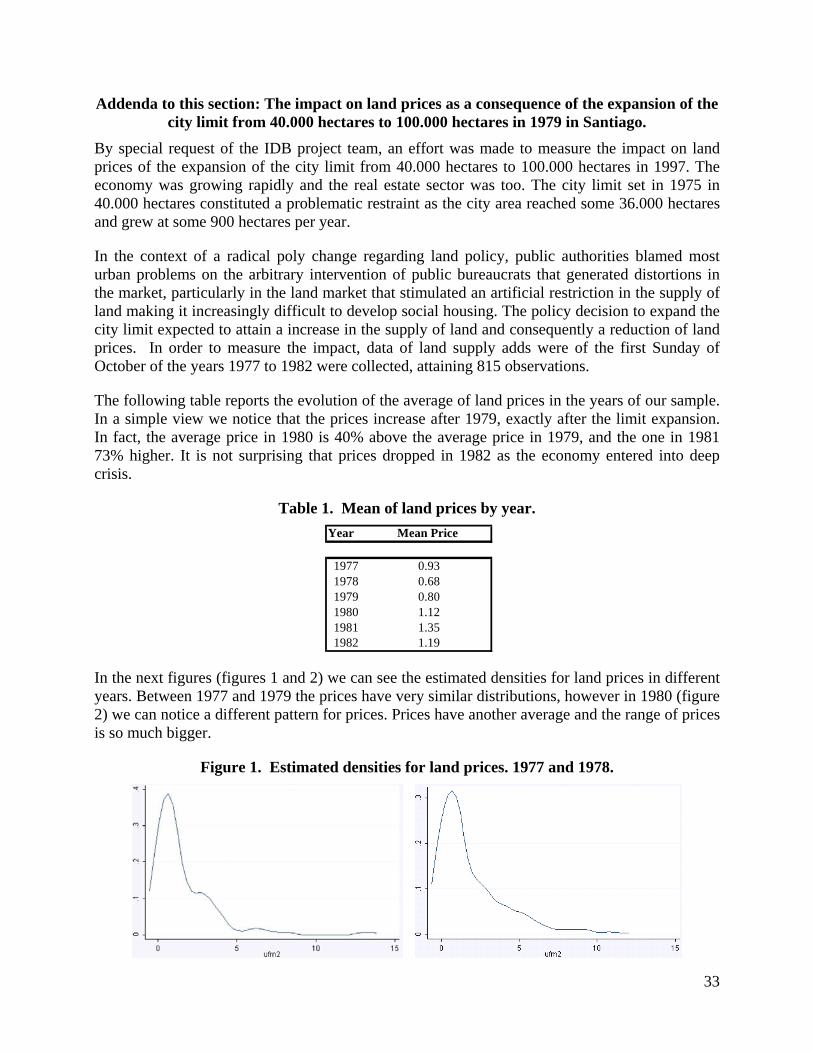
In the next figures (figures 1 and 2) we can see the estimated densities for land prices in different years. Between 1977 and 1979 the prices have very similar distributions, however in 1980 (figure 2) we can notice a different pattern for prices. Prices have another average and the range of prices is so much bigger.
Figure 1. Estimated densities for land prices. 1977 and 1978.
34
Figure 2. Estimated densities for land prices. 1979 and 1980.
Aware of the fact that a simple average could not be useful to evaluate changes in means, we proceed to utilize a more rigorous strategy. We run a regression to contrast the figures with the data analysis. Our estimation use dummies for years (all years are compared to 1979), dummies for municipalities, dummies for area (urban, sub urban and rural), the distance to the center of the city and the size of the properties. Accordingly our model can be summarized in the following formulation:
ln( )ij ijp DY DM Cα β γ ε= + + +
Where ln( )ijp is the log of the land price in UF/m2, DY are dummies for years19 that take the value 1 if the observation comes from one year and 0 if not, DM are dummies for municipalities (37 in our sample) that take the value 1 if the observation comes from one municipality and 0 otherwise. Finally C is a vector that includes the constant, the log of the distance to the center of the city and the log of size. The parameters to be estimated areα , β and γ
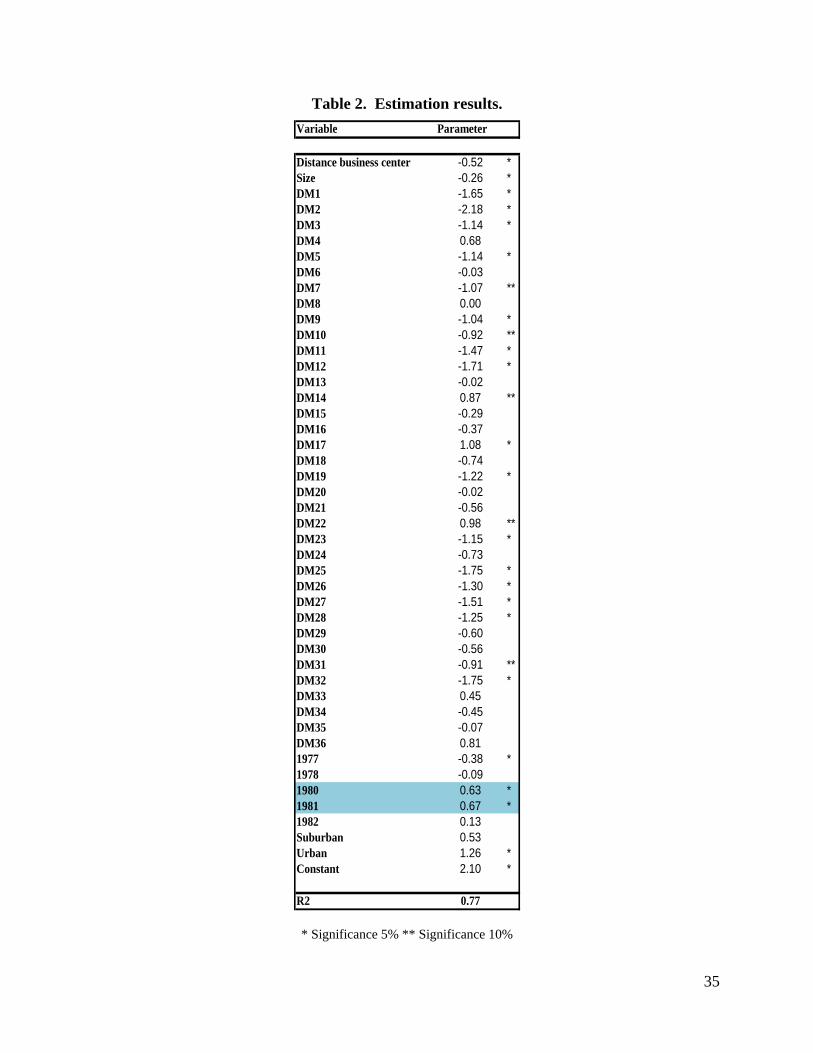
The results are presented in the table 2 and clearly confirm our hypothesis. The dummies for 1980 and 1981 present a positive and significative relation with price (the parameters implies an increase regards 1979).
The other variables are well behaved and significant. Land prices decline with the distance to the center as could be expected. The variable urban is positive and significative, meaning a positive gap between prices of urban and rural land.
For 1982 we have not found differences from 1979 and as we mentioned before is due the economic downturn that occurred in that year.
19 The dummies for years in the regressions are for 1977, 1978, 1980, 1981 and 1982. The idea is that our results can be compared immediately with the year 1979 (reform year).
35
Table 2. Estimation results. Variable Parameter
Distance business center -0.52 *Size -0.26 *DM1 -1.65 *DM2 -2.18 *DM3 -1.14 *DM4 0.68DM5 -1.14 *DM6 -0.03DM7 -1.07 **DM8 0.00DM9 -1.04 *DM10 -0.92 **DM11 -1.47 *DM12 -1.71 *DM13 -0.02DM14 0.87 **DM15 -0.29DM16 -0.37DM17 1.08 *DM18 -0.74DM19 -1.22 *DM20 -0.02DM21 -0.56DM22 0.98 **DM23 -1.15 *DM24 -0.73DM25 -1.75 *DM26 -1.30 *DM27 -1.51 *DM28 -1.25 *DM29 -0.60DM30 -0.56DM31 -0.91 **DM32 -1.75 *DM33 0.45DM34 -0.45DM35 -0.07DM36 0.811977 -0.38 *1978 -0.091980 0.63 *1981 0.67 *1982 0.13Suburban 0.53Urban 1.26 *Constant 2.10 *
R2 0.77
* Significance 5% ** Significance 10%

36
Appendix
The variables use for municipalities dummies were:
DM1 CerrillosDM2 Cerro NaviaDM3 ConchaliDM4 El ArrayanDM5 El BosqueDM6 Estacion CentralDM7 HuechurabaDM8 IndependenciaDM9 La CisternaDM10 La FloridaDM11 La GranjaDM12 La PintanaDM13 La ReinaDM14 Las CondesDM15 Lo BarnecheaDM16 Lo PradoDM17 Los DominicosDM18 MaculDM19 MaipuDM20 NunoaDM21 PenalolenDM22 ProvidenciaDM23 PudahuelDM24 Puente AltoDM25 QuilicuraDM26 Quinta NormalDM27 RecoletaDM28 RencaDM29 San BernardoDM30 San JoaquinDM31 San MiguelDM32 San RamonDM33 Santa Rosa de ChenaDM34 SantiagoDM35 Santiago CentroDM36 Vitacura
37
b) On the land development multiplier. The cost associated with servicing land is in the case of Santiago is 20,5 USD/m2, a figure that has been confirmed by several developers. This figure refers to a minimum standard, starting of which, values can increase as the urbanization becomes more sophisticated, meaning streets with a grater width than that required by law, underground conduction of electric and telephone cables, quality and frequency of lighting posts, etc.
The outcome of the regression analysis establishes that the premium of going from raw land to serviced land is 33 USD/m2, meaning that the gap between urbanization costs and the premium of urbanization is in the order of 12,5 USD/m2. It constitutes a relatively low figure that could allow concluding that the market is operating well. If the lowest non urbanized land prices are in the order of 62 USD/m2, then the gain for urbanization is at the most at 20% or les if transactions are referred to higher valued land. It is relatively low, particularly when compared to the magnitude of land conversion index.
It is necessary to make the following comments and clarifications with regard to the measurement of this index.
First, the real estate market in Santiago does not include urbanized lot as a typical market product except for very high income households that will design and build houses according to their individual preferences of size, design, architectural style, etc. on a lot of land bought for this purpose. For the rest of the population, that is almost all households, the acquisition of a dwelling is not a gradual process of buying a lot of land and building a house, except for the case of a fraction of the market of second homes, outside of Santiago, in the countryside, the mountains or the seaside.
For all practical purposes, there is no market of urbanized lots in the study area, meaning lots any individual household would buy to later on construct a house.
Access to urban land is done through the acquisition of a dwelling. This means that the final consumers of houses do not directly participate in the land market. The actors in the land market are developers and land owners.
The land market is not very transparent, meaning that it is not a simple task to figure out the availability of land, the land prices and the expected values at which owners are ready to sell. However, considering the relevance of land prices in the final determination of profits of a real estate venture and the sensibility of demand and velocity of sales to location of projects, real estate firms devote the necessary resources to be as well informed as possible of the land market.
Urban regulations establish that is not permitted to sell a parcel of land without access to basic services (water, sewerage, drainage, electricity and road pavement). This means that any lot in the market, independently of its size, has to comply with this regulation, meaning that there are no unserviced lots in the market. In other words basic services have to reach at least some point in its perimeter. If a lot will be subdivided, then the developer has to assume all the costs of urbanization for each resulting lots.
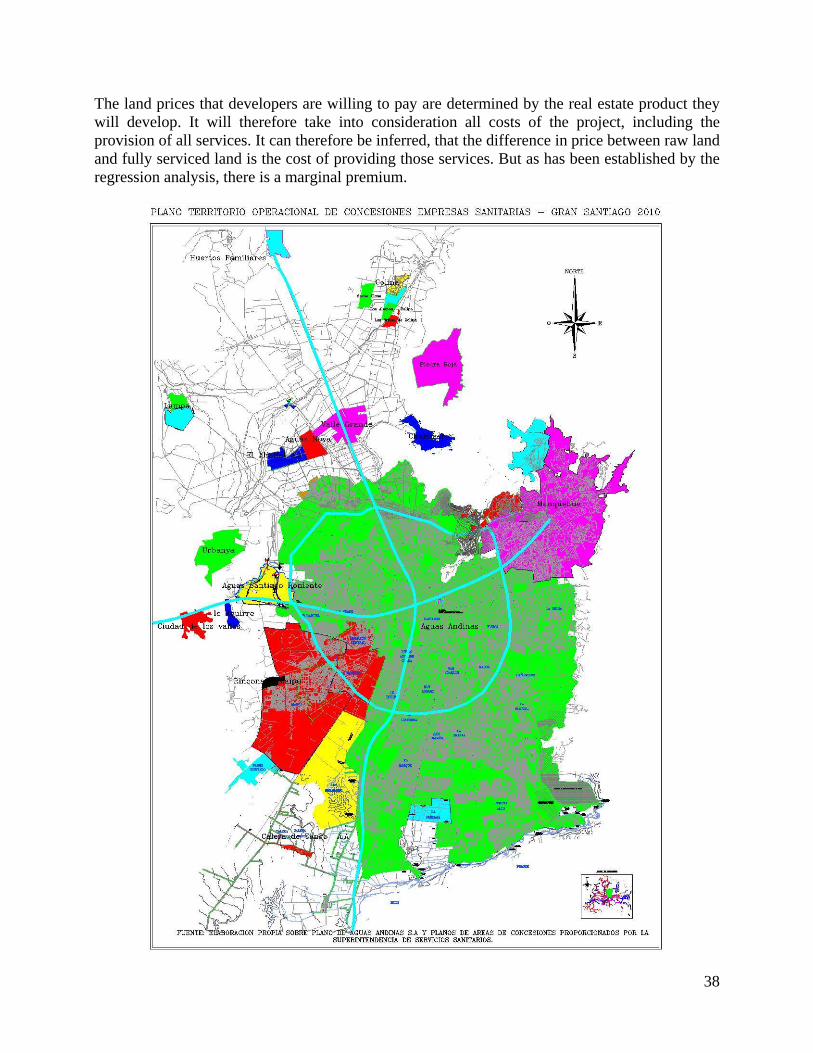
38
The land prices that developers are willing to pay are determined by the real estate product they will develop. It will therefore take into consideration all costs of the project, including the provision of all services. It can therefore be inferred, that the difference in price between raw land and fully serviced land is the cost of providing those services. But as has been established by the regression analysis, there is a marginal premium.
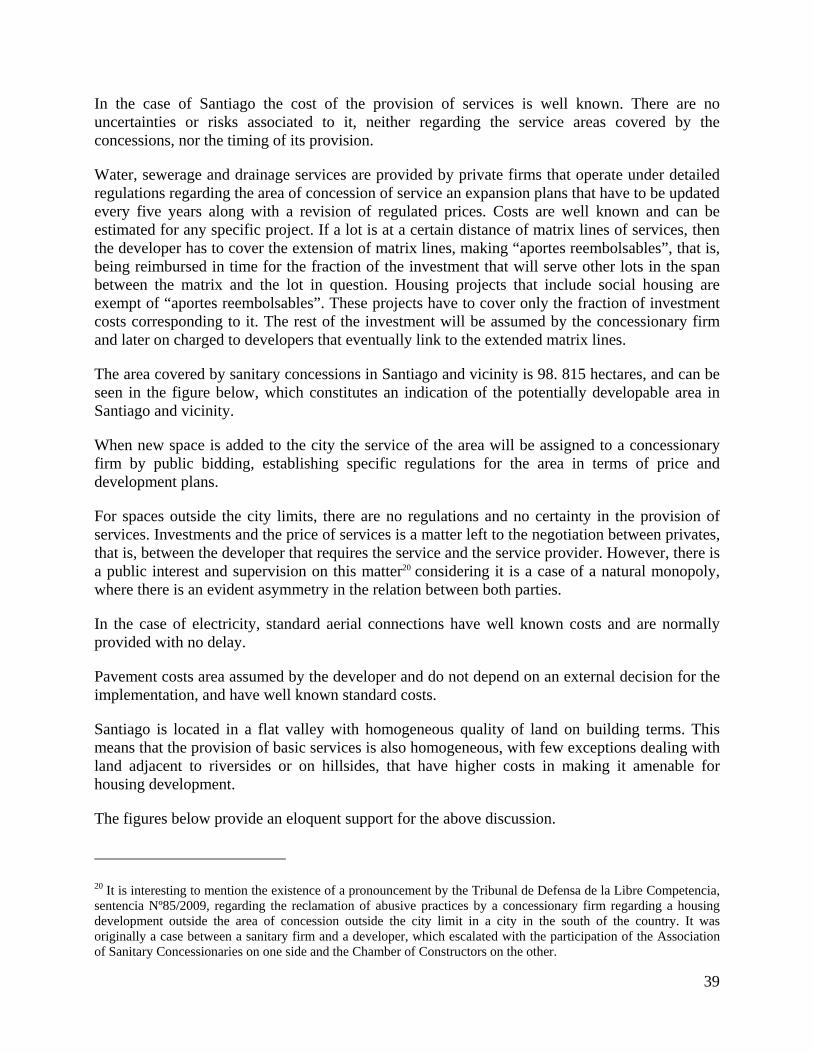
39
In the case of Santiago the cost of the provision of services is well known. There are no uncertainties or risks associated to it, neither regarding the service areas covered by the concessions, nor the timing of its provision.
Water, sewerage and drainage services are provided by private firms that operate under detailed regulations regarding the area of concession of service an expansion plans that have to be updated every five years along with a revision of regulated prices. Costs are well known and can be estimated for any specific project. If a lot is at a certain distance of matrix lines of services, then the developer has to cover the extension of matrix lines, making “aportes reembolsables”, that is, being reimbursed in time for the fraction of the investment that will serve other lots in the span between the matrix and the lot in question. Housing projects that include social housing are exempt of “aportes reembolsables”. These projects have to cover only the fraction of investment costs corresponding to it. The rest of the investment will be assumed by the concessionary firm and later on charged to developers that eventually link to the extended matrix lines.
The area covered by sanitary concessions in Santiago and vicinity is 98. 815 hectares, and can be seen in the figure below, which constitutes an indication of the potentially developable area in Santiago and vicinity.
When new space is added to the city the service of the area will be assigned to a concessionary firm by public bidding, establishing specific regulations for the area in terms of price and development plans.
For spaces outside the city limits, there are no regulations and no certainty in the provision of services. Investments and the price of services is a matter left to the negotiation between privates, that is, between the developer that requires the service and the service provider. However, there is a public interest and supervision on this matter20 considering it is a case of a natural monopoly, where there is an evident asymmetry in the relation between both parties.
In the case of electricity, standard aerial connections have well known costs and are normally provided with no delay.
Pavement costs area assumed by the developer and do not depend on an external decision for the implementation, and have well known standard costs.
Santiago is located in a flat valley with homogeneous quality of land on building terms. This means that the provision of basic services is also homogeneous, with few exceptions dealing with land adjacent to riversides or on hillsides, that have higher costs in making it amenable for housing development.
The figures below provide an eloquent support for the above discussion.
20 It is interesting to mention the existence of a pronouncement by the Tribunal de Defensa de la Libre Competencia, sentencia Nº85/2009, regarding the reclamation of abusive practices by a concessionary firm regarding a housing development outside the area of concession outside the city limit in a city in the south of the country. It was originally a case between a sanitary firm and a developer, which escalated with the participation of the Association of Sanitary Concessionaries on one side and the Chamber of Constructors on the other.
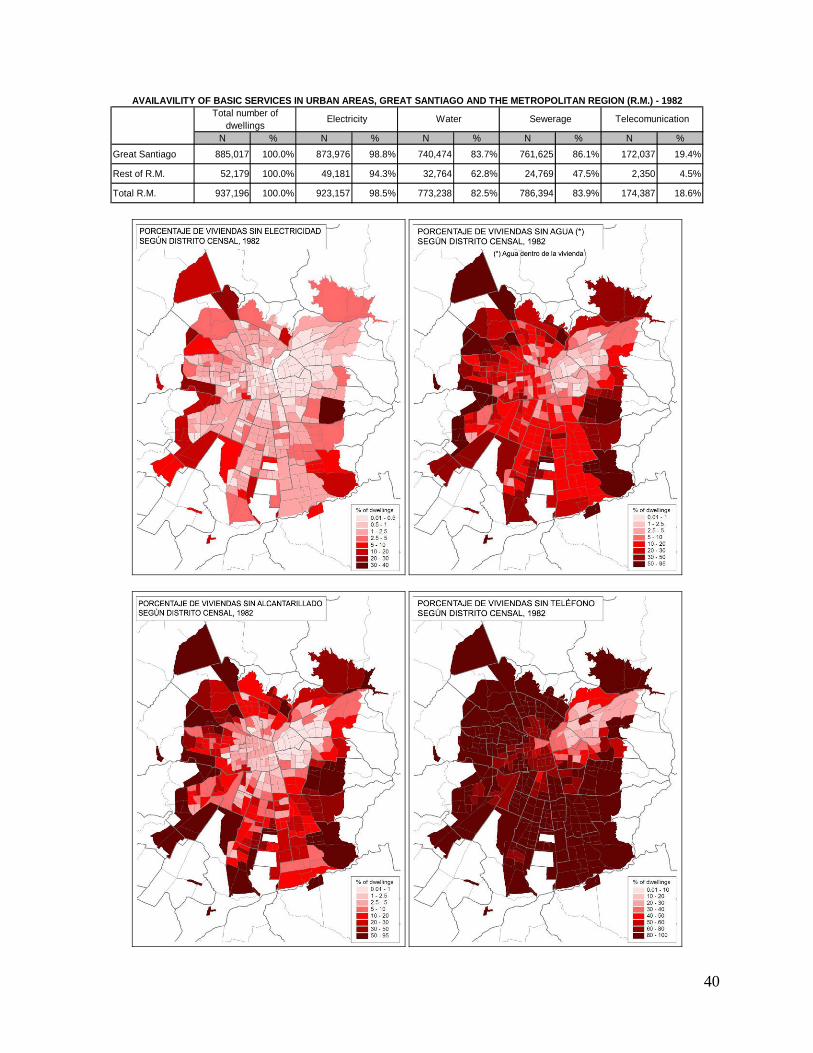
40
N % N % N % N % N %Great Santiago 885,017 100.0% 873,976 98.8% 740,474 83.7% 761,625 86.1% 172,037 19.4%
Rest of R.M. 52,179 100.0% 49,181 94.3% 32,764 62.8% 24,769 47.5% 2,350 4.5%
Total R.M. 937,196 100.0% 923,157 98.5% 773,238 82.5% 786,394 83.9% 174,387 18.6%
AVAILAVILITY OF BASIC SERVICES IN URBAN AREAS, GREAT SANTIAGO AND THE METROPOLITAN REGION (R.M.) - 1982
Electricity Water Sewerage TelecomunicationTotal number of dwellings
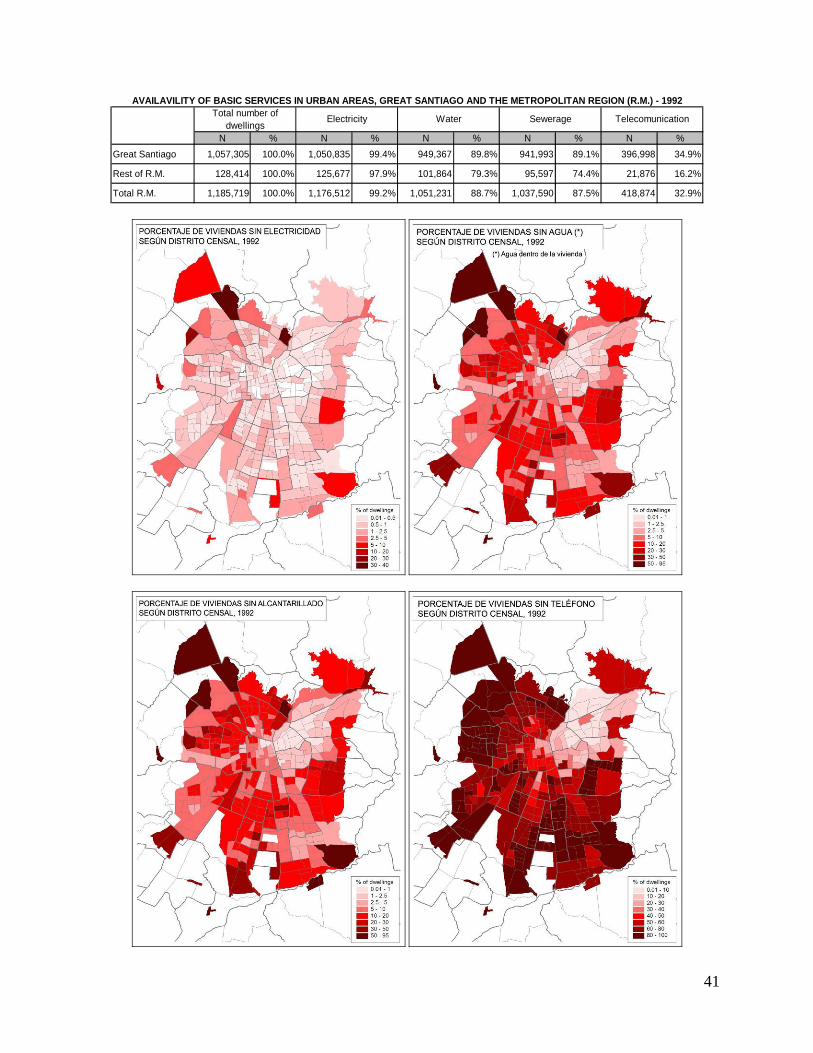
41
N % N % N % N % N %Great Santiago 1,057,305 100.0% 1,050,835 99.4% 949,367 89.8% 941,993 89.1% 396,998 34.9%
Rest of R.M. 128,414 100.0% 125,677 97.9% 101,864 79.3% 95,597 74.4% 21,876 16.2%
Total R.M. 1,185,719 100.0% 1,176,512 99.2% 1,051,231 88.7% 1,037,590 87.5% 418,874 32.9%
AVAILAVILITY OF BASIC SERVICES IN URBAN AREAS, GREAT SANTIAGO AND THE METROPOLITAN REGION (R.M.) - 1992
Electricity Water Sewerage TelecomunicationTotal number of dwellings
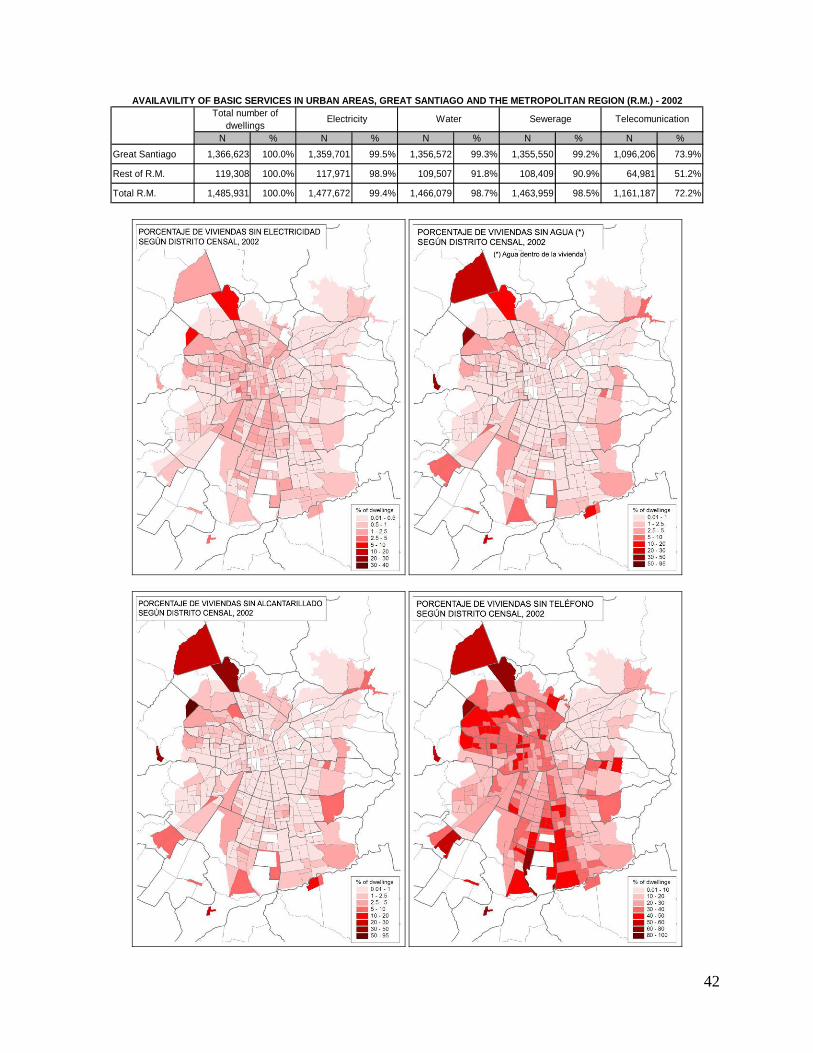
42
N % N % N % N % N %Great Santiago 1,366,623 100.0% 1,359,701 99.5% 1,356,572 99.3% 1,355,550 99.2% 1,096,206 73.9%
Rest of R.M. 119,308 100.0% 117,971 98.9% 109,507 91.8% 108,409 90.9% 64,981 51.2%
Total R.M. 1,485,931 100.0% 1,477,672 99.4% 1,466,079 98.7% 1,463,959 98.5% 1,161,187 72.2%
AVAILAVILITY OF BASIC SERVICES IN URBAN AREAS, GREAT SANTIAGO AND THE METROPOLITAN REGION (R.M.) - 2002
Electricity Water Sewerage TelecomunicationTotal number of dwellings
43
According to census data, the coverage of water service evolved from 84% of houses in Santiago in 1982, to 90% in 1992 and to 99,3% in 2002. The coverage of sewerage evolved from 86% in 198221, to 89% in 1992 and to 99,2% in 2002.
The coverage of electric services evolved from 98,8% of houses in Santiago in 1982, to 99,4% in 1992 and to 99,5 % in 2002.
The coverage of fixed line of telephone service evolved from 19,4% of houses in Santiago in 1982, to 34,9% in 1992 and to 73,9% in 2002. Mobile phones are at present accessible to almost everybody. However, the fixed line telephone connection is still relevant because it an alternative to have internet access, although there is an expanding wireless service.
c) On the property rights regime multiplier.
The land and housing market in Santiago abides by existing regulations. Informal settlments and land subdivisions were legaly forbiden since the 1950`s and strictly enforced in the 60`s. However, land invasions massively took place in the late 60`s and early 70`s. During the military regime this practice was violently suppressed and the existing ones were regularized either in the same site or relocated into areas of the city where land prices made it viable to develop them. The criterion to regularize in the same site or to relocate was the price of land. The proces affected some 160.000 persons and it meant that higher income areas of the city, where land prices were çrelatively high were cleansed of irregular settlements.
There was a counted number of invations during the military regime in Santiago. In the 90`s invations were almost inexitent in spite of the accumulated housing deficit that acculated in 1990 to a figure above 1.000.000 units. In a context where the housing policy was focalized towards lower income households and the number of units produced by year increased dramatically, the alternative to invade a plot of land in order to establish a place to live without basic services and no predictable osibilities to later on apply to social housing programs, was clearly discarted as an alternative course of action, execpt for a reduced number of cases.
In 1997 the government elaborated a cadaster of all irregular settlemets in the country in order to solve this problem in ten years. In the Metropolitan Region 10.958 familes were cadastered and in Santiago 8.746. By 2007 a new cadaster was elaborated, establishing the presence of 3.799 families living in irregular settlement in the Metropolitan Region and 2.269 in Santiago. This means in the order of 9.000 persons, an irrelevant number in a city of almost 6.000.000 inhabitants. Finally, a non for profit institution has cadastered “microcampamentos” or very small land invations in Santiago, finding 60 with a total population of 1.806 person inhabilting in them22.
21 The figure of the coverage of the coverage of sewerage in 1982 is higher than that of the coverage of water provision because the figure regarding water services includes only houses that have water service within the house, while there exists a number of cases that have water provided to the site. 22 Presentation by F. Larrín, President of Fundacion de Trabajo en la Calle, oct. 6 2010.
44
An ECLAC report on irregular settlements in Latin America indicates that people living in squatter settlements in 2002 in Chile accounted for 1% of the population and in Santiago 19.516 persons23.
In this context it is har to imagine that any houseless family would engage into an informal transaction of land instead of applying to the social housing programs, that in the las years could accrue subsidies up to some US$ 28.000 with a required personal savings of US$ 400.
It can therefore be clearly assertained that for all practical purposes there is no informal land market in Santiago, at least not in the quest for a place to live by low income households.
The following figures and statistics on the tenure status of housing allows to confirm the prevailing formality in Santiago. Census data, which only informs the declared status of tenure and does therefore not constitute solid legal information, but is still a relevant source of information, establishes that the proportion of owners and renters has increased from 85,5% in 1982 to 91,2% in 1992 and to 94,1 in 2002. The category of other, includes a miscellaneous of cases, such a belonging to a relative, borrowed, usufructuary, bartered in exchange for work, etc.
Complementing statistics regarding the type tenure, the Census also provides information on the type of dwelling. The data also reaffirm the same concept of formality. In 1982 86,7% of all dwellings were houses or apartments, in 1992 it fell to 89,3% and 95,6% in 2002. In this case, “other” means a miscellaneous number of cases such as tent, wagon, rancho, ruca, choza, room in conventillo, etc.
23 Nora Klichevsky “Regularizando la informalidad del suelo en América Latina y el Caribe. Una evaluación sobre la base de 13 países y 71 programas”. Serie Manuales, Nº50, CEPAL, enero 2006, pagina 12
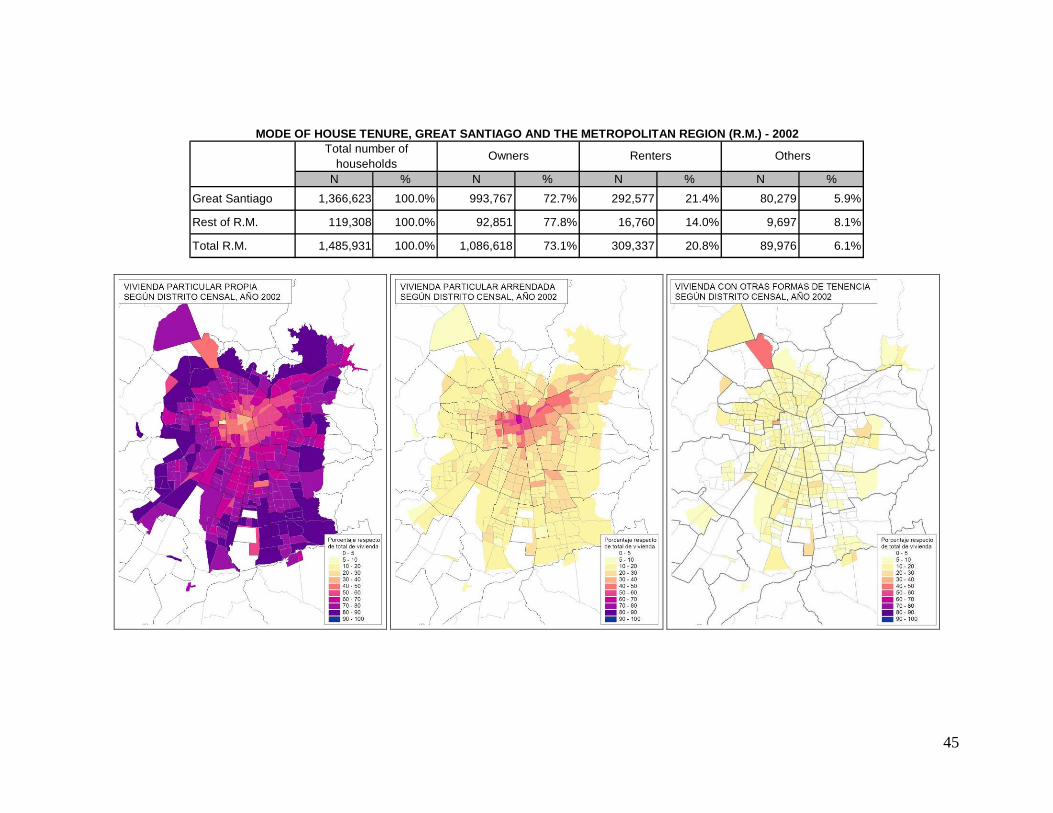
45
N % N % N % N %Great Santiago 1,366,623 100.0% 993,767 72.7% 292,577 21.4% 80,279 5.9%
Rest of R.M. 119,308 100.0% 92,851 77.8% 16,760 14.0% 9,697 8.1%
Total R.M. 1,485,931 100.0% 1,086,618 73.1% 309,337 20.8% 89,976 6.1%
MODE OF HOUSE TENURE, GREAT SANTIAGO AND THE METROPOLITAN REGION (R.M.) - 2002
Owners Renters OthersTotal number of households
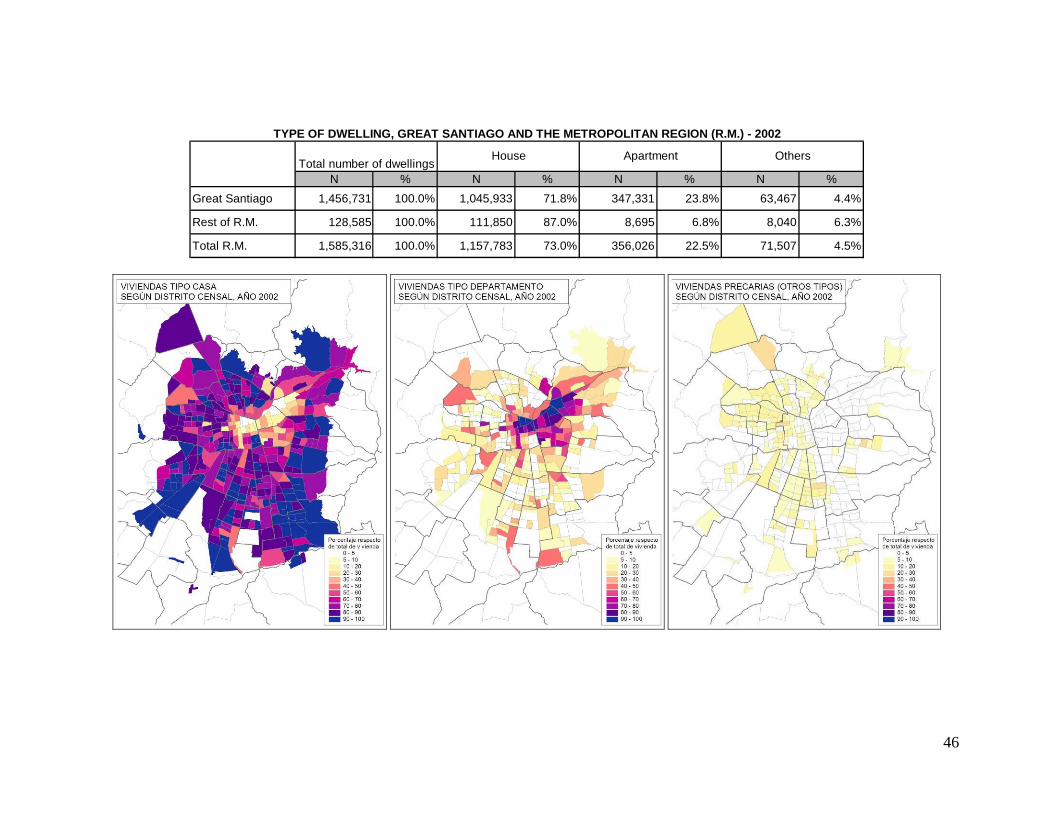
46
N % N % N % N %Great Santiago 1,456,731 100.0% 1,045,933 71.8% 347,331 23.8% 63,467 4.4%
Rest of R.M. 128,585 100.0% 111,850 87.0% 8,695 6.8% 8,040 6.3%
Total R.M. 1,585,316 100.0% 1,157,783 73.0% 356,026 22.5% 71,507 4.5%
TYPE OF DWELLING, GREAT SANTIAGO AND THE METROPOLITAN REGION (R.M.) - 2002
House Apartment OthersTotal number of dwellings
47
d) On the land price to income multiplier. The land price to income ratio is a measure of land affordability defined as the ratio of serviced land price and income. The relevance of this index in the case of Santiago is only relative since there does not exist a market of serviced lots as a way to obtain a place to live, except for a reduced number of very high income group, that locates on a specific development front of the city, which is not covered by the area being studied in this research project.
In order to capture a full meaning of this multiplier additional information would have to be taken into consideration. First, location is critical variable in the determination of land prices and in the range of aspects that it solves in providing a housing solution. Second, density, as in order to have access to better locations social housing solutions have undergone a process of densification24. Third, the information regarding the proportion of social housing solutions that have access to the location associated with the land price computed in this index, because social housing solutions present a wide range of densities and locations. Fourth, time
As indicated in the discussion of the land development multiplier, any plot of land that is traded in the market has to comply with minimum urbanization requirements, meaning that it has to be connected to mains of basic services. The issue of raw versus developed land has to do with the size of lots. While small lot with urbanization can be devoted to urban use without any further investments in infrastructure, larger lots that would be subject to fractioning, would have to do so. If observations of the land market establish that the bottom price of “raw” is US$ 62 m2, and that standard minimum urbanization costs are US$ 20,6 m2, then it can be affirmed that a serviced lot would have a price of US$ 82 m2 if adding urbanization costs to the price of raw land. If the land development premium of US$ is applied, the unit cost of an urbanized lot would be US$ 95 m2.
Considering that the predominant size of social housing lots is of 80m2, the price of a fully serviced lot would be of US$ 7.600.
The average household income of the urban population in the Metropolitan Region of Santiago is of US$ 1929 in 2009.
The land price to income ratio is therefore 3,94.
From a dynamic perspective it can be established that there is a widening gap in the evolution of wages and land prices. While the index of the minimum wage in real terms grew from 100 to 202 between 1990 and 200625, the index of land prices grew from 100 in 1990 to 660 as an average of the land supplied in the city of Santiago, and to 1.100 in the case of the municipality of Puente Alto and to 1.600 in the case of the municipality of Quilicura. This last two municipalities, as well as other of the expansion fronts being studied, used to be the location of social housing until land prices began to rise and reached level above the amount social housing solutions can pay for.
24 Rodríguez and Sugranyes, op. cit. report that in the period 1980 to 2002 there were 202.000 social housing solutions built in Santiago in an area of 2.500 hectares, which means an average density that is more than three times the average of Santiago. 25 H. Vega “En vez de la injusticia” DEBATE, 2007.
48
A research report by Brain and Sabatini26 on the impact of land price increases on the budget and location of social housing in Santiago, establishes that incidence of land prices on social housing solutions increased as an average of the cases studied from 7,3% in 1994 to 19,8% in 2000-2004 in Santiago. The same publication quotes “C. Arriagada of the MINVU estimated that the land of “vivienda básica” programs in Santiago (devoted to the poorest households), increased from 8% around 1990 to more than 20% in the last years of construction of this program (2002)”27. Furthermore, Brain and Sabatini affirm that “It is possible that with the purpose that unit costs do not surpass the maximum limit that could hinder the implementation of projects, SERVIU28 undervalued its own land. The pressure to achieve sectorial goals and the social demand to reduce the deficit would have facilitated the generation of this sort of complementary hidden subsidy. Additionally, this would allow to understand that SERVIU contributed with more land than private firms. The latter could not supply them under market values for social housing projects”. The exhaustion in time of the land stock of SERVIU would explain the decreasing proportion of social housing developed in Santiago.
The consequence is that an increasing proportion of new social housing projects have been locating in municipalities out of Santiago, at increasing distances, where land prices are compatible with the budget for these solutions.
26 I. Brain y F: Sabatini “Los precios del suelo en alza carcomen el subsidio habitacional, contribuyendo al deterioro de la calidad y localización de la vivienda social”. PROURBANA, www.prourbana.cl/upload/ProUrbana4.pdf. 27 C. Arriagada “Subsidios habitacionales y su interaccion con los mercados de suelo y la estructura urbana en santiago de Chile” ponencia presentada al seminario “Habitat y Suelo” Bogotá abril 2005, Universidad de Los Andes y Lincoln Institute of Land Policy. 28 SERVIU is the executive branch of the Ministry of Housing and Urban Development.
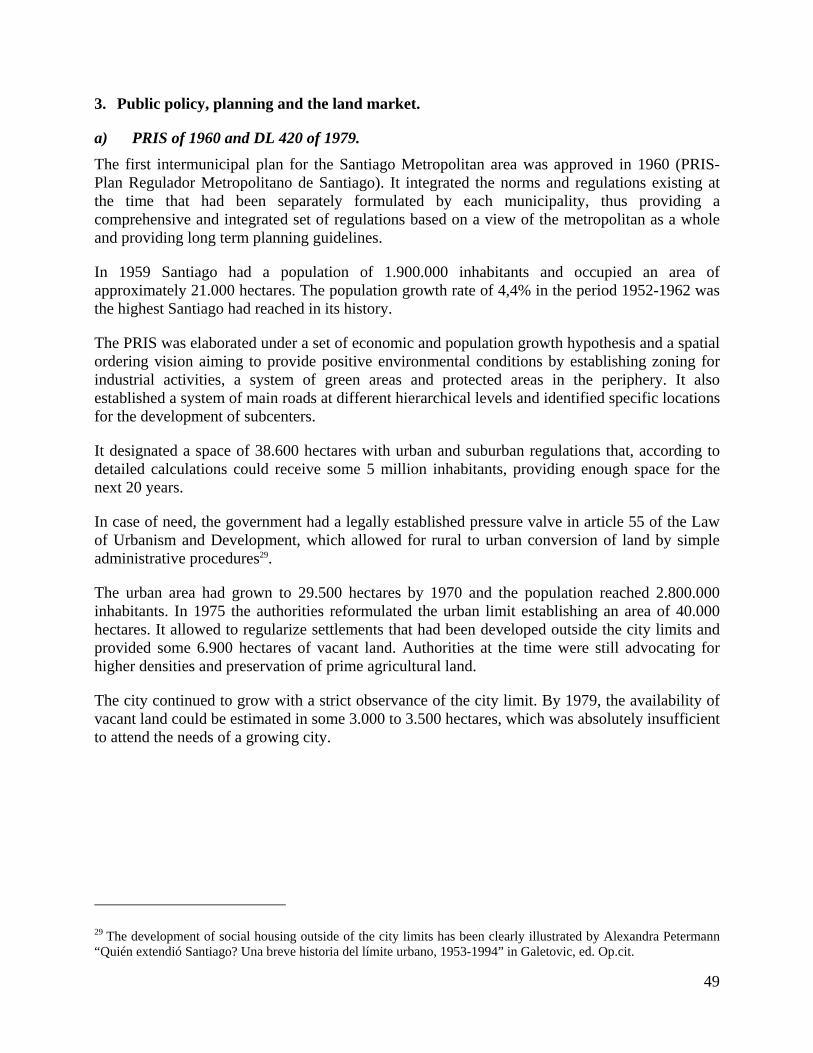
49
3. Public policy, planning and the land market.
a) PRIS of 1960 and DL 420 of 1979. The first intermunicipal plan for the Santiago Metropolitan area was approved in 1960 (PRIS- Plan Regulador Metropolitano de Santiago). It integrated the norms and regulations existing at the time that had been separately formulated by each municipality, thus providing a comprehensive and integrated set of regulations based on a view of the metropolitan as a whole and providing long term planning guidelines.
In 1959 Santiago had a population of 1.900.000 inhabitants and occupied an area of approximately 21.000 hectares. The population growth rate of 4,4% in the period 1952-1962 was the highest Santiago had reached in its history.
The PRIS was elaborated under a set of economic and population growth hypothesis and a spatial ordering vision aiming to provide positive environmental conditions by establishing zoning for industrial activities, a system of green areas and protected areas in the periphery. It also established a system of main roads at different hierarchical levels and identified specific locations for the development of subcenters.
It designated a space of 38.600 hectares with urban and suburban regulations that, according to detailed calculations could receive some 5 million inhabitants, providing enough space for the next 20 years.
In case of need, the government had a legally established pressure valve in article 55 of the Law of Urbanism and Development, which allowed for rural to urban conversion of land by simple administrative procedures29.
The urban area had grown to 29.500 hectares by 1970 and the population reached 2.800.000 inhabitants. In 1975 the authorities reformulated the urban limit establishing an area of 40.000 hectares. It allowed to regularize settlements that had been developed outside the city limits and provided some 6.900 hectares of vacant land. Authorities at the time were still advocating for higher densities and preservation of prime agricultural land.
The city continued to grow with a strict observance of the city limit. By 1979, the availability of vacant land could be estimated in some 3.000 to 3.500 hectares, which was absolutely insufficient to attend the needs of a growing city.
29 The development of social housing outside of the city limits has been clearly illustrated by Alexandra Petermann “Quién extendió Santiago? Una breve historia del límite urbano, 1953-1994” in Galetovic, ed. Op.cit.

50
In 1979 a radical change took place. The military regime decided to harmonize the urban policy with the global perspective adopted by the government, formally denominated Economía Social de Mercado or market social economy, by approving a National Policy of Urban Development, basically inspired in the quest for a liberal operation of the market.
This policy document is basically centered on the land market.
It states that “in as much as the private sector is able to follow the market signals, it can freely perform all the activities that are demanded by the population. The role of the State is therefore reduced to all those aspects that temporarily are not attractive to the private initiative and the formulation and enforcement of laws and regulations destined to guarantee equal opportunities, as its basic objectives.”
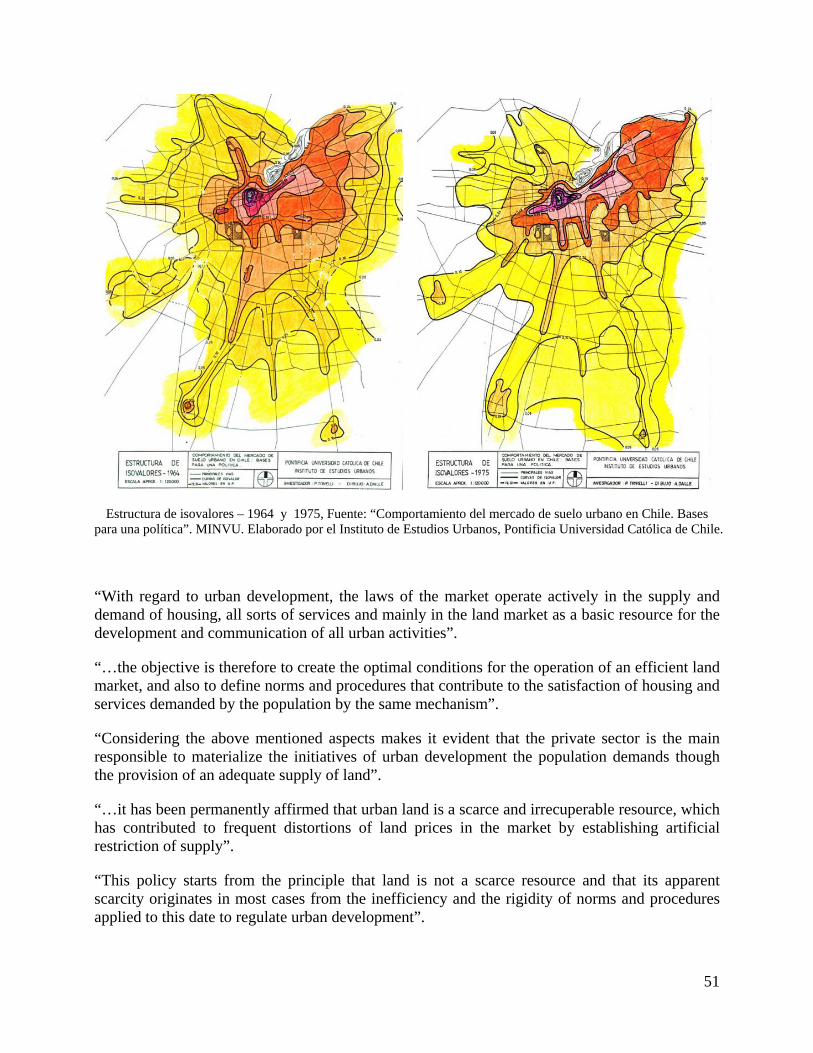
51
Estructura de isovalores – 1964 y 1975, Fuente: “Comportamiento del mercado de suelo urbano en Chile. Bases para una política”. MINVU. Elaborado por el Instituto de Estudios Urbanos, Pontificia Universidad Católica de Chile.
“With regard to urban development, the laws of the market operate actively in the supply and demand of housing, all sorts of services and mainly in the land market as a basic resource for the development and communication of all urban activities”.
“…the objective is therefore to create the optimal conditions for the operation of an efficient land market, and also to define norms and procedures that contribute to the satisfaction of housing and services demanded by the population by the same mechanism”.
“Considering the above mentioned aspects makes it evident that the private sector is the main responsible to materialize the initiatives of urban development the population demands though the provision of an adequate supply of land”.
“…it has been permanently affirmed that urban land is a scarce and irrecuperable resource, which has contributed to frequent distortions of land prices in the market by establishing artificial restriction of supply”.
“This policy starts from the principle that land is not a scarce resource and that its apparent scarcity originates in most cases from the inefficiency and the rigidity of norms and procedures applied to this date to regulate urban development”.
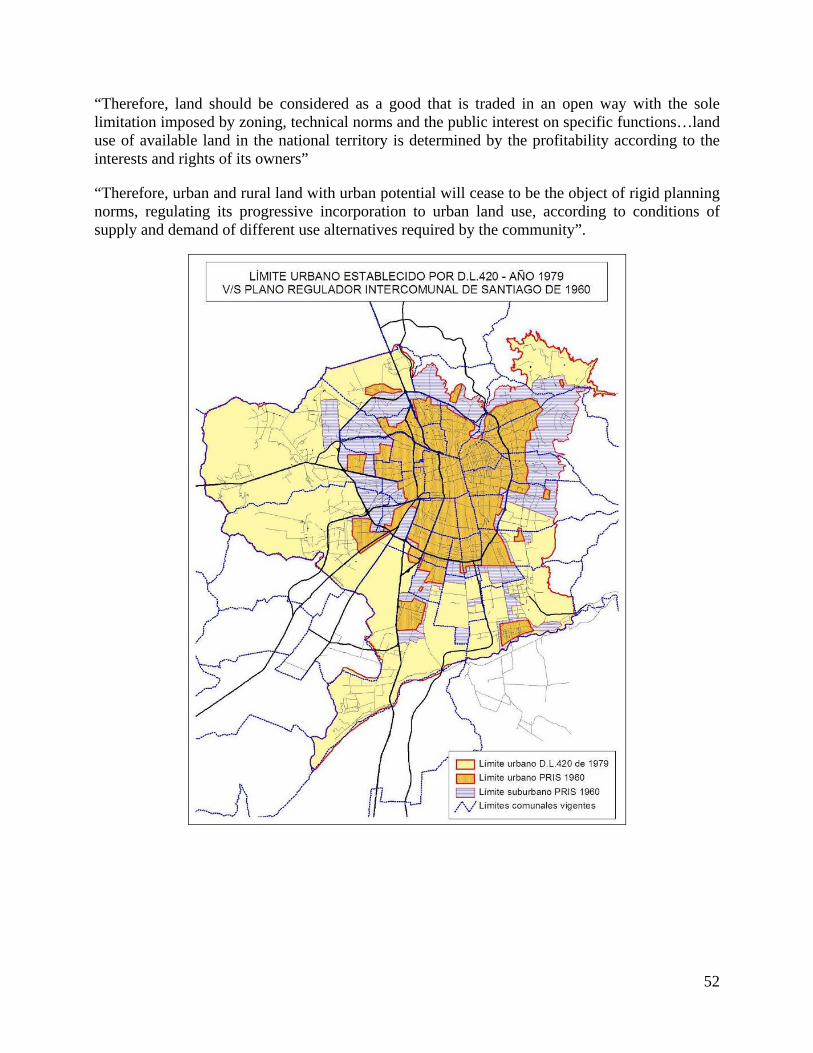
52
“Therefore, land should be considered as a good that is traded in an open way with the sole limitation imposed by zoning, technical norms and the public interest on specific functions…land use of available land in the national territory is determined by the profitability according to the interests and rights of its owners”
“Therefore, urban and rural land with urban potential will cease to be the object of rigid planning norms, regulating its progressive incorporation to urban land use, according to conditions of supply and demand of different use alternatives required by the community”.
53
Summarizing, the new policy is based on two principles:
First, “Urban land is not a scarce resource” and second, “land use is defined by its highest profitability”.
As consequence of this policy document, the Decree 420 of the Ministry of Housing and Urban Development (MINVU) was signed in November 1979, establishing a new city limit for Santiago that defined an area of 100.000 hectares. This was the most important direct policy measure. Also, some other policy measures were adopted with the purpose of stimulating a more fluent operation of the land market: the sales tax on real property was gradually reduced from 8% to 0,5%, the surcharge of the property tax on vacant land was derogated and municipal urban regulations were made more flexible.
The new urban policy also established concepts regarding requirements with respect to the developer’s responsibility on the provision of urban infrastructure, which were never regulated.
At the time, Santiago occupied an estimated urban area of 36.000 hectares and the city limit, that established an area of 40.000 hectares, certainly constituted a constraint for the operation of the land market considering that Santiago demanded some 900 hectares per year.
The new city limit did not constitute much of a limit and provided a scenario where the city could freely expand for a long time, defining land use at the periphery by the competition between urban and rural land uses as was the conceptual framework of the new policy.
Authorities expected that a free land market would provide enough land to satisfy urban development needs, that land prices would fall, thus providing the opportunity of low income households to buy a plot, automatically solving the accumulated housing problem through the market.
As part of the research proposal for Santiago, a measurement of the impact of the 1979 expansion of the city limit on land prices will be carried out.
The data are being collected and processed at present.
According to F. Sabatini30, contrary to what was expected by urban authorities, land prices rose instead of falling31. Sabatini found that in the twelve months going from May 1980 to May 1981 prices rose in all municipalities where building permits concentrated, but also in those where housing construction was slower.
The average price by municipality more than doubled in real terms in one year in most of the municipalities where building permits indicated a strong activity in real estate developments, including those located in the expansion areas of higher income households, but also inner city ones. In the rest of the municipalities, taken as a group, where lower construction activity was 30 F. Sabatini, “Alza y caída de los precios del suelo en Santiago, 1980-1981.” Tesis, Magister en Desarrollo Urbano, Instituto de Estudios Urbanos, Pontificia Universidad Católica de Chile, Agosto 1982. 31 Data of asking prices published in the newspaper El Mercurio in May 1980 and May 1981 when the economy was growing, and also for July and December 1981 when the economy was falling.
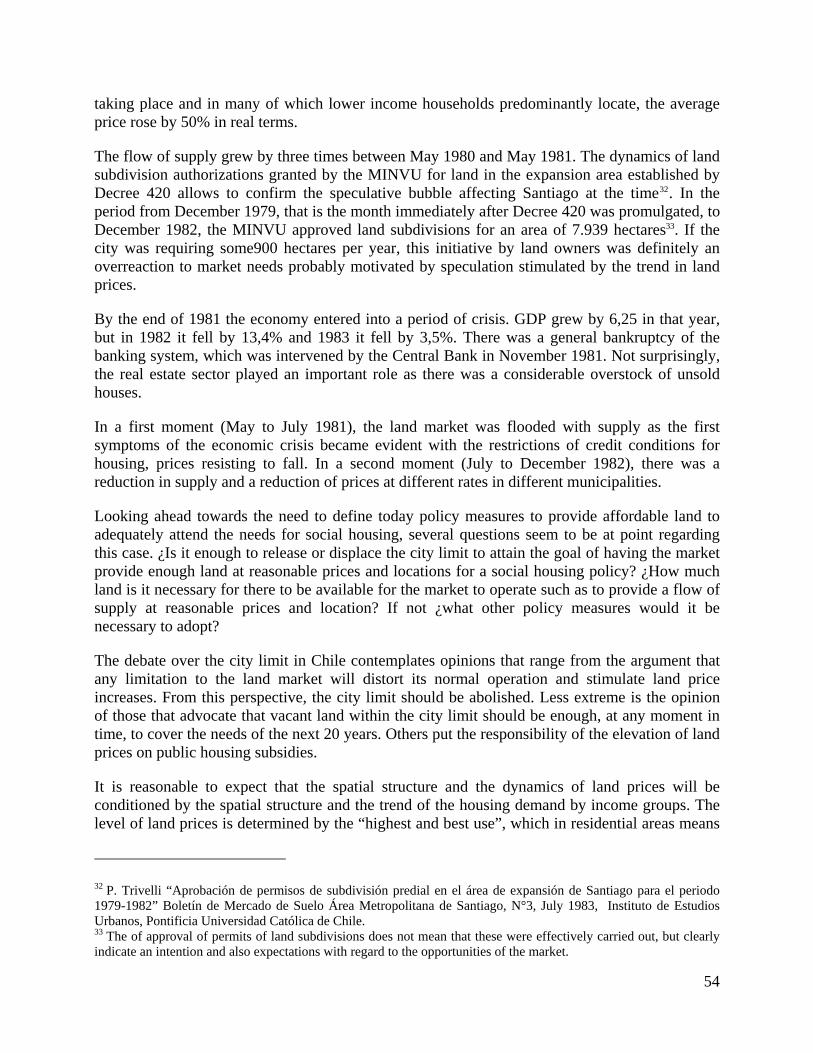
54
taking place and in many of which lower income households predominantly locate, the average price rose by 50% in real terms.
The flow of supply grew by three times between May 1980 and May 1981. The dynamics of land subdivision authorizations granted by the MINVU for land in the expansion area established by Decree 420 allows to confirm the speculative bubble affecting Santiago at the time32. In the period from December 1979, that is the month immediately after Decree 420 was promulgated, to December 1982, the MINVU approved land subdivisions for an area of 7.939 hectares33. If the city was requiring some900 hectares per year, this initiative by land owners was definitely an overreaction to market needs probably motivated by speculation stimulated by the trend in land prices.
By the end of 1981 the economy entered into a period of crisis. GDP grew by 6,25 in that year, but in 1982 it fell by 13,4% and 1983 it fell by 3,5%. There was a general bankruptcy of the banking system, which was intervened by the Central Bank in November 1981. Not surprisingly, the real estate sector played an important role as there was a considerable overstock of unsold houses.
In a first moment (May to July 1981), the land market was flooded with supply as the first symptoms of the economic crisis became evident with the restrictions of credit conditions for housing, prices resisting to fall. In a second moment (July to December 1982), there was a reduction in supply and a reduction of prices at different rates in different municipalities.
Looking ahead towards the need to define today policy measures to provide affordable land to adequately attend the needs for social housing, several questions seem to be at point regarding this case. ¿Is it enough to release or displace the city limit to attain the goal of having the market provide enough land at reasonable prices and locations for a social housing policy? ¿How much land is it necessary for there to be available for the market to operate such as to provide a flow of supply at reasonable prices and location? If not ¿what other policy measures would it be necessary to adopt?
The debate over the city limit in Chile contemplates opinions that range from the argument that any limitation to the land market will distort its normal operation and stimulate land price increases. From this perspective, the city limit should be abolished. Less extreme is the opinion of those that advocate that vacant land within the city limit should be enough, at any moment in time, to cover the needs of the next 20 years. Others put the responsibility of the elevation of land prices on public housing subsidies.
It is reasonable to expect that the spatial structure and the dynamics of land prices will be conditioned by the spatial structure and the trend of the housing demand by income groups. The level of land prices is determined by the “highest and best use”, which in residential areas means
32 P. Trivelli “Aprobación de permisos de subdivisión predial en el área de expansión de Santiago para el periodo 1979-1982” Boletín de Mercado de Suelo Área Metropolitana de Santiago, N°3, July 1983, Instituto de Estudios Urbanos, Pontificia Universidad Católica de Chile. 33 The of approval of permits of land subdivisions does not mean that these were effectively carried out, but clearly indicate an intention and also expectations with regard to the opportunities of the market.

55
that higher income housing can outbid lower income groups and effectively decide where they want to live.
In a city characterized by segregation according to socio economic status of the population, the land market is accordingly segmented in geographic terms. This can be clearly appreciated in the figures regarding the structure of commercial land values in 1979 34 and the set of figures regarding the relative presence of socio economic strata in the urban space of Santiago in 198235 is coherent with that structure.
Estructura de Isovalores 1979
Fuente: Comportamiento del Mercado de suelo urbano en Chile. Bases para una Política. Pablo Trivelli, IEU-PUC
34 Commercial isovalue curves were built on the basis of fiscal values for which abundant observations existed in order to trace them in the urban area. The level of this isovalue curves was later on established on the basis of commercial values originating on asking prices published in newspaper ads and commercial assessments elaborated by the banking system in order to support credit approvals. 35 Socio economic strata maps were buit utilizing the census. A first approximation was elaborated on the basis of occupation and education, and the results were later filtered by housing and living standards information.
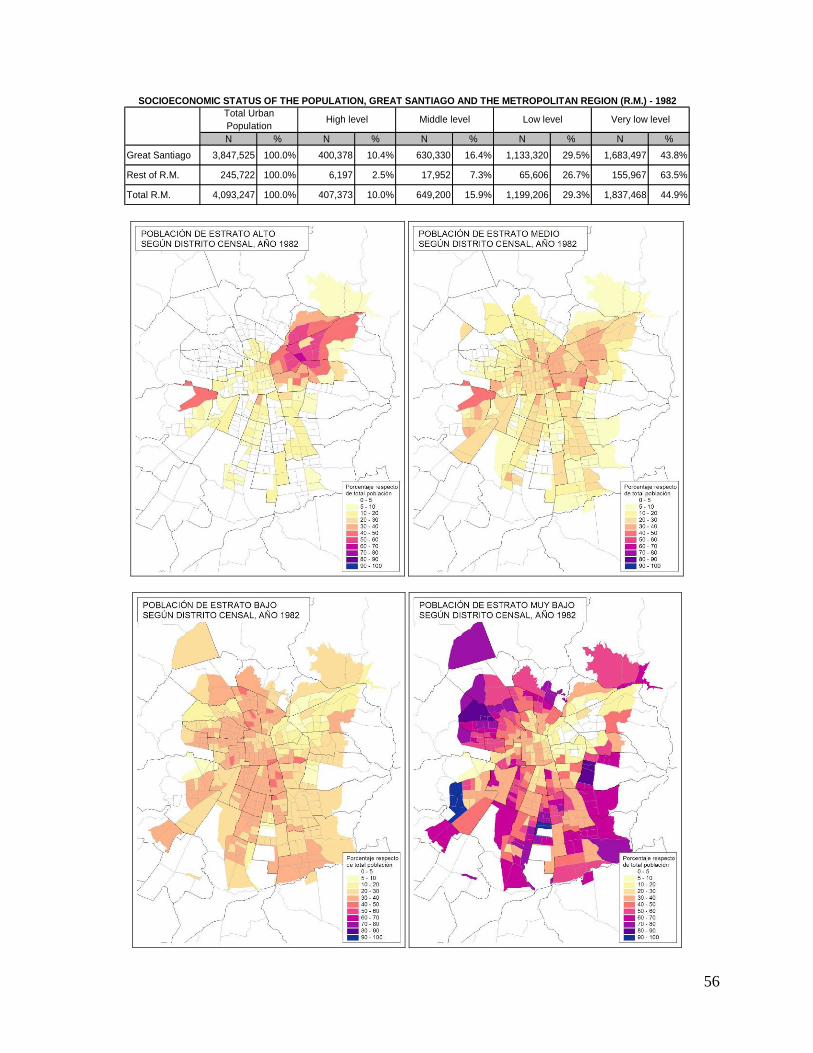
56
N % N % N % N % N %Great Santiago 3,847,525 100.0% 400,378 10.4% 630,330 16.4% 1,133,320 29.5% 1,683,497 43.8%
Rest of R.M. 245,722 100.0% 6,197 2.5% 17,952 7.3% 65,606 26.7% 155,967 63.5%
Total R.M. 4,093,247 100.0% 407,373 10.0% 649,200 15.9% 1,199,206 29.3% 1,837,468 44.9%
Total Urban Population
SOCIOECONOMIC STATUS OF THE POPULATION, GREAT SANTIAGO AND THE METROPOLITAN REGION (R.M.) - 1982
High level Middle level Low level Very low level
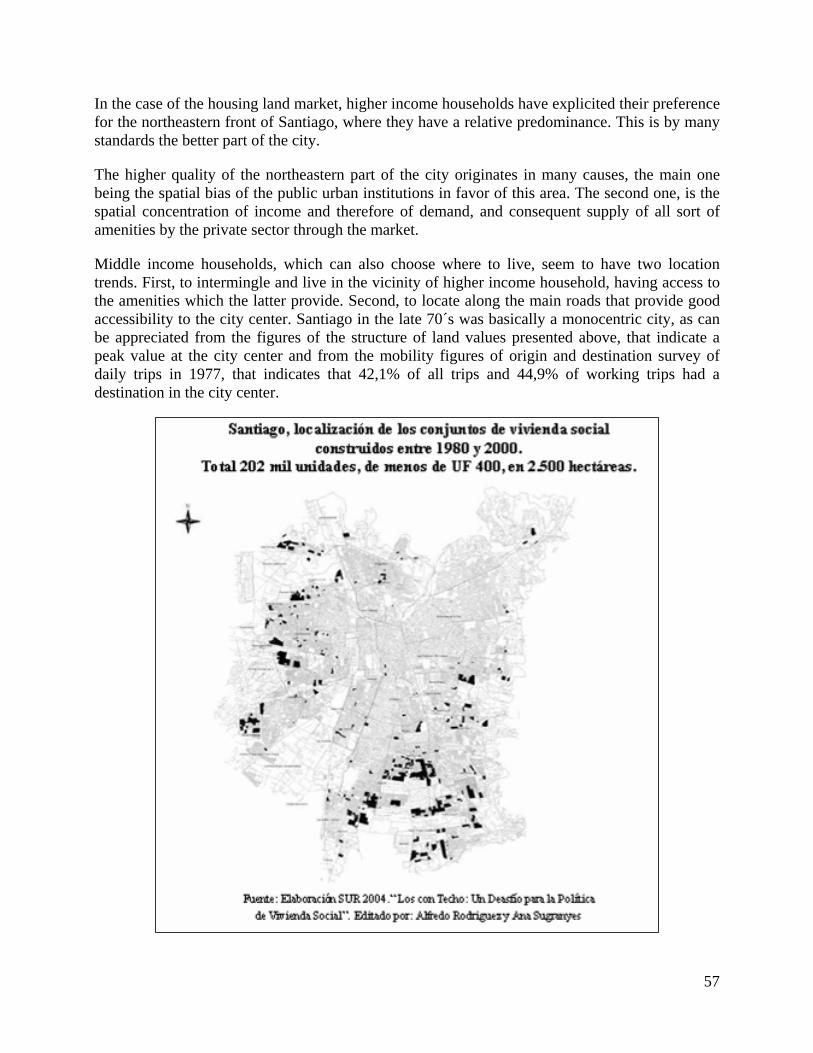
57
In the case of the housing land market, higher income households have explicited their preference for the northeastern front of Santiago, where they have a relative predominance. This is by many standards the better part of the city.
The higher quality of the northeastern part of the city originates in many causes, the main one being the spatial bias of the public urban institutions in favor of this area. The second one, is the spatial concentration of income and therefore of demand, and consequent supply of all sort of amenities by the private sector through the market.
Middle income households, which can also choose where to live, seem to have two location trends. First, to intermingle and live in the vicinity of higher income household, having access to the amenities which the latter provide. Second, to locate along the main roads that provide good accessibility to the city center. Santiago in the late 70´s was basically a monocentric city, as can be appreciated from the figures of the structure of land values presented above, that indicate a peak value at the city center and from the mobility figures of origin and destination survey of daily trips in 1977, that indicates that 42,1% of all trips and 44,9% of working trips had a destination in the city center.
58
As will be seen later, the increase in the land price in the northeastern front in the late 70´s made it increasingly difficult for middle strata to continue to locate in that part of the city therefore inducing the choice of new locations.
Low and very low income households do not have the freedom to choose where to live as they depend on the location of social public housing. The logic of it being the locations with lowest possible land prices, as this is the single most important variable in the budget of a social dwelling. Urban land with the lowest prices is by definition the worst land in terms of urban conditions. This is usually the case of land in the urban fringe where already low and very low income households have been settled, often characterized by difficulties of accessibility, low quality or inexistence of urban services, scarce urban amenities, municipalities with very low budgets, and scarce or low quality services provided by the private sector, as the level of income is low or very low and the spatial reach of demand is limited.
The quest to maximize the number of housing units supplied by public programs led to locations with low land prices and an increasing number of houses in a project, predominantly homogeneous units in order to reduce construction cost by economies of scale.
b) Rural land fractioning; Decree 3516 of the Ministry of Agriculture.
Although it is not part of the urban policy, it is important to mention Decree 3516 of 1980 of the Ministry of Agriculture, which modified subdivision norms of rural land with the purpose of allowing peasants to have access to small parcels of a minimum size of 5.000 m2, thereby reducing the existing minimum rural lot size of 8 hectares. The decree is categorical in affirming that land use must continue to be agricultural, establishing severe penalties to transgressors.
Ever since its approval, this legal norm has been used as a legal loophole to fraction rural land into 5.000 m2 lots denominated “parcelas de agrado”. Most of the central valley where Santiago is located has been fractioned, at least in formal terms by obtain subdivision permits, as can be seen in the following figure corresponding to the province of Chacabuco, located immediately north of Santiago. This legal loophole provided a way to satisfy a real and existing demand of small lots of rural land, be it as a weekend residence or as a permanent one for those that long for a life closer to a natural environment.
No government has even attempted to enforce the conditions established in this decree. After many years of indulgence, the demand of many individuals has been satisfied, but the consequences of this low density developments without any rules or regulations of any sort have accumulated severe problems for the same people, which now look for public authorities for a solution.
In terms of this research project, this is an important phenomenon, because land prices in the outer border of the city limit are not determined by agricultural activities, but by the potential use as a “parcela de agrado”. Let it be mentioned that the most profitable agricultural exploitation of land in the central valley, given soil and climate conditions, could pay up to some US$ 30.000 per hectare. By contrast, the bottom price of a “parcela de agrado” is in the order of US$ 60.000, reaching up to $400.000 per hectare in the case of the more sophisticated ones, which ensure the provision of services and provide amenities such as club house, playgrounds, sports facilities, and private security service in gated communities.
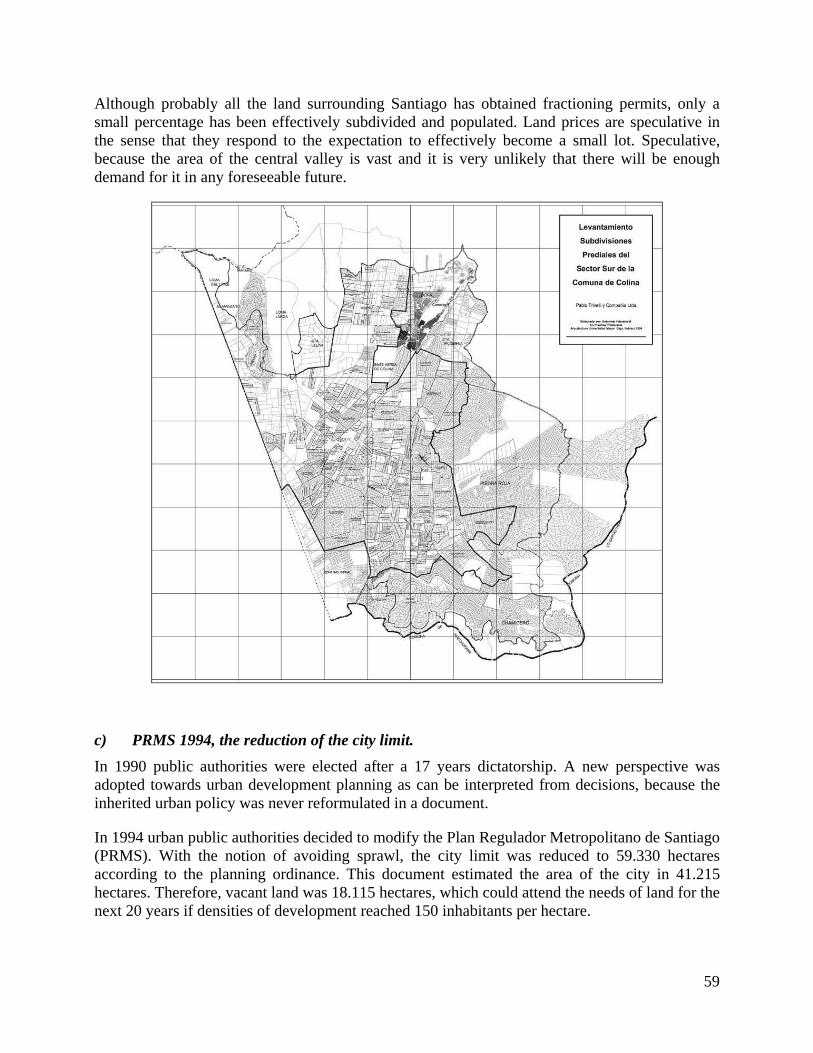
59
Although probably all the land surrounding Santiago has obtained fractioning permits, only a small percentage has been effectively subdivided and populated. Land prices are speculative in the sense that they respond to the expectation to effectively become a small lot. Speculative, because the area of the central valley is vast and it is very unlikely that there will be enough demand for it in any foreseeable future.
c) PRMS 1994, the reduction of the city limit. In 1990 public authorities were elected after a 17 years dictatorship. A new perspective was adopted towards urban development planning as can be interpreted from decisions, because the inherited urban policy was never reformulated in a document.
In 1994 urban public authorities decided to modify the Plan Regulador Metropolitano de Santiago (PRMS). With the notion of avoiding sprawl, the city limit was reduced to 59.330 hectares according to the planning ordinance. This document estimated the area of the city in 41.215 hectares. Therefore, vacant land was 18.115 hectares, which could attend the needs of land for the next 20 years if densities of development reached 150 inhabitants per hectare.
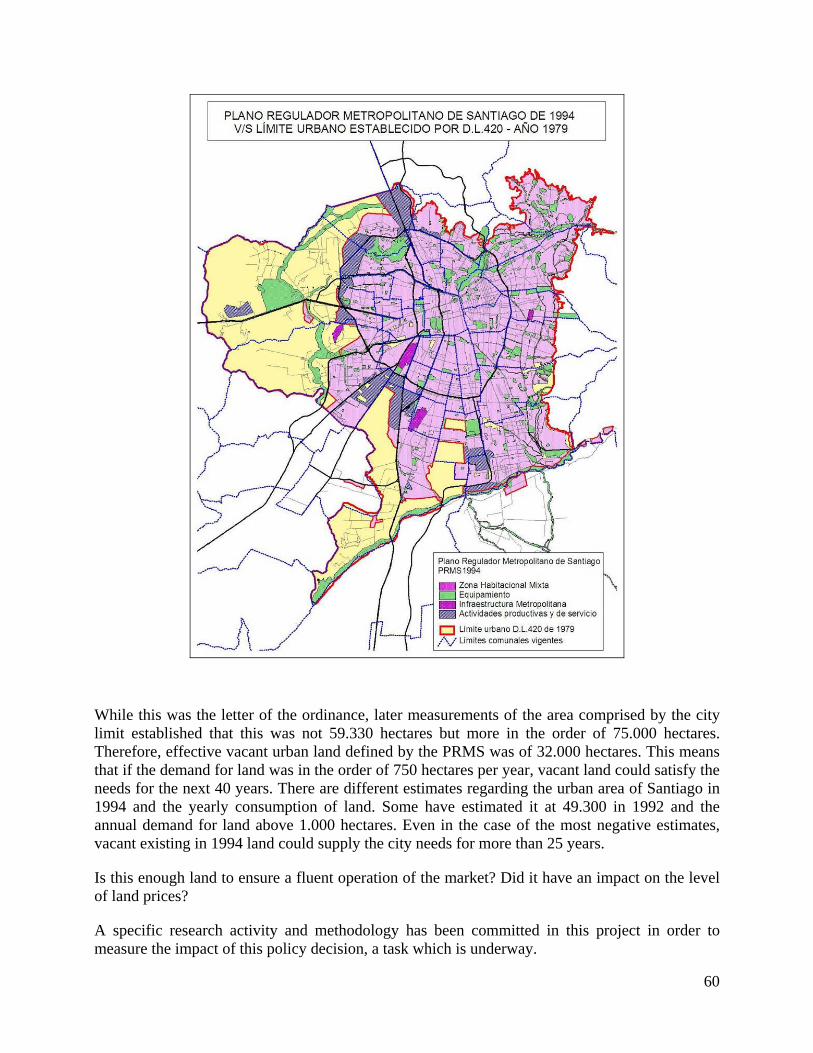
60
While this was the letter of the ordinance, later measurements of the area comprised by the city limit established that this was not 59.330 hectares but more in the order of 75.000 hectares. Therefore, effective vacant urban land defined by the PRMS was of 32.000 hectares. This means that if the demand for land was in the order of 750 hectares per year, vacant land could satisfy the needs for the next 40 years. There are different estimates regarding the urban area of Santiago in 1994 and the yearly consumption of land. Some have estimated it at 49.300 in 1992 and the annual demand for land above 1.000 hectares. Even in the case of the most negative estimates, vacant existing in 1994 land could supply the city needs for more than 25 years.
Is this enough land to ensure a fluent operation of the market? Did it have an impact on the level of land prices?
A specific research activity and methodology has been committed in this project in order to measure the impact of this policy decision, a task which is underway.
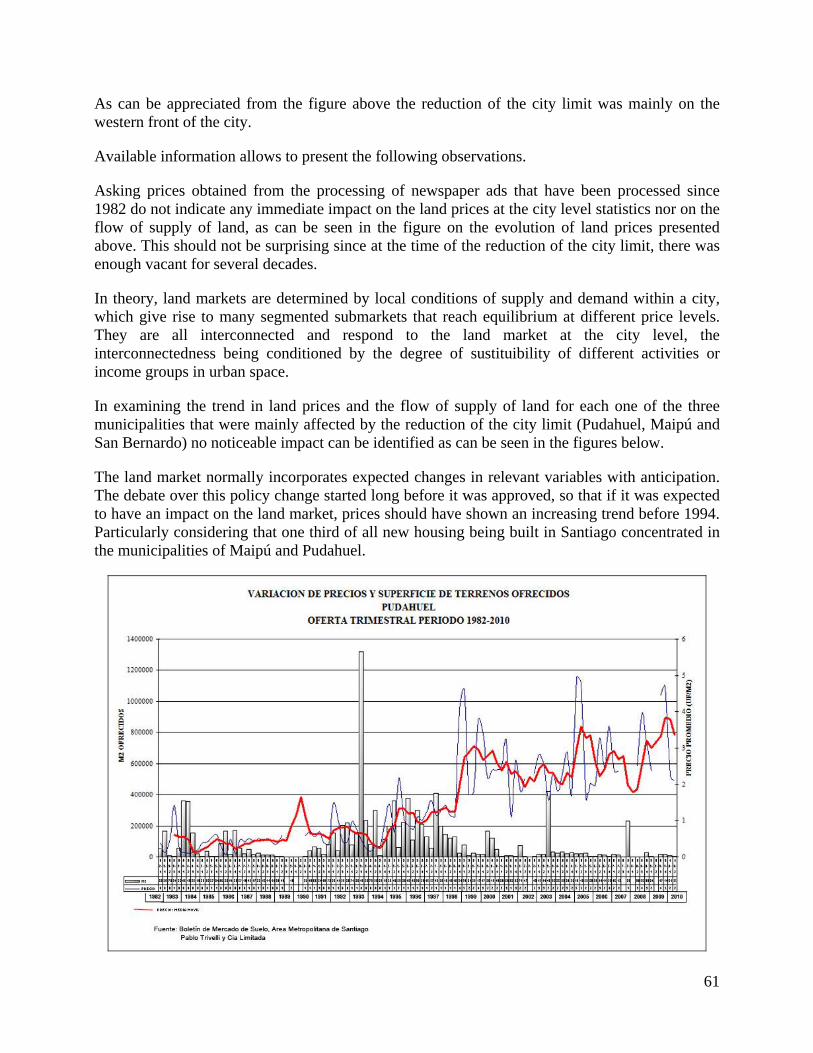
61
As can be appreciated from the figure above the reduction of the city limit was mainly on the western front of the city.
Available information allows to present the following observations.
Asking prices obtained from the processing of newspaper ads that have been processed since 1982 do not indicate any immediate impact on the land prices at the city level statistics nor on the flow of supply of land, as can be seen in the figure on the evolution of land prices presented above. This should not be surprising since at the time of the reduction of the city limit, there was enough vacant for several decades.
In theory, land markets are determined by local conditions of supply and demand within a city, which give rise to many segmented submarkets that reach equilibrium at different price levels. They are all interconnected and respond to the land market at the city level, the interconnectedness being conditioned by the degree of sustituibility of different activities or income groups in urban space.
In examining the trend in land prices and the flow of supply of land for each one of the three municipalities that were mainly affected by the reduction of the city limit (Pudahuel, Maipú and San Bernardo) no noticeable impact can be identified as can be seen in the figures below.
The land market normally incorporates expected changes in relevant variables with anticipation. The debate over this policy change started long before it was approved, so that if it was expected to have an impact on the land market, prices should have shown an increasing trend before 1994. Particularly considering that one third of all new housing being built in Santiago concentrated in the municipalities of Maipú and Pudahuel.
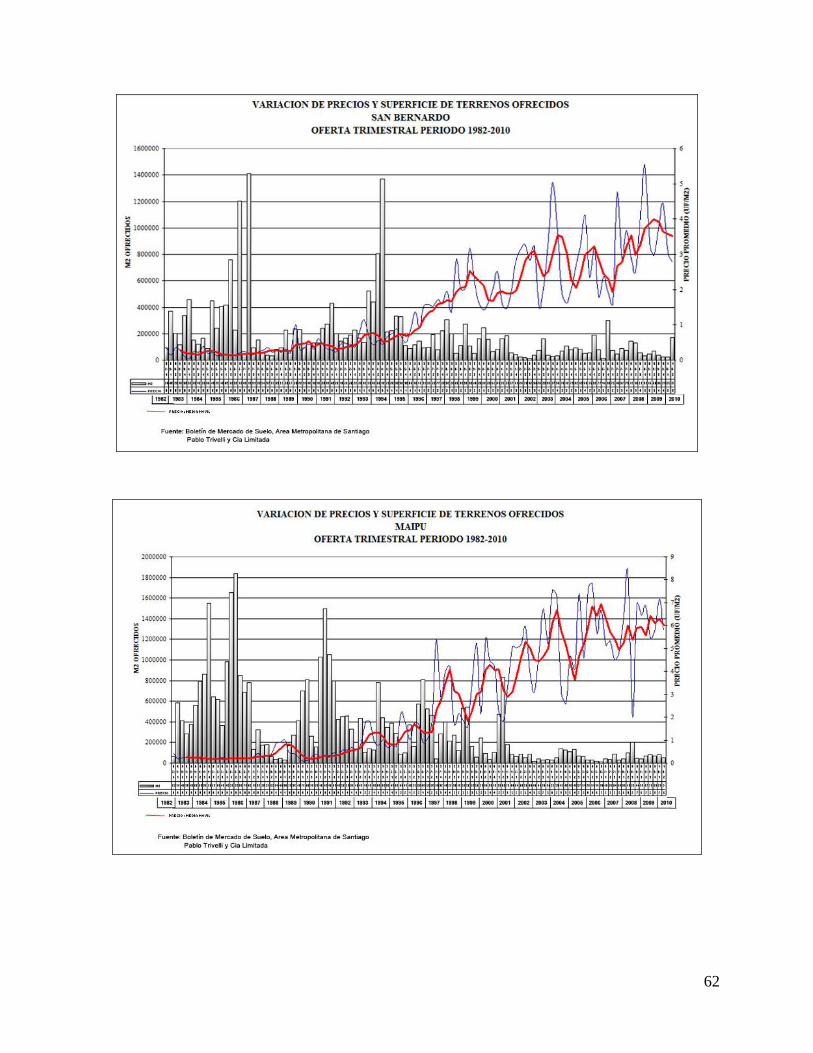
62
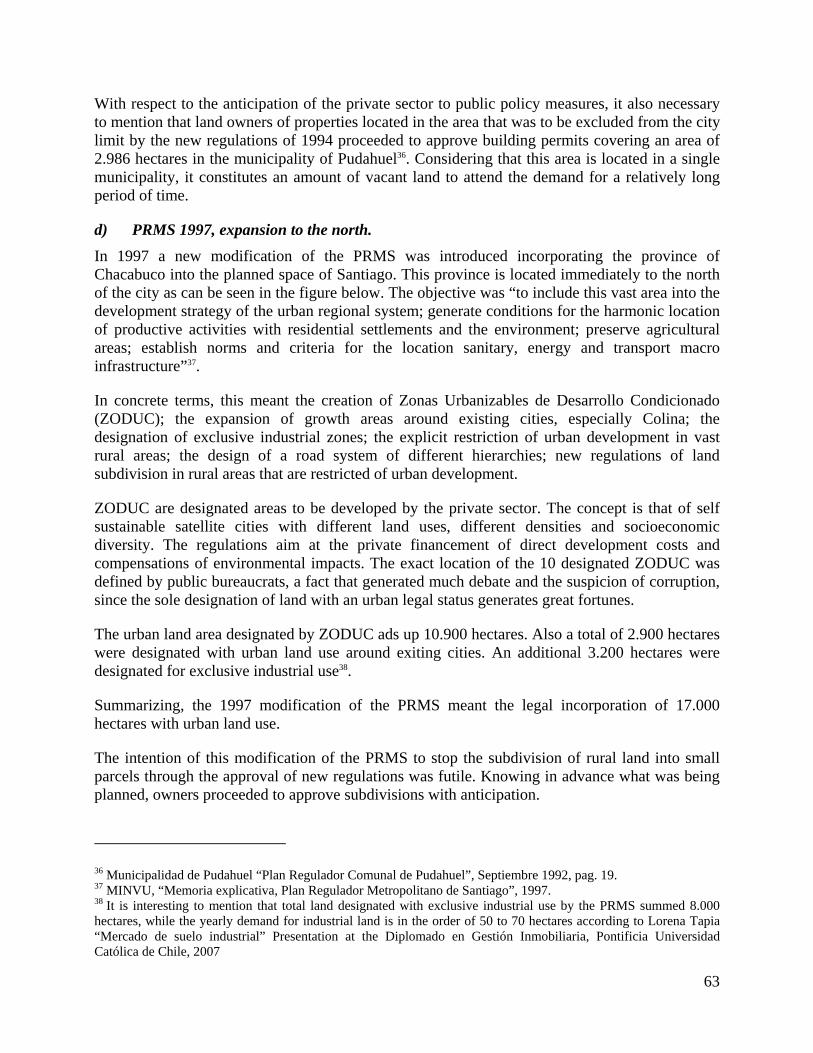
63
With respect to the anticipation of the private sector to public policy measures, it also necessary to mention that land owners of properties located in the area that was to be excluded from the city limit by the new regulations of 1994 proceeded to approve building permits covering an area of 2.986 hectares in the municipality of Pudahuel36. Considering that this area is located in a single municipality, it constitutes an amount of vacant land to attend the demand for a relatively long period of time.
d) PRMS 1997, expansion to the north. In 1997 a new modification of the PRMS was introduced incorporating the province of Chacabuco into the planned space of Santiago. This province is located immediately to the north of the city as can be seen in the figure below. The objective was “to include this vast area into the development strategy of the urban regional system; generate conditions for the harmonic location of productive activities with residential settlements and the environment; preserve agricultural areas; establish norms and criteria for the location sanitary, energy and transport macro infrastructure”37.
In concrete terms, this meant the creation of Zonas Urbanizables de Desarrollo Condicionado (ZODUC); the expansion of growth areas around existing cities, especially Colina; the designation of exclusive industrial zones; the explicit restriction of urban development in vast rural areas; the design of a road system of different hierarchies; new regulations of land subdivision in rural areas that are restricted of urban development.
ZODUC are designated areas to be developed by the private sector. The concept is that of self sustainable satellite cities with different land uses, different densities and socioeconomic diversity. The regulations aim at the private financement of direct development costs and compensations of environmental impacts. The exact location of the 10 designated ZODUC was defined by public bureaucrats, a fact that generated much debate and the suspicion of corruption, since the sole designation of land with an urban legal status generates great fortunes.
The urban land area designated by ZODUC ads up 10.900 hectares. Also a total of 2.900 hectares were designated with urban land use around exiting cities. An additional 3.200 hectares were designated for exclusive industrial use38.
Summarizing, the 1997 modification of the PRMS meant the legal incorporation of 17.000 hectares with urban land use.
The intention of this modification of the PRMS to stop the subdivision of rural land into small parcels through the approval of new regulations was futile. Knowing in advance what was being planned, owners proceeded to approve subdivisions with anticipation.
36 Municipalidad de Pudahuel “Plan Regulador Comunal de Pudahuel”, Septiembre 1992, pag. 19. 37 MINVU, “Memoria explicativa, Plan Regulador Metropolitano de Santiago”, 1997. 38 It is interesting to mention that total land designated with exclusive industrial use by the PRMS summed 8.000 hectares, while the yearly demand for industrial land is in the order of 50 to 70 hectares according to Lorena Tapia “Mercado de suelo industrial” Presentation at the Diplomado en Gestión Inmobiliaria, Pontificia Universidad Católica de Chile, 2007
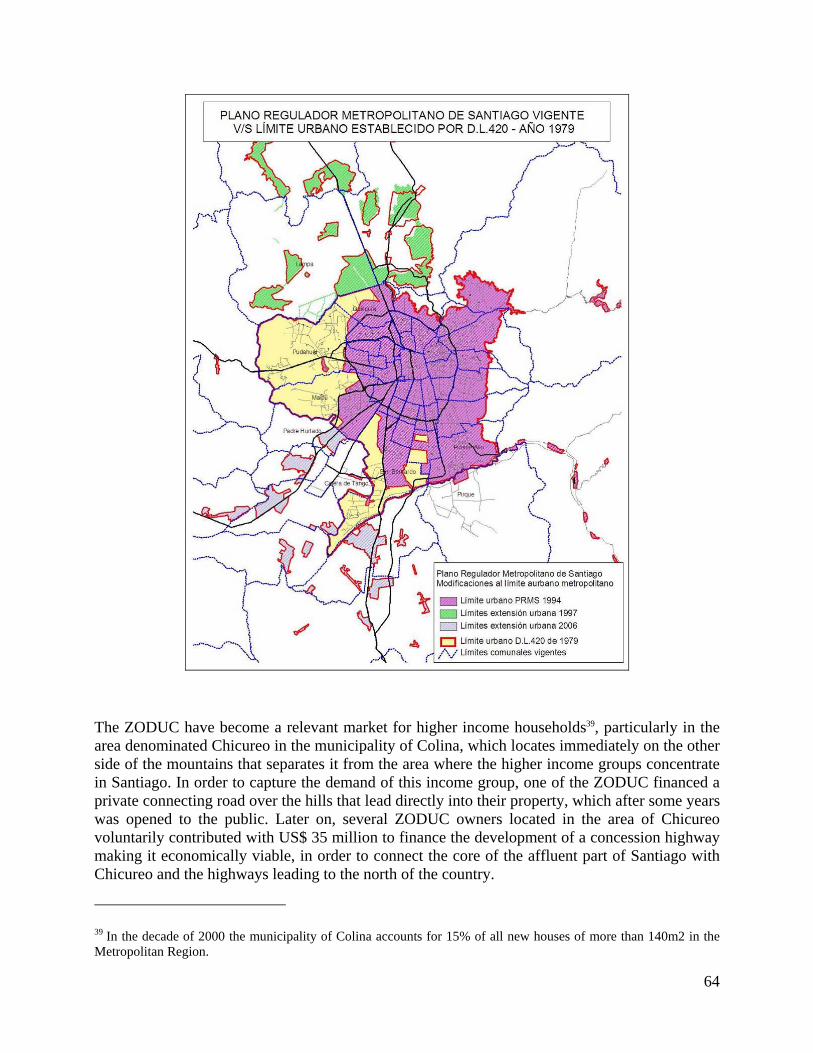
64
The ZODUC have become a relevant market for higher income households39, particularly in the area denominated Chicureo in the municipality of Colina, which locates immediately on the other side of the mountains that separates it from the area where the higher income groups concentrate in Santiago. In order to capture the demand of this income group, one of the ZODUC financed a private connecting road over the hills that lead directly into their property, which after some years was opened to the public. Later on, several ZODUC owners located in the area of Chicureo voluntarily contributed with US$ 35 million to finance the development of a concession highway making it economically viable, in order to connect the core of the affluent part of Santiago with Chicureo and the highways leading to the north of the country.
39 In the decade of 2000 the municipality of Colina accounts for 15% of all new houses of more than 140m2 in the Metropolitan Region.
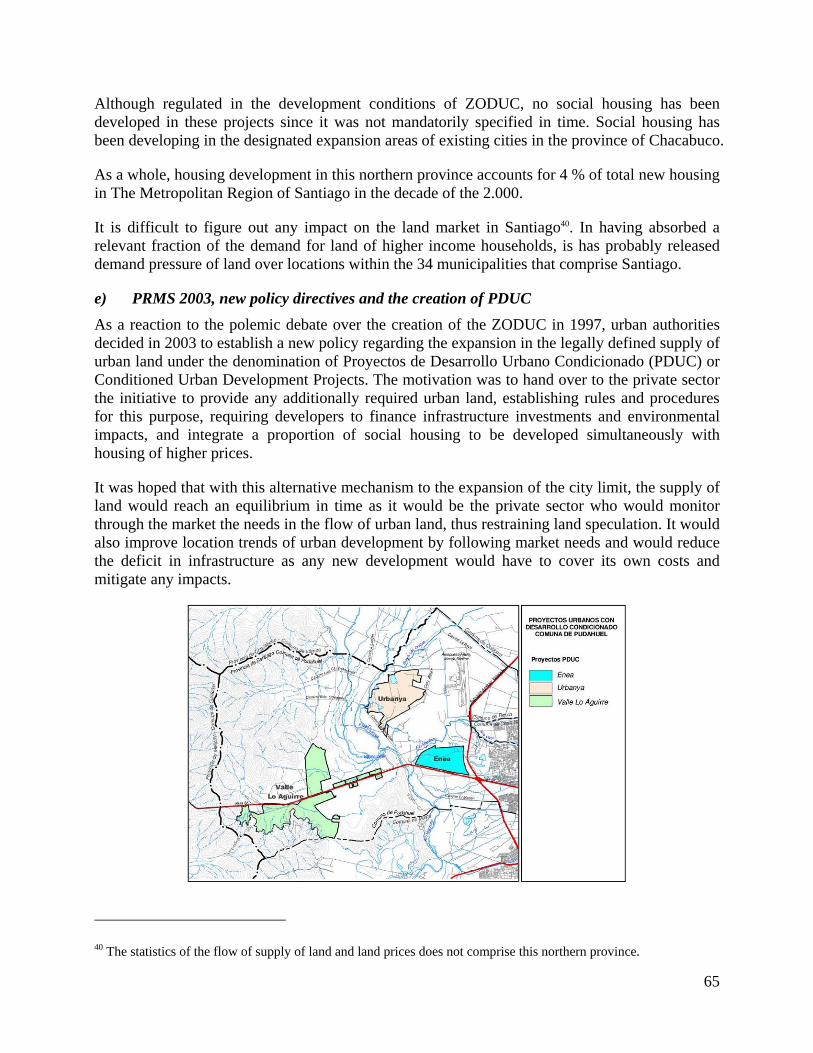
65
Although regulated in the development conditions of ZODUC, no social housing has been developed in these projects since it was not mandatorily specified in time. Social housing has been developing in the designated expansion areas of existing cities in the province of Chacabuco.
As a whole, housing development in this northern province accounts for 4 % of total new housing in The Metropolitan Region of Santiago in the decade of the 2.000.
It is difficult to figure out any impact on the land market in Santiago40. In having absorbed a relevant fraction of the demand for land of higher income households, is has probably released demand pressure of land over locations within the 34 municipalities that comprise Santiago.
e) PRMS 2003, new policy directives and the creation of PDUC As a reaction to the polemic debate over the creation of the ZODUC in 1997, urban authorities decided in 2003 to establish a new policy regarding the expansion in the legally defined supply of urban land under the denomination of Proyectos de Desarrollo Urbano Condicionado (PDUC) or Conditioned Urban Development Projects. The motivation was to hand over to the private sector the initiative to provide any additionally required urban land, establishing rules and procedures for this purpose, requiring developers to finance infrastructure investments and environmental impacts, and integrate a proportion of social housing to be developed simultaneously with housing of higher prices.
It was hoped that with this alternative mechanism to the expansion of the city limit, the supply of land would reach an equilibrium in time as it would be the private sector who would monitor through the market the needs in the flow of urban land, thus restraining land speculation. It would also improve location trends of urban development by following market needs and would reduce the deficit in infrastructure as any new development would have to cover its own costs and mitigate any impacts.
40 The statistics of the flow of supply of land and land prices does not comprise this northern province.
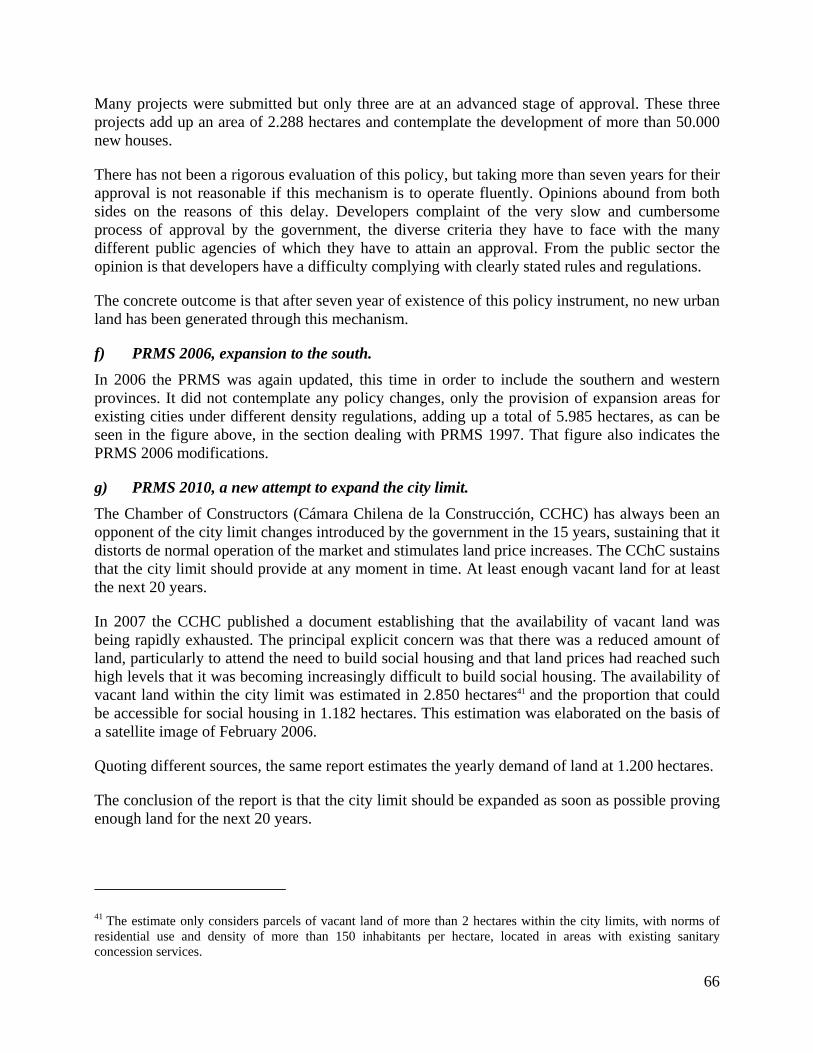
66
Many projects were submitted but only three are at an advanced stage of approval. These three projects add up an area of 2.288 hectares and contemplate the development of more than 50.000 new houses.
There has not been a rigorous evaluation of this policy, but taking more than seven years for their approval is not reasonable if this mechanism is to operate fluently. Opinions abound from both sides on the reasons of this delay. Developers complaint of the very slow and cumbersome process of approval by the government, the diverse criteria they have to face with the many different public agencies of which they have to attain an approval. From the public sector the opinion is that developers have a difficulty complying with clearly stated rules and regulations.
The concrete outcome is that after seven year of existence of this policy instrument, no new urban land has been generated through this mechanism.
f) PRMS 2006, expansion to the south.
In 2006 the PRMS was again updated, this time in order to include the southern and western provinces. It did not contemplate any policy changes, only the provision of expansion areas for existing cities under different density regulations, adding up a total of 5.985 hectares, as can be seen in the figure above, in the section dealing with PRMS 1997. That figure also indicates the PRMS 2006 modifications.
g) PRMS 2010, a new attempt to expand the city limit. The Chamber of Constructors (Cámara Chilena de la Construcción, CCHC) has always been an opponent of the city limit changes introduced by the government in the 15 years, sustaining that it distorts de normal operation of the market and stimulates land price increases. The CChC sustains that the city limit should provide at any moment in time. At least enough vacant land for at least the next 20 years.
In 2007 the CCHC published a document establishing that the availability of vacant land was being rapidly exhausted. The principal explicit concern was that there was a reduced amount of land, particularly to attend the need to build social housing and that land prices had reached such high levels that it was becoming increasingly difficult to build social housing. The availability of vacant land within the city limit was estimated in 2.850 hectares41 and the proportion that could be accessible for social housing in 1.182 hectares. This estimation was elaborated on the basis of a satellite image of February 2006.
Quoting different sources, the same report estimates the yearly demand of land at 1.200 hectares.
The conclusion of the report is that the city limit should be expanded as soon as possible proving enough land for the next 20 years.
41 The estimate only considers parcels of vacant land of more than 2 hectares within the city limits, with norms of residential use and density of more than 150 inhabitants per hectare, located in areas with existing sanitary concession services.
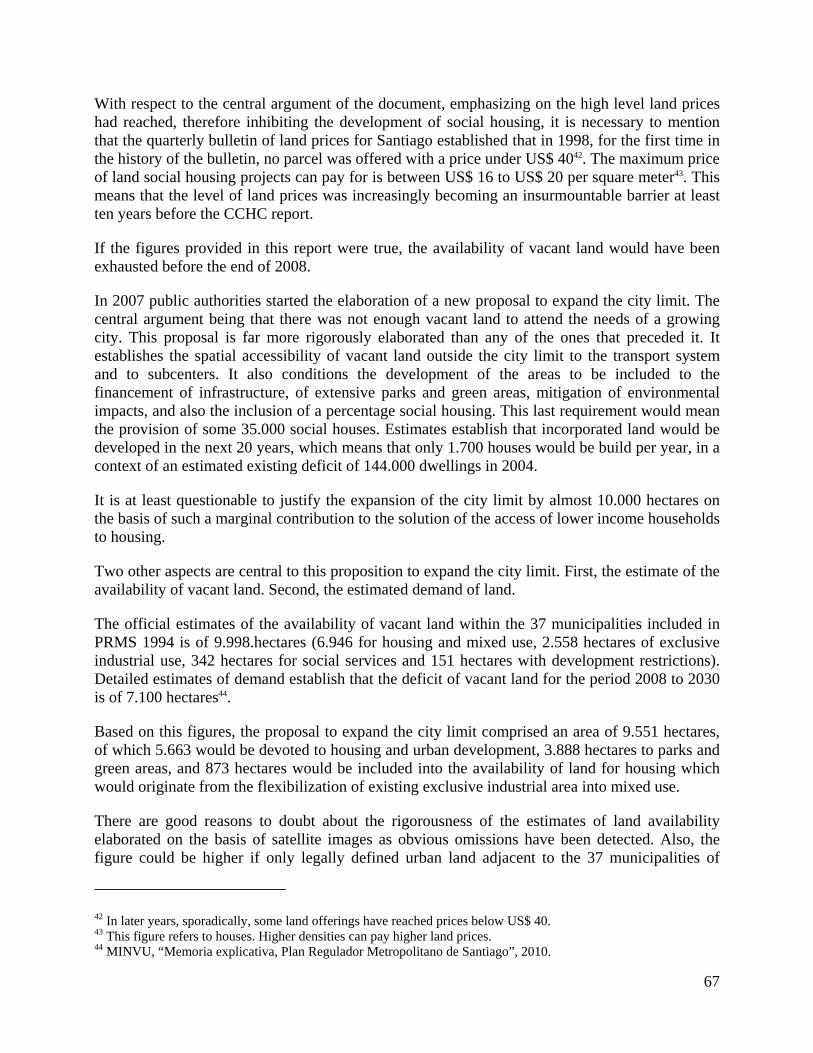
67
With respect to the central argument of the document, emphasizing on the high level land prices had reached, therefore inhibiting the development of social housing, it is necessary to mention that the quarterly bulletin of land prices for Santiago established that in 1998, for the first time in the history of the bulletin, no parcel was offered with a price under US$ 4042. The maximum price of land social housing projects can pay for is between US$ 16 to US$ 20 per square meter43. This means that the level of land prices was increasingly becoming an insurmountable barrier at least ten years before the CCHC report.
If the figures provided in this report were true, the availability of vacant land would have been exhausted before the end of 2008.
In 2007 public authorities started the elaboration of a new proposal to expand the city limit. The central argument being that there was not enough vacant land to attend the needs of a growing city. This proposal is far more rigorously elaborated than any of the ones that preceded it. It establishes the spatial accessibility of vacant land outside the city limit to the transport system and to subcenters. It also conditions the development of the areas to be included to the financement of infrastructure, of extensive parks and green areas, mitigation of environmental impacts, and also the inclusion of a percentage social housing. This last requirement would mean the provision of some 35.000 social houses. Estimates establish that incorporated land would be developed in the next 20 years, which means that only 1.700 houses would be build per year, in a context of an estimated existing deficit of 144.000 dwellings in 2004.
It is at least questionable to justify the expansion of the city limit by almost 10.000 hectares on the basis of such a marginal contribution to the solution of the access of lower income households to housing.
Two other aspects are central to this proposition to expand the city limit. First, the estimate of the availability of vacant land. Second, the estimated demand of land.
The official estimates of the availability of vacant land within the 37 municipalities included in PRMS 1994 is of 9.998.hectares (6.946 for housing and mixed use, 2.558 hectares of exclusive industrial use, 342 hectares for social services and 151 hectares with development restrictions). Detailed estimates of demand establish that the deficit of vacant land for the period 2008 to 2030 is of 7.100 hectares44.
Based on this figures, the proposal to expand the city limit comprised an area of 9.551 hectares, of which 5.663 would be devoted to housing and urban development, 3.888 hectares to parks and green areas, and 873 hectares would be included into the availability of land for housing which would originate from the flexibilization of existing exclusive industrial area into mixed use.
There are good reasons to doubt about the rigorousness of the estimates of land availability elaborated on the basis of satellite images as obvious omissions have been detected. Also, the figure could be higher if only legally defined urban land adjacent to the 37 municipalities of
42 In later years, sporadically, some land offerings have reached prices below US$ 40. 43 This figure refers to houses. Higher densities can pay higher land prices. 44 MINVU, “Memoria explicativa, Plan Regulador Metropolitano de Santiago”, 2010.
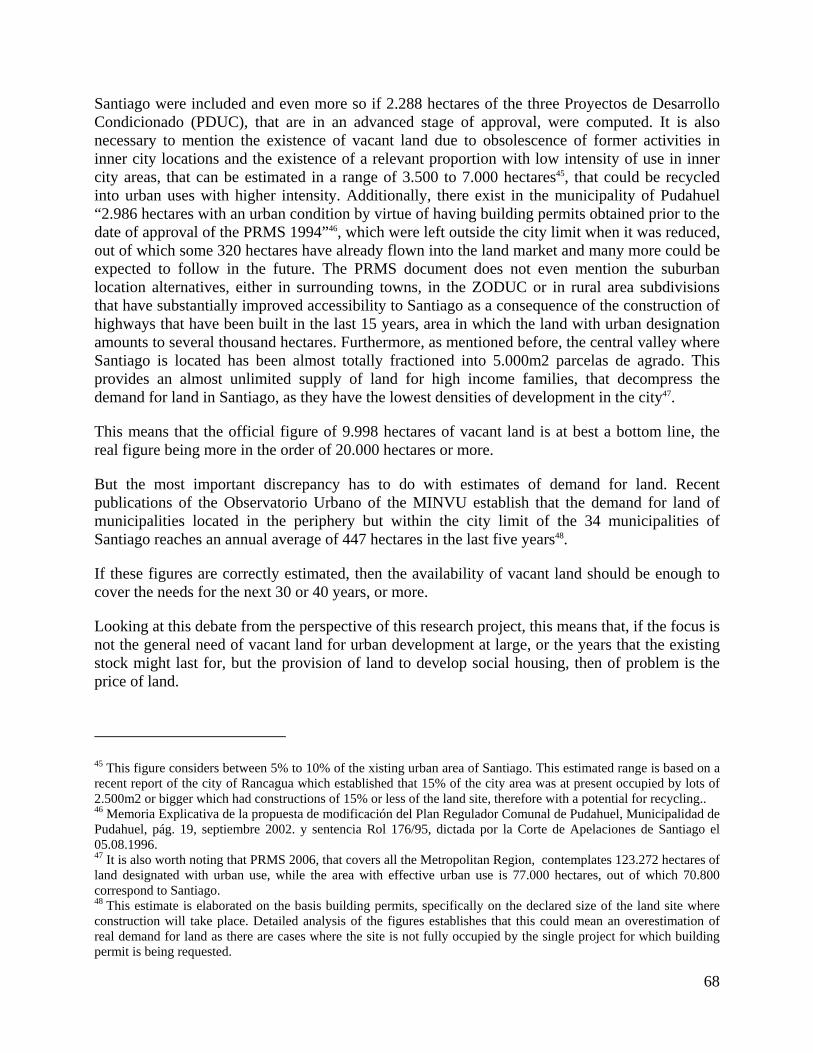
68
Santiago were included and even more so if 2.288 hectares of the three Proyectos de Desarrollo Condicionado (PDUC), that are in an advanced stage of approval, were computed. It is also necessary to mention the existence of vacant land due to obsolescence of former activities in inner city locations and the existence of a relevant proportion with low intensity of use in inner city areas, that can be estimated in a range of 3.500 to 7.000 hectares45, that could be recycled into urban uses with higher intensity. Additionally, there exist in the municipality of Pudahuel “2.986 hectares with an urban condition by virtue of having building permits obtained prior to the date of approval of the PRMS 1994”46, which were left outside the city limit when it was reduced, out of which some 320 hectares have already flown into the land market and many more could be expected to follow in the future. The PRMS document does not even mention the suburban location alternatives, either in surrounding towns, in the ZODUC or in rural area subdivisions that have substantially improved accessibility to Santiago as a consequence of the construction of highways that have been built in the last 15 years, area in which the land with urban designation amounts to several thousand hectares. Furthermore, as mentioned before, the central valley where Santiago is located has been almost totally fractioned into 5.000m2 parcelas de agrado. This provides an almost unlimited supply of land for high income families, that decompress the demand for land in Santiago, as they have the lowest densities of development in the city47.
This means that the official figure of 9.998 hectares of vacant land is at best a bottom line, the real figure being more in the order of 20.000 hectares or more.
But the most important discrepancy has to do with estimates of demand for land. Recent publications of the Observatorio Urbano of the MINVU establish that the demand for land of municipalities located in the periphery but within the city limit of the 34 municipalities of Santiago reaches an annual average of 447 hectares in the last five years48.
If these figures are correctly estimated, then the availability of vacant land should be enough to cover the needs for the next 30 or 40 years, or more.
Looking at this debate from the perspective of this research project, this means that, if the focus is not the general need of vacant land for urban development at large, or the years that the existing stock might last for, but the provision of land to develop social housing, then of problem is the price of land.
45 This figure considers between 5% to 10% of the xisting urban area of Santiago. This estimated range is based on a recent report of the city of Rancagua which established that 15% of the city area was at present occupied by lots of 2.500m2 or bigger which had constructions of 15% or less of the land site, therefore with a potential for recycling.. 46 Memoria Explicativa de la propuesta de modificación del Plan Regulador Comunal de Pudahuel, Municipalidad de Pudahuel, pág. 19, septiembre 2002. y sentencia Rol 176/95, dictada por la Corte de Apelaciones de Santiago el 05.08.1996. 47 It is also worth noting that PRMS 2006, that covers all the Metropolitan Region, contemplates 123.272 hectares of land designated with urban use, while the area with effective urban use is 77.000 hectares, out of which 70.800 correspond to Santiago. 48 This estimate is elaborated on the basis building permits, specifically on the declared size of the land site where construction will take place. Detailed analysis of the figures establishes that this could mean an overestimation of real demand for land as there are cases where the site is not fully occupied by the single project for which building permit is being requested.
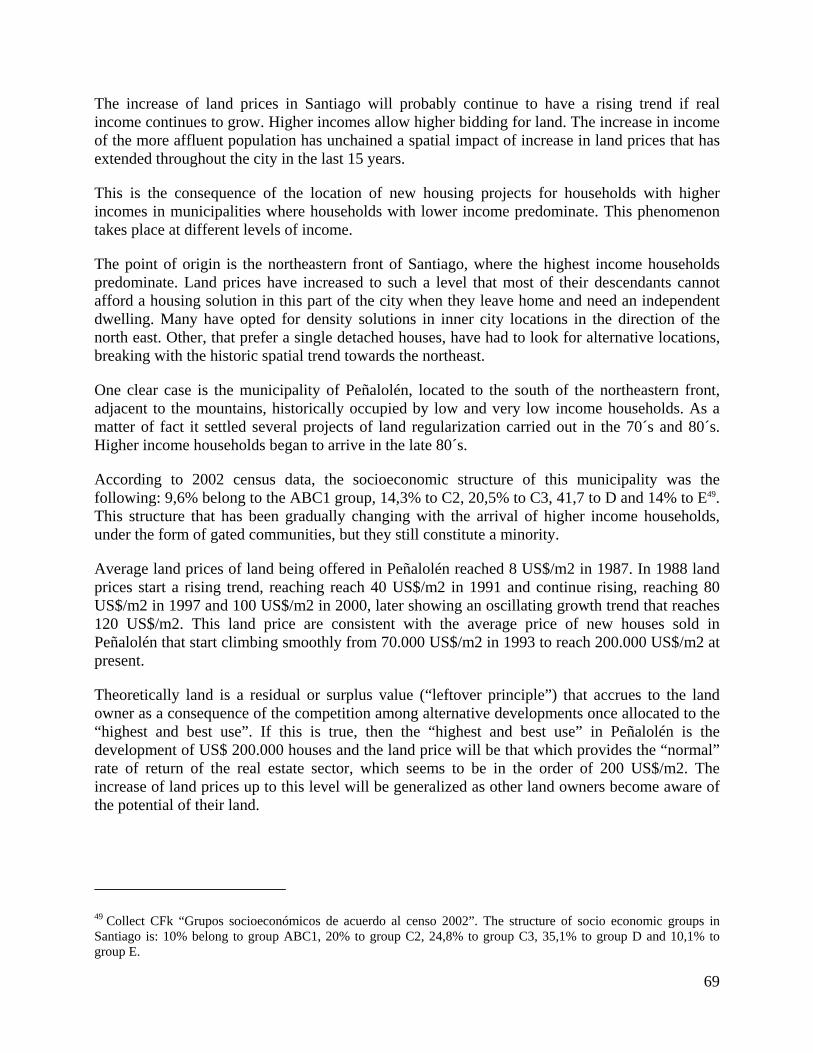
69
The increase of land prices in Santiago will probably continue to have a rising trend if real income continues to grow. Higher incomes allow higher bidding for land. The increase in income of the more affluent population has unchained a spatial impact of increase in land prices that has extended throughout the city in the last 15 years.
This is the consequence of the location of new housing projects for households with higher incomes in municipalities where households with lower income predominate. This phenomenon takes place at different levels of income.
The point of origin is the northeastern front of Santiago, where the highest income households predominate. Land prices have increased to such a level that most of their descendants cannot afford a housing solution in this part of the city when they leave home and need an independent dwelling. Many have opted for density solutions in inner city locations in the direction of the north east. Other, that prefer a single detached houses, have had to look for alternative locations, breaking with the historic spatial trend towards the northeast.
One clear case is the municipality of Peñalolén, located to the south of the northeastern front, adjacent to the mountains, historically occupied by low and very low income households. As a matter of fact it settled several projects of land regularization carried out in the 70´s and 80´s. Higher income households began to arrive in the late 80´s.
According to 2002 census data, the socioeconomic structure of this municipality was the following: 9,6% belong to the ABC1 group, 14,3% to C2, 20,5% to C3, 41,7 to D and 14% to E49. This structure that has been gradually changing with the arrival of higher income households, under the form of gated communities, but they still constitute a minority.
Average land prices of land being offered in Peñalolén reached 8 US$/m2 in 1987. In 1988 land prices start a rising trend, reaching reach 40 US$/m2 in 1991 and continue rising, reaching 80 US$/m2 in 1997 and 100 US$/m2 in 2000, later showing an oscillating growth trend that reaches 120 US$/m2. This land price are consistent with the average price of new houses sold in Peñalolén that start climbing smoothly from 70.000 US$/m2 in 1993 to reach 200.000 US$/m2 at present.
Theoretically land is a residual or surplus value (“leftover principle”) that accrues to the land owner as a consequence of the competition among alternative developments once allocated to the “highest and best use”. If this is true, then the “highest and best use” in Peñalolén is the development of US$ 200.000 houses and the land price will be that which provides the “normal” rate of return of the real estate sector, which seems to be in the order of 200 US$/m2. The increase of land prices up to this level will be generalized as other land owners become aware of the potential of their land.
49 Collect CFk “Grupos socioeconómicos de acuerdo al censo 2002”. The structure of socio economic groups in Santiago is: 10% belong to group ABC1, 20% to group C2, 24,8% to group C3, 35,1% to group D and 10,1% to group E.
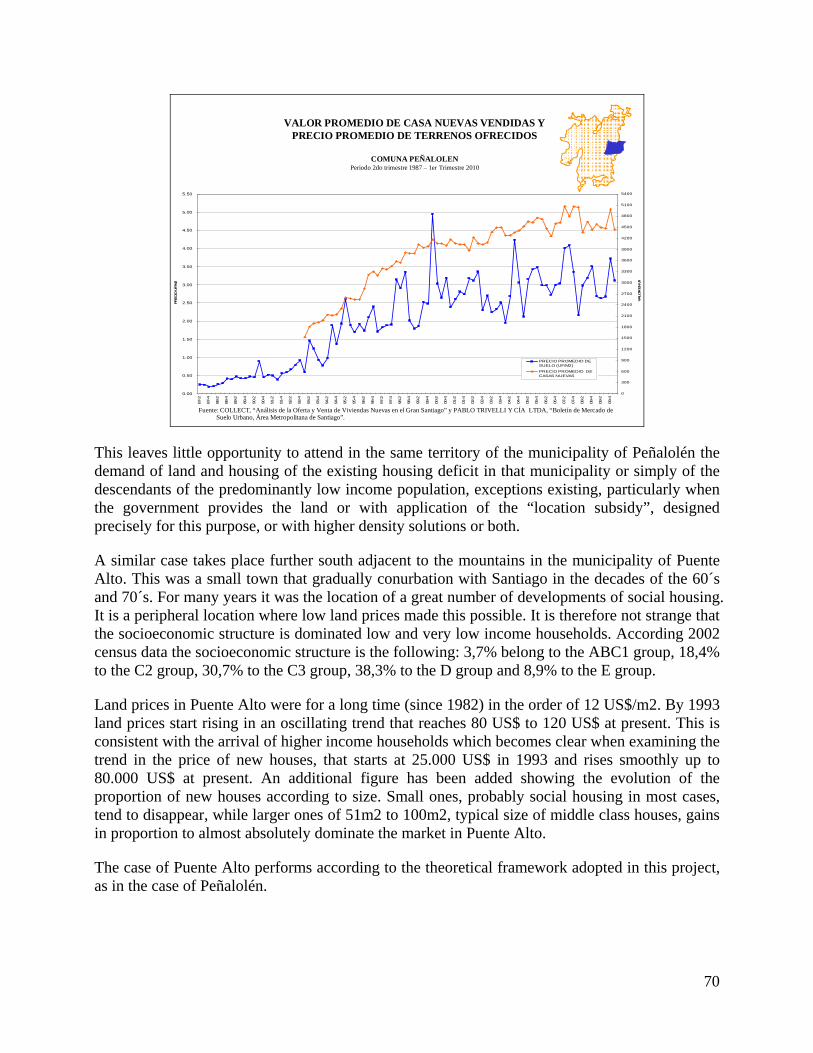
70
0.00
0.50
1.00
1.50
2.00
2.50
3.00
3.50
4.00
4.50
5.00
5.50 87
-2
87-4
88-2
88-4
89-2
89-4
90-2
90-4
91-2
91-4
92-2
92-4
93-2
93-4
94-2
94-4
95-2
95-4
96-2
96-4
97-2
97-4
98-2
98-4
99-2
99-4
00-2
00-4
01-2
01-4
02-2
02-4
03-2
03-4
04-2
04-4
05-2
05-4
06-2
06-4
07-2
07-4
08-2
08-4
09-2
09-4
PREC
IO U
F/M
2
0
300
600
900
1200
1500
1800
2100
2400
2700
3000
3300
3600
3900
4200
4500
4800
5100
5400
VALO
R E
N U
F
PRECIO PROMEDIO DESUELO (UF/M2)
PRECIO PROMEDIO DECASAS NUEVAS
Fuente: COLLECT, “Análisis de la Oferta y Venta de Viviendas Nuevas en el Gran Santiago” y PABLO TRIVELLI Y CÍA LTDA, “Boletín de Mercado de Suelo Urbano, Área Metropolitana de Santiago”.
VALOR PROMEDIO DE CASA NUEVAS VENDIDAS YPRECIO PROMEDIO DE TERRENOS OFRECIDOS
COMUNA PEÑALOLENPeriodo 2do trimestre 1987 – 1er Trimestre 2010
This leaves little opportunity to attend in the same territory of the municipality of Peñalolén the demand of land and housing of the existing housing deficit in that municipality or simply of the descendants of the predominantly low income population, exceptions existing, particularly when the government provides the land or with application of the “location subsidy”, designed precisely for this purpose, or with higher density solutions or both.
A similar case takes place further south adjacent to the mountains in the municipality of Puente Alto. This was a small town that gradually conurbation with Santiago in the decades of the 60´s and 70´s. For many years it was the location of a great number of developments of social housing. It is a peripheral location where low land prices made this possible. It is therefore not strange that the socioeconomic structure is dominated low and very low income households. According 2002 census data the socioeconomic structure is the following: 3,7% belong to the ABC1 group, 18,4% to the C2 group, 30,7% to the C3 group, 38,3% to the D group and 8,9% to the E group.
Land prices in Puente Alto were for a long time (since 1982) in the order of 12 US$/m2. By 1993 land prices start rising in an oscillating trend that reaches 80 US$ to 120 US$ at present. This is consistent with the arrival of higher income households which becomes clear when examining the trend in the price of new houses, that starts at 25.000 US$ in 1993 and rises smoothly up to 80.000 US$ at present. An additional figure has been added showing the evolution of the proportion of new houses according to size. Small ones, probably social housing in most cases, tend to disappear, while larger ones of 51m2 to 100m2, typical size of middle class houses, gains in proportion to almost absolutely dominate the market in Puente Alto.
The case of Puente Alto performs according to the theoretical framework adopted in this project, as in the case of Peñalolén.
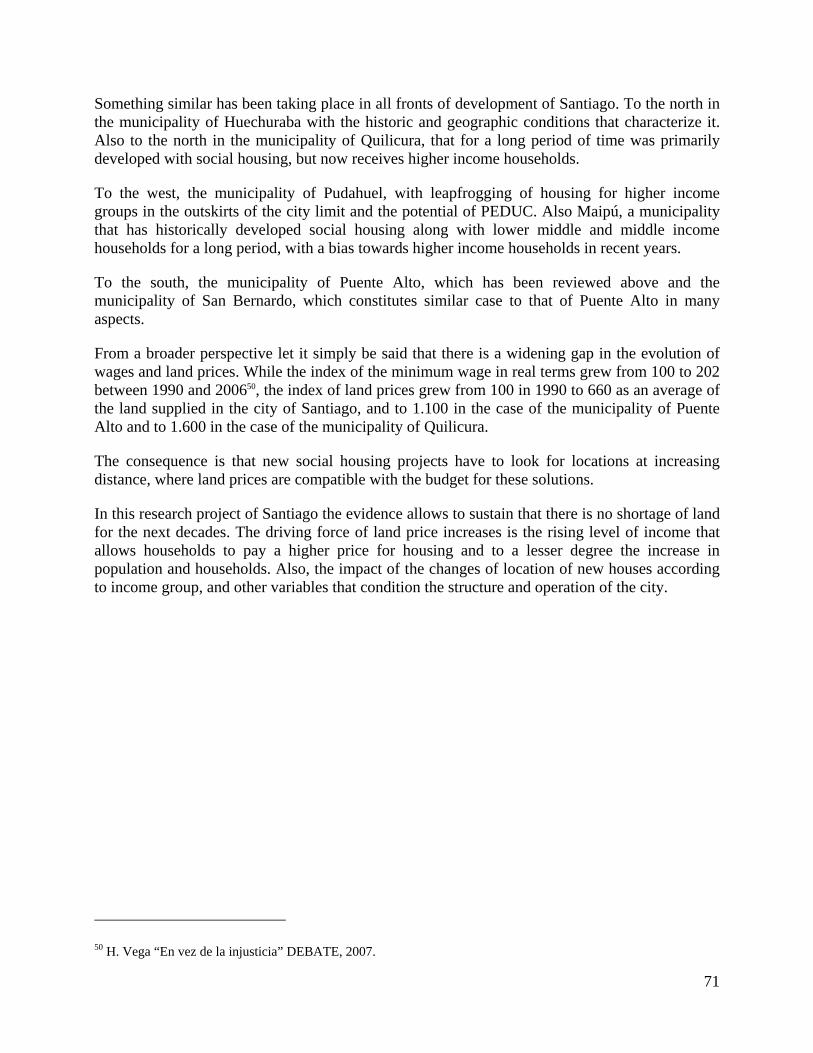
71
Something similar has been taking place in all fronts of development of Santiago. To the north in the municipality of Huechuraba with the historic and geographic conditions that characterize it. Also to the north in the municipality of Quilicura, that for a long period of time was primarily developed with social housing, but now receives higher income households.
To the west, the municipality of Pudahuel, with leapfrogging of housing for higher income groups in the outskirts of the city limit and the potential of PEDUC. Also Maipú, a municipality that has historically developed social housing along with lower middle and middle income households for a long period, with a bias towards higher income households in recent years.
To the south, the municipality of Puente Alto, which has been reviewed above and the municipality of San Bernardo, which constitutes similar case to that of Puente Alto in many aspects.
From a broader perspective let it simply be said that there is a widening gap in the evolution of wages and land prices. While the index of the minimum wage in real terms grew from 100 to 202 between 1990 and 200650, the index of land prices grew from 100 in 1990 to 660 as an average of the land supplied in the city of Santiago, and to 1.100 in the case of the municipality of Puente Alto and to 1.600 in the case of the municipality of Quilicura.
The consequence is that new social housing projects have to look for locations at increasing distance, where land prices are compatible with the budget for these solutions.
In this research project of Santiago the evidence allows to sustain that there is no shortage of land for the next decades. The driving force of land price increases is the rising level of income that allows households to pay a higher price for housing and to a lesser degree the increase in population and households. Also, the impact of the changes of location of new houses according to income group, and other variables that condition the structure and operation of the city.
50 H. Vega “En vez de la injusticia” DEBATE, 2007.
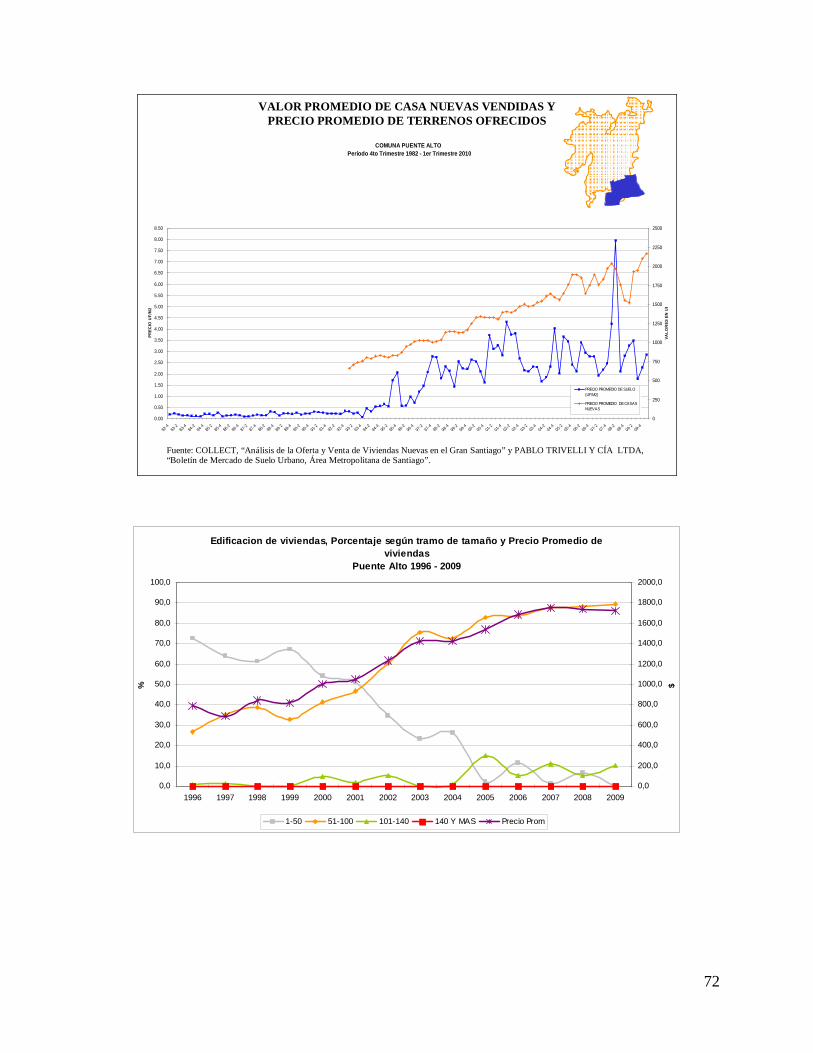
72
COMUNA PUENTE ALTO Período 4to Trimestre 1982 - 1er Trimestre 2010
0.00
0.50
1.00
1.50
2.00
2.50
3.00
3.50
4.00
4.50
5.00
5.50
6.00
6.50
7.00
7.50
8.00
8.50
82-4
83-2
83-4 84-2
84-4
85-2 85-4 86-2 86-4
87-2
87-4 88-2 88-4
89-2
89-4 90-2 90-4
91-2
91-4 92-2 92-4 93-2
93-4
94-2 94-4 95-2
95-4
96-2 96-4
97-2
97-4
98-2 98-4 99-2 99-4
00-2
00-4 01-2
01-4
02-2
02-4 03-2
03-4
04-2
04-4
05-2 05-4
06-2
06-4
07-2 07-4
08-2
08-4
09-2 09-4
PREC
IO U
F/M
2
0
250
500
750
1000
1250
1500
1750
2000
2250
2500
VALO
RES
EN
UF
PRECIO PROMEDIO DE SUELO(UF/M2)
PRECIO PROMEDIO DE CASASNUEVAS
VALOR PROMEDIO DE CASA NUEVAS VENDIDAS YPRECIO PROMEDIO DE TERRENOS OFRECIDOS
Fuente: COLLECT, “Análisis de la Oferta y Venta de Viviendas Nuevas en el Gran Santiago” y PABLO TRIVELLI Y CÍA LTDA, “Boletín de Mercado de Suelo Urbano, Área Metropolitana de Santiago”.
Edificacion de viviendas, Porcentaje según tramo de tamaño y Precio Promedio de viviendas
Puente Alto 1996 - 2009
0,0
10,0
20,0
30,0
40,0
50,0
60,0
70,0
80,0
90,0
100,0
1996 1997 1998 1999 2000 2001 2002 2003 2004 2005 2006 2007 2008 2009
%
0,0
200,0
400,0
600,0
800,0
1000,0
1200,0
1400,0
1600,0
1800,0
2000,0
$
1-50 51-100 101-140 140 Y MAS Precio Prom
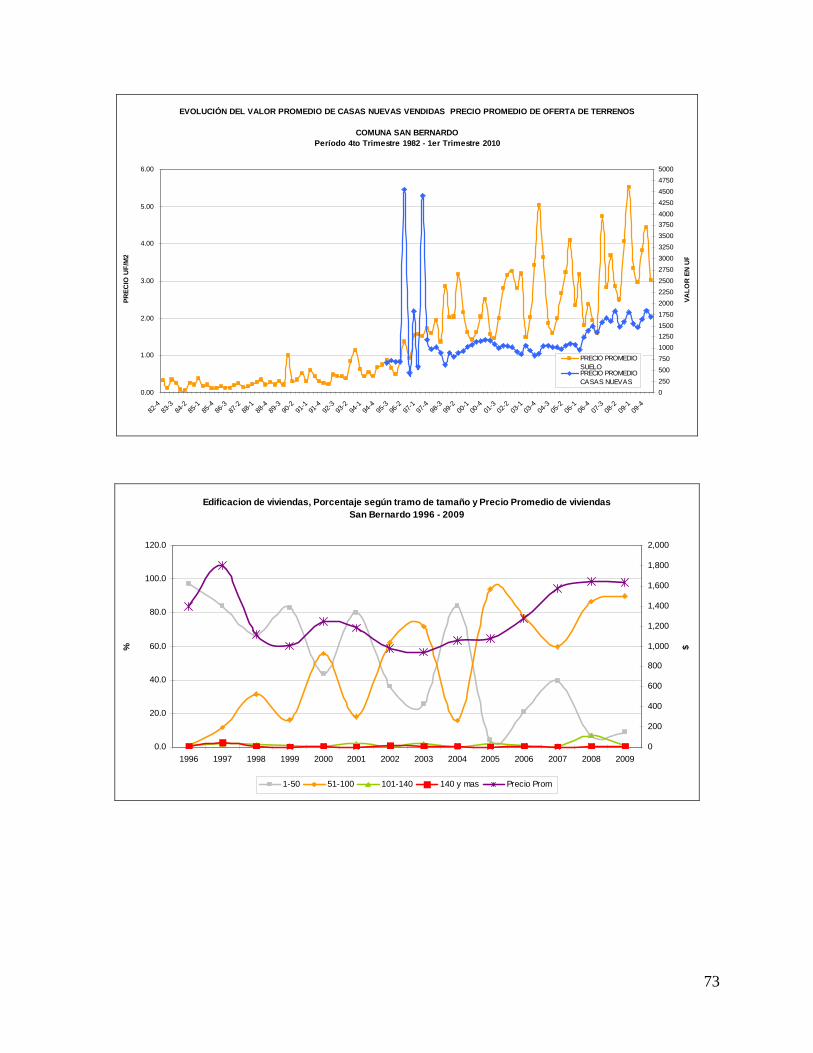
73
EVOLUCIÓN DEL VALOR PROMEDIO DE CASAS NUEVAS VENDIDAS PRECIO PROMEDIO DE OFERTA DE TERRENOS
COMUNA SAN BERNARDOPeríodo 4to Trimestre 1982 - 1er Trimestre 2010
0.00
1.00
2.00
3.00
4.00
5.00
6.00
82-4
83-3
84-2
85-1
85-4
86-3
87-2
88-1
88-4
89-3
90-2
91-1
91-4
92-3
93-2
94-1
94-4
95-3
96-2
97-1
97-4
98-3
99-2
00-1
00-4
01-3
02-2
03-1
03-4
04-3
05-2
06-1
06-4
07-3
08-2
09-1
09-4
PREC
IO U
F/M
2
025050075010001250150017502000225025002750300032503500375040004250450047505000
VALO
R E
N U
F
PRECIO PROMEDIOSUELOPRECIO PROMEDIOCASAS NUEVAS
Edificacion de viviendas, Porcentaje según tramo de tamaño y Precio Promedio de viviendas San Bernardo 1996 - 2009
0.0
20.0
40.0
60.0
80.0
100.0
120.0
1996 1997 1998 1999 2000 2001 2002 2003 2004 2005 2006 2007 2008 2009
%
0
200
400
600
800
1,000
1,200
1,400
1,600
1,800
2,000
$
1-50 51-100 101-140 140 y mas Precio Prom

74
EVOLUCIÓN DEL VALOR PROMEDIO DE CASAS NUEVAS VENDIDAS PRECIO PROMEDIO DE OFERTA DE TERRENOS
COMUNA QUILICURA Período 4to Trimestre 1982 - 1er Trimestre 2010
-1.00
0.00
1.00
2.00
3.00
4.00
5.00
6.00
7.00
8.00
9.00
10.00
82-4
83-3
84-2
85-1
85-4
86-3
87-2
88-1
88-4
89-3
90-2
91-1
91-4
92-3
93-2
94-1
94-4
95-3
96-2
97-1
97-4
98-3
99-2
00-1
00-4
01-3
02-2
03-1
03-4
04-3
05-2
06-1
06-4
07-3
08-2
09-1
09-4
PREC
IO U
F/M
2
0
250
500
750
1000
1250
1500
1750
2000
2250
2500
2750
VALO
R E
N U
F
PRECIO PROM.
PRECIO PROMEDIO DE CASAS NUEVAS
Edificacion de viviendas, Porcentaje según tramo de tamaño y Precio Promedio de viviendas Quilicura 1996 - 2009
0.0
20.0
40.0
60.0
80.0
100.0
120.0
1996 1997 1998 1999 2000 2001 2002 2003 2004 2005 2006 2007 2008 2009
%
0
500
1,000
1,500
2,000
2,500
$
1-50 51-100 101-140 140 y mas Precio Prom
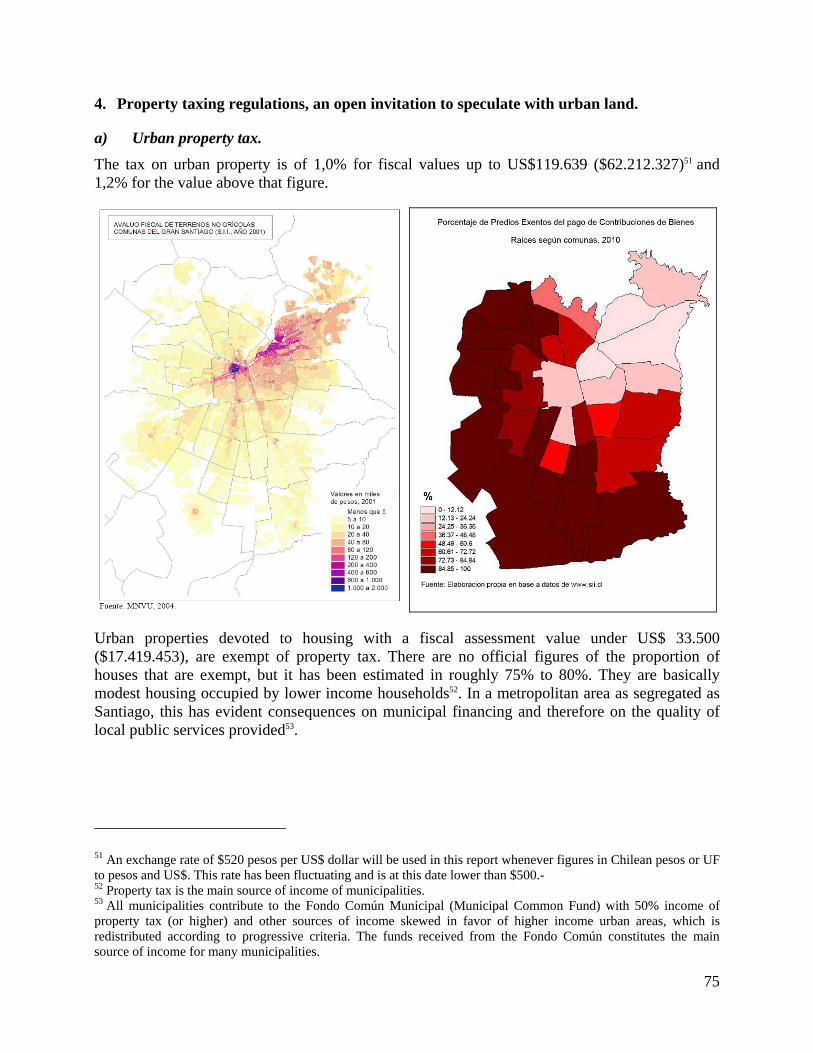
75
4. Property taxing regulations, an open invitation to speculate with urban land.
a) Urban property tax. The tax on urban property is of 1,0% for fiscal values up to US$119.639 ($62.212.327)51 and 1,2% for the value above that figure.
Urban properties devoted to housing with a fiscal assessment value under US$ 33.500 ($17.419.453), are exempt of property tax. There are no official figures of the proportion of houses that are exempt, but it has been estimated in roughly 75% to 80%. They are basically modest housing occupied by lower income households52. In a metropolitan area as segregated as Santiago, this has evident consequences on municipal financing and therefore on the quality of local public services provided53.
51 An exchange rate of $520 pesos per US$ dollar will be used in this report whenever figures in Chilean pesos or UF to pesos and US$. This rate has been fluctuating and is at this date lower than $500.- 52 Property tax is the main source of income of municipalities. 53 All municipalities contribute to the Fondo Común Municipal (Municipal Common Fund) with 50% income of property tax (or higher) and other sources of income skewed in favor of higher income urban areas, which is redistributed according to progressive criteria. The funds received from the Fondo Común constitutes the main source of income for many municipalities.
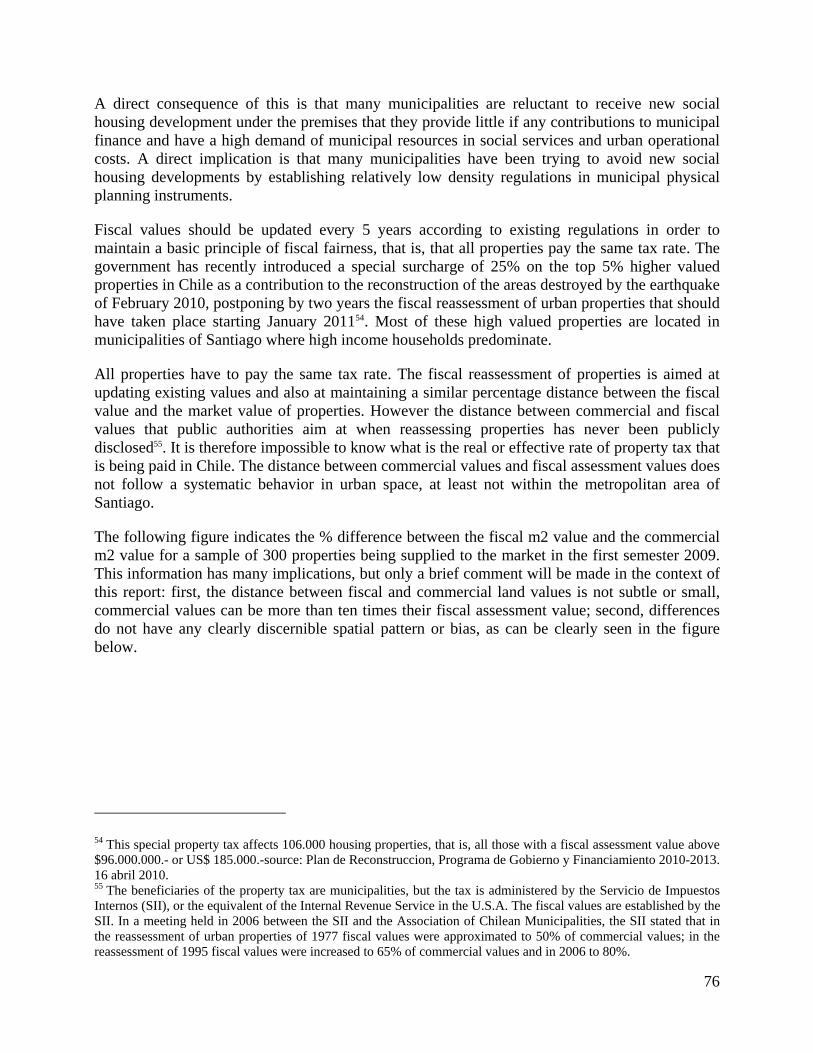
76
A direct consequence of this is that many municipalities are reluctant to receive new social housing development under the premises that they provide little if any contributions to municipal finance and have a high demand of municipal resources in social services and urban operational costs. A direct implication is that many municipalities have been trying to avoid new social housing developments by establishing relatively low density regulations in municipal physical planning instruments.
Fiscal values should be updated every 5 years according to existing regulations in order to maintain a basic principle of fiscal fairness, that is, that all properties pay the same tax rate. The government has recently introduced a special surcharge of 25% on the top 5% higher valued properties in Chile as a contribution to the reconstruction of the areas destroyed by the earthquake of February 2010, postponing by two years the fiscal reassessment of urban properties that should have taken place starting January 201154. Most of these high valued properties are located in municipalities of Santiago where high income households predominate.
All properties have to pay the same tax rate. The fiscal reassessment of properties is aimed at updating existing values and also at maintaining a similar percentage distance between the fiscal value and the market value of properties. However the distance between commercial and fiscal values that public authorities aim at when reassessing properties has never been publicly disclosed55. It is therefore impossible to know what is the real or effective rate of property tax that is being paid in Chile. The distance between commercial values and fiscal assessment values does not follow a systematic behavior in urban space, at least not within the metropolitan area of Santiago.
The following figure indicates the % difference between the fiscal m2 value and the commercial m2 value for a sample of 300 properties being supplied to the market in the first semester 2009. This information has many implications, but only a brief comment will be made in the context of this report: first, the distance between fiscal and commercial land values is not subtle or small, commercial values can be more than ten times their fiscal assessment value; second, differences do not have any clearly discernible spatial pattern or bias, as can be clearly seen in the figure below.
54 This special property tax affects 106.000 housing properties, that is, all those with a fiscal assessment value above $96.000.000.- or US$ 185.000.-source: Plan de Reconstruccion, Programa de Gobierno y Financiamiento 2010-2013. 16 abril 2010. 55 The beneficiaries of the property tax are municipalities, but the tax is administered by the Servicio de Impuestos Internos (SII), or the equivalent of the Internal Revenue Service in the U.S.A. The fiscal values are established by the SII. In a meeting held in 2006 between the SII and the Association of Chilean Municipalities, the SII stated that in the reassessment of urban properties of 1977 fiscal values were approximated to 50% of commercial values; in the reassessment of 1995 fiscal values were increased to 65% of commercial values and in 2006 to 80%.
77
b) Special property tax on urban vacant land. Vacant land plots in fully urbanized areas have to pay a surcharge of 100% of the property tax, except in designated expansion areas. This surcharge is applied only two years after full urbanization has been officially received.
This policy instrument was designed with the intention of stimulating the development of vacant properties with urban land use. The affectivity of this policy instrument is doubtful. First, because the existing vacant land has not decreased as the tax implications are marginal in many cases, because the fiscal assessment value can be very much below the commercial value and the tax rate can be insignificant. Second, because it can easily be bypassed by making minimal developments in order to avoid the surcharge tax on vacant land. Third, because prices have not decreased due to the application of this special tax, therefore it has not had the desired effect of attracting urban investment. Fourth, this is particularly the case of extensive vacant land in the urban periphery where this tax is not applicable.
It is doubtful that this policy instrument has any relevant impact as it affects only 9.121 properties out of a total of 4.408.854 properties (vacant and not vacant) in the Metropolitan Region (most of which are in Santiago), with a total tax collection of US$ 17 million in 2010. In fact, the results

78
of a research project on the impact of the 100% surcharge of the property tax on vacant land concludes that “there is no significant effect of it neither on the price of vacant land, nor on the number of transactions affected by this tax”56. Furthermore, “…this surcharge in the property tax does not seem to be an efficient instrument to deal with speculative undeveloped land”. Also, “this surcharge represents a marginal percentage in relation to the assessment value of properties affected (…) which effectively pay this surcharge”.
c) Property tax and the expansion of the city limit. The Chamber of Constructors and real estate entrepreneurs advocate for an expansion of the city limits of Santiago, argumenting that there is a shortage of vacant land to develop social housing. It is in this context that it becomes relevant to inform on the taxing rules applied incorporated within the city limits.
The SII defines land use for property taxing purposes. Properties are designated with “agricultural” land use or “non agricultural”. These two categories pay a different tax rate and have a different assessment criterion. The important point to be made is that properties that are incorporated into the city limit maintain a designation of “agricultural land” as long as they are not effectively turned into urban use. This has important consequences from a taxing perspective: first, the fiscal assessment value of land thus incorporated within the city limit, which continues to have a designated agricultural use can be less than 1% with regard of that of land designated as having non agricultural use57. Second, the tax rate is 1% for land designated with agricultural use, which is lower than the rate of 1,2% which affects those with non agricultural use with a fiscal assessment value above US$119.639. Third, property taxes paid by agriculture can be deduced from the income tax, not as a cost item, but as a deduction from the tax that has to be paid, which means that for agriculture, property taxes that area paid throughout the year, are discounted next year from the income tax. Fourth, land designated with “agricultural” use, even within city limits, is not subject to the 100% surcharge of the property tax on vacant land.
Furthermore, in a recent amendment of the property tax law, it is established that for the case of urban subdivision projects of more than 50 hectares, the 100% surcharge on vacant land will be applied to the resulting lots only after ten years have elapsed since the land was subdivided and urbanized.
d) Taxing of urban land value increments. But the most potent incentive for speculation with urban land is established in the income tax legislation: the increments in land values do not constitute rent for income tax purposes if the owner is a natural person (not a juridical person), that does not habitually deal in the real estate market. In other words, capital gains originating in urban land do not constitute income for tax
56 F Sabatini, I Brain, P Mora, P Celhay, D Rodríguez, ProUrbana, PUC-Chile,”Chile, 2005-7: Impactos del Reavalúo del Predial y Sobretasa a Sitios Vacantes en las Transacciones y Precios del Suelo en Siete Ciudades”, 2009. 57 In a recent survey of vacant land in the municipality of Lo Barnechea in Santiago, is was found that properties within the city limits designated with agricultural use by the SII had a fiscal assessment values which was less than 1% of those in the vicinity that had a designated non agricultural use by the SII.
79
purposes when owners comply with simple requirements. It is therefore not surprising that most land owners in the urban fringe are natural persons.
This constitutes an open invitation to land speculation considering the low holding costs and the founded expectative of land value increases, either as the consequence a self fulfilled prophesy if enough land is retained from the market, or in the expectations of population growth and the consequent demand for land, but most important, in the expectations of economic growth and therefore in the income level of the population.
The tax tool kit available to public authorities in Chile does not have any instruments to stimulate the flow of newly incorporated vacant land to the market or to avoid the speculative retention of land from the market. The Law of Urbanism and Construction contemplates the possibility that municipalities defining “obligatory” development areas in a given time span in the planning norms58. However, the non compliance with such a norm would implicate a surcharge of the property tax, similar to what has already been informed, which has demonstrated to be ineffective.
The main implication of all the above is that in the case that public urban authorities decided to expand the city limit of Santiago, it would not necessarily follow that the increment of legally defined urban land would flow to the market unless land price increments would meet the expectations of land owners.
58 Ley de Urbanismo y Construcciones, artículos Nº 76 y 77.
80
5. Housing policy and socio economic urban segregation
5.1. Housing policies.
A brief description of housing policies of relevant periods will be presented, with increasing detail as approaching the more recent experiences.
a) Early experiences in housing policies in the XX Century. Chile has a long tradition of social housing policy and the city of Santiago has been historically characterized by social segregation59.
The Housing Policy in Chile begins in 1906 with the first legislation enacted by the Government creating Worker Hounsing Councils (“Consejos Habiacionales”) with the objective to build, sanitize and normalize dwellings for workers. This initiative took place in a context where housing conditions for low income families living in cities were very precarious. Demand was still not quantified, but was the beginning of a new role assumed by the Government as an expression of the growing concern with regard this issue.
During the first 20 years (1906-1925), based on sanitary regulations massive demolitions of dwellings took place, while new houses built in this period by Housing Councils reached less than 4.000 units. This increased the housing deficit and gradually moved sanitary problems to the city margins, which had great social implications that following Governments had to face60.
In the next 30 years (1925-1953), different institutions61, instruments and modalities for housing production and infrastructure supply for low income families were created, as well as different incentives for private investment in housing (financial aids, loans, subsidies). Also minimal standards for these dwellings were established in regulatory instruments 62 , which had been 59 Elocuent is the publication “Suburbios y arrabales en un área metropolitana. El caso de Santiago de Chile, 1872-1932” by A. de Ramón, where the mayor of Santiago Benjamin Vicuña Mackenna is quoted regarding the need to build a beltway around Santiago, in order to separate the city proper from the suburbs as a sanitary belt, in order to separate the pestilent “arrabales” (slums), “which is nothing more than an immense sewerage of infection and vice, crime and pest, a real camp of death, as has been properly labelled…inhabited by savages with a moral and intellectual incapacity that does not allow them to improve their condition.” 60 The following quote from an editorial of 1910 illustrates the spirit of the ruling class with respect to social housing “The improvement of the people’s housing conditions is not only a means of preserving the working people, but also of defending society. And the higher classes, if not worried for the working people, but for themselves, on purely egoistic premises, should worry about a problem that threatens our health and that of the persons around us…” El Mercurio, 11/21/1910. 61 Social Welfare Councils (“Consejos de Bienestar Social”) were created in 1925 substituting the former Housing Councils; in 1931 it became the “Junta de la Habitación Popular”, later substituted by the “Caja de la Habitación Popular” in 1936, which operated until 1952. After the 1939 earthquake, the Government created two institutions to face the emergency and the subsequent reconstruction: “Corporación de Reconstrucción y Auxilio” and “Corporación de Fomento Productivo”, among of it´s aims was to support housing reconstruction along the country. In 1953 was created the “Corporación de la Vivienda (CORVI)”, from the fusion of “Caja de Habitación” and “Corporación de Reconstrucción”, to tackle the housing deficit problem from a centralized stage, building affordable housing directly with public funds. 62 First Regulatory Plan for Santiago was elaborated in 1920; the first Urbanization and Building Code (Ley General de Urbanismo y Construcción) was enacted in 1931, with later modifications in 1953. In the same year was elaborated the first Housing Plan by the Ministry of Public Works.
81
gradually upgraded. In the period 1944 to 1953, a new institution with enhanced competences called “Caja de la Habitación”, built directly and indirectly more than 35,000 dwellings. But huge demographic and social pressures, added to economy depressions and natural disasters 63 , surpassed the administration capacities of successive governments.
Nevertheless the number of dwellings built by public and private sector kept growing. Up to early 1950’, the average number of dwellings initiated was less than 6,000 per year in the whole country, and majority of low-income families continued to live in substandard dwellings.
In addition to evident institutional limitations, one of the arguments that justifies the low achievement during this period is that according to established minimal standards for economic dwellings (36 to 100m2), their cost was too high, and despite the variety of subsidized loans and financial aids applied, they were not affordable for poor families. In a context of inflation and non indexed long terms debts, the few beneficiaries were highly privileged since they ended up receiving substantial subsidies as the monthly instalments decreased in real value in time. Moreover, benefits applied to stimulate the housing construction industry led to an unexpected increasing of property prices due to speculation64.
Low income families settled in Santiago informally on peripheral sites of land, often with the consent of the land owner, but without any formal documentation and constructed “ranchos”, precarious dwellings without services. The search for a site where to live was made individually and meant no threat to property owners. The accumulation of ranchos on specific location gave rise to “poblaciones callampas” (Mushroom settlements) as they grew spontaneously like mushrooms.
In the decade of the 50´s the demographic growth rate of Santiago reached a peak value of 4,4% per year. The housing problem accumulated and in the late 50´s the first organized massive land invasions took place, giving rise to two well known popular housing settlements denominated “La Victoria” and “José María Caro”. La Victoria, as it was an emblematic victory in the fight for a housing solution by low income households. José María Caro, at the time the cardinal of Chile, in recognition of the support of the Catholic Church in the vindication of housing rights. These projects consisted in 9 by 18 metres urbanized lots and a basic housing unit of 16m2 with sanitary and electric connections, which would later grow into full houses by self construction efforts65.
This two invasions marked a turning point in housing policy, which evolved from a concept of “vivienda digna” to that of a “housing solution”, meaning in concrete terms smaller houses that could reach a greater number of people and, in a lesser degree, site and service solutions, a starting point for self help.
In the following government periods, housing policy had a higher priority, more specific objectives and roles for the public sector were defined, introducing better focused concepts and goals. During the Ibañez administration (1952-1958) a relevant goal was to reduce dwelling´s
63 Earthquakes in Talca in 1928 and in Chillan in 1939. 64 Silva, Sandra. “Estudio Análisis de de la Evolución de la Política Habitacional Chilena”, MINVU, 1997. 65 Research by Joan MacDonnald established that on the average, self construction in both this case reached an average of 11m2 per person.
82
building costs and promoting programs of “self-construction” by households. A great housing construction effort was made, supplying more houses than in the previous accumulated 17 years. But it was still insufficient, as the housing deficit rose from 156.205 in 1950 to 454.000 in 196066.
b) Housing policy developments gain momentum in the mid XX Century. - Housing policy 1959-1964.
During the Alessandri government, the annual supply of new housing almost doubled and the public sector became the most important supplier of houses providing 58% of the total supply, half of which was destined to lower income groups, marking a new era of public intervention in the housing sector. During this period massive eradication of poor families living in precarious conditions took place, undertaking a large-scale production of low cost housing, which implied a significant reduction of minimal standards. Notwithstanding, housing production was still insufficient to satisfy needs (around 30,000 units per year) in a context where an increasing number of land invasions took place, inside and as well as outside urban fringes. Main urban areas were growing at higher rates than population growth rates.
- Housing policy 1964-1970.
During Frei administration the housing deficit had become a relevant political issue. A unified institutional framework was established, providing a more coherent policy and planning structure. The Ministry of Housing and Urbanism (MINVU) was created in 1965, unifying numerous existing institutions with different roles and competences concerning housing and urban development issues 67 , empowered to set policies and manage public funds. This Ministry assumed two specific goals: decrease the housing deficit (estimated at 420,000 units in 1964) and increase housing production trough direct construction and incentives for the private sector. The operational structure of MINVU consisted of four autonomous public institutions 68 , which assumed specific roles.
“Housing” was to be understood as a “necessary good which any family from any socioeconomic status has the right to have access to”69, and also that every house is part of a neighbourhood and life style, implying that basic infrastructure services and community facilities must be considered in any housing program. This led to a more integrated housing policy that attempted to provide housing solutions to all segments of income levels through a combination of state and private financed schemes. One of the cornerstones of this policy was the promotion of savings for households as a prerequisite to purchase a proper housing. The Popular Savings Program (PAP) was created for this purpose, aimed to low income households. The Savings and Loan Associations, for middle and upper-middle income households, which captured savings and used them to finance mortgage-backed loans for home purchase.
66 E. Haramoto “Políticas de vivienda social en las tres últimas décadas” pp 75-152, in MacDonnald J. (1985) “Vivienda social, reflexiones y experiencias” Corporación de Promoción Universitaria. 67 A total of 28 institutions dependent to 8 different Ministries had concern to housing and urban development issues. 68 CORVI (“Corporación de la Vivienda”), CORHABIT (“Corporación de Servicios Habitacionales”), CORMU (“Corporación de Mejoramineto Urbano”) and COU (“Corporación Obras Urbanas”). 69 Silva, Sandra. 1997. Op cit. Reference to documentation from the Ministry of Public Works, 1964.
83
The production of houses was five times higher than in the previous government period (including site and service). Subsidies are estimated to have reached some 70% of total cost. Nearly 250,000 housing solutions were produced in this period, 62.5% of which were provided by the public sector. This high quantitative figures meant a reduction of minimal standards, from a 60 m2 “CORVI House” to a basic 27-30 m2 construction in an urbanized lot (from “Operación sitio”), and just a site with no infrastructure (resulted from “Operación Tiza”). Around 130,000 units corresponded to initially established standards dwellings and 120,000 were these minimal housing solutions70.
Social housing projects grew in size and homogeneity in order to capture economies of scale. As they became more standardized, the main remaining variable to reduce total costs was the price of land. It is not surprising that in order to attain higher quantitative goals, land selected for social housing was the least expensive available, meaning that with the worse urban conditions. The accumulation of low income housing projects in specific locations attracted new developments of the same nature, creating vast homogeneous areas.
As the housing needs grew faster than housing solutions, homeless organizations arose under different political and ideological denominations vindicating housing as a basic right. Land invasions increased, becoming a pressure valve of the housing problem.
- Housing policy 1970-1973.
The Allende government sustained that “adequate housing was a right and that the government had the obligation to fulfil it”71. The implementation strategy, Emergency Housing Program, aimed to build over 120,000 new dwellings in two years and urbanize existing unserviced sites. The program included the replacement, improvement or upgrading of the existing housing stock for the worker class. The established institutional structure was considered to be functional to these purposes, so only additional executive prerogatives were granted to achieve the established commitment. Although housing starts reached historical records in 1971, the amount of actually finished units were less than a half of the expected number, due to lack of building materials or financing at the end of the period. At this time the housing deficit in the country was estimated at 593,000 units. During this period land invasions increased, almost doubling the existing ones in 1970.
c) Housing Policy reform, liberalism under a dictatorship. - Housing policy 1973-1990.
With the military coup of 1973 land invasions stopped and were severely repressed. Later on, during the late 70´s and early 80´s the military government carried out a regularization process of “campamentos” (settlements originating in land invasions). One of the main criteria to decide whether a “campamento” would remain at the existing location or be relocated, was the level of land prices. Where land prices were high, the decision was to relocate. This decision had many other implications since in most of these cases there was a sharp contrast between the strata of the campamento dwellers and that of the adjacent neighbourhood. During the 1977 to 1984 period
70 Silva, Sandra. 1997. Op cit. 71 Idem. Referred to documentation from the National Planning Office (ODEPLAN) of 1971.
84
some 26.873 families were regularized, some 160.000 people affected, bringing the spatial social order into its “natural” pattern according to public authorities at the time, meaning that better urban areas were literally clean out of lower income residents.
The military government (1973-1990) introduced radical reforms in the housing policy, as in other sectors of the economy, based on neoliberal ideas. The premise was that “housing is a right that any family acquires through savings, which is recognized and shared by the State”72. Housing policy defined the role of the public sector as “playing a subsidiary role to help households in need, supplementing their purchasing power with up-front subsidies, while private banks would provide complementary financing. Middle and upper-income households were to find financing in private banks. The securitization of mortgages was envisaged as part of the development of private long-term housing financing, as capital markets became wider and gained in depth”73. Consequently, housing production and financing was to be left to the private sector with the government acting as a facilitator.
A significant institutional reform was carried out in the first period of this regime: the reorganization of MINVU according to the national regionalization policy, creating Regional Ministerial Secretaries (SEREMI) and the Regional Services of Housing and Urbanism (SERVIU), originated from the merge of former CORVI, CORHABIT, CORMU and COU. At the local level, Municipal Housing Committees (CHC) were committed to attend low income households living in very precarious conditions and unable to afford their housing needs.
During the military regime several reforms took place in the mid 70´s and early 80´s that would have a lasting effect on housing policy and urban development. First, pension funds were privatized, providing long term savings for housing developments of middle and higher income groups. The reform to the banking system after the generalized bankruptcy due to the economic crisis in 1982 also helped set the stage for a more active participation of the private sector. Second, a demand subsidy was created to channel government support to finance housing needs, hoping that the public sector would assume a subsidiary role, handing over the leading role to the private sector through the market. Third, planning regulations were loosened and the city limit expanded under the premise that a free operating land market would automatically contribute to provide a solution to the housing problem through the market, as was presented in detail previously in this research report.
The privatization of the pension funds in Chile has provided an increasing amount of long term savings, deepening the capital market. Assets in pension funds have increased from US$ 299 million in 1981, to US$ 31 billion in 199874 and to US$ 100 billion in 2009. This is the main source of mortgage housing financing for middle and higher income households. In a context of rapid economic growth from 1985 to 1998 this source of long term resources allowed for an unprecedented growth of housing construction and the real estate industry, consequently also in the growth of the city.
72 Silva, Sandra. 1997. Op cit. Referred to documents from Ministry of Housing and Urbanism of 1977. 73 E. Rojas “The Long Road to Housing Reform. Lessons from the Chilean Experience”. Inter-American Development Bank, july 1999. Sustainable Development Department. Best Practice Series. 74 E. Rojas july 1999. op.cit.
85
- Housing subsidy.
The housing subsidy has been a central instrument in housing policy up to this date. It was created in 1976 but did not gain momentum until de mid 80´s, after the economy recovered from a deep crisis. The system is administered centrally and lists of beneficiaries are published once or twice a year. People are familiar with the criteria that provide points to the applications and trust the administration of the system to be honest and transparent. Subsidies are allotted among a list of applicants according to criteria that have been modified over time.
In a first stage of implementation, savings was an important element in granting points to attain a subsidy. The principal consequence was that this benefit reached those with higher savings capacity, postponing access to housing to poorer families and accumulating a housing deficit among those with the most urgent need of help. Only 24% of subsidies reached households belonging to the 30% poorest households.
The theoretical design was conceived as a demand subsidy proper, by which beneficiaries could choose among alternatives in the market. The concrete outcome has been far from it, because at least in Chile, there is no such thing as a fluent market of social housing.
Different to housing markets for higher income families, in which suppliers have to be sensitive to demand requirements and therefore to the trilogy of product-price-location as they operate in a competitive context, operators that supply social housing have a captive demand, particularly when it is fully subsidized. In a context where there exists a housing deficit, a fact that is well known and perceived by many urban families, beneficiaries of housing subsidies will simply “buy” what is available at the moment. Suppliers of social housing can therefore be not very sensitive to, or simply ignore, demand preferences, as there is no competition.
In a first stage of implementation, “the government had to assume a more active role than originally envisaged when the lack of interest of developers and banks to build and finance low income housing became apparent”75. This meant that MINVU had to contract the construction of low income housing directly with private companies, assign houses to subsidy beneficiaries and grant credit when required. Government produced housing contemplated two types of solutions: Basic Housing Programme consisting in a house of 35m2 to 40m2 financed through beneficiaries savings, housing subsidy and a government loan; and for those of lower income with no credit capacity, Progressive Housing Programme, basically a site and service solution with a small housing unit.
Beneficiaries of housing subsidies could express their preferences as to the municipalities in which they would like to obtain a housing solution. But this did not have much of an influence as to where these solutions were being developed, as the logic of housing location simply tends to minimize the incidence of land in total costs76, regardless of it being of public or private initiative. In any case, this does not mean much of a choice as understood under free market conditions.
75 E. Rojas july 1999. op.cit. 76 The logic of development of new social housing projects (under public and private initiative) has generally been guided by the criteria of minimizing the incidence of land in the total budget, the consequence of it being that projects are located in the least expensive sites. If the land market operates under reasonable conditions and prices
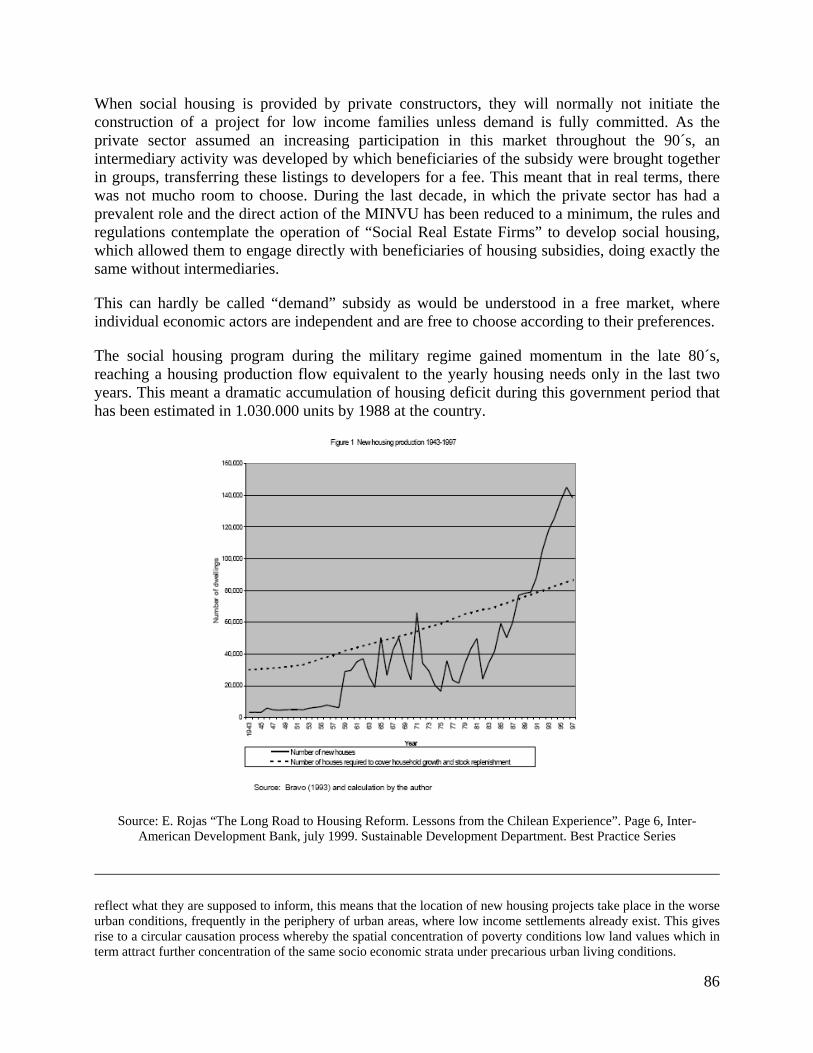
86
When social housing is provided by private constructors, they will normally not initiate the construction of a project for low income families unless demand is fully committed. As the private sector assumed an increasing participation in this market throughout the 90´s, an intermediary activity was developed by which beneficiaries of the subsidy were brought together in groups, transferring these listings to developers for a fee. This meant that in real terms, there was not mucho room to choose. During the last decade, in which the private sector has had a prevalent role and the direct action of the MINVU has been reduced to a minimum, the rules and regulations contemplate the operation of “Social Real Estate Firms” to develop social housing, which allowed them to engage directly with beneficiaries of housing subsidies, doing exactly the same without intermediaries.
This can hardly be called “demand” subsidy as would be understood in a free market, where individual economic actors are independent and are free to choose according to their preferences.
The social housing program during the military regime gained momentum in the late 80´s, reaching a housing production flow equivalent to the yearly housing needs only in the last two years. This meant a dramatic accumulation of housing deficit during this government period that has been estimated in 1.030.000 units by 1988 at the country.
Source: E. Rojas “The Long Road to Housing Reform. Lessons from the Chilean Experience”. Page 6, Inter-American Development Bank, july 1999. Sustainable Development Department. Best Practice Series
reflect what they are supposed to inform, this means that the location of new housing projects take place in the worse urban conditions, frequently in the periphery of urban areas, where low income settlements already exist. This gives rise to a circular causation process whereby the spatial concentration of poverty conditions low land values which in term attract further concentration of the same socio economic strata under precarious urban living conditions.
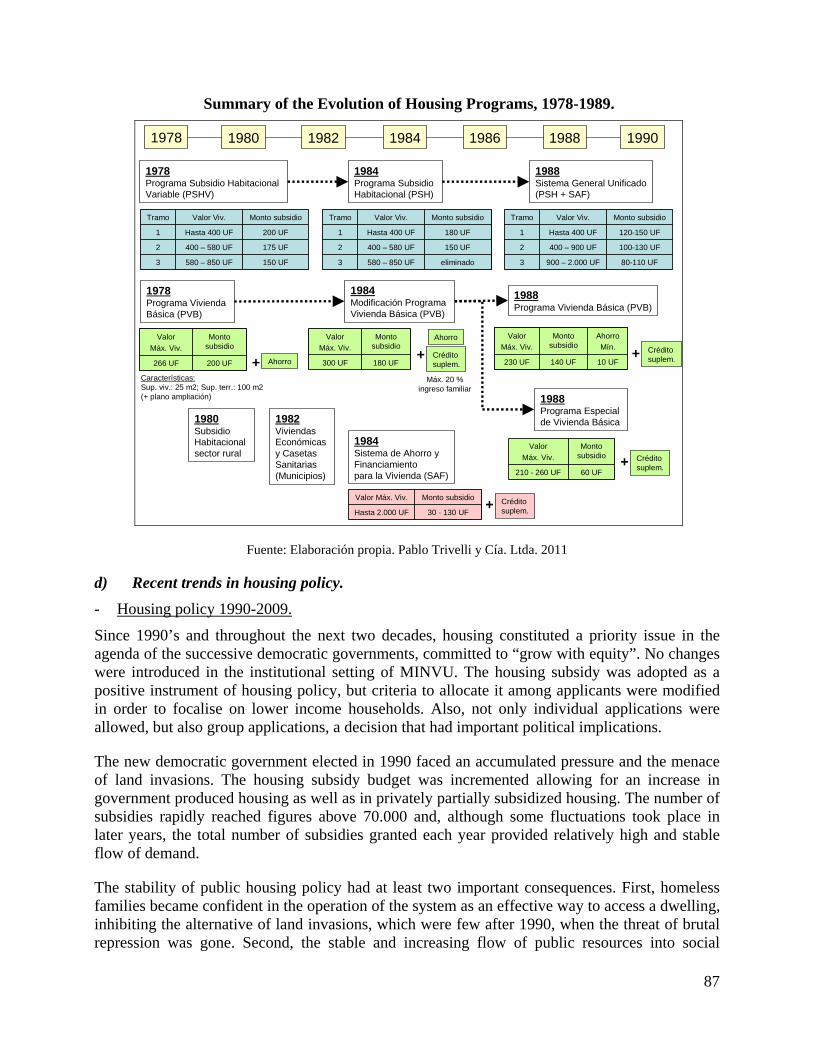
87
Summary of the Evolution of Housing Programs, 1978-1989.
1978 1980 1982 1984 1986 1988 1990
1978Programa Subsidio Habitacional Variable (PSHV)
1978Programa Vivienda Básica (PVB)
Tramo Valor Viv. Monto subsidio
1 Hasta 400 UF 200 UF
2 400 – 580 UF 175 UF
3 580 – 850 UF 150 UF
Tramo Valor Viv. Monto subsidio
1 Hasta 400 UF 200 UF
2 400 – 580 UF 175 UF
3 580 – 850 UF 150 UF
Valor Máx. Viv.
Monto subsidio
266 UF 200 UF
Valor Máx. Viv.
Monto subsidio
266 UF 200 UF
1984Programa SubsidioHabitacional (PSH)
1988Sistema General Unificado(PSH + SAF)
Tramo Valor Viv. Monto subsidio
1 Hasta 400 UF 180 UF
2 400 – 580 UF 150 UF
3 580 – 850 UF eliminado
Tramo Valor Viv. Monto subsidio
1 Hasta 400 UF 180 UF
2 400 – 580 UF 150 UF
3 580 – 850 UF eliminado
Tramo Valor Viv. Monto subsidio
1 Hasta 400 UF 120-150 UF
2 400 – 900 UF 100-130 UF
3 900 – 2.000 UF 80-110 UF
Tramo Valor Viv. Monto subsidio
1 Hasta 400 UF 120-150 UF
2 400 – 900 UF 100-130 UF
3 900 – 2.000 UF 80-110 UF
1984Modificación Programa Vivienda Básica (PVB)
Valor Máx. Viv.
Monto subsidio
300 UF 180 UF
Valor Máx. Viv.
Monto subsidio
300 UF 180 UF
1984Sistema de Ahorro y Financiamientopara la Vivienda (SAF)
Valor Máx. Viv. Monto subsidio
Hasta 2.000 UF 30 - 130 UF
Valor Máx. Viv. Monto subsidio
Hasta 2.000 UF 30 - 130 UF
Características:Sup. viv.: 25 m2; Sup. terr.: 100 m2(+ plano ampliación) 1988
Programa Especial de Vivienda Básica
+ Créditosuplem.
+ Créditosuplem.
Máx. 20 %ingreso familiar
+ Créditosuplem.
1980SubsidioHabitacional sector rural
1988Programa Vivienda Básica (PVB)
Valor Máx. Viv.
Monto subsidio
AhorroMín.
230 UF 140 UF 10 UF
Valor Máx. Viv.
Monto subsidio
AhorroMín.
230 UF 140 UF 10 UF+ Crédito
suplem.
Valor Máx. Viv.
Monto subsidio
210 - 260 UF 60 UF
Valor Máx. Viv.
Monto subsidio
210 - 260 UF 60 UF
1982ViviendasEconómicas y CasetasSanitarias(Municipios)
+ Ahorro
Ahorro
Fuente: Elaboración propia. Pablo Trivelli y Cía. Ltda. 2011
d) Recent trends in housing policy. - Housing policy 1990-2009.
Since 1990’s and throughout the next two decades, housing constituted a priority issue in the agenda of the successive democratic governments, committed to “grow with equity”. No changes were introduced in the institutional setting of MINVU. The housing subsidy was adopted as a positive instrument of housing policy, but criteria to allocate it among applicants were modified in order to focalise on lower income households. Also, not only individual applications were allowed, but also group applications, a decision that had important political implications.
The new democratic government elected in 1990 faced an accumulated pressure and the menace of land invasions. The housing subsidy budget was incremented allowing for an increase in government produced housing as well as in privately partially subsidized housing. The number of subsidies rapidly reached figures above 70.000 and, although some fluctuations took place in later years, the total number of subsidies granted each year provided relatively high and stable flow of demand.
The stability of public housing policy had at least two important consequences. First, homeless families became confident in the operation of the system as an effective way to access a dwelling, inhibiting the alternative of land invasions, which were few after 1990, when the threat of brutal repression was gone. Second, the stable and increasing flow of public resources into social
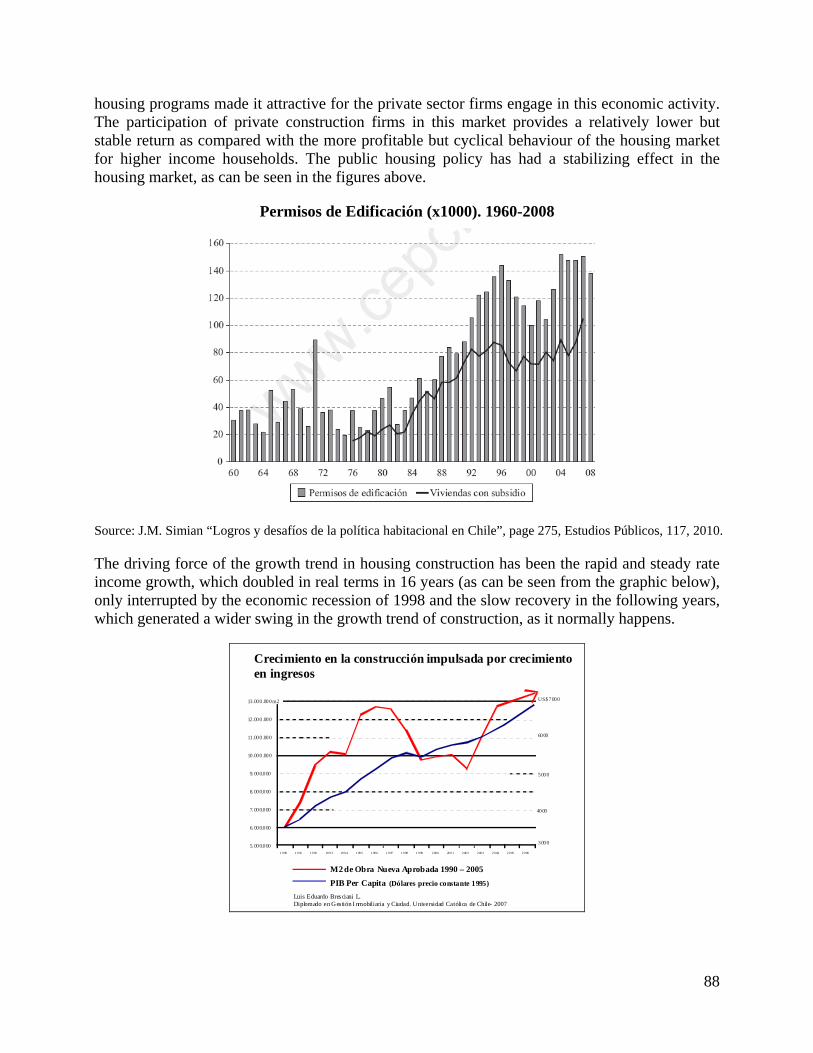
88
housing programs made it attractive for the private sector firms engage in this economic activity. The participation of private construction firms in this market provides a relatively lower but stable return as compared with the more profitable but cyclical behaviour of the housing market for higher income households. The public housing policy has had a stabilizing effect in the housing market, as can be seen in the figures above.
Permisos de Edificación (x1000). 1960-2008
Source: J.M. Simian “Logros y desafíos de la política habitacional en Chile”, page 275, Estudios Públicos, 117, 2010.
The driving force of the growth trend in housing construction has been the rapid and steady rate income growth, which doubled in real terms in 16 years (as can be seen from the graphic below), only interrupted by the economic recession of 1998 and the slow recovery in the following years, which generated a wider swing in the growth trend of construction, as it normally happens.
5. 000.000
6. 000.000
7. 000.000
8. 000.000
9. 000.000
10.000 .000
11.000 .000
12.000 .000
13.000 .000 m2
1 9 90 1 9 91 1 9 92 19 9 3 19 9 4 1 99 5 1 99 6 1 9 97 1 9 98 1 9 99 2 00 0 20 0 1 2 00 2 2 00 3 2 0 04 2 0 05 2 0 06
3000
4000
5000
6000
US$ 7000
Crecimiento en la construcción impulsada por crecimiento en ingresos
M2 de Obra Nueva Aprobada 1990 – 2005 PIB Per Capita (Dólares precio constante 1995)
Luis Eduardo Bresciani L. Diplomado en Ges tión I nmobiliaria y Ciudad. Universidad Católica de Chile- 2007
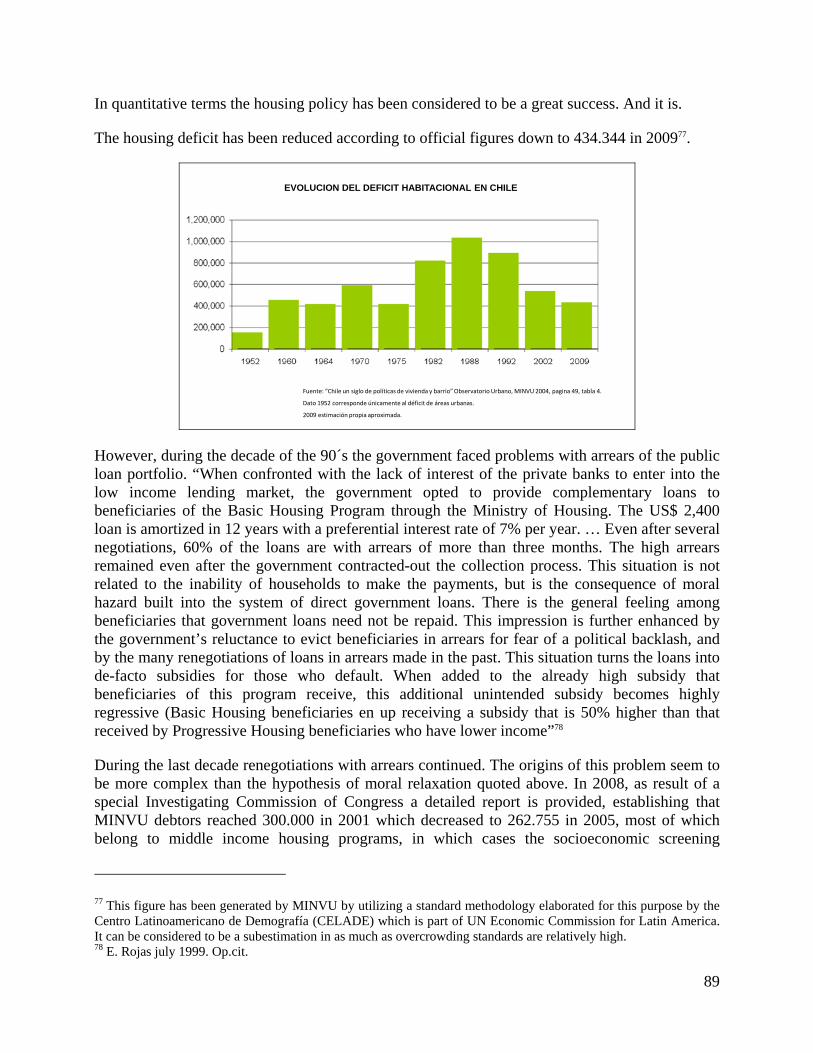
89
In quantitative terms the housing policy has been considered to be a great success. And it is.
The housing deficit has been reduced according to official figures down to 434.344 in 200977.
Fuente: “Chile un siglo de políticas de vivienda y barrio”Observatorio Urbano, MINVU 2004, pagina 49, tabla 4.
Dato 1952 corresponde únicamente al déficit de áreas urbanas.
2009 estimación propia aproximada.
EVOLUCION DEL DEFICIT HABITACIONAL EN CHILE
However, during the decade of the 90´s the government faced problems with arrears of the public loan portfolio. “When confronted with the lack of interest of the private banks to enter into the low income lending market, the government opted to provide complementary loans to beneficiaries of the Basic Housing Program through the Ministry of Housing. The US$ 2,400 loan is amortized in 12 years with a preferential interest rate of 7% per year. … Even after several negotiations, 60% of the loans are with arrears of more than three months. The high arrears remained even after the government contracted-out the collection process. This situation is not related to the inability of households to make the payments, but is the consequence of moral hazard built into the system of direct government loans. There is the general feeling among beneficiaries that government loans need not be repaid. This impression is further enhanced by the government’s reluctance to evict beneficiaries in arrears for fear of a political backlash, and by the many renegotiations of loans in arrears made in the past. This situation turns the loans into de-facto subsidies for those who default. When added to the already high subsidy that beneficiaries of this program receive, this additional unintended subsidy becomes highly regressive (Basic Housing beneficiaries en up receiving a subsidy that is 50% higher than that received by Progressive Housing beneficiaries who have lower income”78
During the last decade renegotiations with arrears continued. The origins of this problem seem to be more complex than the hypothesis of moral relaxation quoted above. In 2008, as result of a special Investigating Commission of Congress a detailed report is provided, establishing that MINVU debtors reached 300.000 in 2001 which decreased to 262.755 in 2005, most of which belong to middle income housing programs, in which cases the socioeconomic screening
77 This figure has been generated by MINVU by utilizing a standard methodology elaborated for this purpose by the Centro Latinoamericano de Demografía (CELADE) which is part of UN Economic Commission for Latin America. It can be considered to be a subestimation in as much as overcrowding standards are relatively high. 78 E. Rojas july 1999. Op.cit.
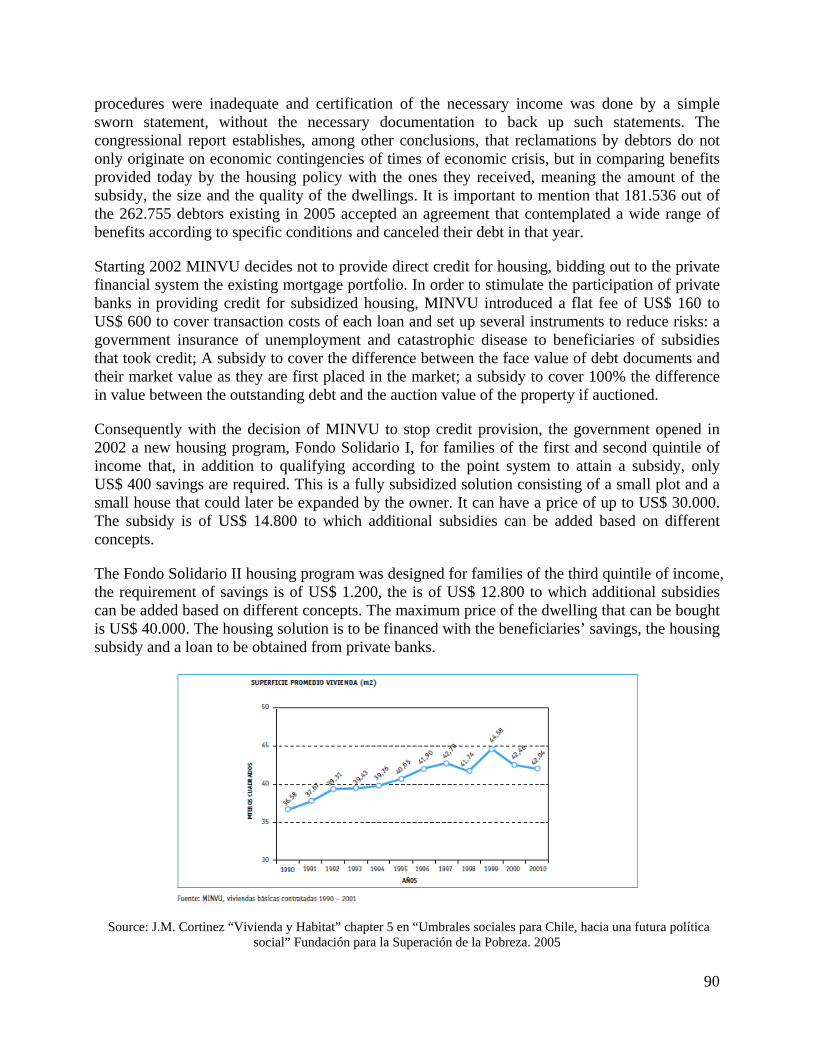
90
procedures were inadequate and certification of the necessary income was done by a simple sworn statement, without the necessary documentation to back up such statements. The congressional report establishes, among other conclusions, that reclamations by debtors do not only originate on economic contingencies of times of economic crisis, but in comparing benefits provided today by the housing policy with the ones they received, meaning the amount of the subsidy, the size and the quality of the dwellings. It is important to mention that 181.536 out of the 262.755 debtors existing in 2005 accepted an agreement that contemplated a wide range of benefits according to specific conditions and canceled their debt in that year.
Starting 2002 MINVU decides not to provide direct credit for housing, bidding out to the private financial system the existing mortgage portfolio. In order to stimulate the participation of private banks in providing credit for subsidized housing, MINVU introduced a flat fee of US$ 160 to US$ 600 to cover transaction costs of each loan and set up several instruments to reduce risks: a government insurance of unemployment and catastrophic disease to beneficiaries of subsidies that took credit; A subsidy to cover the difference between the face value of debt documents and their market value as they are first placed in the market; a subsidy to cover 100% the difference in value between the outstanding debt and the auction value of the property if auctioned.
Consequently with the decision of MINVU to stop credit provision, the government opened in 2002 a new housing program, Fondo Solidario I, for families of the first and second quintile of income that, in addition to qualifying according to the point system to attain a subsidy, only US$ 400 savings are required. This is a fully subsidized solution consisting of a small plot and a small house that could later be expanded by the owner. It can have a price of up to US$ 30.000. The subsidy is of US$ 14.800 to which additional subsidies can be added based on different concepts.
The Fondo Solidario II housing program was designed for families of the third quintile of income, the requirement of savings is of US$ 1.200, the is of US$ 12.800 to which additional subsidies can be added based on different concepts. The maximum price of the dwelling that can be bought is US$ 40.000. The housing solution is to be financed with the beneficiaries’ savings, the housing subsidy and a loan to be obtained from private banks.
Source: J.M. Cortinez “Vivienda y Habitat” chapter 5 en “Umbrales sociales para Chile, hacia una futura política social” Fundación para la Superación de la Pobreza. 2005
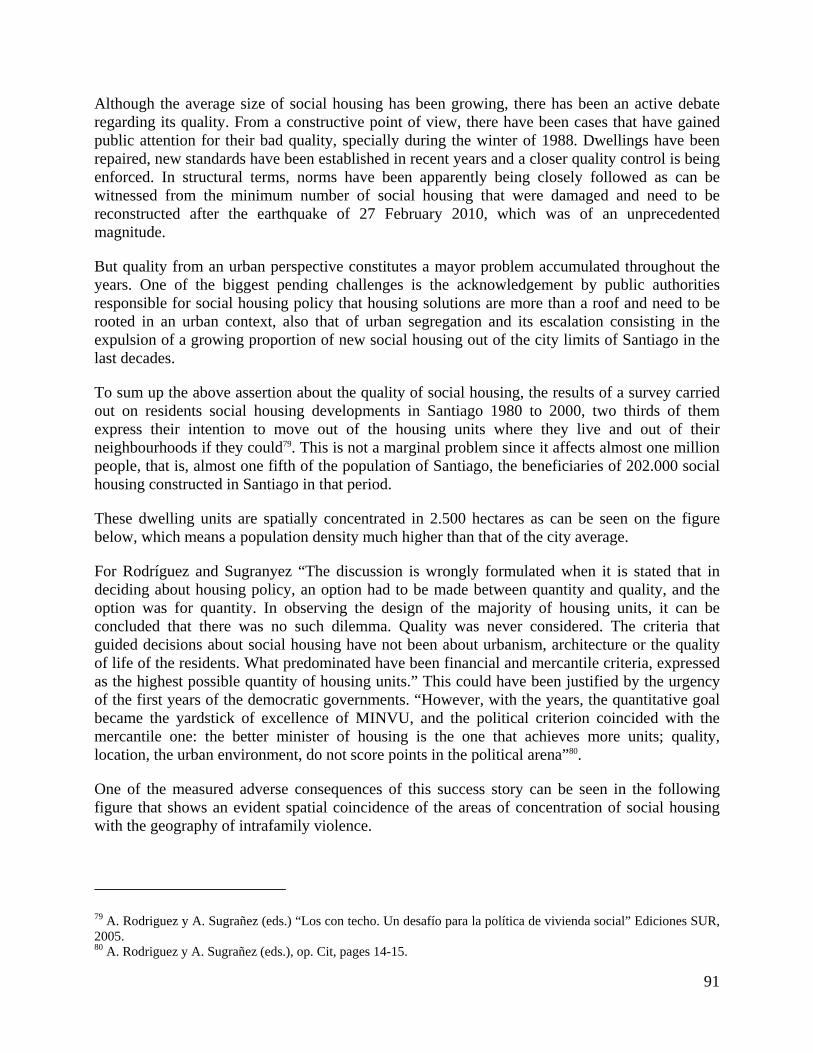
91
Although the average size of social housing has been growing, there has been an active debate regarding its quality. From a constructive point of view, there have been cases that have gained public attention for their bad quality, specially during the winter of 1988. Dwellings have been repaired, new standards have been established in recent years and a closer quality control is being enforced. In structural terms, norms have been apparently being closely followed as can be witnessed from the minimum number of social housing that were damaged and need to be reconstructed after the earthquake of 27 February 2010, which was of an unprecedented magnitude.
But quality from an urban perspective constitutes a mayor problem accumulated throughout the years. One of the biggest pending challenges is the acknowledgement by public authorities responsible for social housing policy that housing solutions are more than a roof and need to be rooted in an urban context, also that of urban segregation and its escalation consisting in the expulsion of a growing proportion of new social housing out of the city limits of Santiago in the last decades.
To sum up the above assertion about the quality of social housing, the results of a survey carried out on residents social housing developments in Santiago 1980 to 2000, two thirds of them express their intention to move out of the housing units where they live and out of their neighbourhoods if they could79. This is not a marginal problem since it affects almost one million people, that is, almost one fifth of the population of Santiago, the beneficiaries of 202.000 social housing constructed in Santiago in that period.
These dwelling units are spatially concentrated in 2.500 hectares as can be seen on the figure below, which means a population density much higher than that of the city average.
For Rodríguez and Sugranyez “The discussion is wrongly formulated when it is stated that in deciding about housing policy, an option had to be made between quantity and quality, and the option was for quantity. In observing the design of the majority of housing units, it can be concluded that there was no such dilemma. Quality was never considered. The criteria that guided decisions about social housing have not been about urbanism, architecture or the quality of life of the residents. What predominated have been financial and mercantile criteria, expressed as the highest possible quantity of housing units.” This could have been justified by the urgency of the first years of the democratic governments. “However, with the years, the quantitative goal became the yardstick of excellence of MINVU, and the political criterion coincided with the mercantile one: the better minister of housing is the one that achieves more units; quality, location, the urban environment, do not score points in the political arena”80.
One of the measured adverse consequences of this success story can be seen in the following figure that shows an evident spatial coincidence of the areas of concentration of social housing with the geography of intrafamily violence.
79 A. Rodriguez y A. Sugrañez (eds.) “Los con techo. Un desafío para la política de vivienda social” Ediciones SUR, 2005. 80 A. Rodriguez y A. Sugrañez (eds.), op. Cit, pages 14-15.
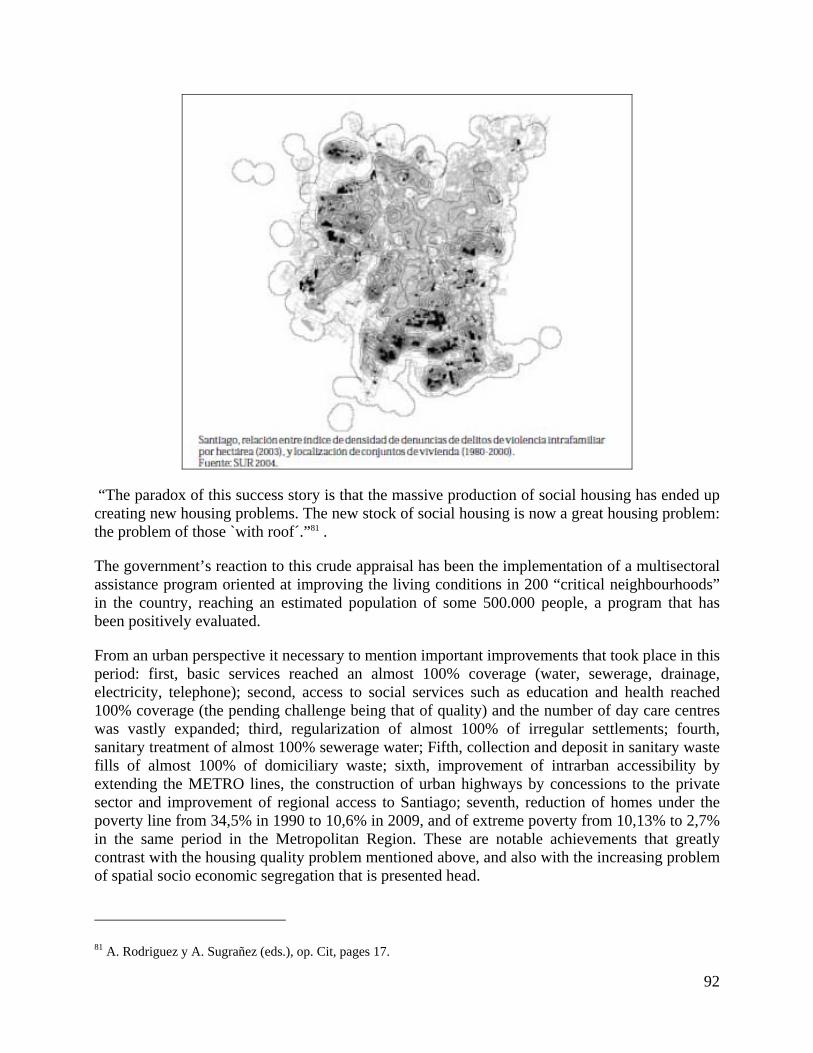
92
“The paradox of this success story is that the massive production of social housing has ended up creating new housing problems. The new stock of social housing is now a great housing problem: the problem of those `with roof´.”81 .
The government’s reaction to this crude appraisal has been the implementation of a multisectoral assistance program oriented at improving the living conditions in 200 “critical neighbourhoods” in the country, reaching an estimated population of some 500.000 people, a program that has been positively evaluated.
From an urban perspective it necessary to mention important improvements that took place in this period: first, basic services reached an almost 100% coverage (water, sewerage, drainage, electricity, telephone); second, access to social services such as education and health reached 100% coverage (the pending challenge being that of quality) and the number of day care centres was vastly expanded; third, regularization of almost 100% of irregular settlements; fourth, sanitary treatment of almost 100% sewerage water; Fifth, collection and deposit in sanitary waste fills of almost 100% of domiciliary waste; sixth, improvement of intrarban accessibility by extending the METRO lines, the construction of urban highways by concessions to the private sector and improvement of regional access to Santiago; seventh, reduction of homes under the poverty line from 34,5% in 1990 to 10,6% in 2009, and of extreme poverty from 10,13% to 2,7% in the same period in the Metropolitan Region. These are notable achievements that greatly contrast with the housing quality problem mentioned above, and also with the increasing problem of spatial socio economic segregation that is presented head.
81 A. Rodriguez y A. Sugrañez (eds.), op. Cit, pages 17.
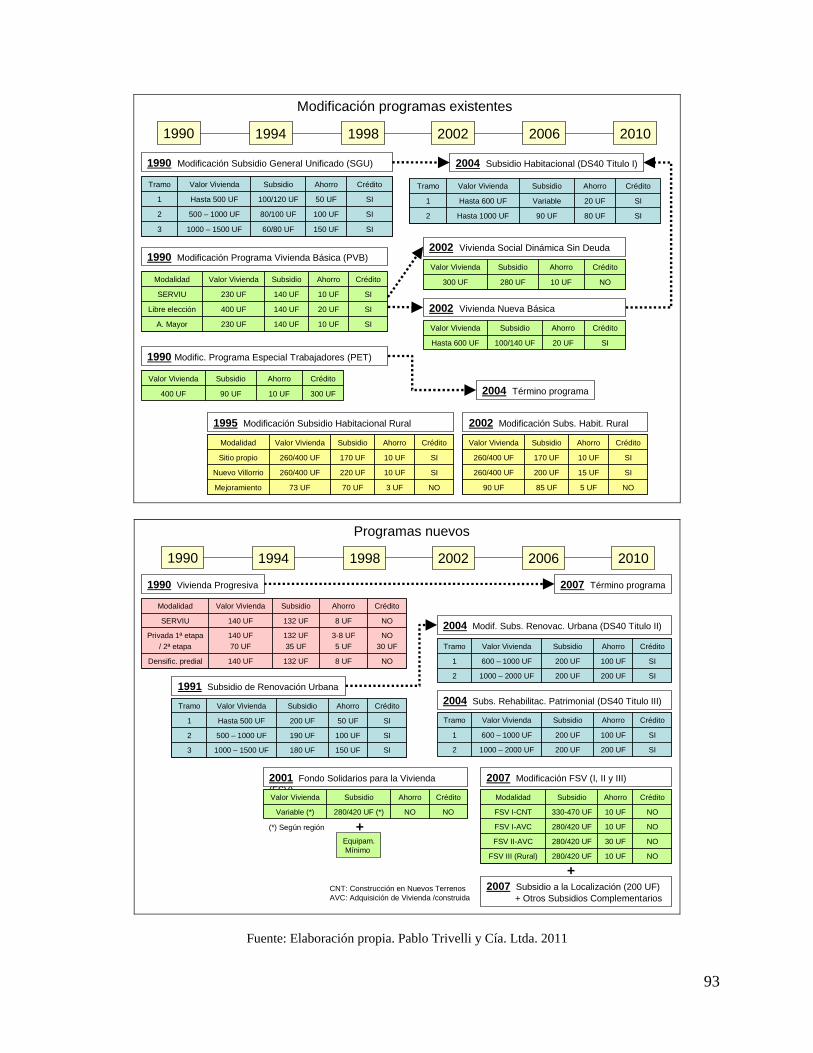
93
1990 1994 1998 2002 2006 2010
Tramo Valor Vivienda Subsidio Ahorro Crédito
1 Hasta 500 UF 100/120 UF 50 UF SI
2 500 – 1000 UF 80/100 UF 100 UF SI
3 1000 – 1500 UF 60/80 UF 150 UF SI
Tramo Valor Vivienda Subsidio Ahorro Crédito
1 Hasta 500 UF 100/120 UF 50 UF SI
2 500 – 1000 UF 80/100 UF 100 UF SI
3 1000 – 1500 UF 60/80 UF 150 UF SI
1990 Modificación Programa Vivienda Básica (PVB)
1990 Modificación Subsidio General Unificado (SGU)
Modalidad Valor Vivienda Subsidio Ahorro Crédito
SERVIU 230 UF 140 UF 10 UF SI
Libre elección 400 UF 140 UF 20 UF SI
A. Mayor 230 UF 140 UF 10 UF SI
Modalidad Valor Vivienda Subsidio Ahorro Crédito
SERVIU 230 UF 140 UF 10 UF SI
Libre elección 400 UF 140 UF 20 UF SI
A. Mayor 230 UF 140 UF 10 UF SI
1990 Modific. Programa Especial Trabajadores (PET)
Valor Vivienda Subsidio Ahorro Crédito
400 UF 90 UF 10 UF 300 UF
Valor Vivienda Subsidio Ahorro Crédito
400 UF 90 UF 10 UF 300 UF
2004 Subsidio Habitacional (DS40 Titulo I)
Modificación programas existentes
2002 Vivienda Social Dinámica Sin Deuda
2004 Término programa
2002 Vivienda Nueva Básica
Valor Vivienda Subsidio Ahorro Crédito
300 UF 280 UF 10 UF NO
Valor Vivienda Subsidio Ahorro Crédito
300 UF 280 UF 10 UF NO
Valor Vivienda Subsidio Ahorro Crédito
Hasta 600 UF 100/140 UF 20 UF SI
Valor Vivienda Subsidio Ahorro Crédito
Hasta 600 UF 100/140 UF 20 UF SI
1995 Modificación Subsidio Habitacional Rural
Modalidad Valor Vivienda Subsidio Ahorro Crédito
Sitio propio 260/400 UF 170 UF 10 UF SI
Nuevo Villorrio 260/400 UF 220 UF 10 UF SI
Mejoramiento 73 UF 70 UF 3 UF NO
Modalidad Valor Vivienda Subsidio Ahorro Crédito
Sitio propio 260/400 UF 170 UF 10 UF SI
Nuevo Villorrio 260/400 UF 220 UF 10 UF SI
Mejoramiento 73 UF 70 UF 3 UF NO
2002 Modificación Subs. Habit. Rural
Valor Vivienda Subsidio Ahorro Crédito
260/400 UF 170 UF 10 UF SI
260/400 UF 200 UF 15 UF SI
90 UF 85 UF 5 UF NO
Valor Vivienda Subsidio Ahorro Crédito
260/400 UF 170 UF 10 UF SI
260/400 UF 200 UF 15 UF SI
90 UF 85 UF 5 UF NO
Tramo Valor Vivienda Subsidio Ahorro Crédito
1 Hasta 600 UF Variable 20 UF SI
2 Hasta 1000 UF 90 UF 80 UF SI
Tramo Valor Vivienda Subsidio Ahorro Crédito
1 Hasta 600 UF Variable 20 UF SI
2 Hasta 1000 UF 90 UF 80 UF SI
1990 1994 1998 2002 2006 2010
1990 Vivienda Progresiva
Modalidad Valor Vivienda Subsidio Ahorro Crédito
SERVIU 140 UF 132 UF 8 UF NO
Privada 1ª etapa/ 2ª etapa
140 UF70 UF
132 UF35 UF
3-8 UF5 UF
NO30 UF
Densific. predial 140 UF 132 UF 8 UF NO
Modalidad Valor Vivienda Subsidio Ahorro Crédito
SERVIU 140 UF 132 UF 8 UF NO
Privada 1ª etapa/ 2ª etapa
140 UF70 UF
132 UF35 UF
3-8 UF5 UF
NO30 UF
Densific. predial 140 UF 132 UF 8 UF NO
Programas nuevos
1991 Subsidio de Renovación Urbana
Tramo Valor Vivienda Subsidio Ahorro Crédito
1 Hasta 500 UF 200 UF 50 UF SI
2 500 – 1000 UF 190 UF 100 UF SI
3 1000 – 1500 UF 180 UF 150 UF SI
Tramo Valor Vivienda Subsidio Ahorro Crédito
1 Hasta 500 UF 200 UF 50 UF SI
2 500 – 1000 UF 190 UF 100 UF SI
3 1000 – 1500 UF 180 UF 150 UF SI
2001 Fondo Solidarios para la Vivienda (FSV)Valor Vivienda Subsidio Ahorro Crédito
Variable (*) 280/420 UF (*) NO NO
Valor Vivienda Subsidio Ahorro Crédito
Variable (*) 280/420 UF (*) NO NO
Tramo Valor Vivienda Subsidio Ahorro Crédito
1 600 – 1000 UF 200 UF 100 UF SI
2 1000 – 2000 UF 200 UF 200 UF SI
Tramo Valor Vivienda Subsidio Ahorro Crédito
1 600 – 1000 UF 200 UF 100 UF SI
2 1000 – 2000 UF 200 UF 200 UF SI
2004 Modif. Subs. Renovac. Urbana (DS40 Titulo II)
Tramo Valor Vivienda Subsidio Ahorro Crédito
1 600 – 1000 UF 200 UF 100 UF SI
2 1000 – 2000 UF 200 UF 200 UF SI
Tramo Valor Vivienda Subsidio Ahorro Crédito
1 600 – 1000 UF 200 UF 100 UF SI
2 1000 – 2000 UF 200 UF 200 UF SI
2004 Subs. Rehabilitac. Patrimonial (DS40 Titulo III)
2007 Término programa
2007 Subsidio a la Localización (200 UF)+ Otros Subsidios Complementarios
(*) Según región +Equipam.Mínimo
2007 Modificación FSV (I, II y III)
Modalidad Subsidio Ahorro Crédito
FSV I-CNT 330-470 UF 10 UF NO
FSV I-AVC 280/420 UF 10 UF NO
FSV II-AVC 280/420 UF 30 UF NO
FSV III (Rural) 280/420 UF 10 UF NO
Modalidad Subsidio Ahorro Crédito
FSV I-CNT 330-470 UF 10 UF NO
FSV I-AVC 280/420 UF 10 UF NO
FSV II-AVC 280/420 UF 30 UF NO
FSV III (Rural) 280/420 UF 10 UF NO
CNT: Construcción en Nuevos TerrenosAVC: Adquisición de Vivienda /construida
+
Fuente: Elaboración propia. Pablo Trivelli y Cía. Ltda. 2011
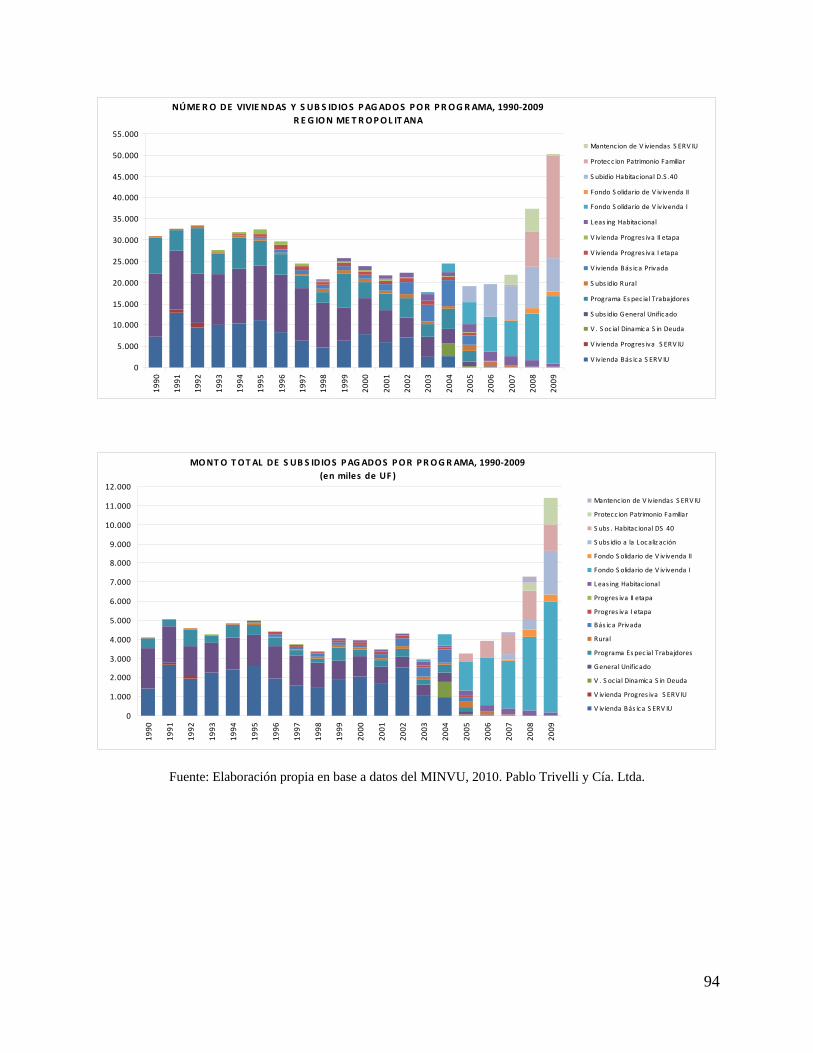
94
NÚMERO DE VIVIE NDAS Y S UB S IDIOS PAGADOS POR PROGRAMA, 1990‐2009R E G ION MET ROPOL IT ANA
0
5.000
10.000
15.000
20.000
25.000
30.000
35.000
40.000
45.000
50.000
55.000
1990
1991
1992
1993
1994
1995
1996
1997
1998
1999
2000
2001
2002
2003
2004
2005
2006
2007
2008
2009
Mantenc ion de V iviendas S ERV IU
Protecc ion Patrimonio Familiar
S ubidio Habitac ional D.S .40
Fondo S olidario de V ivivenda II
Fondo S olidario de V ivivenda I
Leas ing Habitac ional
V ivienda Progres iva II etapa
V ivienda Progres iva I etapa
V ivienda Bás ica Privada
S ubs idio Rural
Programa Es pec ial Trabajdores
S ubs idio General Unificado
V . S oc ial Dinamica S in Deuda
V ivienda Progres iva S ERV IU
V ivienda Bás ica S ERV IU
MONTO TOTAL DE S UB S IDIOS PAGADOS POR PROGRAMA, 1990‐2009(en miles de UF )
0
1.000
2.000
3.000
4.000
5.000
6.000
7.000
8.000
9.000
10.000
11.000
12.000
1990
1991
1992
1993
1994
1995
1996
1997
1998
1999
2000
2001
2002
2003
2004
2005
2006
2007
2008
2009
Mantenc ion de V iviendas S ERV IU
Protecc ion Patrimonio Familiar
S ubs . Habitac ional DS 40
S ubs idio a la Localiz ac ión
Fondo S olidario de V ivivenda II
Fondo S olidario de V ivivenda I
L eas ing Habitac ional
Progres iva II etapa
Progres iva I etapa
Bás ica Privada
Rural
Programa Es pec ial Trabajdores
General Unificado
V . S oc ial Dinamica S in Deuda
V ivienda Progres iva S ERV IU
V ivienda Bás ica S ERV IU
Fuente: Elaboración propia en base a datos del MINVU, 2010. Pablo Trivelli y Cía. Ltda.
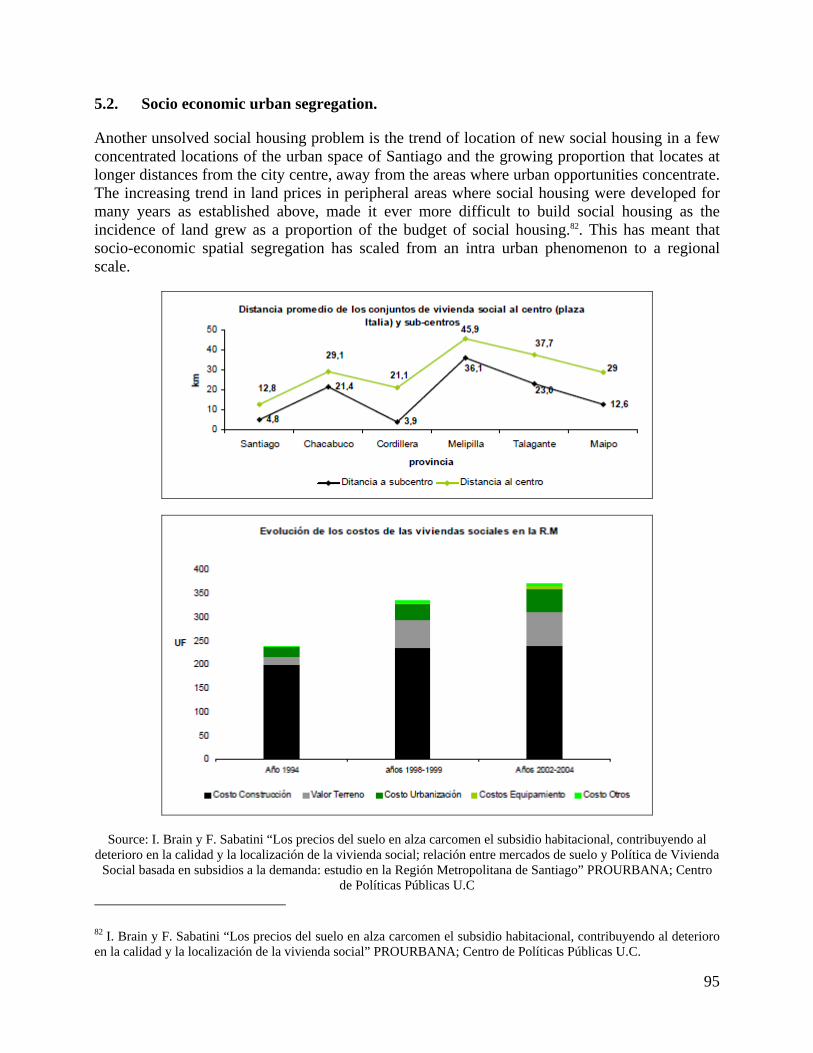
95
5.2. Socio economic urban segregation.
Another unsolved social housing problem is the trend of location of new social housing in a few concentrated locations of the urban space of Santiago and the growing proportion that locates at longer distances from the city centre, away from the areas where urban opportunities concentrate. The increasing trend in land prices in peripheral areas where social housing were developed for many years as established above, made it ever more difficult to build social housing as the incidence of land grew as a proportion of the budget of social housing.82. This has meant that socio-economic spatial segregation has scaled from an intra urban phenomenon to a regional scale.
Source: I. Brain y F. Sabatini “Los precios del suelo en alza carcomen el subsidio habitacional, contribuyendo al deterioro en la calidad y la localización de la vivienda social; relación entre mercados de suelo y Política de Vivienda
Social basada en subsidios a la demanda: estudio en la Región Metropolitana de Santiago” PROURBANA; Centro de Políticas Públicas U.C
82 I. Brain y F. Sabatini “Los precios del suelo en alza carcomen el subsidio habitacional, contribuyendo al deterioro en la calidad y la localización de la vivienda social” PROURBANA; Centro de Políticas Públicas U.C.

96
The increasing proportion of social housing located in municipalities outside of the city limits of Santiago, that evolved from 13% of all social dwellings built in the period 1979 to 1983, to 13% in the period 1984-1989, to 40% in the period 1990 to 1995, and to 34% in 1996 to 2002, as can clearly be appreciated on the figures below that illustrate the number of social housing built in municipalities of the Metropolitan Region, which were elaborated on the basis of the statistics of a research report by Rodrigo Hidalgo83.
83 R. Hidalgo “¿Se acabó el suelo en la gran ciudad? Las nuevas periferias metropolitanas de la vivienda social en Santiago de Chile” EURE, Vol.XXXIII, Nº 98, pp.57-75, may 2007. Similar conclusions are reached by other authors: I: Poduje “ Vivienda social en Chile, un producto en serie sin localización”, Lincoln Institute Research Report, 2000; M.E Ducci “El lado obscuro de una política de vivienda exitosa” EURE Vol. XXIII, Nº 69, pp99-115, 1997; P. Jirón y P. Cortés “Análisis de la política habitacional chilena y sus futuras orientaciones” INVI Documento de Trabajo Nº 4, FAU U de Chile 2004.
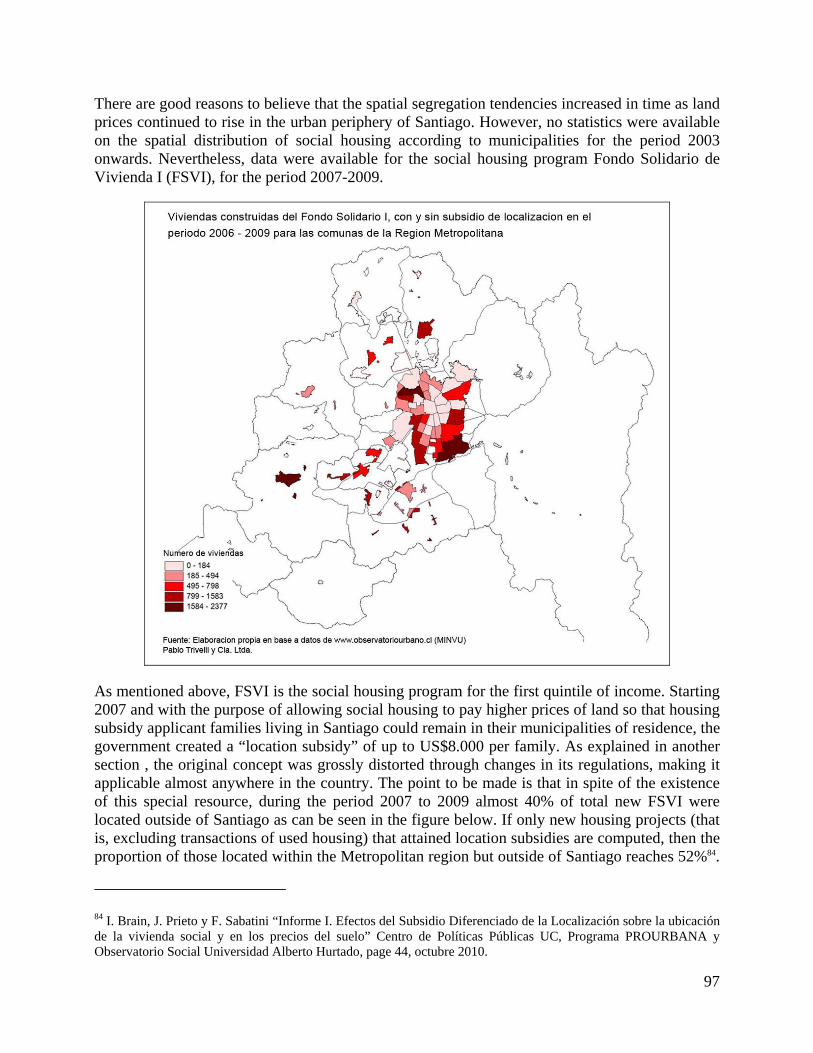
97
There are good reasons to believe that the spatial segregation tendencies increased in time as land prices continued to rise in the urban periphery of Santiago. However, no statistics were available on the spatial distribution of social housing according to municipalities for the period 2003 onwards. Nevertheless, data were available for the social housing program Fondo Solidario de Vivienda I (FSVI), for the period 2007-2009.
As mentioned above, FSVI is the social housing program for the first quintile of income. Starting 2007 and with the purpose of allowing social housing to pay higher prices of land so that housing subsidy applicant families living in Santiago could remain in their municipalities of residence, the government created a “location subsidy” of up to US$8.000 per family. As explained in another section , the original concept was grossly distorted through changes in its regulations, making it applicable almost anywhere in the country. The point to be made is that in spite of the existence of this special resource, during the period 2007 to 2009 almost 40% of total new FSVI were located outside of Santiago as can be seen in the figure below. If only new housing projects (that is, excluding transactions of used housing) that attained location subsidies are computed, then the proportion of those located within the Metropolitan region but outside of Santiago reaches 52%84.
84 I. Brain, J. Prieto y F. Sabatini “Informe I. Efectos del Subsidio Diferenciado de la Localización sobre la ubicación de la vivienda social y en los precios del suelo” Centro de Políticas Públicas UC, Programa PROURBANA y Observatorio Social Universidad Alberto Hurtado, page 44, octubre 2010.
98
This constitutes a dilapidation of public resources and an open contradiction with the spirit of the location subsidy, but also with the fact that 90% of the estimated housing deficit in the Metropolitan Region in 2006 locates in Santiago. New developments of social housing continue to be expelled from the city at a growing proportion in spite of the location subsidy.
One of the distortions introduced into the regulations of the location subsidy was its applicability to the existing social housing stock. Research results regarding its application within the space of Santiago for the acquisition of “used housing” as they are denominated, establish that its main impact was an increase in housing prices, which rose up to the maximum subsidy amount available for such transactions. The results were evaluated in the following terms “…units were on the average only 15% better with regards to their attribute mix (location, size, etc.), while their prices had increased by 86%.” …“the design of this program turned a well intended increase in the levels of assistance provided into house price inflation and therefore into a wealth transfer to sellers.”85 There is no doubt that this instrument, conceived in order to help low income housing to have access to better urban locations where land prices are usually higher, should be redesigned in its future applications.
If the concept of democracy is unequivocally associated with the principle of equal opportunity, its urban expression in an urban context could be spelled out as a principle of equal urban opportunities.
Socio economic spatial segregation in Santiago and in most Chilean cities constitutes a flagrant transgression of this basic principle of democratic life. The paradox is that the dynamics of economic development, that opens all sorts of new opportunities in the urban context, also generates increases in land prices, which spatially distance of such opportunities those that are in higher need of them, increasing the inequality of access to urban opportunities. This is the result of the free operation of the land market in the absence of an urban policy and a land policy and of the lack awareness of the incidence of the socio economic spatial ordering on accessibility to opportunities.
The socio economic stratification figures elaborated on the basis of the census of 1982, 1992 and 2002 which are presented below allow to appreciate the degree of spatial segregation in Santiago and its accentuation over time. Not surprising is the high concentration of high socio economic strata in the urban space of Santiago, but more remarkable is the even higher concentration of very low strata on specific urban areas.
More remarcable are the results of the estimation of per capita income in space and its trend to concentrate in the north-eastern development front of Santiago as shown in the figures below. The concern for such segregated situation is not only an ideological or political matter. It can be associated to very a concrete reality of unequal opportunities as can be appreciated from the figures of the intraurban spatial distribution of the educational achievement scores of elementary school, scoring of college board examination, per capita municipal income and per capita municipal investment budget, the availability of green areas, and the Human Development Index elaborated by UNDP according to municipalities. 85 Slaven A. Razmilic Burgos “Property values, housing subsidies and incentives: evidence from Chile’s housing policies” 2010, page 19
99
If a housing solution is more than a dwelling with sanitary services and electricity, a roof under which a family can live, then a housing policy should go hand in hand with an urban policy. This is not the case in Santiago or in Chile. There does not exist an urban government to govern Santiago and municipalities operate independently, except in the provision of some services as solid waste collection and disposal, traffic management, etc. Municipal investment budget is marginal when compared with central government investment in urban areas, which is channelled through the regional government agencies. This would not be such so much of a problem if the regional authorities would have an urban vision and consequently a development plan of action. But the regional government is organized by sectors that seldom act in a coordinated way. The attainment of a goal of urban equal opportunity is at best attended sectorally by authorities that seldom take into consideration the special socio economic structure or the existence of space as relevant factor in this regard. The consequence is that the achievement of higher equality in access to urban opportunities tends to remain in the limbo of political responsibility, unless policy directives emanate from higher levels of the public administration.
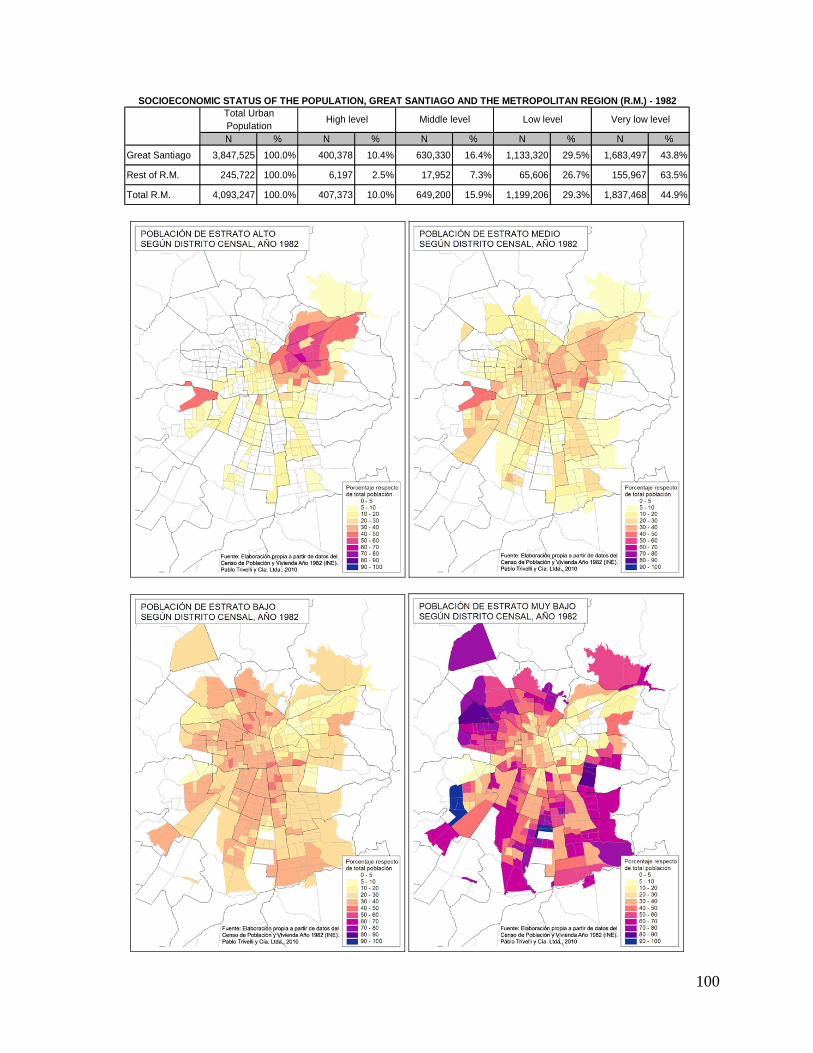
100
N % N % N % N % N %Great Santiago 3,847,525 100.0% 400,378 10.4% 630,330 16.4% 1,133,320 29.5% 1,683,497 43.8%
Rest of R.M. 245,722 100.0% 6,197 2.5% 17,952 7.3% 65,606 26.7% 155,967 63.5%
Total R.M. 4,093,247 100.0% 407,373 10.0% 649,200 15.9% 1,199,206 29.3% 1,837,468 44.9%
Total Urban Population
SOCIOECONOMIC STATUS OF THE POPULATION, GREAT SANTIAGO AND THE METROPOLITAN REGION (R.M.) - 1982
High level Middle level Low level Very low level

101
N % N % N % N % N %Great Santiago 4,518,604 100.0% 455,330 10.1% 918,887 20.3% 1,310,993 29.0% 1,833,394 40.6%
Rest of R.M. 556,077 100.0% 11,851 2.1% 58,455 10.5% 130,455 23.5% 355,317 63.9%
Total R.M. 5,074,681 100.0% 485,576 9.6% 1,000,084 19.7% 1,454,305 28.7% 2,134,716 42.1%
Total Urban Population High level Middle level Low level Very low level
SOCIOECONOMIC STATUS OF THE POPULATION, GREAT SANTIAGO AND THE METROPOLITAN REGION (R.M.) - 1992
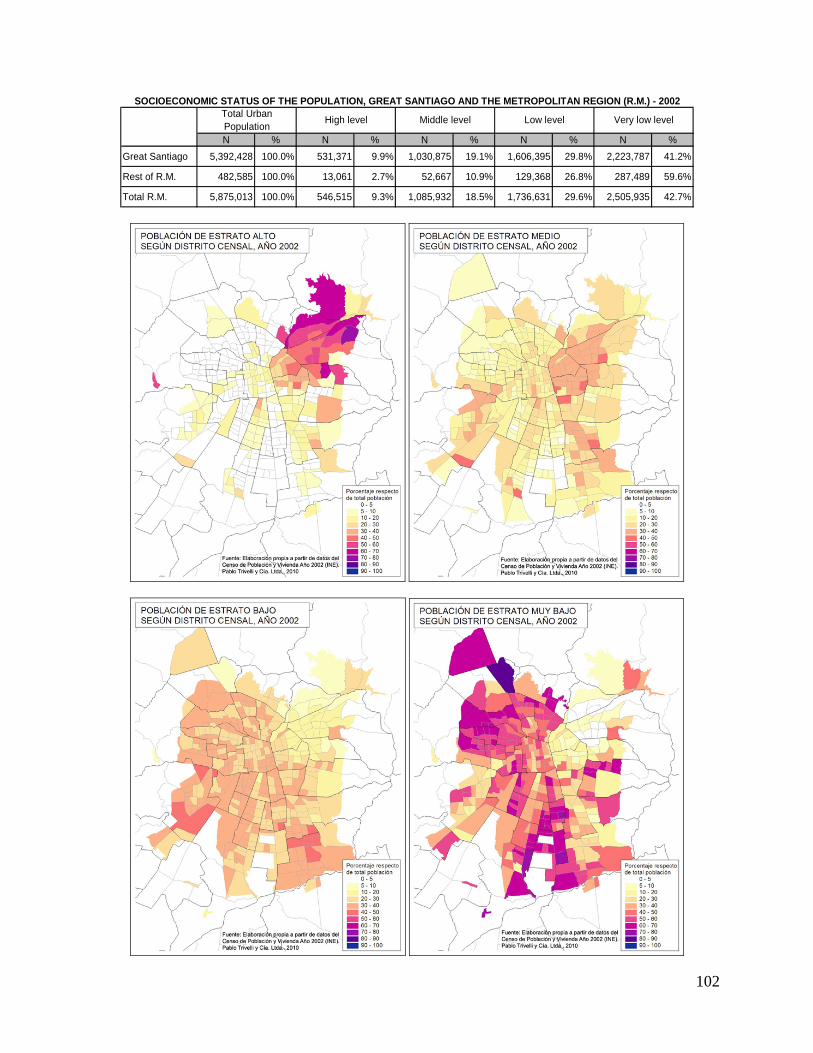
102
N % N % N % N % N %Great Santiago 5,392,428 100.0% 531,371 9.9% 1,030,875 19.1% 1,606,395 29.8% 2,223,787 41.2%
Rest of R.M. 482,585 100.0% 13,061 2.7% 52,667 10.9% 129,368 26.8% 287,489 59.6%
Total R.M. 5,875,013 100.0% 546,515 9.3% 1,085,932 18.5% 1,736,631 29.6% 2,505,935 42.7%
Low level Very low level
SOCIOECONOMIC STATUS OF THE POPULATION, GREAT SANTIAGO AND THE METROPOLITAN REGION (R.M.) - 2002Total Urban Population High level Middle level
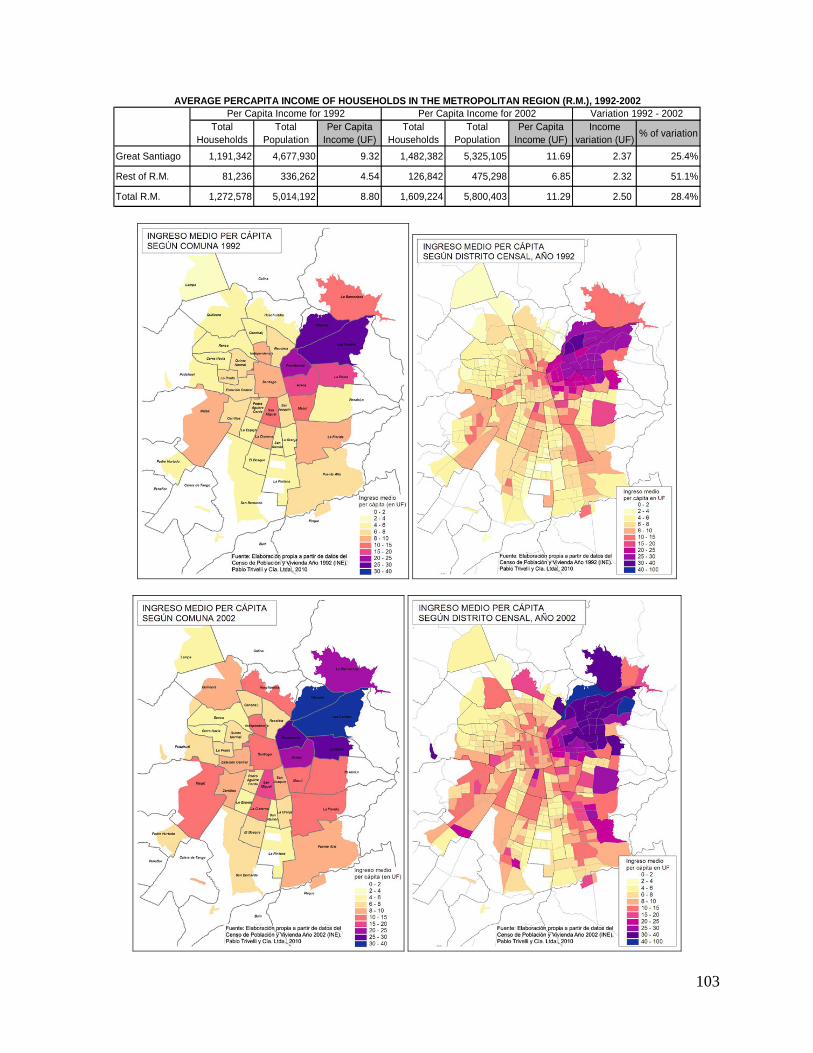
103
Total Households
Total Population
Per Capita Income (UF)
Total Households
Total Population
Per Capita Income (UF)
Income variation (UF) % of variation
Great Santiago 1,191,342 4,677,930 9.32 1,482,382 5,325,105 11.69 2.37 25.4%
Rest of R.M. 81,236 336,262 4.54 126,842 475,298 6.85 2.32 51.1%
Total R.M. 1,272,578 5,014,192 8.80 1,609,224 5,800,403 11.29 2.50 28.4%
AVERAGE PERCAPITA INCOME OF HOUSEHOLDS IN THE METROPOLITAN REGION (R.M.), 1992-2002Per Capita Income for 2002 Variation 1992 - 2002Per Capita Income for 1992
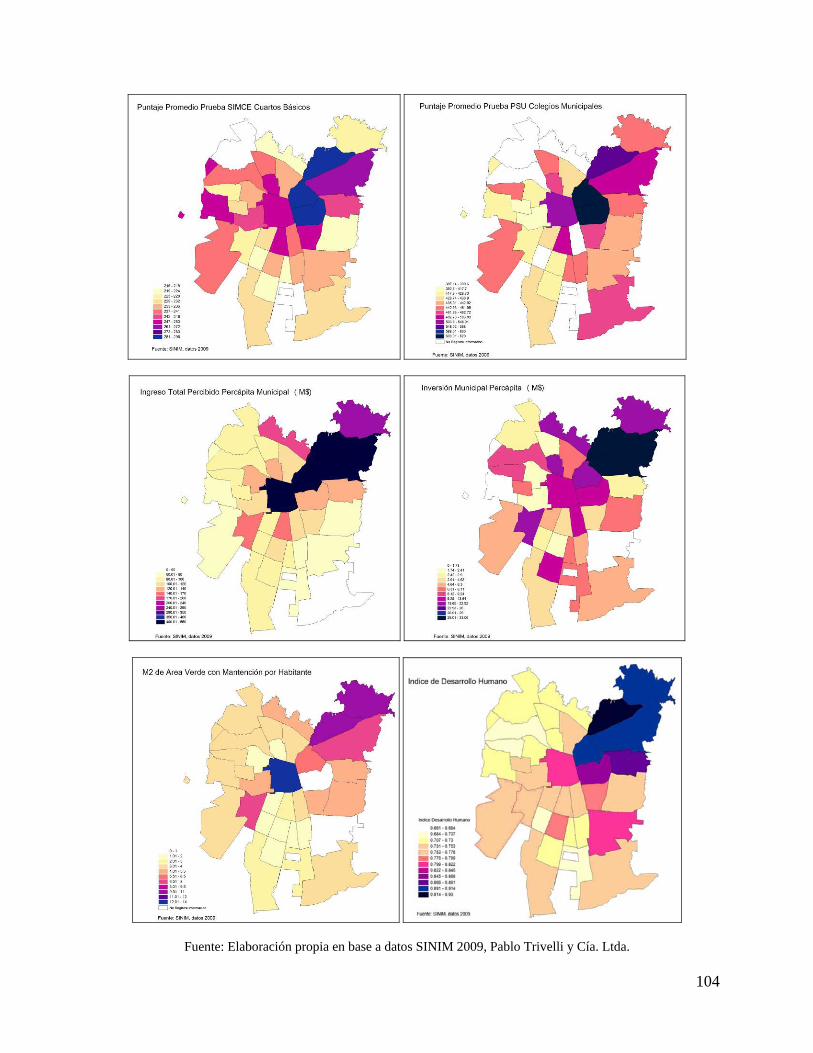
104
Fuente: Elaboración propia en base a datos SINIM 2009, Pablo Trivelli y Cía. Ltda.
105
6. Policy recommendations
Public authorities have become aware of the difficulties of providing urban land for social housing at affordable prices in locations that provide access to urban opportunities.
From an historical perspective, the massive production of “housing solutions” for low income households to attend a high population growth rates started in the late 50`s and early 60`s with the provision of site and service schemes, which at some points in time was nothing more than lots of raw land with a promise of provision of services86. The logic was that of maximizing the quantity of solutions. Considering that construction costs were reduced to a minimum with the site and service solutions, the only variable left to reduce cost was that of land: Choosing land with the lowest prices meant, almost by definition, an option for the worst urban conditions, which basically meant locating in the urban fringe, away from all kinds of urban opportunities, long travel time in public transport, inexistent or low quality municipal services, higher cost of living, etc.
During the military regime the construction of social housing was not very active and the housing deficit escalated to figures above 1.000.000 in 1990. Three important policy innovations took place in this period that would have a lasting effect. First, an urban policy oriented towards a more fluent operation of the market, which meant the simplification and deregulation of planning norms and the liberation of the land market. Second, the establishment of a demand subsidy for housing as the principal way in which the public sector would channel its help to low income households to solve the housing problem. Third, the privatization of the pension fund system, which meant the accumulation of long terms savings and the active operation of the capital market, allowing to finance housing developments for the middle and higher income population that could assume credit.
The market has been the main mechanism to supply social housing. The main role of the public sector has been that of administering the subsidies system and providing part of the required land out of its urban reserves for private development. In the 90`s, the public sector also had an active role by bidding to construction firms of the private sector the development of social housing on publicly owned land. This line of action has been reduced almost to cero as the public urban land bank has been utilized and not replenished, and also because of conflicts with constructors as to the responsibility of low quality cases, disputing the errors in the project specifications versus a poor execution.
Social houses can pay up to US$ 16 m2 for land.
This has historically conditioned peripheral locations in places with many disadvantages for the beneficiaries. The presence of high quantities of social housing in some points in the urban space and the lack of urban improvements of such areas tend to condition the prevalence of low land prices and the concentration of massive amounts of social housing in such areas.
86 A clear example of this is the so called “operación tiza” in the late 60`s as the public authorities were overwhelmed by land invasions. Aware that regularization costs to be faced later on would be far above the provision of basic infrastructure, the political decision was made to channel de popular pressure into such “solutions”.
106
This segregated scheme of urban development prevailed until the second half of the 90´s, when urban land prices surpassed the limit that social housing can pay for. As a matter of fact, the Quarterly Bulletin of Land Prices for Santiago, recorded for the first time in its history since 1982, no offering of land supply below US$ 41m287.
The consequence has been that is becoming increasingly difficult to locate social housing in Santiago, not because of an insufficient availability, but because the high level the price of it has reached.
For years this was not acknowledged as an aggravation of segregation and an eloquent transgression of the principle of equal opportunity, or more specifically, the principle of equal urban opportunities. It was simply perceived as the natural outcome of the market operation, meaning the natural order of things in urban development.
The only expression of concern prior to 2006, when President Bachelet took office, was the requirement of developing a minimum of 18% of housing subject to subsidy and 12% of social housing as part of the regulations of PDUC (2003).
As President Bachelet took office, the escalation of spatial social segregation from intraurban scale to a regional scale was acknowledged as a political challenge that should be assumed by the government.
The following policy measures were debated, some of which were implemented, and are still subject of debate in some academic and political circles, and constitute the matrix upon which policy alternatives will be elaborated. These are: first, the expansion of the city limit by public initiative, conditioning its development to destination of 8% of land to social housing. Second, the creation of a “location subsidy” in order to allow social housing projects to buy land in better located land. Third, a law of social integration. Fourth, the creation of a new subsidy of “social integration” which has been applied to a minim extent, among other reasons, because of cumbersome administrative procedures that make it difficult to operatePublic policy on urban land in Santiago, the expansion of the city limit.
In a recent decision, the Metropolitan Council rejected the proposal of the Ministry of Housing to expand the city limit of Santiago by 10.000 hectares. The regional public authorities have announced that this proposal will again be submitted for approval. Since it contains important policy directives, it constitutes a necessary reference for this research work.
The proposal advocated for the increase of land for housing of 9.551 hectares out of which 5.663 hectares would be devoted to housing and mixed land uses88, plus 873 hectares obtained by flexibilizing some existing exclusive industrial areas with high levels of vacancy into mixed use.
87 This benchmark of 1 UF is significative in terms of the real constant value monetary unit commonly use in Chile called Unidad de Fomento (UF). At present 1 UF is equivalent to US$ 41. 88 The rest of the land incorporated into de city limit, that is 3.888 hectares would be developed into parks and green areas.
107
The central argument of this proposal is that there is not enough land to develop social housing. As has been established before in this report, the city of Santiago has enough land to attend its needs for at least the next 20 years.
The difficulty to develop social housing is not a restriction of land but the prices that land have reached in Santiago. This is not mentioned in the presentation of the city limit change proposal, but it becomes an implicit concept when authorities establish as the main mechanism to develop social housing will be what is denominated conditioned planning, meaning that land incorporated into the city limit will have to comply with a number of conditions in order to effectively become urban land. One of those conditions is that an 8% of land devoted to housing and mixed uses has to be destined to social housing. It is notable that no considerations are made regarding the possible impact that such a policy measure will have on the land market, particularly on the level of land prices. But most important, it does not make any mention on how it would stimulate a more fluent operation of the land market to solve the accumulated social housing deficit, or on the expect flow of land to the market, particularly considering the speculative stimuli that are implicit in the land tax system.
The policy stakes are put on regulations and not in the market. Policy options on these matters are greatly influenced by ideological perspectives of authorities. In this case it is noticeable that the proposal was formulated by the government of a socialist president and later on adopted with no fundamental modifications by the following government that identifies with a right wing liberal perspective. It is also important to mention that the actual head of the Regional Government, a political position designated by the national President, in charge of fostering this metropolitan regulation change, was a former president of the Chilean Chamber of Constructors. In this context, it is relevant to discuss some implications from broader perspective, in the formulation of policy recommendations.
First, the proposed decision does not solve the accumulated deficit, affecting basically low and very low income households, which stands at 144.000 dwellings in 2004. The conditioned development of land devoting 8% of it to social housing would allow constructing 34.000 houses in 20 years, which means some 1.700 houses per year. If this were the only social housing policy measure, then the deficit of social housing would probably increase in the next 20 years.
A policy decision to expand the city limit by 10.000 hectares to attain a goal of 34.000 social dwellings in 20 years is clearly ineffective89.
The really important conceptual element is that two governments of such different political convictions relay on a regulatory strategy to solve the accessibility of lower income households to a place to live in. The bottom line is that this mechanism is considered as being politically correct.
89 By contrast, let it be mentioned that in the period 1980 to 2002, there were 202.000 social housing units developed in an area of 2.500 hectares in Santiago. A. Rodríguez y A. Sugranyes “Los con techo: Un desafío para la Política de Vivienda Social” SUR, 2004.
108
¿If the requirement to devote 8% of newly incorporated land is a legitimate policy decision, but insufficient, why would it not also legitimate to elevate it to a higher percentage of land in order to attain a higher impact in the reduction of the social housing deficit?
A second important point stem from the fact that it is the public sector that takes this initiative to expand the city limit while there still exit policy directives and regulations that entrust the private sector with the initiative to provide additional urban land.
At present, there are at least four different general sets of regulatory rules for the development housing and other real estate constructions in Santiago. First, those which are applicable to most urban land within the city limit. Second, those applicable to ZODUC, the first conditioned planning experiment in Chile which apply to some 10.000 hectares in the northern province of Santiago denominated Chacabuco. Third, those applicable to PDUC, which is a more sophisticated, conditioned planning regulatory regime that relies on the private initiative to increase the availability of urban land, three projects of which are in the process of being approved at present, which would add 2.200 hectares. The regulations of PDUC contemplate, among other conditions that this newly incorporated urban land would have to devote 18% to subsidized housing and 12% to social housing, to be developed simultaneously with housing for higher income families. Fourth, the rules established in the actual proposal to expand the city limit, which requires, among other conditions, that 8% of newly incorporated land that can be developed for housing use be devoted to social housing, but that in terms of its economic implications are far less exacting than those applicable to PDUC.
¿Is it healthy for a reasonable operation of the land market to have so many different rules and regulations operating simultaneously?
¿Why should the public authorities take initiative in providing additional urban land if the existing policy entrusts the private sector with this responsibility?
¿Why expand the city limit with less demanding regulations than those with which PDUC have to comply with?
The C.E.O of one of the PDUC, which has been in the process of approval for seven years, is categorical to express that this would be very unfair competition, because the conditions for the development of new urban land are substantially less demanding than those applied to PDUC and cost implications for the land owners are therefore much lower.
When the incorporation of urban land is done by the private sector, like in the case of the PDUC, there can be little doubt that detailed demand studies have been made and that the newly incorporated land will flow to the urban land market.
Knowing that the existing land taxing system will stimulate speculation ¿Why are there no policy measures contemplated in the proposal of expansion of the city limit to guarantee that land will effectively flow to the market?
Any new proposal to expand the city limit should previously contemplate a substantive change in urban tax policy and or adopt regulatory policy measures that assure the flow of land to the marked in order to effectively attend for the urban development needs.
109
a) Location subsidy to buy land in more expensive areas of the city. Aware that land prices had increased to levels such that social housing could not pay for, the government implemented a special subsidy of up to US$ 8.200 per household in order to allow low income families (only those belonging to the first quintile of income) applying to housing subsidy to receive this additional contribution that would allow them to remain in the city of Santiago and not be expelled to the regional periphery, hopefully to remain in their municipality of residence. This policy instrument was applicable in its first version to cities of 30.000 inhabitants or more. A restriction that made sense since it is only in larger cities that land prices can condition the location of social housing to distances that hinder their accessibility to urban opportunities. Regulations of this subsidy establish that to be eligible, projects have to be located within maximum permitted distances to public transport, schools and health services. Furthermore, projects can have up to 150 houses and incorporate at least 60% of families residing in the same municipality. It can be applied for the acquisition of newly constructed or exiting houses.
Soon after its first version, the minimum city size where it could be applied was lowered from 30.000 down to 5.000 inhabitants. If the central concept was one of allowing accessibility to urban opportunities and services, then the minimum size could have been much higher, because in cities of 60.000 to 80.000, where most services are located around the city center, distance is not an important obstacle. The decrease in the size of cities eligible down to 5.000 has allowed its application where it was not really needed, as accessibility to existing services is not a problem in such small cities and also because land prices in such cases are low enough to allow for the location of subsidized housing without additional public help. The second modification in established conditions was its applicability to buy houses of the existing stock. While this policy decision has the advantage of allowing offsprings that live with their families and decide to live in a house of their own to remain in the vicinity of their family and social networks or at least in the same municipality, it misses the essence of the original formulation, which was to allow to buy land that had reached higher prices for new housing development. The consequence has been that used housing have increased their market prices up to the level of the subsidies available for such transactions.
While it constitutes an interesting concept, adjustments in regulations and implementation open doubts about its impact. Research results by Brain and others establish that “these changes distort to such extent its objectives that it ends up losing force and serving objectives that are different to the ones that justified its implementation”90. “The location subsidy shows a modest trend to improve location and allow families to locate in municipalities where they live, with higher land prices”. Almost all beneficiaries are able to continue to live in the municipality of residence. “In 2009 houses with and without location subsidy pay almost the same price. This means some market distortion, since those with location subsidy….should pay a quite higher amount than those without location subsidy”. “In the Metropolitan Region, projects of new housing with location subsidy locate in a significant number and majoritarily within Santiago”
90 Isabel Brain, Joaquín Prieto, Francisco Sabatini “Informe I Efectos del Subsidio Diferenciado a la Localización sobre la ubicación de la vivienda social y en los precios del suelo” PROURBANA, Centro de política Públicas UC y Observatorio Social U. Alberto Hurtado. Oct 2010.
110
Research results by N. Romero A. Beckman reach similar91 conclusions. Almost half of the location subsidies granted in the Metropolitan Region locate in municipalities out of Santiago. At the country level 38% of the subsidies granted locate in small cities and 40 in medium size cities.
Among the institutions that develop social housing are municipalities and NGOs. In these cases the motivation is to help houseless families to find a reasonable location. But traditional developers also participate in this activity, their action being driven by the profit motive. While legitimate and necessary, the logic of their action is of self interest. The consequence is that an unknown fraction of the location subsidy has not been reaching the houseless but land owners, meaning developers that operate in this market. The reasoning to develop a project in the context of this subsidy starts with an estimate of the budget available for each housing solution, then deducing well known construction costs, the rest to be distributed between land an profits, which is the same destinatary when developers have land reserves. The key variable then is location. Locations more distant from Santiago in small town will allow for higher gains. The profit motive constitutes therefore an important incentive for choosing more distant locations. It is otherwise difficult to understand why almost 50% of new houses with location subsidy locate outside of Santiago considering that the housing deficit in those municipalities is 10% of the total deficit in the metropolitan Region (2002)92.. Also, the explanation to the fact that the price of the housing solution is the same regardless of location, while the size of the lots and the size and quality of the house is the same.
From a policy perspective, it would be positive to maintain the location subsidy as it is a good instrument, that has helped many families to have access to reasonable locations, that have had the alternative to chose where to live under the constraints of the existing budget that provide the set of subsidies available.
Important reforms are needed. First, to establish specific areas where it can be applicable where it is really needed.
Second, to limit is application to new social housing constructions. The existing stock already exists and there is no new development, and therefore no location decision involved in it.
Third, to modify the formula that determines the amount of location subsidy that will be granted, as the existing one includes the fiscal assessment values of land, a figure that is not reliable as a reference of the price of land. The amount of subsidy should be established on the basis of market values of land and the densities of the projects that apply to it.
Fourth, to contemplate a more active role of the public sector through the provision of land complemented by public bidding of the construction of housing projects. The public sector has all 91 N. Romero y A. Beckman “Subsidio Diferenciado a la Localización en Proyectos de Construcción del Programa Fondo Solidario de Vivienda del Ministerio de Vivienda y Urbanismo – Chile” www.observatoriourbano.cl oct. 2010. 92 It is possible that the data of the residence of the beneficiaries have been altered, as is evident with regard to the income level of the applicants. The potential subsidies accruing to beneficiaries of the first quintile of income are almost twice than those that families belonging to the second quintile can attain. This explains the fact that applications to the programs directed to the first quintile are higher than the estimated figure of houseless in this bracket of income, and that applications for subsidy programs of the second quintile are very low.
111
the necessary prerogatives do so. The end product could have the advantage of locations more in accordance to public policy. But also the certainty that subsidies will fully reach the population to which it is aimed at.
Fifth, to have a closer control of the compliance of applicants with regard to minimum requirements.
b) Eliminate exclusionary land use planning regulations. A well know way to avoid the development of social housing is the establishment of regulations in terms of minimum lot size or maximum allowed densities of development to exclude social housing.
The stillborn initiative of president Bachelet to promulgate a law of social integration contemplated a regulatory reform establishing that the development of social housing could not be rejected in any urban space under the premises of urban planning norms and regulations, except for those that define environmental restrictions or risk areas. It was based on the ideological notion that it is of public responsibility to attain a more socially integrated urban scenario and that it is not reasonable to use public planning instruments to difficult the access of lower income households to land.
Dialogue with professional concerned on land and housing policy indicates that this is a central topic of concern on which the government should take action.
This is clearly an area of policy innovation that would enhance the possibilities of a better location of social housing and should therefore be contemplated in the battery of policy reform.
c) Regulatory requirement of including social housing in new developments
A second aspect of the law on social integration announced at the beginning of the government of president Bachelet established that any new housing development should include at least 5% of social housing. It also contemplated that any project could avoid developing social housing by compensating the municipality with a monetary contribution to the municipality equivalent to the value of 5% of land of the project, being the responsibility of the municipality to pool these resources and later on develop a social housing project in its territory.
Although a mild requirement according to international experience, the opposition to this initiative was very strong. So strong that even though it was elaborated with detail at the Ministry of Housing, it was never dispatched by the government to Congress. The main opposition came from the Chamber of Constructors. It was considered to be an unreasonable tax on housing, estimating that such a law would imply an increase of 1% in the final price of housing.
It is very likely that the reluctance to accept such a regulation is not based on the potential increase of the price of housing, nor on a xenophobic attitude towards the presence of lower income families, but on the adverse impact on housing and land prices that their presence might generate.
The experience indicates that it is quite acceptable when the location of new housing projects devoted to higher income families are developed in municipalities where lower income
112
households predominate as a consequence of the operation of the market. This has been the case in the last decade in Santiago as has been illustrated in another section of this report. In most such cases new developments isolate themselves under the scheme of gated communities.
From a broader perspective, a research report, based on a survey of opinion of the population of the three metropolitan areas existing in the country, oriented at determining the support of the public at large regarding the degree to which public regulations and direct public interventions would be acceptable and which ones should be left to the market, establishes, among other things, that 65% of the population, encompassing all socioeconomic strata, agree with the assertion that “there should be a law that obligates all municipalities to receive social housing”93.
The discussion above, regarding public policy of the city limit, reviewed the recent proposal to expand the limit which conditions newly incorporated land to devote 8% to social housing. As already mentioned, the proposal was formulated by the government of a socialist president and later on adopted with no fundamental modifications by the following government that identifies with a right wing liberal perspective. If it is legitimate and politically correct to condition new land development with regulations requiring the development of social housing in the case of newly incorporated land, and if it is also legitimate and politically correct to establish even more demanding requirements like in the case of PDUC, then ¿why would it not be also legitimate and politically correct to demand the compliance with regulations of the same nature by any housing project developed within the city limits?
¿Does the right to develop originate from a different source power and legitimacy when dealing with existing urban land than when dealing with newly created urban land?
Although it is unlikely that the existing government would take initiative in this direction, it would be very positive if it did so.
d) Incentive of higher densities against inclusionary quotas of social housing. F. Sabatini and other authors have published an alternative policy recommendation based on incentives, and therefore, on the market, based on the concepts and the experience of Chapter 40B of Massachusetts. “The proposal consists in modifying article 6.1.8 of the General Ordinance of Urbanism and constructions (OGUC)94 in such a way that projects that include at least 20% social housing (Fondo Solidario de Vivienda I) which are located in municipalities that are central, pericentral or with low concentration of popular strata (Less than 45% of its population pertaining to strata D and E) in the metropolitan areas of Santiago, Valparaiso and Concepcion, have the right to benefits of article 6.1.8 of the OGUC even if the projects have more than four floors, and that in any case, the increase in density to which they gain the right to,
93 Programa de apoyo a las políticas públicas urbanas y de suelo, Políticas Públicas UC- Lincoln Institute of Land Policy y Observatorio Social Universidad Alberto Hurtado “Preferencias de regulación urbana en Chile, Encuesta a residentes de las áreas metropolitanas de Santiago, Valparaíso y Concepción” 2006. 94 Special normative benefits accruing to projects of” vivienda económica”.
113
be of 50% in the case of those that have four floors or less”95. This means a proposal that grants an increase in the existing density in exchange for the inclusion of social housing.
Among other advantages, it is not a regulation but an incentive; it could effectively improve accessibility to better located urban land; it has been evaluated to be economically convenient for a developer; it constitutes a normative change that can be easily performed by a decree rather than by law; it does not distract public resources; it is less conflictive than the social housing quota regulation. Some of the difficulties recognized in the same proposal are: the possibility of a difficult coexistence among persons of different social strata; the possible adverse reaction of exiting higher income residents; possible difficulties in the velocity of sales of the higher priced houses; opposition by the municipalities that do not want to have additional low income neighbors; negative impact of higher density developments and the possible lack of interest by developers.
e) Strategic application of article 55 of the L.G.U.C.96 Article 55 of the LGUC97 allows for housing developments outside the city limits if the value of the houses to be constructed is below US$ 41.000 and they are eligible for housing subsidies. It requires the approval of the Ministry of Agriculture and that of the Ministry of Housing and Urbanism, establishing in each case the urbanization that has to be complied with.
This is an evident loophole that allows to bypass urban planning. It was extensively used by the Ministry of Housing in the late 60´and early 70´s as a way to have access to land with low prices98. It continues to be applied throughout the country to these days, mostly at the initiative of the private sector.
An additional policy instrument could be a selective and strategic application of article 55 in the space located immediately outside the city limit of Santiago. This space has been studied in detail by the Ministry of Housing in preparing the proposal to expand the city limit and it is very clear
95 Francisco Sabatini, Gonzalo Edwards y Gonzalo Cubillos, Isabel Brain, Pía Mora y Alejandra Rasse “Dispersión espacial de vivienda económica como vía de integración social urbana” Programa PROURBANA, Centro de Políticas Públicas UC. Nov. 2010. 96 Law on Urbanism and Constructions (Ley General de Urbanismo y Construcciones) 97 Artículo 55º.- Fuera de los límites urbanos establecidos en los Planes Reguladores no será permitido abrir calles, subdividir para formar poblaciones, ni levantar construcciones, salvo aquellas que fueren necesarias para la explotación agrícola del inmueble, o para las viviendas del propietario del mismo y sus trabajadores, o para la construcción de conjuntos habitacionales de viviendas sociales o de viviendas de hasta un valor de 1.000 unidades de fomento, que cuenten con los requisitos para obtener el subsidio del Estado. Corresponderá a la Secretaría Regional de la Vivienda y Urbanismo respectiva cautelar que las subdivisiones y construcciones en terrenos rurales, con fines ajenos a la agricultura, no originen nuevos núcleos urbanos al margen de la planificación urbana-regional. Con dicho objeto, cuando sea necesario subdividir y urbanizar terrenos rurales para complementar alguna actividad industrial con viviendas, dotar de equipamiento a algún sector rural, o habilitar un balneario o campamento turístico, o para la construcción de conjuntos habitacionales de viviendas sociales o de viviendas de hasta un valor de 1.000 unidades de fomento, que cuenten con los requisitos para obtener el subsidio del Estado, la autorización que otorgue la Secretaría Regional del Ministerio de Agricultura requerirá del informe previo favorable de la Secretaría Regional del Ministerio de la Vivienda y Urbanismo. Este informe señalará el grado de urbanización que deberá tener esa división predial, conforme a lo que establezca la Ordenanza General de Urbanismo y Construcciones. 98 A. Petermann, “¿Quién es responsable por el crecimiento de Santiago” in A. Galetovic “Santiago, ¡dónde estamos? Y ¿a dónde vamos?” Centro de Estudios Públicos 2006.
114
which are the areas that have different types of restrictions and those that have advantages of accessibility to urban services and opportunities.
The public authorities could use the regulatory prerogatives with which they are invested to take initiative and call for an open bidding process among the owners of land in a designated expansion area in order to apply article 55 to the highest bidder. The main criterion of adjudication being the highest quota of social housing to be developed in their properties. It could also include other amenities that contribute to a city of better quality that could be further elaborated. The notion of granting scoring points on such matters would constitute an interesting incentive to build a better city that would directly revert to land owners.
Include benefit of a % of houses with higher prices
Any proposal of application of article 55 would have to comply at least with the regulations established for PDUC, except for the minimum size It could be less than the 300 hectares required in the cases of PDUC allowing for land pooling in a context of relatively fractioned parcels of land. It would also be sound to require an explicit timing of development in order to guarantee the flow of land to the market and avoid speculative retention.
Each owner of land would be free to respond to this public initiative. In as much as it constitutes an open bidding process, the owners of land could make all the necessary economic calculations to determine the maximum they would be willing to pay, much in the same way such calculations are done in the normal operation of the land market. If there is a real completion, much of the benefits of the rural to urban conversion multiplier would be in a sense transferred to the city in terms of a contribution to the solution of the problem of access of lower income families to well located and fully urbanized land. Contributing also to a socially integrated pattern of development and contributing also to overcome the excessive concentration of social housing in specific points in space.
It is an incentive mechanism and not a regulation. Allows for a free and transparent market operation and does not require the use of any public resources.
f) Recuperation of a fraction of land value increments. Land prices in Santiago have been rising for a long period of time and it can be expected that it will continue in rising trend as a consequence of the increase in population and the rate of growth of households which is more than twice as high. But most important, because of the expected continuation of the rapid economic growth of the country and particularly of Santiago, and the consequent increase in the income of the population.
Let it simply be mentioned that the computation of land price increases in Santiago according to data of asking prices and the flow of land to the market according to newspaper adds since 1982 indicates an impressive increase of land prices in this 28 years. This is not a price index, but still constitutes relevant information. The average price of land supplied to the market at the end of 1982 and the begging of 1983 was US$ 20,5 and at present, in the first quarters of 2010 it reached US$ 300, as can be seen in the figure below.
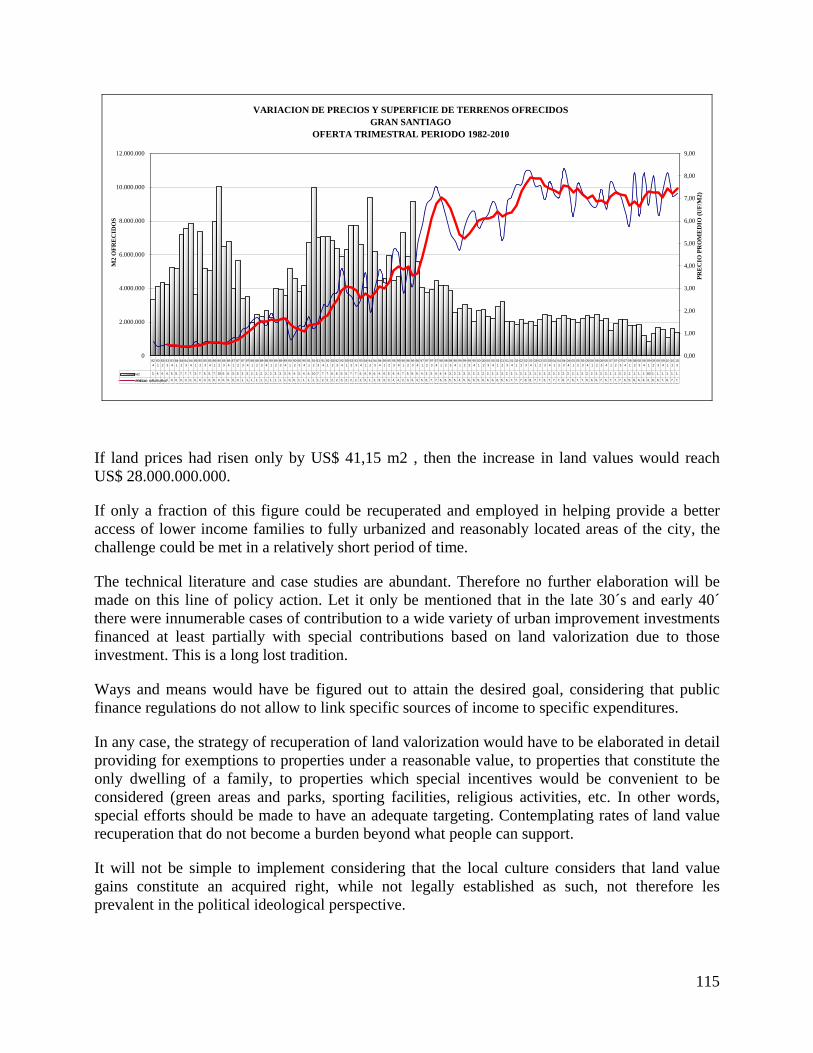
115
VARIACION DE PRECIOS Y SUPERFICIE DE TERRENOS OFRECIDOS GRAN SANTIAGO
OFERTA TRIMESTRAL PERIODO 1982-2010
0
2.000.000
4.000.000
6.000.000
8.000.000
10.000.000
12.000.000
M2
OFR
EC
IDO
S
0,00
1,00
2,00
3,00
4,00
5,00
6,00
7,00
8,00
9,00
PRE
CIO
PR
OM
ED
IO (U
F/M
2)
M2 3.32
4.11
4.34
4.25
5.21
5.15
7.16
7.55
7.86
3.62
7.34
5.16
5.04
7.94
100
6.45
6.78
3.99
5.62
3.42
3.50
2.00
2.44
2.33
2.71
2.28
3.97
3.92
3.58
5.15
4.60
3.78
4.15
6.73
100
7.04
7.05
7.09
6.81
6.34
5.86
6.27
7.75
7.70
6.59
4.06
9.40
6.19
4.44
4.58
5.94
4.49
4.70
7.32
5.87
9.17
5.59
4.02
3.75
3.92
4.49
4.17
4.15
3.88
2.56
2.81
3.06
2.80
2.05
2.66
2.75
2.30
2.19
2.90
3.19
2.01
2.02
1.87
2.17
1.88
2.03
1.80
2.16
2.44
2.41
2.05
2.22
2.36
2.20
2.16
1.98
2.22
2.37
2.25
2.44
2.06
2.22
1.52
1.90
2.16
2.12
1.81
1.77
1.84
1.20
834
1.33
1.67
1.54
1.11
1.61
1.39
PRECIO 0,64
0,42
0,45
0,49
0,40
0,42
0,39
0,39
0,39
0,64
0,49
0,64
0,63
0,53
0,53
0,56
0,66
0,81
0,82
1,18
1,26
1,58
1,69
1,53
1,35
1,90
1,50
1,64
1,63
0,74
0,95
1,34
1,30
1,73
1,20
1,55
2,26
2,20
2,74
2,83
3,88
2,84
2,62
2,20
2,55
3,69
1,94
2,93
3,86
3,26
3,26
4,75
4,54
2,80
3,87
3,07
4,89
5,83
6,75
7,01
7,53
6,89
6,29
5,46
5,08
4,69
5,69
6,27
6,40
5,69
6,01
6,31
6,87
6,42
5,14
6,86
7,07
7,62
7,62
8,22
8,20
7,54
7,58
6,94
7,74
7,18
7,06
8,33
7,53
6,19
7,65
7,27
6,96
6,62
6,62
7,41
6,52
7,73
7,35
7,12
6,39
5,81
8,15
6,22
8,17
6,68
8,04
6,24
7,26
8,16
7,14
7,21
82-4
83-1
83-2
83-3
83-4
84-1
84-2
84-3
84-4
85-1
85-2
85-3
85-4
86-1
86-2
86-3
86-4
87-1
87-2
87-3
87-4
88-1
88-2
88-3
88-4
89-1
89-2
89-3
89-4
90-1
90-2
90-3
90-4
91-1
91-2
91-3
91-4
92-1
92-2
92-3
92-4
93-1
93-2
93-3
93-4
94-1
94-2
94-3
94-4
95-1
95-2
95-3
95-4
96-1
96-2
96-3
96-4
97-1
97-2
97-3
97-4
98-1
98-2
98-3
98-4
99-1
99-2
99-3
99-4
00-1
00-2
00-3
00-4
01-1
01-2
01-3
01-4
02-1
02-2
02-3
02-4
03-1
03-2
03-3
03-4
04-1
04-2
04-3
04-4
05-1
05-2
05-3
05-4
06-1
06-2
06-3
06-4
07-1
07-2
07-3
07-4
08-1
08-2
08-3
08-4
09-1
09-2
09-3
09-4
10-1
10-2
10-3
PRECIO : MEDIA MOVIL
If land prices had risen only by US$ 41,15 m2 , then the increase in land values would reach US$ 28.000.000.000.
If only a fraction of this figure could be recuperated and employed in helping provide a better access of lower income families to fully urbanized and reasonably located areas of the city, the challenge could be met in a relatively short period of time.
The technical literature and case studies are abundant. Therefore no further elaboration will be made on this line of policy action. Let it only be mentioned that in the late 30´s and early 40´ there were innumerable cases of contribution to a wide variety of urban improvement investments financed at least partially with special contributions based on land valorization due to those investment. This is a long lost tradition.
Ways and means would have be figured out to attain the desired goal, considering that public finance regulations do not allow to link specific sources of income to specific expenditures.
In any case, the strategy of recuperation of land valorization would have to be elaborated in detail providing for exemptions to properties under a reasonable value, to properties that constitute the only dwelling of a family, to properties which special incentives would be convenient to be considered (green areas and parks, sporting facilities, religious activities, etc. In other words, special efforts should be made to have an adequate targeting. Contemplating rates of land value recuperation that do not become a burden beyond what people can support.
It will not be simple to implement considering that the local culture considers that land value gains constitute an acquired right, while not legally established as such, not therefore les prevalent in the political ideological perspective.
116
Such a policy decision could become very unpopular unless the necessary support is attained with much anticipation and desired destination of the resources is made clear to the public. As the case of Colombia demonstrates, people are willing to make contributions of this nature provided there exist some minimal guarantee that the resources will not feed the public bureaucracy, but concrete urban improvements.
g) Final remarks Any policy change in urban policy and particularly in urban land policy will generate a debate as it will inevitably hurt the interests of some and benefit that of others.
One very basic missing link is the absence of an urban policy that could show a long range view of the road to be traveled and an institutional setting that allows to provide the necessary leadership. Another substantive missing element is the absence of a link between the housing policy and the urban policy, a goal which is particularly difficult to attain when there is no urban policy and the housing policy is considered by many critics as not much more than a housing finance policy.
Another contextual variable which can not be eluded is the very bad distribution of income that prevails in Chile and also in Santiago. Public action to solve the housing needs of the lowest income groups considering the relevance of location, that is, of the urban context of any solutions will inevitably continue to be a public challenge, unless some radical changes take place with regard to basic economic structures that are very difficult to remove as they are rooted in inveterated practices and social relations.
The solution to these changes will not come as the result of the free play of the market. The deep nature of the urban question is in essence of public concern. Unfortunately the concept of the city has not penetrated in the area of concern of the political world, that reacts sporadically to diverse critical circumstances according to the urgencies of the moment. Political parties, as the source of ideological elaboration have historically declined their duty with regard to cities and urban development.
In immense challenge lays ahead, but also a world full of possibilities and hopes.